Abstract
The production quality of medical fluid bags is closely related to patient health. In this paper, we used medical fluid bags to detect whether they contained foreign bodies. A visual acquisition system for the fluid bag was built. Vignetting correction was performed on the acquired images, and a foreign body recognition detection method based on an improved Faster R-CNN model was proposed. The feature extraction network of Faster R-CNN was discussed and studied regarding the characteristics of small foreign objects in liquid bags, and the ResNet152 network replaced the VGG16 network; furthermore, the feature fusion and attention mechanism were added to the feature extraction, and CIoU replaced the IoU loss function; the anchor box parameters were optimized and improved using the K-means clustering algorithm, and ROI Align replaced the ROI Pooling module. The improved network in this paper was compared with the Faster R-CNN model, which is a modification of feature extraction networks, such as ResNet50, ResNet101, and ResNet152, and the original VGG16 feature extraction network. The results show that the ResNet152 network had the best feature extraction effect among the feature extraction networks, and other optimizations were performed in this paper based on the use of ResNet152. In the precision−recall curve, the network in this paper showed the best effect. The improved algorithm presented in this paper was significantly improved compared with the original algorithm, with a detection accuracy of 97% and an average accuracy improvement of 7.8% in foreign object recognition.
1. Introduction
As the main component of an infusion set, the fluid bag is an essential medical resource, and its production quality indirectly affects patient health. Because of the influence of the production process, issues such as missing pipelines and foreign bodies in the fluid bag cannot be completely avoided. For these two problems, most industrial production relies on manual visual inspection, which is susceptible to subjectivity and visual fatigue. This can result in misdetection and the leakage of fluid bags. To address the issue of missing pipelines, researchers have combined machine-vision technology to detect the absence of pipelines in fluid bags [1,2].
With the rapid development of computer vision, the use of visual inspection instead of traditional, manual quality inspection has become mainstream. Here, to address the detection of foreign bodies in liquid bags, an optimized target detection algorithm is proposed that combines deep-learning techniques.
Most medical infusion bags and bottles used for medical purposes are transparent, which allows for visual inspection in order to observe the amount of fluid usage. However, the visual detection of transparent liquid bags or infusion bottles requires high-quality light sources. In the referenced literature [3], the filling volume of infusion bottles was detected using machine vision. Another study [4] analyzed the necessity of a fully automated medical foreign body vision inspection robot, discussed the challenges encountered during the development of vision inspection, and emphasized the importance of medical foreign body vision inspection. The researchers in [5] focused on detecting the overlapping number of infusion bags. They achieved better results when introducing convolutional neural networks, as identifying the position of the bags was difficult due to their transparency as they were made of plastic.
Deep-learning techniques are widely used in image classification, defect detection, target tracking, etc. The target identification and classification task of deep-learning techniques is one of the essential tasks of machine vision. This liquid bag foreign body defect detection presented in this paper can be regarded as target identification detection. Machine vision technology, along with the continuous progress of computer hardware and deep learning algorithms, has become the mainstream detection algorithm because of its simple and efficient network structure, higher detection accuracy, and faster detection speed than traditional algorithms. YOLO, SSD, and Faster R-CNN are among the most common target detection network models. In this paper, the foreign bodies in the liquid bag are considered small targets, which are difficult to detect. Faster R-CNN is a network with a recognized high detection accuracy. Therefore, in this paper, a Faster R-CNN network is introduced for the detection of foreign bodies in liquid bags by analyzing each functional module of the network and improving it.
The R-CNN network has continuously been optimized by researchers [6,7,8]; finally, the Faster R-CNN network was born. It is the only R-CNN network structure with an end-to-end training capability, and it is also the fastest and most accurate network structure for detection. Faster R-CNN networks are widely used in both industry and agriculture; in industry defect detection, the authors of [9] used the Faster R-CNN network to achieve the automatic detection of welding defects, and the data enhancement was studied and analyzed for radiographic imaging by comparing ResNet and Inception-ResNet V2 with Faster R- CNN feature extractors; finally, ResNet was found to perform best. The authors of [10] aimed to identify the characteristics of image defects in the transmission line key components. They used Incep-tion-ResNet-V2 as a pre-training network for the feature extraction of Faster R-CNN. Through the network optimization and parameter adjustment of the pre-training network, the recognition accuracy of small targets for the transmission line faults was significantly improved, reaching 98.65%. In the literature [11], an improved faster region-based convolutional neural network (faster RCNN) algorithm was proposed for connector weld joint defect detection by integrating cluster-generated anchor boxes and migration learning with ResNet-101. The detection accuracy met the industrial requirements. In the literature [12], for fabric defect detection with textures in complex backgrounds, to solve the problem of texture interference, the Gabor kernel was embedded into the Faster R-CNN by taking advantage of the Gabor filter in the frequency analysis, and a two-stage training method based on a genetic algorithm and backpropagation was designed to train the new model. The model outperformed the traditional Faster R-CNN model in terms of accuracy. For crop recognition in agriculture, the authors of [13] proposed an automatic detection method for hydroponic lettuce seedlings based on an improved Faster R-CNN framework to improve the efficiency of the process of sorting seedlings for hydroponic lettuce. They used a high-resolution network (HRNet) as the backbone network for image feature extraction and used focal loss instead of standard cross-entropy as the classification loss in the RPN stage and were able to obtain a better detection accuracy. In the literature [14], a Faster R-CNN (MF3 RCNN) model with multi-feature fusion was proposed for soybean leaf diseases in complex scenes by blending multiple features by connecting different layers in the feature extraction network. The model outperformed other models tested on actual image datasets.
Small target detection is one of the difficulties faced when dealing with target detection. Reference [15] optimized the Faster R-CNN based on Faster R-CNN for small target detection, which effectively improved the loss function of IoU, as well as the ROI Pooling operation to enhance the localization bias problem and the network performance. In [16], for small and occluded objects, a cross-layer fusion multi-target detection and recognition algorithm based on Faster R-CNN was proposed and combined with the weighted balanced multi-class cross-entropy loss function and Soft-NMS to control the imbalance between complex and easy samples. The network improved the recognition rate.
2. Construction and Pre-Processing of Liquid Bag Foreign Body Dataset
In this paper, we make the liquid bag of the bag infusion device as our research object. To achieve the intelligent detection of liquid bag foreign bodies, we propose a method that utilizes an improved Faster R-CNN network for detection.
The process began with data acquisition and the image pre-processing of the liquid bag. The Faster R-CNN network was then employed to train the liquid bag foreign body dataset. We optimize the traditional Faster R-CNN network in several ways. Firstly, the K-means algorithm was utilized to re-cluster the Anchor box, obtaining Anchor box parameters that were suitable for the dataset used in this paper. Secondly, we replaced the original feature extraction network with ResNet152 to enhance the network feature extraction capability. Additionally, we introduced the CBAM attention mechanism to improve the model’s learning ability for foreign objects. Furthermore, we replaced the IOU loss function with the CIOU loss function to expedite the convergence of the model. Finally, we employed ROI Align as a replacement for the ROI Pooling module.
In this paper, a visual detection platform was built for the detection of liquid bag foreign bodies, and vignetting correction was performed on the captured images; a dataset is created, and a modified Faster R-CNN network was used for training and prediction. The specific process is shown in Figure 1 below.
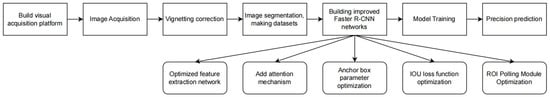
Figure 1.
Overall flow chart.
2.1. Image Acquisition
To achieve the fast detection of the liquid bag foreign body, the acquisition principle of this paper was shown in Figure 2; due to the transparent characteristics of the liquid bag, the effect of vertical light on it was not good; to obtain a clear image, take the white backlight lighting method. The specific practical steps were as follows: robot 1 would transfer the liquid bag on the conveyor belt to mobile light source transfer platform 2 when the portable light source transfer platform moved to stop under camera 3 to take pictures using the camera at this time. After taking pictures, robot 4 would transfer the liquid bag away, and the mobile light source transfer platform would return to its initial position, that is, to complete the collection work.
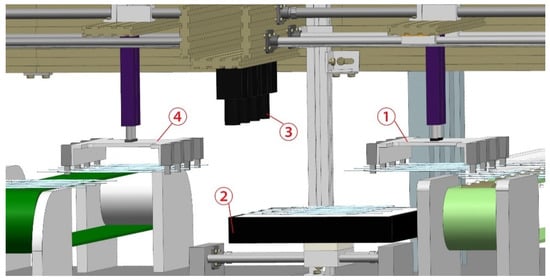
Figure 2.
Liquid bag foreign body collection schematic. ① Robot 1. ② Transfer platform. ③ Camera. ④ Robot 2.
2.2. Image Pre-Processing
Before creating the data, the images should be pre-processed according to the actual situation of the image capture. High-quality and clear images are better for the subsequent detection work.
2.2.1. Image Vignetting Correction
The image vignetting phenomenon would occur when the object imaging point was farther away from the optical axis. The reason was that when the CCD and CMOS detector plane detected beam illumination due to uneven filtering, lens distortion, optical axis offset, and other factors, resulting in an irregular darker pointed image farther away from the optical axis. This was the brightness of the image from the optical center to the edge of the direction of sequential reduction.
This vignetting phenomenon was more prominent in vision systems with large fields of view, and the liquid bag foreign body detection image in this paper suffered from severe vignetting, as shown in Figure 3.
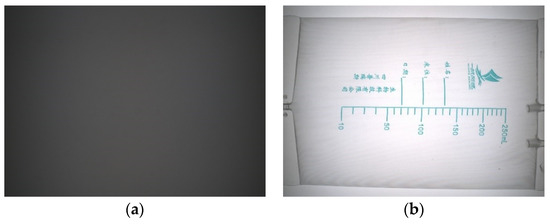
Figure 3.
(a) Light source vignetting image; (b) liquid bag vignetting image.
Vignetting is generally classified into mechanical vignetting, optical vignetting, natural vignetting, and pixel vignetting, and vignetting correction methods are generally based on the “flat field correction” theory. The theory considered that the real image with a vignetting effect was composed of an image V containing the attenuation factor of each pixel and an ideal image with a uniform color plane, as expressed by Equation (1).
where (i,j) denotes the pixel’s position in the image, is the real detected pixel value, and V is the camera lens system attenuation factor. is the ideal image in a uniform color plane. Theoretically, the camera and lens system were selected, and the attenuation factor can be determined.
The vignetting correction methods based on the above theory included the look-up table method (LUT) and the function fitting method, which used the reference image of the camera lens system to be corrected under uniform illumination, and then obtained a vignetting correction factor for each pixel point in the system based on the reference image to form a vignetting correction factor table. The function fitting method was based on the LUT method, which simulated the vignetting surface of the camera lens system using the pixel position coordinates and the corresponding vignetting correction factors, then used different model functions to approximate the surface, and finally realized a function to replace the correction factor table to save storage space.
Detecting liquid bag foreign bodies requires a faster speed, so this paper used the LUT vignetting correction method. The LUT method requires a uniform light source to acquire the reference image; the general standard method to acquire uniform light is to use the integrating sphere, but the cost is high, and the general work scenario is difficult to achieve. In this paper, we propose a straightforward method for uniform sampling using a white light source as a luminescent instrument.
The specific process is as follows: the white light source was placed on a platform that can be rotated, the camera was placed near the center of rotation of the light source, and the brightness of the light source was controlled by adjusting the light source controller. The brightness was controlled at the time when the brightest spot in the center of the image was the smallest. The light source was allowed to rotate in steps of 3.6°. The images were acquired once per rotation. A total of 100 images were acquired and converted to the HSV format. The V channels of the 100 images were summed. Then, the average value was obtained, and the reference image under uniform illumination was replaced by the method of averaging multiple images. Next, the maximum value of the reference image, , was obtained, and each pixel value of the reference image was used to divide by the maximum value to finally obtain our vignetting correction factor, as follows:
where is the vignetting correction factor at pixel point (i,j), is the value of the largest pixel value in the reference image, and is the pixel value of the reference image at the pixel point (i,j). The specific correction steps were as follows:
Firstly, we acquired 100 images with uniform light intensity and added and averaged the V channels of 100 images to obtain our luminance reference image. Then, we found the maximum value of the reference image and divided the reference image by the maximum value to obtain our correction factor matrix. When the image was corrected, the V channel was separated using the HSV image to be corrected and divided by the correction factor image to obtain the corrected V channel image; the corrected color image was obtained by re-merging it with the H and S channels to form the HSV image again and converting it to the BGR channel. The V channel vignetting correction formula is as follows.
f(x,y) and g(x,y) are the V-channel grayscale values at point (x,y) before and after vignetting correction, respectively, and V(x,y) is the vignetting correction factor matrix. The results of vignetting correction are shown in Figure 4.
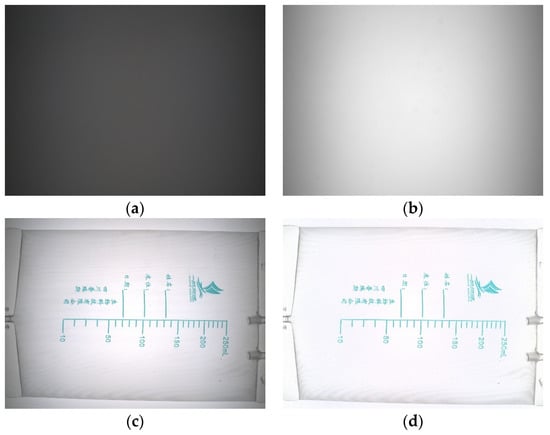
Figure 4.
Vignetting calibration process: (a) Luminance reference image. (b) Correction factor image. (c) Original vignetting image. (d) Vignetting correction image for this paper.
2.2.2. Constructing the Dataset
The volume of the foreign body in the liquid bag was very tiny compared to the whole liquid bag. The Faster R-CNN network would change the size of the incoming image, and the input size would be much smaller than the original image of 4080 pixels × 2900 pixels. If the original size was incoming and then reduced, it would lead to the difficulty of extracting the foreign body in the subsequent feature extraction, affecting the subsequent detection and recognition.
Therefore, this paper adopted the method of dividing the original image. The original image was divided according to the size of 300 pixels × 300 pixels; the horizontal and vertical adjacent images have 48-pixel and 40-pixel overlaps, respectively, and the overlap size was larger than the size of the foreign bodies, to ensure that all foreign bodies were included in the segmentation and avoided the problem of incomplete extraction when dividing the edges due to foreign bodies.
This paper finally collected 4000 images of a liquid bag foreign body, as shown in Figure 5. The liquid bag foreign body dataset was divided according to the ratio of the training set: test set: validation set as 8:1:1, i.e., 3200 images in the training set, 400 images in the test set, and 400 images in the validation set.
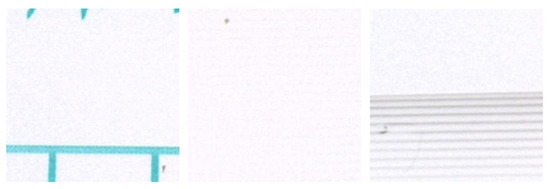
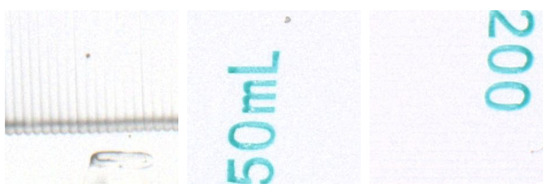
Figure 5.
Liquid bag foreign body data set.
3. Improved Faster R-CNN Network Construction and Optimization
3.1. Faster R-CNN Networks
The Faster R-CNN network can be roughly divided into four parts: the first part was used to size and preprocess the original image, input it into the backbone for feature extraction, and finally obtain the shared feature map. The second part was the candidate frame generation. The network used the RPN network to generate the candidate frames and map them onto the feature map to obtain feature matrixes of different sizes. The third part was to scale the feature matrices with different sizes, which was performed via ROI Pooling. The fourth part was spreading and processing all the processed feature maps and then predicting the target class and target bounding box with the fully connected layer.
After analysis, the original network had certain problems with the detection of tiny foreign bodies, which were as follows: the feature extraction network of the network had only 16 layers, the extracted target features were not enough, and only the feature map of the last layer was used; the loss function of the localization frame of the network was not expressed enough, which cannot show the gap between the prediction frame and the real frame well; the generation of the a priori frame of the network was set according to experience, which did not apply to the detection of tiny foreign bodies; the size processing of the network before the fully connected layer led to the loss of information due to the rounding process, which greatly affected the detection of tiny foreign bodies in this paper.
Therefore, the feature extraction, IoU loss function, anchor box parameters, and ROI Pooling layer of the original network were optimized and improved for the above problems, and the feature fusion module and attention mechanism were added.
3.2. Faster R-CNN Network with Improved Feature Extraction
The most commonly used network for Faster R-CNN in feature extraction is VGG16, which had 16 convolutional layers. Regarding feature extraction network theory, the more convolutional layers, the more accurate the features learned by the network and the better the training effect. However, after subsequent experiments, it was found that the performance of the simply connected convolutional network did not keep increasing with the number of convolutional layers but decreased instead. After subsequent analysis, it was recognized that the increase in the convolutional layers might lead to gradient disappearance and gradient explosion and generate too much information or loss due to the presence of nonlinear activation layers, causing network degradation. Therefore, the residual network was born, in which the residual module effectively solved the above problems. The output of the residual network can be understood as the sum of the convolutional output matrix and the original matrix. The network learned the differences between the network output matrix and the network input matrix when training and learning, compared with the previous network directly to learn the original features of the image; it was easier to learn through the residual network. The deep-level ResNet network had two residual structures, as shown in Figure 6.
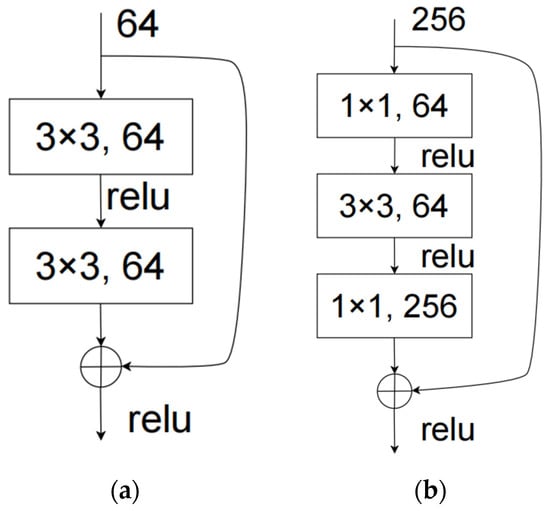
Figure 6.
Two different residual structures. (a) Residual structure for shallow layers. (b) Residual structure for deep layers.
ResNet networks can be used to reduce the difficulty of training complex networks by means of short connections. Additionally, at the same time, more accurate features can be extracted because a deeper network structure can be used. In this paper, the ResNet network was used instead of the VGG16 network, and through the training effects of ResNet50, ResNet101, and ResNet152, ResNet152 was finally selected as the feature extraction network in this paper. The ResNet152 network structure was shown in Table 1. The complete ResNet152 network was mainly used for the classification task of images, and only the feature extraction part of the ResNet152 network was used in this paper. Four layers of Conv2_x, Conv3_x, Conv4_x, and Conv5_x were used instead of the feature extraction part of VGG16 of Faster R-CNN.

Table 1.
ResNet152 network structure table.
3.3. Faster R-CNN Networks with Feature Fusion and Attention Mechanism
In Faster R-CNN, during the network training process, the image features extraction directly affected the training effect. The different levels of feature layers extracted have certain differences during feature extraction. Generally speaking, low-level feature layers have higher resolution and less semantic information, while high-level feature layers have more semantic information and lower resolution. The original Faster R-CNN network directly used the feature image of the last layer of the feature extraction network, which has low resolution and more semantic information due to the high number of feature layers, and it was less effective for detecting tiny foreign bodies.
In this paper, we added the FPN network module after the shared feature layer to change the original prediction mechanism only at the last layer for predictions at different feature layers. We let the high-level feature layer perform double upsampling and then fused the features with the low-level feature layer, which meant that the low-level feature layer also had more semantic information.
The FPN network module was added after the ResNet152 feature extraction network, and the four layers of Conv2_x, Conv3_x, Conv4_x, and Conv5_x of the ResNet152 network were fused with features. The network structure diagram after adding FPN is shown in Figure 7.
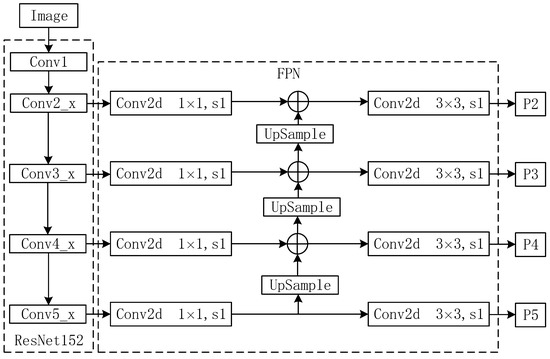
Figure 7.
Feature extraction network plus feature fusion network.
After improving the feature extraction network and feature fusion, the feature layers involved in the subsequent prediction all possess more semantic information. However, we preferred the network to focus on the features of foreign bodies rather than containing all the feature information. As shown in Figure 8, the acquired images, in addition to the foreign bodies, can also see the surface characters or local characters of the liquid bags (red boxes), which have a similar shape to the foreign objects. Still, the color was very different from the foreign bodies. Therefore, the network needed to focus on the channel features of the image and concentrate the network attention on the foreign body rather than the characters. Some hot joints (green boxes) will be produced during the manufacturing process of liquid bags. To avoid recognizing the hot joint as a foreign object, we let the network focus on the size characteristics of the image instead of the large hot joint, based on the property that the foreign object was smaller than the hot joint.
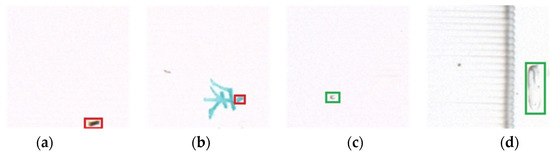
Figure 8.
Foreign body similarity characteristics map: (a) foreign body 1; (b) background of a liquid pocket similar to foreign body 1; (c) foreign body 2; (d) hot joint of a liquid pocket similar to foreign body 2.
In this paper, the CBAM attention mechanism module was added after the feature fusion module to allow the output of the whole shared feature layer to be more focused on foreign bodies. The CBAM module was a combination of the channel attention module and the spatial attention module. The channel attention mechanism used global average pooling and global maximum pooling parallel channel dimensions for the feature layer and then summed them up after shared full-connected processing and was processed by the sigmoid function into the weights of each channel, which is multiplied back to the feature input layer to complete the attention to the feature layer channels. Spatial attention, on the other hand, compressed the channels by stacking the maximum and average values in the channel direction, respectively, to compress the number of channels, and then by convolution to call back the number of channels, and finally multiplying it by the feature layer that has just completed the channel attention mechanism. The two models are processed in tandem in the network, completing the whole CBAM. The way the two attention modules were combined in the whole network is shown in Figure 9.
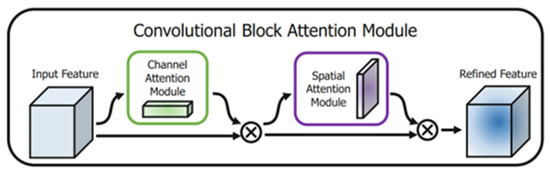
Figure 9.
CBAM module.
3.4. Faster R-CNN Networks with Improved IoU Loss Function
The IoU function was often used in Faster R-CNN networks to discriminate the degree of overlap of two rectangular boxes, which in turn enabled the delineation of positive and negative boxes in the RPN module. It can also be used as a loss function for bounding box regression. The method calculating the degree of overlap of rectangular boxes A and B is shown in Equation (4).
IoU is the ratio of the intersection and the union of two rectangular boxes with scale invariance. The result is a non-negative value in the range of 0 to 1. The larger the value, the higher the degree of overlap of the two boxes and the more accurate the model prediction. However, the IoU function cannot accurately reflect the degree of overlap of the two rectangular boxes; at the same time, it cannot correctly reflect the distance between them when the rectangular boxes A and B do not overlap. As shown in Figure 10, the IoU for all three rectangular box overlap cases are equal. Still, their overlap was different, and the regression effect decreased in order.
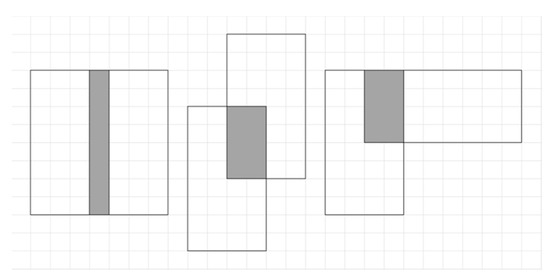
Figure 10.
Different degrees of IoU overlap.
To address the case where IoU cannot express the distance between two rectangular boxes, Rezatofighi [17] et al. proposed the GIoU approach where they used the area C of the outer rectangle of two rectangular boxes to characterize the distance of the boxes, as shown in Equation (5).
As seen from the above equation, when the rectangular boxes A and B do not intersect, the farther the distance between the two boxes, the greater the C, and the closer the GIoU is to −1. When the two boxes completely overlap, the GIoU is added to the IoU based on the term 0. Currently, the GIoU and IoU are equal to 1, so the GIoU takes the value of (−1,1). When the two boxes completely overlap or are in an inclusion relationship, the formula of GIoU agrees with IoU, and again the situation that the relative positions of the two boxes cannot be calculated like IoU occurs. GIoU cannot react to the loss function when the overlapping regions are the same, but the directions and distances are different. In this regard, Zheng et al. [18] proposed the DIoU method, as shown in Equation (6).
Because the DIoU method considers the degree of overlap between the target and the prediction frame, the distance between the frames, and the scale information, it makes the target frame more stable when performing the regression operation, which is more consistent with the mechanism of target frame regression than GIoU. However, DIoU also has some limitations in that it does not consider the important factor of aspect ratio, so Zheng et al. [18] also proposed the CIoU method at the same time, as shown in Equation (7).
CIoU considers the overlap area, centroid distance, and aspect ratio and introduces focal loss to solve the sample imbalance problem during box regression. Finally, this paper uses the CIoU function instead of the IoU function in the original Faster R-CNN network to increase the convergence speed and detection accuracy of network training.
3.5. Faster R-CNN Networks with Improved Anchor Box Parameters
When the Faster R-CNN network performs the target recognition task, the network needs to produce candidate boxes on the image first. The tool for the Faster R-CNN network to generate candidate boxes is the RPN network, which generates candidate boxes of various sizes with the template of the anchor box, and all candidate boxes are obtained using RPN convolution, with the center point as the base point of the candidate box, and then calculated with the aspect ratio size and size provided by the anchor box.
Usually, the anchor box parameters of Faster R-CNN are obtained empirically and contain three sizes and ratios, which are sizes of 128 × 128, 256 × 256, and 512 × 512, and ratios of 1:1, 1:2, and 2:1, corresponding to one centroid which can generate nine different anchor boxes at the same time. The candidate frames generated by the conventional parameters are all much larger than the size of the foreign bodies studied in this paper, resulting in a large proportion of background pixels in the candidate frames, which can adversely affect the accuracy of the loss function and the network. The size of the anchor box is set to be similar to the size of the foreign body in this paper, which will increase the proportion of foreign pixels in the candidate box and make the target feature extraction more effective. At the same time, it can play the role of balancing the positive and negative samples, thus improving the training speed and recognition rate of the network.
In this paper, we use the K-means clustering algorithm to cluster the target boxes of the liquid bag foreign body dataset and reset the size of the anchor box according to the clustering results to achieve the effect of improving the detection performance of the network, accelerating the convergence speed of training and the detection speed. While the K-means clustering algorithm has the Euclidean distance calculation between the sample and the cluster center, this calculation is not able to measure the degree of overlap between the two rectangular boxes; this paper uses 1-IoU to replace the original Euclidean distance, as shown in Equation (8).
where denotes the distance from the target box to the cluster center box, and can be understood as the degree of overlap between the target box and the cluster center box, which is calculated as the ratio of the intersection of two comparison boxes to the concatenation, so the value is a number between 0 and 1, and the closer the two boxes are, the closer the similarity value tends to 1. When the K-means algorithm measures the object similarity, the similarity is inversely proportional to the distance between the objects, i.e., the higher the similarity, the closer the distance, so it is converted using 1-IoU. For box clustering, an evaluation criterion is also needed to determine the clustering result. The IoU used above can indicate the degree of overlap between two boxes, so the larger the IoU between the rectangular boxes divided into the same class, the better the clustering result. In this paper, we use the index of average IoU to evaluate, and the function expression is shown in Equation (9).
where the larger value of q indicates the better clustering effect and the max term indicates the maximum value of the set of IoU values of all m annotation boxes compared with the generated k anchor boxes. According to the principle of the above algorithm, the steps of this paper for anchor box clustering using K-means for the dimensions of all foreign body annotation boxes are as follows:
(1) Read all the annotation files from the dataset and obtain the width and height of the annotation frame of the foreign body.
(2) Assign k random annotation boxes from the read annotation boxes as the initial centers of the clusters.
(3) Calculate the distance from the annotation box to each cluster center box and assign it to the cluster with the minimum distance from the cluster center.
(4) Based on the newly generated clusters, calculate the new cluster centers using the median calculation method.
(5) Repeat steps 3 to step 4 until the new cluster center calculated in step 4 no longer changes, thus obtaining the final anchor box.
(6) Calculate the IoU values of all the boxes and all the boxes in the final anchor box, select the highest value and add them together, and, finally, divide them by the number of boxes to obtain the average IoU value when clustering into k classes.
The parameters for generating nine anchor boxes are used in the original network. In this paper, we select k in the range of 2 to 10 for clustering and obtain nine different groups of anchor boxes, and their corresponding values of the average IoU are shown in Figure 11.
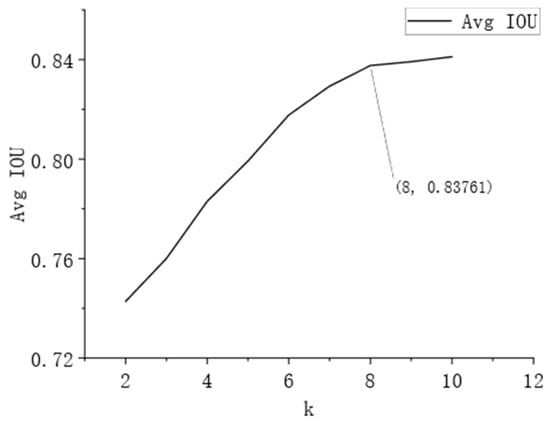
Figure 11.
Average IoU at different k values.
From the above figure, it can be seen that the average IoU value gradually increases with the increase in the classification number k value, and the growth of IoU changes faster when k takes the value range of 2 to 8; the growth of IoU is slower when k takes the value of 9 and 10. Considering the calculation volume of the model as well as the accuracy, the eight anchor boxes generated at k = 8 were finally selected so that k = 8 was classified by multiple k-means for the labeled boxes. The sets of anchor box sizes (width, height) with the largest average IoU were selected as (9,9), (12,10), (13,15), (18,13), (13,25), (19,19), (25,20), and (58,47).
3.6. Improving Faster R-CNN Networks with ROI Pooling Module
After adding the improved shared feature layer, the network is passed into the RPN network to generate candidate frames, combined with the shared feature layer to obtain the feature images mapped to the feature layer after filtering the candidate frames. Since the candidate frames generated by the RPN network are of different sizes to accommodate different targets, the final feature images are also different, but the last fully connected layer of the network requires input feature images of the same size. The ROI Pooling layer effectively solves this problem by dividing the mapped regions of different sizes into equally sized sections, finally performing the maximum pooling operation on each section and obtaining the same-sized output from the ROI regions of different sizes. The ROI Pooling process is illustrated in Figure 12.
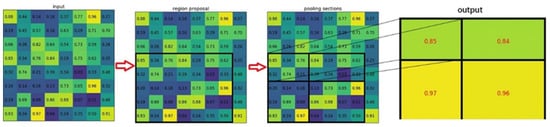
Figure 12.
Schematic diagram of ROI Pooling process.
During the execution of ROI Pooling, the position coordinates may appear as floating point numbers when the candidate boxes are mapped to the feature map, and the segmentation boundary positions may also appear as floating point numbers when the ROI region is divided equally, and the original network performs rounding operations during the execution of ROI Pooling for both cases.
Due to the presence of the rounding operation, the detection accuracy is greatly affected when detecting small targets, and this mechanism can make the position of the candidate frame have a large error with the real image. To solve this problem, the ROI Align module in the Mask-RCNN [19] network is introduced to replace the ROI Pooling module in the original network, which causes a loss of accuracy due to the position shift caused by two rounding operations and thus the missing information. The ROI Align module is a bilinear interpolation method to obtain the pixel values of the floating-point coordinates, thus avoiding the quantization process. The ROI Align module is executed as follows:
(1) Map the coordinates of the anchor box in the original image coordinate system to the coordinates of the anchor box in the feature image coordinate system according to the ratio of the original image and the feature image, and then the coordinates in the feature map coordinate system are floating point coordinates, that is, the floating point coordinates of the ROI.
(2) Split all the ROIs into the same number of small cells, which still keep the floating point coordinates in the feature image coordinate system without quantization, so we receive two kinds of floating point coordinates of ROIs and split cells in the feature image coordinate system.
(3) The pixel values corresponding to these floating point coordinates are calculated via bilinear interpolation so that the pixel values of floating point coordinates and other integer coordinates in the segmentation unit are calculated. On this basis, the maximum pooling operation is performed for each segmentation unit so that a feature map of uniform size is obtained. Among them, bilinear interpolation extends the single linear interpolation in one direction to come up in both horizontal and vertical directions.
The theory of linear interpolation can be roughly described as follows: two endpoints are known; find the coordinates of the point on the line where the two endpoints are located between the two endpoints, where the horizontal coordinates are the corresponding floating point pixel coordinate values, and the vertical coordinates are the pixel values.
4. Improving Faster R-CNN Network Training and Evaluation
For the characteristics of bag foreign body detection in this paper, some network improvements were made to the original Faster R-CNN network, and the final improved network summary configuration is shown in Figure 13.
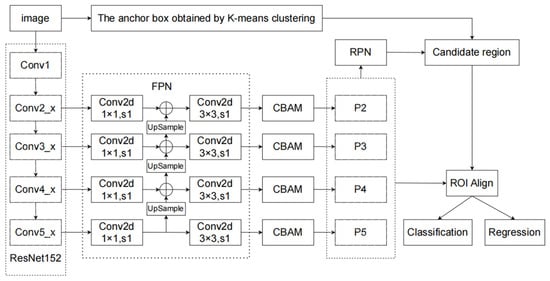
Figure 13.
Structure of the improved Faster R-CNN network.
In summary, this paper mainly improves the Faster R-CNN as follows: for the feature extraction network, the original VGG16 network is replaced with ResNet152 to increase the feature extraction capability; the FPN and CBAM modules are added after the feature extraction, and the feature fusion and self-attention mechanisms are added to enrich the features of the shared feature layer and let the network focus on the size of the foreign object and the channel. The original IoU loss function is modified to CIoU loss function, which effectively ensures the aspect ratio of the height and width of the prediction box to the actual box and speeds up the regression speed of the prediction box; the K-means clustering algorithm is used to cluster the labeled boxes of the data set, and the anchor box parameters of the original network are replaced by the anchor box obtained by clustering, which is more suitable for the foreign object detection in this paper. The ROI Pooling module of the original network is modified to the ROI Align module to avoid the loss of accuracy caused by the quantized rounding of the floating point number generated when the prediction box is mapped and divided by equal size.
5. Results and Analysis
5.1. Network Training
The foreign object detection set used in this paper has 4000 images, including 3200 images in the training set, 400 images in the validation set, and 400 images in the test set.
In this paper, we use PyTorch as the deep learning framework for network building and choose PyCharm as the software platform for network building, training, and testing. The hardware platform configuration is AMD Ryzen 9 5950X 16-Core Processor for CPU, 64 GB of memory, and an NVIDIA RTX A5000 GPU.
Generally, there are two types of Faster R-CNN network training, alternating optimization methods and approximate joint methods. Among them, the alternating optimization training method is to train the RPN network and Fast R-CNN network alternately. When training one of the networks, freeze the weights of the other network to make it constant and only adjust the weights of the training network for learning. Approximate joint training, also called end-to-end training, where all networks are trained simultaneously, is generally 1.5 times faster than alternating training while still maintaining accuracy, and this paper uses the approximate joint training method to train the networks.
5.2. Evaluation Criteria
There are many metrics to evaluate the performance of deep learning networks, and different metrics can indicate the capability of the same network model in different directions. Parameters such as recognition accuracy, localization accuracy, and detection time are commonly used as evaluation criteria in deep learning target detection. The network evaluation criteria selected in this paper are as follows:
(1) Loss curve
The loss curve reflects the loss dynamics in the training process of a deep learning network, and the horizontal coordinate of the loss curve in this paper is the number of iterations of network training.
(2) Precision and Recall
Precision is also called the accuracy rate, and recall is also called the full rate. The specific equations are shown in 10 and 11.
where TP is the number of samples predicted to be positive, i.e., the number of samples identified as foreign objects, FP is the number of samples with non-target detection errors, i.e., non-foreign objects identified as foreign objects, and FN is the number of samples with target detection errors, i.e., foreign objects identified as non-foreign objects.
(3) AP value and mAP value
AP is used to measure the accuracy of the model on different categories, and it can be obtained by calculating the area enclosed by the precision-recall curve and the coordinate axis. Additionally, mAP is the average value of AP in multiple categories. In this paper, only one category of foreign objects is identified, and AP is mAP.
5.3. Training Results
For Faster R-CNN network training, in order to optimize the network results, the hyperparameters are set as follows: the momentum value of SGD is 0.9; the initial learning rate is 0.005, updated every three epochs, and the adjustment factor is 0.33; the weight decay is 0.0001; the batch size is 16, with a total of 3200 training sets, and the completion of one epoch training requires 200 iterations; the epoch is 20, and the total number of iterations is 4000.
In this paper, the Faster R-CNN models are trained, and their feature extraction networks are VGG16, ResNet50, ResNet101, and ResNet152; meanwhile, the modified networks proposed in this paper are trained. The losses of each iteration are recorded, and the obtained loss curves are shown in Figure 14.
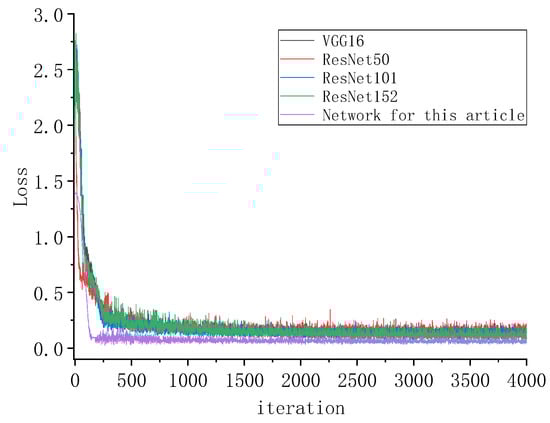
Figure 14.
Training loss curve of different networks.
As can be seen from the above figure, the loss curve decreases rapidly until 100 iterations, and the networks tend to stabilize and decrease slowly after 250 iterations and start to converge at 2500 iterations. In this paper, the decline in the network is greater than that of other networks, and then it tends to stabilize and converge rapidly. In general, the loss value of this network is smaller and less volatile than other networks, and the convergence is better. Additionally, the output of the training result AP is shown in Figure 15.
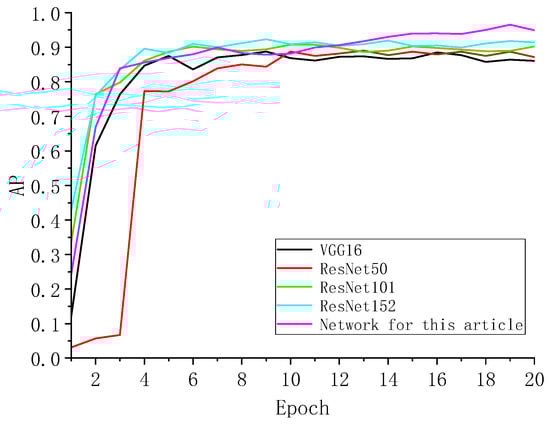
Figure 15.
AP-epoch curves for different network validation sets.
From the AP-epoch plot, it can be seen that the AP values of all networks first increase rapidly with the increase in training epochs and then gradually stabilize and fluctuate in a small range. Comparing the results of the four feature extraction networks on the validation set shows that ResNet152 has the best results, which shows that the feature extraction network in the original network is modified to ResNet152 in this paper and is beneficial for foreign object recognition. Then, compared with the final network in this paper, the results of this paper’s network are better than the Faster R-CNN with only an improved feature extraction network.
In summary, this paper improves the feature extraction network, IoU loss function, anchor box parameter, and ROI Pooling module and adds feature fusion and an attention mechanism to the final result better than the original VGG16 network. Moreover, other improvements are made on the basis of the feature network as ResNet152, and the final results are better.
5.4. Results and Analysis
The performance of the network models needs to be further validated by a test set, and the model parameters corresponding to the output when the training results achieve the maximum AP value on the validation set are selected. The above five network models were tested, and three images were selected for the experiments, and the results are shown in Figure 16.
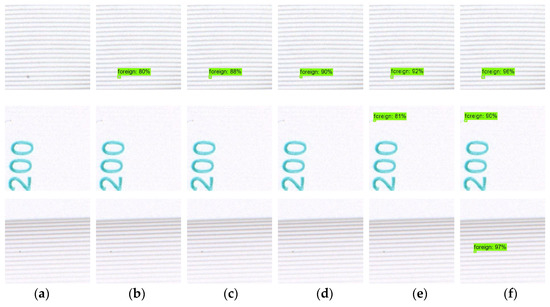
Figure 16.
Test results of each network on the test set. (a) Original image. (b) VGG16. (c) ResNet50. (d) ResNet101. (e) ResNet152. (f) Network in this paper.
From the above figure, it can be seen that in the first and second rows, as the feature extraction network adds residuals and deepens, the probability of detecting foreign objects becomes greater, and the feature extraction network extracts richer foreign object features. Then, comparing the network of this paper, other improvements are made based on the improved feature extraction network, which further improves the network’s ability to discriminate the features of the foreign bodies; in the first and second rows, the network of this paper has the highest accuracy of detecting the foreign bodies; in the third row, because the foreign bodies are more similar to the pattern of the liquid bag, which is more difficult to detect, the foreign objects are not detected by all the other networks, except for the one of this paper. Overall, the effect of the network proposed in this paper in the test set has significantly improved compared with other networks. The results of the precision-recall curves for the above five network models are shown in Figure 17.
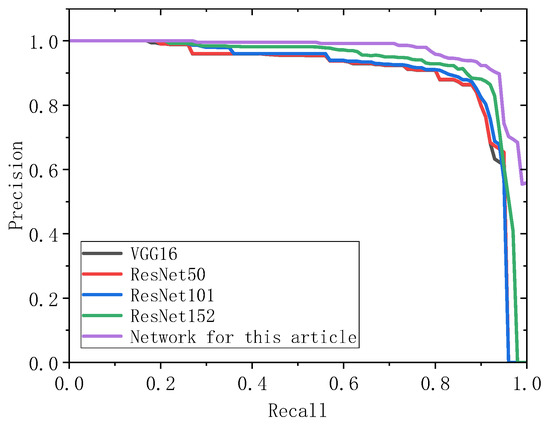
Figure 17.
Precision-recall curve of each network on the test set.
From the above figure, it can be seen that the performance of this paper’s network is the best among the precision-recall curves, and the AP results of each network on the test set derived from the PR curves are shown in the histogram in Figure 18.
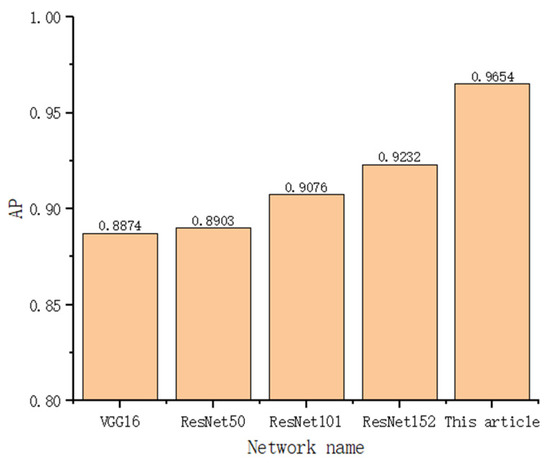
Figure 18.
AP values for each network on the test set.
As can be seen from the above figure, in the AP value, ResNet152, as the feature extraction network of Faster R-CNN, has a better improvement over VGG16, ResNet50, and ResNet101. Compared with the original network VGG16, ResNet152 improves the performance by 3.5%, and the final improved network in this paper improves the performance over the original network by 7.8% performance over the original network. The performance improvement corresponds to the test results in Figure 15.
6. Conclusions
In this paper, a visual acquisition system of the liquid bag is built for liquid bag foreign body detection, and vignetting correction is performed on the acquired images to ensure image clarity. The liquid bag foreign body belongs to small target detection, and an improved Faster R-CNN model is proposed in this paper, and the results are as follows:
(1) Replace the feature extraction network of Faster R-CNN from VGG16 with ResNet152, which is able to extract more comprehensive and detailed image features. Use CIoU instead of the IoU loss function to increase the convergence speed and detection accuracy of network training.
(2) Adding FPN and CBAM modules to the Faster R-CNN network, changing the network from focusing on only one feature layer to focusing on fours layers, and allowing the network to focus more on the channel and location size information of the target, which can increase the network accuracy from the perspective of rich features and improve the network efficiency from the perspective of focusing on the target information.
(3) The Faster R-CNN network should be adapted to the corresponding anchor box according to the different target sizes, and the K-means algorithm is used to cluster the corresponding target sizes and map them to different feature layers, which can improve the detection accuracy of the network while also improving the detection efficiency.
(4) Using ROI Align instead of the ROI Pooling module can solve the problem of information loss due to rounding problems in the calculation process, especially for a situation like this paper where small targets account for a small percentage of pixels, which can improve the detection performance of the network for small targets.
The improved network in this paper demonstrates superior performance compared to other networks, achieving a detection accuracy of 97%. This represents a significant improvement of 7.8% over the original network. By utilizing target inspection instead of manual visual inspection, the aim is to provide technical support for intelligent inspection, thereby enhancing operational efficiency in the factory.
7. Discussion
This paper creates a liquid bag foreign object dataset to automate the detection of liquid bags in factories. Detection is performed using an improved Faster R-CNN model. Vignetting correction is applied to the captured images; ResNet152 replaces the original VGG16 feature extraction network; CBAM attention mechanism is added; IOU, ROI Pooling, and Anchor box parameters are optimized. The optimized network was effectively improved. Future work will be centered on model deployment.
Author Contributions
Conceptualization, K.L. and J.L.; methodology, K.L., Q.Z., and J.L.; software, Q.Z. and J.L.; validation, J.W. and X.L.; formal analysis, X.L.; investigation, J.W.; resources, B.H.; data curation, B.H. and Q.Z.; writing—original draft preparation, J.L.; writing—review and editing, J.L.; visualization, J.L.; supervision, K.L.; project administration, B.H. and J.L.; funding acquisition, B.H. All authors have read and agreed to the published version of the manuscript.
Funding
This research was funded by the Foundation of Artificial Intelligence Key Laboratory of Sichuan Province, grant number 2020RYY01, and the Science and Technology Department of Sichuan Province, grant number 2021YFG0050.
Institutional Review Board Statement
Not applicable.
Informed Consent Statement
Not applicable.
Data Availability Statement
The data presented in this study are available on request from the corresponding author.
Acknowledgments
All the authors are greatly acknowledged for their financial support in making this research possible.
Conflicts of Interest
The authors declare no conflict of interest.
References
- Huang, B.; Liu, J.; Zhang, Q.; Liu, K.; Wang, J. Visual Detection Method for Missing Infusion Bag Pipeline. Electronics 2023, 12, 2574. [Google Scholar] [CrossRef]
- Zhang, Q.; Liu, K.; Huang, B. Research on Defect Detection of The Liquid Bag of Bag Infusion Sets Based on Machine Vision. Acad. J. Sci. Technol. 2023, 5, 186–197. [Google Scholar] [CrossRef]
- Felipe, M.A.A.; Olegario, T.V.; Bugtai, N.T.; Baldovino, R.G. Vision-based liquid level detection in amber glass bottles using OpenCV. In Proceedings of the 2019 7th International Conference on Robot Intelligence Technology and Applications (RiTA), Daejeon, Republic of Korea, 1–3 November 2019; IEEE: Piscataway, NJ, USA, 2019; pp. 148–152. [Google Scholar]
- Liang, Q.; Luo, B. Visual inspection intelligent robot technology for large infusion industry. Open Comput. Sci. 2023, 13, 20220262. [Google Scholar] [CrossRef]
- Hans, O.R.; Jens-Patrick, L.; Hoa, T.; Thunem, H.P. Detecting Overlapping Pharmaceutical Infusion Bags using Convolutional Neural Network. In Proceedings of the International Conference on Applied Artificial Intelligence, Halden, Norway, 19–21 May 2021. [Google Scholar]
- Girshick, R. Fast r-cnn. In Proceedings of the IEEE International Conference on Computer Vision, Santiago, Chile, 7–13 December 2015; pp. 1440–1448. [Google Scholar] [CrossRef]
- He, K.; Zhang, X.; Ren, S.; Sun, J. Spatial pyramid pooling in deep convolutional networks for visual recognition. IEEE Trans. Pattern Anal. Mach. Intell. 2015, 37, 1904–1916. [Google Scholar] [CrossRef] [PubMed]
- Ren, S.; He, K.; Girshick, R.; Sun, J. Faster r-cnn: Towards real-time object detection with region proposal networks. In Proceedings of the Advances in Neural Information Processing Systems, Montreal, QC, Canada, 7–12 December 2015; Volume 28. [Google Scholar] [CrossRef]
- Oh, S.; Jung, M.; Lim, C.; Shin, S.-C. Automatic detection of welding defects using Faster R-CNN. Appl. Sci. 2020, 10, 8629. [Google Scholar] [CrossRef]
- Ni, H.; Wang, M.; Zhao, L. An improved Faster R-CNN for defect recognition of key components of transmission line. Math. Biosci. Eng. 2021, 18, 4679–4695. [Google Scholar] [CrossRef] [PubMed]
- Zhang, K.; Shen, H. Solder joint defect detection in the connectors using improved Faster-RCNN algorithm. Appl. Sci. 2021, 11, 576. [Google Scholar] [CrossRef]
- Chen, M.; Yu, L.; Zhi, C.; Sun, R.; Zhu, S.; Gao, Z.; Ke, Z.; Zhu, M.; Zhang, Y. Improved faster R-CNN for fabric defect detection based on Gabor filter with Genetic Algorithm optimization. Comput. Ind. 2022, 134, 103551. [Google Scholar] [CrossRef]
- Li, Z.; Li, Y.; Yang, Y.; Guo, R.; Yang, J.; Yue, J.; Wang, Y. A high-precision detection method of hydroponic lettuce seedlings status based on improved Faster, R.C.N.N.; et al. Comput. Electron. Agric. 2021, 182, 106054. [Google Scholar] [CrossRef]
- Zhang, K.; Wu, Q.; Chen, Y. Detecting soybean leaf disease from synthetic image using multi-feature fusion faster R-CNN. Comput. Electron. Agric. 2021, 183, 106064. [Google Scholar] [CrossRef]
- Cao, C.; Wang, B.; Zhang, W.; Zeng, X.; Yan, X.; Feng, Z.; Liu, Y.; Wu, Z. An improved faster R-CNN for small object detection. IEEE Access 2019, 7, 106838–106846. [Google Scholar] [CrossRef]
- Li, C.; Qu, Z.; Wang, S.; Liu, L. A method of cross-layer fusion multi-object detection and recognition based on improved faster R-CNN model in complex traffic environment. Pattern Recognit. Lett. 2021, 145, 127–134. [Google Scholar] [CrossRef]
- Rezatofighi, H.; Tsoi, N.; Gwak, J.Y.; Sadeghian, A.; Reid, I.; Savarese, S. Generalized intersection over union: A metric and a loss for bounding box regression. In Proceedings of the IEEE/CVF Conference on Computer Vision and Pattern Recognition, Long Beach, CA, USA, 15–20 June 2019; pp. 658–666. [Google Scholar] [CrossRef]
- Zheng, Z.; Wang, P.; Liu, W.; Li, J.; Ye, R.; Ren, D. Distance-IoU loss: Faster and better learning for bounding box regression. In Proceedings of the AAAI Conference on Artificial Intelligence, New York, NY, USA, February 7–12 2020; Volume 34, pp. 12993–13000. [Google Scholar]
- He, K.; Gkioxari, G.; Dollár, P.; Girshick, R. Mask R-CNN. In Proceedings of the IEEE International Conference on Computer Vision, Venice, Italy, 22–29 October 2017; pp. 2961–2969. [Google Scholar] [CrossRef]
Disclaimer/Publisher’s Note: The statements, opinions and data contained in all publications are solely those of the individual author(s) and contributor(s) and not of MDPI and/or the editor(s). MDPI and/or the editor(s) disclaim responsibility for any injury to people or property resulting from any ideas, methods, instructions or products referred to in the content. |
© 2023 by the authors. Licensee MDPI, Basel, Switzerland. This article is an open access article distributed under the terms and conditions of the Creative Commons Attribution (CC BY) license (https://creativecommons.org/licenses/by/4.0/).