Abstract
To investigate droplet formation in a microchannel with different walls, simulations were conducted based on a pseudopotential model using the exact difference method force scheme. The variable surface tension was obtained using Laplace’s law, and the static contact angle was estimated using a first-order linear equation of the corresponding control parameter of the model. The droplet motion in microchannels was simulated using our model, and the effects of surface wettability and the Bond number on the droplet motion were investigated. The droplet motion for the intermediate microchannel wall took a significantly shorter time than that for the hydrophilic wall, and the wet length also depended on the contact angle. As the Bond number increased, the wet length of the droplet decreased on the hydrophilic surface. The droplet formation in a T-junction device was also simulated using the proposed model, and the effects of the capillary number and viscosity ratio on droplet formation were discussed in detail, and some empirical correlations between the capillary number and dimensionless droplet length are presented according to different viscosity ratios. The three flow patterns of droplet formation were categorized by the different capillary numbers as the dripping–squeezing, jetting–shearing, and threading regimes. In the dripping–squeezing regime, the droplet volume was nearly independent of the viscosity ratio, but the viscous effect was more prone to occur in the jetting–shearing regime. In the jetting–shearing regime, as the capillary number increased, the effect of the viscosity ratio on droplet formation became more significant.
1. Introduction
Liquid–liquid multicomponent flows in microchannels exist widely in many fields, including chemical synthesis, oil recovery [1,2,3,4,5], lab-on-chip microfluidic applications [6,7,8,9,10], and microchemical reactions [11,12,13,14]. Many conventional computational fluid dynamics (CFD) approaches have been used to simulate multicomponent flows in microchannels by solving the macroscopic Navier–Stokes equations [15]. These methods are based on interface tracking, such as the front tracking method [16], and interface capturing, such as the volume of fluid (VOF) [17] and level set methods [18]. These methods can be used to simulate multicomponent flows, but it is difficult to track complex flows between molecules [19]. The Lattice Boltzmann method, a mesoscopic method, is very powerful in solving multicomponent flows due to its statistical representation of kinetic theory, easy implementation, and low computational cost [20,21]. The LB method of multiphase flows is usually classified into four types: pseudopotential [22,23,24], free-energy [25], color-gradient [26], and kinetic-theory-based models [27,28]. Since the deformation of interfaces is more accurate and simulation is more effective [29] in the pseudopotential model, it is suitable for modeling multicomponent flows in microchannels. To avoid unphysical slip boundary condition, an external force is considered to improve this boundary condition in LBM [30]. In addition, the heat transfer has also been focused since it is important to microfluidic devices, i.e., heat exchangers. The heat transfer and Pseudoplastic flow of non-Newtonian fluid in a microchannel were investigated using LBM, and the slip velocity enhances the convection heat transfer [31]. The mixed convection of water/nanofluid in a two dimensional microchannel was studied using LBM considering the effects of buoyancy forces on nanofluid slip velocity, and the most heat transfer rate is obtained under higher amounts of nanoparticles mass fraction and small slip coefficient [32]. Furthermore, a uniform magnetic field was applied to investigate the conjugate heat transfer of water/Ag nanofluids in a microchannel with the hydrophobic surface, and when Hartmann number is 30, the Nusselt number increases up to 20% [33]. In addition, the geometric size also influences the heat transfer and flow characteristics [34], and open microchannel has better thermal performance than closed one [35]. Instabilities of flow in microchannels are also important features, and different to macro channels, flow in microchannels is more likely to form instabilities [36]. To investigate the instabilities of flow, Yogesh etc. [37] conducted a series of experiments and found that they reduced significantly in segmented finned channels due to easy passage of bubbles.
Despite significant research progress, multicomponent flows in microchannels provide major challenges to the modeling approach. Many methods, such as the free-energy and color-gradient models, are mainly adopted to model droplet formation. In addition, the pseudopotential LB model is usually applied to investigate the impingement of droplets on the liquid film near the wall [38,39]. However, to the best of the authors’ knowledge, the pseudopotential model of the Lattice Boltzmann method has not yet been applied to investigate droplet formation in microchannels. In this study, the pseudopotential model based on the exact difference method (EDM) force scheme is used to model droplet motion and droplet formation in microchannels. The rest of this study is organized as follows: In Section 2, the pseudopotential model and EDM force scheme are discussed in detail. In Section 3, the present model is validated, and some simulations are represented. Laplace’s law is used to determine the surface tension. A droplet in two flat plates is applied to analyze the interrelation between the static contact angle and relevant parameters in the LB model. Two-component Poiseuille flow is employed to validate the viscous effect. In Section 4, the droplet motion and formation are investigated in detail. In Section 5, we summarize our main findings as conclusions.
2. Numerical Method
2.1. Pseudopotential Lattice Boltzmann Model for Immiscible Fluids
Using the pseudopotential LB model with an interaction force, the particle distribution evolution was obtained by the following equation:
where is the density distribution function of the αth component fluid at lattice node x; is the αth component fluid collision term, which describes the relaxation of density distribution functions towards the equilibrium states; is the interaction force, which includes both the fluid–fluid and fluid–solid interaction forces; and α is an index for components, which is set as α = {1, 2} for simplicity. We used the classical lattice BGK collision operator owing to its simplicity and low computational cost:
where τα is the αth component relaxation time.
For simplicity, we used the D2Q9 lattice model on a uniform square 2D lattice to analyze the multicomponent flow when Δx = Δt = 1 [40,41]. This model has nine velocities and is widely applied in 2D simulations [42,43]. Although the D2Q9 lattice model with eighth-order isotropy could not reduce the spurious current enough [44], when the droplet moves quickly in microchannels, the spurious currents may have a limit influence on the droplet dynamics. The lattice velocity was obtained as
The equilibrium density distribution function was obtained as
where wi is the weigh factor in the D2Q9 model and is defined as
The density and velocity uα of the αth component fluid and mixture flow velocity u can be obtained from the following equations
The relaxation time τα is related to the kinematic viscosity of the αth component fluid by
To achieve better accuracy of the multicomponent flow, Guo’s force scheme [45] and the EDM [46] are usually used to incorporate the fluid–fluid interaction force of other component fluids and fluid–solid interaction force of solid nodes acting on the αth component fluid and body force. The equations of Guo’s force term and the EDM are written as
The macroscopic equilibrium velocity was computed to be
The pseudopotential LBM was first mentioned by Shan and Chen [47] and is widely used for multicomponent flows. Compared with the original force term of the Shan–Chen model, both Guo’s force scheme and the EDM offer better features. Although Guo’s force term can be totally derived from the Boltzmann equation using the Chapman–Enskog expansion, the prediction of the EDM is more stable than that of Guo’s force scheme [24]. Therefore, we chose the EDM to incorporate forces.
2.2. Interaction Force for Immiscible Fluids
In Lattice Boltzmann methods, all the different components are simulated using the same collision and streaming process. Therefore, the interfaces between different fluids are represented by several lattice nodes, wherein the density varies smoothly from one to another and is controlled by the interaction force. The fluid–fluid interaction force [47,48] between a central node and its surrounding nodes was deduced to be
where α and denote the different components. Gc is a parameter controlling the interaction strength between the different components and determining attractive or repulsive interactions. ψ is the effective density and is defined as
Spurious currents occur due to the insufficient isotropy of the discrete gradient in Equation (11) [47]. Therefore, higher-order isotropy is used to compute the discrete gradient term. However, this leads to using more surrounding nodes to calculate the fluid–fluid interaction force, which increases computational cost and reduces the parallel level. In this study, we chose the eighth-order scheme for the pseudopotential multicomponent model.
The fluid–solid interaction force acting on the αth component fluid determined fluid wetting, spreading properties, and the contact angle and was deduced to be
where s (x + eiΔt) is an indicator, which either equals to 1 for solid nodes or 0 for fluid nodes. Gα can adjust the strength between the fluid and solid nodes. A non-wetting fluid requires Gα < 0, while a wetting fluid requires Gα > 0. In this study, the sign of Gα varies in a two-component flow, wherein one fluid is non-wetting, and the other fluid is wetting.
Moreover, the body force was deduced to be
where g is the body force per unit mass.
Lastly, the total force was deduced to be
3. Model Validation
3.1. Validation of Surface Tension Using Laplace’s Law
Laplace’s law states that the pressure difference Pin − Pout between the inside and outside of a static droplet is linearly proportional to the inverse of the droplet radius r, and the coefficient is the surface tension σ. Laplace’s law is defined as
In this section, we present a droplet (second component fluid) surrounded by the first component fluid and validate the current pseudopotential multicomponent model with different viscosity ratios using Laplace’s law. The grid size was 100 × 100 l.u.2, the boundary condition was set to be periodic, and there was no body force application. The parameter Gc determined the surface tension in the LB model. In this simulation, four values of Gc (1.4, 1.5, 1.9, and 2.0) were used to obtain four values of surface tension. The densities both inside and outside of the droplet were initialized as one, and the viscosities inside and outside of the droplet were set to be 0.3 and 0.0712, respectively. After a steady droplet state was achieved, the interface width was approximately 4–5 lattices. The final radius of the droplet was measured, and the corresponding pressure was calculated using
where cs is the lattice sound speed. The pressures inside (Pin) and outside (Pout) the droplet were calculated on the lattices that were away from the interface to avoid pressure variations. The radius was measured between the two centerlines of the interface, where the density was 0.5 (ρ1 + ρ2) along the central horizontal line. The corresponding results are shown in Figure 1, wherein the solid lines fit the simulation data well. The slopes of the linear fit lines are 0.041, 0.050, 0.092, and 0.101 (i.e., the surface tension) for Gc = 1.4, 1.5, 1.9, and 2.0, respectively. Thus, the surface tension increased as the value of Gc increased, and a variable surface tension was obtained, as shown in Table 1.
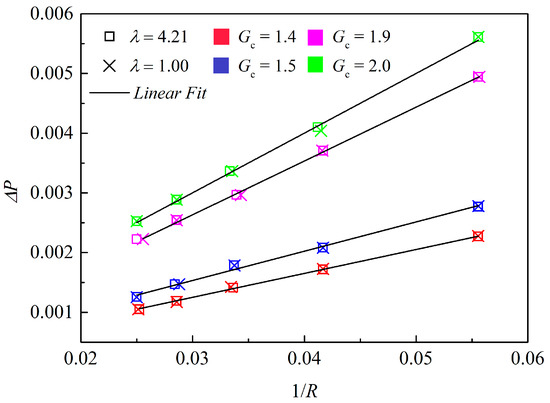
Figure 1.
Relationship of the pressure difference between the inside and outside of the droplet and the inverse of droplet radius with different viscosity ratios and linear fit lines at Gc = 1.4, 1.5, 1.9, and 2.0. Red, blue, magenta, and green represent Gc values of 1.4, 1.5, 1.9, and 2.0, respectively.

Table 1.
Parameter Gc vs. surface tension.
3.2. Estimation of Static Contact Angle with a Droplet in Two Flat Plates
The contact angle is an important feature of both wetting and non-wetting fluids and can be predicted using the pseudopotential multicomponent model [38]. We used a static droplet near a flat plate to simulate its contact angle and set parameter G2 = −G1 to achieve a more accurate relationship of G2 and the contact angle [38]. The grid size was 100 × 100 l.u.2, and the second component of a 40 × 40 l.u.2 rectangle near the wall was surrounded by the first. The no-slip boundary condition was applied for the top and bottom walls, while the periodic boundary condition was set for the left and right surfaces. The wet length, where the droplet touches the wall, and the height of the droplet are crucial to describe its formation. Therefore, after a stable state was achieved, the wet length (b) and height (h) of a semicircular droplet were measured. The semicircular radius was deduced to be
The contact angle of the droplet was then obtained to be
As shown in Figure 2, the contact angle is adjusted by changing G2 under different Gc values, and the relationship of G2 and the contact angle with the viscosity ration is written by a first-order linear equation with G2 ranging from −0.5 to 0.5; however, we must note that the contact angle ranges from ~30°–150° and cannot be measured accurately beyond this range. As Gc increases, the slope of the fit line decreases, but all fit lines have almost the same intercept, which is approximately 90°, indicating that the contact angle is 90° with G2 being 0, regardless of Gc, as presented in Table 2.
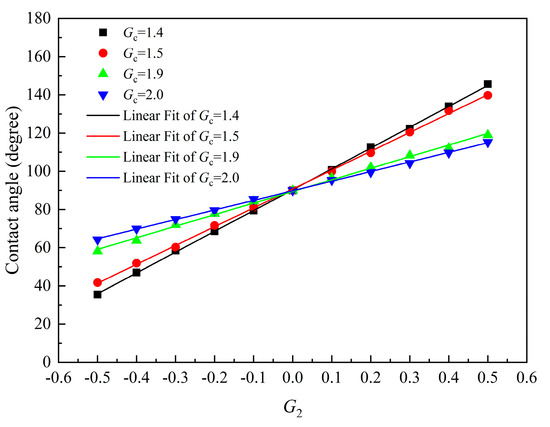
Figure 2.
Relationship of G2 and the contact angle with viscosity ratio 4.21 and linear fit lines for Gc = 1.4, 1.5, 1.9, and 2.0. The maximum error of the simulation results with respect to the linear fit lines is less than 2°.

Table 2.
Slopes and intercepts of linear fit lines of G2 and the contact angle.
3.3. Two-Component Poiseuille Flow
A two-component Poiseuille flow driven by the pressure gradient was used to validate the viscous effect. The non-wetting fluid was near the wall, while the wetting fluid was in the central region. The non-wetting fluid was more viscous than the wetting fluid in the first case but was less viscous than the wetting fluid in the second case. In either case, a periodic boundary condition was applied at the inlet and outlet boundaries. The no-slip boundary condition was applied to the upper and lower surfaces. The viscosity ratio λ was 4.21. The viscosity of the more viscous fluid was 0.3, while that of the less viscous fluid was 0.0712. The channel width and driving force were set to be 120 Lu and 1.0 × 10⁻⁶, respectively. The corresponding simulations and analytical results are shown in Figure 3. In Figure 3, the two-component LB model results agree with the analytical solutions.
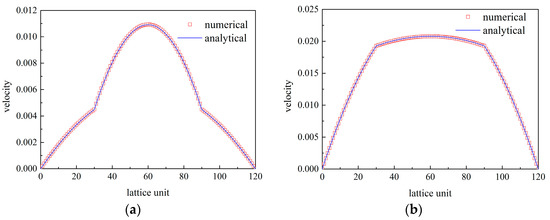
Figure 3.
Velocity profiles with channel width for Poiseuille flow are simulated with kinematic viscosities: (a) νnw = 0.0712 and νw = 0.3, and (b) νnw = 0.3 and νw = 0.0712.
4. Results and Discussion
4.1. Droplet Motion in Microchannels
The droplet motion plays a vital role in the microfluidics within the microchannel [49]. In this section, we use our model to predict the droplet motion in microchannels and discuss the influence of the contact angle and Bond number on this motion. A rectangular geometry was applied to simulate this motion, and the computational domain was taken as L × W = 600 × 100 l.u.2. Periodic boundary conditions were applied at the left and right sides, and the no-slip boundary condition (i.e., bounce-back scheme) was applied at the top and bottom sides. This motion was driven by a volume force (i.e., pressure force). Some simulations were performed under different contact angles and Bond numbers, and the density of the second component fluid was initialized by the l0 × w0 = 80 × 40 l.u.2 rectangle near the bottom wall, surrounded by first component fluid. The volume force F = 1.0 × 10⁻⁶ was applied in the x-direction. The characteristic velocity, dimensionless time, and dimensionless ratio (usually referred to as the Bond number) (pressure force/surface force) were defined as u = ρ2aLH/μ2, t* = tu/H, and Bo = ρ2aLH/σ, respectively, where ρ2, μ2, t, and σ are the density and viscosity of the second fluid, time step, and surface tension, respectively.
To quantitively analyze the droplet motion in the microchannel, the dimensionless centroid of the droplet was defined as x* = x/L and y* = y/H, representing its position in the x- and y-directions, respectively, and it was described by x = ∫A xdx/∫A dx and y = ∫A ydy/∫A dy, where A is the region of the droplet. The dimensionless height and wet length of the droplet were computed as h* = h/h0 and l* = l/l0, respectively.
4.1.1. Effect of Contact Angle
As shown in Figure 4, microchannels with different surface wettabilities (θ = 50° and 90°) are considered, and the same Bo number is applied in this simulation. The droplet motion under different contact angles is different: when θ = 50° and 90°, the droplet always attaches to the wall, but the wet length in the former condition is larger than that in the latter condition. Overall, the velocity in a microchannel is similar to the flow without droplets. In addition, the velocity over on the droplet is higher than that in other places since the existence of droplet results in the decrease in cross-area of the flow microchannel.
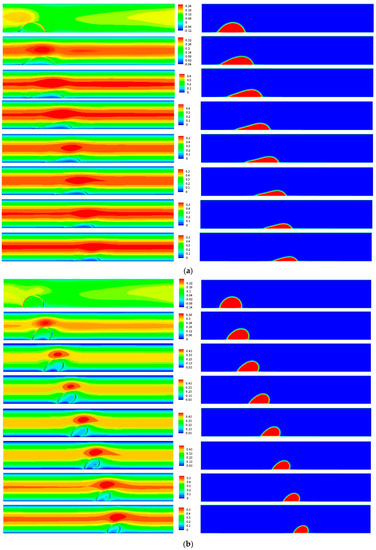
Figure 4.
Velocity distribution and droplet dynamic behavior at different contact angles ((a) θ = 50°, (b) θ = 90°); θ = 50° and 90° represent hydrophilic and intermediate (neutral) surfaces, respectively; Bo = 1.20. Dimensionless times (t*) from top to bottom panel are 1.4, 2.8, 4.2, 5.8, 7.0, 8.4, 9.8, and 11.2, respectively. The positive sign of velocity denotes its direction is right, and the negative sign means left.
As shown in Figure 5, different G2 values are applied in this simulation to achieve different contact angles (50°, 70°, and 90°), and Gc is set as 1.5. In Figure 5a, when the contact angles (θ) are 50°, 70°, and 90°, the three curves are close to each other, and the increase in x* at θ = 50° is the sharpest. On comparing x* under different contact angles, the droplet motion in the x-direction for the hydrophilic microchannel wall takes a longer time than that for the intermediate wall. In Figure 5b, y* decreases with droplet motion when the droplet attaches to the wall. As the contact angle increases (increasing the wall wettability), y* increases. In Figure 5c, the curves of wet length (l*) have similar change tendencies regardless of the curve at θ = 50°. On comparing the different wettabilities from the hydrophilic to the intermediate wall, the wet length depends on the contact angle.
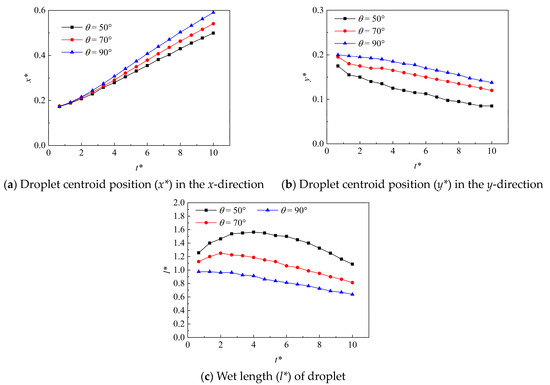
Figure 5.
Variations of droplet positions and wet lengths under different contact angles; Gc = 1.5; Bo = 1.53.
4.1.2. Effect of Bond Number
As mentioned earlier, the Bond number represents the ratio of pressure and surface forces. In this LB multiphase model, different surface tension values were obtained by changing the Gc values (1.4, 1.5, 1.9, and 2.0) that were then used to achieve different Bond numbers (1.46, 1.20, 0.65, and 0.59), as described in the following. The wall was categorized into intermediate (neutral) (θ = 90°) and hydrophilic surfaces (θ = 50°), and they all exhibited different properties.
In Figure 6a, as the Bond number increases, the droplet wet length increases on the on the neutral surface. However, as the Bond number increases, the droplet wet length decreases on the hydrophilic surface, as shown in Figure 6b.
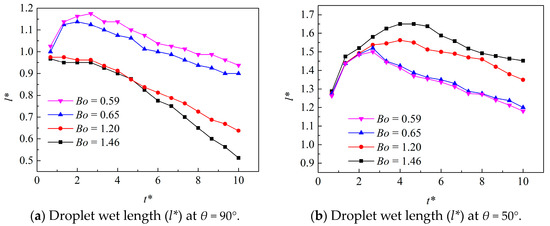
Figure 6.
Variations of droplet wet lengths with Bond numbers (Bo = 1.46, 1.20, 0.65, and 0.59).
4.2. Droplet Formation in Microchannels
In recent years, many researchers have focused on the process of droplet formation in a T-junction because of the simplicity and easy control of the break-up of droplets [50,51]. The regimes of flow in a T-junction are affected by the shear stress caused by the continuous fluid. Thorsen et al. [52] initially investigated droplet formation within a T-junction. Several fluid properties (i.e., velocities of disperse fluid ud and continuous fluid uc, viscosities of disperse fluid µd and continuous fluid µc, densities of disperse fluid ρd and continuous fluid ρc, and surface tension σ) and dimensional parameters (i.e., widths of the channels of disperse fluid wd and continuous fluid wc) affect the slug flow in microchannels [25,26,27]. Moreover, the viscosity ratio λ = µd/µc, capillary number Ca = µc uc/σ, flow rate ratio ϕ = (ud wd)/(uc wc), and Г = wd/wc are usually used to analyze slug flow. As shown in Figure 7, l and w denote the main channel length and width, respectively, and L represents the droplet length.

Figure 7.
Schematic of a T-junction microchannel (unit: l.u).
4.2.1. Unit Conversion and Boundary Conditions in LB Simulation
To validate our LB model, the experimental data in [53] were compared with the simulation results. In the experiments presented in [53], a T-junction microfluidic device was used to investigate a droplet formation consisting of the inlets of the disperse and continuous fluids and main and wide outlet channels. For simplicity, we built a T-junction comprising the inlets of the disperse and continuous fluids and a main channel. In the experiment in [53], the constriction channel width was 20 μm, and the main channel length was 500 μm. Unit conversion was used to link both the LB simulations and physical phenomenon, which is an important factor that significantly affects the efficiency, accuracy, and stability of the LB model [54]. In this study, a 20 × 500 l.u2 computational domain corresponded to a 20 × 500 μm2 microchannel, implying the length scale Cl to be 1 μm. The properties of oil and water in the experiment in [53] are listed in Table 3. The kinematic viscosity scale Cν was 1.41 × 10⁻⁵ m2/s. Therefore, the relaxation times of oil (continuous fluid) and water (disperse fluid) were chosen as 1.4 and 0.0712, respectively, to satisfy the viscosity ratio requirement. The velocity scale Cu was 14.14 m/s, and time scale Ct was 7.09 × 10⁻⁸ s. The densities of both the fluids were assumed to be in unity, and the interfacial tension was set to be 0.05 by setting Gc = 1.5 to obtain the physical value of interfacial tension, and the value of G2 was set to be 0.3978 to correspond to the static contact angle.

Table 3.
Physical properties of oil (hexadecane) and water components.
The velocity and pressure boundaries, based on the study by He et al. [54], were easily implemented in the inlet and outlet surfaces, and no-slip boundary conditions were applied at the walls (i.e., bounce-back scheme). This multicomponent flow was assumed to be a pressure-driven fully developed channel flow.
4.2.2. Validation of Droplet Formation in Microchannels
Figure 8 shows the relationship between the fluid velocity and droplet volume, and the red solid circle and blue diamond denote the numerical and experimental results, respectively. The droplet volume in the simulation results agrees well with that in the experimental results, implying that our application of the LB model to this research is reasonable.
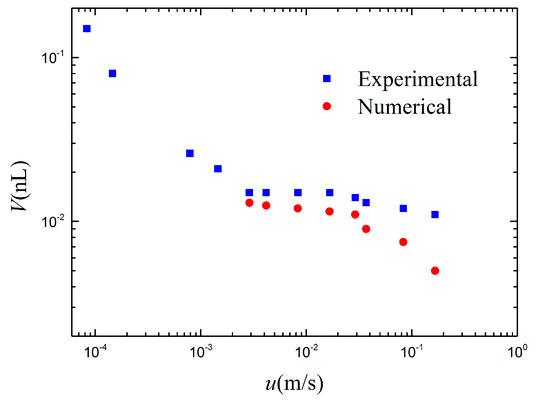
Figure 8.
Droplet volume comparison of the simulation results with experimental data [53] at flow rate ratio ϕ = 1. The velocity and droplet volume are expressed in physical units.
4.2.3. Formation Regime and Critical Capillary Number
The formation regime of a droplet or bubble in microchannels has been widely investigated [55,56,57,58,59,60], and the formation patterns have been classified into three categories based on the droplet shape [14,53]. (1) The dripping–squeezing regime occurs at a low capillary number; the droplet breakup is mainly caused by pressure difference, and the breakup occurs at the T-junction corner. (2) In the jetting-shearing regime, when the capillary number is relatively high, shearing occurs; unlike in the dripping–squeezing regime, the shearing stress caused by the continuous fluid dominates in the breakup, and the breakup point evidently moves downstream. (3) In the threading regime, when the shearing stress is adequately large, the breakup does not happen, and both the fluids flow parallel to each other in the main channel. These regimes were simulated using the improved pseudopotential LBM. The corresponding details are discussed later.
Many experimental and numerical studies focus on the critical capillary number (Cac), which can distinguish between the dripping–squeezing and jetting–shearing regimes, but the critical capillary number varies [53,55,56]. This is because of the difficulty to distinguish the droplet breakup point when it is close to the corner of the downstream T-junction. In our simulation, the critical capillary number is ~0.002, and this value is independent of the viscosity ratio, as shown in Figure 9. The capillary number significantly affects the droplet length in the jetting–shearing regime, but this effect is minimal in the dripping–squeezing regime. The dimensionless droplet length is expressed as: . If Ca < Cac, the viscosity ratio has a limit influence on droplet length, and it is found that the droplet length almost has a relationship with the capillary number, which the empirical correlation can be written as . If Ca > Cac, as the viscosity ratio increases, the droplet length also increases, and the empirical correlations between capillary number and droplet length are given by , , and for λ = 4.21, 3.00, and 1.00, respectively.
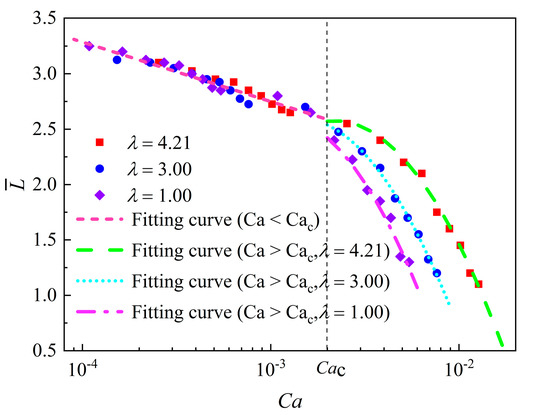
Figure 9.
Effect of capillary number and viscosity ratio on droplet length at flow rate ratio ϕ = 1.
4.2.4. Effect of Viscosity Ratio on Droplet Formation
In the simulations, the flow rate ratio ϕ was fixed at 1. As shown in Figure 9, the critical capillary number Cac is ~0.002, which is independent of the viscosity. However, the viscosity still affects the droplet formation, especially in the jetting–shearing regime. Since the pressure difference is dominated in the dripping–squeezing regime, the droplet length is almost independent of the viscosity. On the contrary, the droplet length in the jetting–shearing regime is significantly affected by the viscosity due to shear stress. As the viscosity ratio increases, the droplet length decreases, implying that the shear stress leads to the generation of smaller droplets.
4.2.5. Dripping–Squeezing, Jetting–Shearing, and Threading Regimes
The dripping–squeezing regime is dominated by pressure difference, and uniform droplets are generated. Five stages are used to describe the droplet formation in this regime [50,60], as shown in Figure 10: (a) the disperse fluid begins to enter the main channel, (b) the disperse fluid tip gradually becomes larger and plugs up the whole main channel, (c) the continuous fluid squeezes the disperse fluid, (d) the disperse fluid breaks up, and (e) a droplet finally forms in the main channel.
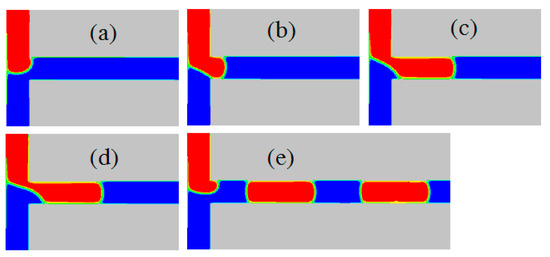
Figure 10.
Dripping–squeezing regime, Ca = 0.00038, λ = 4.21°. (a) t = 31.1 ms; (b) t = 39.7 ms; (c) t = 55.3 ms; (d) t = 63.8 ms; (e) t = 80.8 ms.
The jetting–shearing process driven by the shearing stress and droplet generation occurs in four steps: (1) as shown in Figure 11a, the tip of the disperse fluid first enters the main channel, and the disperse and continuous fluids flow parallel to each other; (2) a round occurs at the tip of the disperse fluid, as shown in Figure 11b; (3) the round eventually attaches to the wall, as shown in Figure 11c; and (4) afterwards, the continuous fluid squeezes the disperse fluid until the breakup occurs and a droplet forms, as shown in Figure 11d. After a cycle of the above steps, droplets occur in the main channel, as shown in Figure 11d. This jetting–shearing process is also described by Shui [50].
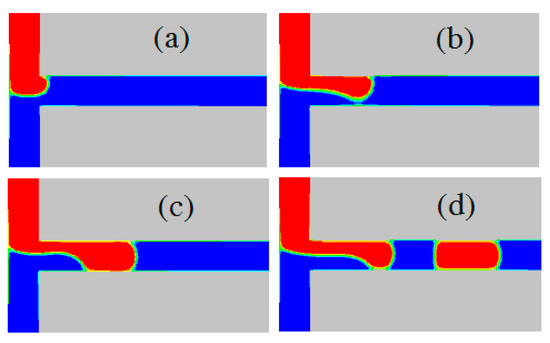
Figure 11.
Jetting–shearing regime, Ca = 0.006, λ = 4.21°. (a) t = 15.6 ms; (b) t = 21.3 ms; (c) t = 26.9 ms; (d) t = 42.5 ms.
When the flow rates of the disperse and continuous fluids increase, the former can not block the main channel, and a layered flow occurs. This is because the pressure difference is more than the surface tension. As shown in Figure 12, in the threading regime, the disperse and continuous fluids both flow in the main channel and are parallel to each other.
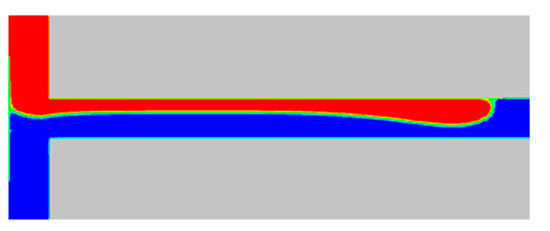
Figure 12.
Threading regime, Ca = 0.03, λ = 4.21°, t = 75.6 ms.
5. Conclusions
In this study, an improved pseudopotential model was used to simulate droplet motion and formation in microchannels, and some conclusions were drawn as follows:
- (1)
- In this model, the variable surface tension was obtained by varying the parameter Gc. The relationship between the static contact angle and relevant parameter G2 was represented by a linear equation.
- (2)
- The droplet motion is crucial to understand multi-component flow in a microchannel. The surface wettability and Bond number significantly affected the droplet motion. When contact angles (θ) were 50°, 70°, and 90°, the dimensionless positions in the x-direction (x*) and y-direction (y*) exhibited a similar variation trend, and the increase in x* at θ = 50° was the sharpest. However, the droplet motion in the x-direction of the intermediate microchannel wall took a shorter time than that for the hydrophilic wall. Thus, the wet length also depended on the contact angle. As the Bond number increases, the droplet wet length increases on the neutral surface. However, as the Bond number increases, the droplet wet length decreases on the hydrophilic surface. It is found that the droplet length almost has a relationship with the capillary number (Ca < Cac), written as . As the viscosity ratio increases and Ca > Cac, the droplet length also increases, and the empirical correlations between capillary number and droplet length are given by , , and for λ = 4.21, 3.00, and 1.00, respectively.
- (3)
- The droplet formation patterns were classified into three categories based on the droplet shape: dripping–squeezing, jetting–shearing, and threading regimes. These regimes were simulated using the improved pseudopotential LBM. In our simulation, the critical capillary number, which distinguishes the dripping–squeezing and jetting–shearing regimes, was ~0.002, and this value was independent of the viscosity ratio. The viscosity ratio affected the droplet formation, especially in the jetting–shearing regime. Since the pressure difference was dominant in the dripping–squeezing regime, the droplet length was almost independent of the viscosity. In contrast, the droplet length in the jetting–shearing regime was significantly affected by viscosity due to shear stress. As the viscosity ratio increased, the droplet length decreased, implying that the shear stress led to generation of smaller droplets.
Dynamics of the multiple droplets (i.e., translocation [61], coalescence, and permeation [62]) in microchannels are usually related to many engineering applications, i.e., cell migration, chemical mini-reactions, and porous materials. In addition, lab-on-chip microfluidic devices may be key components of high-performance computers (HPCs). The LB methods in the present work are appropriate to deal with these research subjects due to their easy implementation and robustness, and then the related studies need to be investigated in the future.
Author Contributions
Conceptualization, J.L.; Methodology, J.L.; Software, J.L.; Validation, J.L.; Investigation, X.L.; Data curation, J.L. and X.L.; Writing—original draft, J.L.; Writing—review & editing, X.L.; Supervision, J.L.; Project administration, J.L. All authors have read and agreed to the published version of the manuscript.
Funding
This research was funded by the research project on teaching reform of innovation and entrepreneurship education in colleges and universities in Gansu Province in 2022 (Grant No. LGYCXG-22-02), the innovation fund project of colleges and universities in Gansu Province in 2022 (Grant No. 2022A-167), the national college student innovation and entrepreneurship training program project in 2022 (Grant No. DC2201-17), and the national college student innovation and entrepreneurship training program project in 2021 (Grant No. DC2111807CX888).
Data Availability Statement
Data will be made available on request.
Conflicts of Interest
The authors declare no conflict of interest.
Nomenclature
| Density distribution function of the αth component fluid at lattice node x | |
| The αth component fluid collision term | |
| Interaction force, including the fluid–fluid and fluid–solid terms | |
| α | Index for components |
| wi | Weigh factor in the D2Q9 model |
| Density of the αth component fluid | |
| uα | Velocity of the αth component fluid |
| u | Mixture flow velocity |
| τα | Relaxation time |
| να | Kinematic viscosity of the αth component fluid |
| Fα,int | Fluid–fluid interaction force |
| Fα,ads | Fluid–solid interaction force |
| Gc | Parameter controlling the interaction strength |
| ψ | The effective density |
| Fα,b | The Body force |
| Fα | Total force |
| r | Droplet radius |
| σ | Surface tension coefficient |
| Pin | Pressure on the inside of a static droplet |
| Pout | Pressure on the outside of a static droplet |
| P | Corresponding pressure |
| cs | The lattice sound speed |
| R | Semicircular radius |
| θ | Contact angle |
| λ | Viscosity ratio |
| F | Volume force |
| L or l | Length of a rectangular microchannel |
| H or w | Height of a rectangular microchannel |
| x*,y* | Dimensionless position of the droplet in the x- and y-directions |
| h*,l* | Dimensionless height and wet length of the droplet |
| Bo | Bond number |
| Ca | Capillary number |
| Cac | Critical capillary number |
| ϕ | Flow rate ratio |
| Dimensionless droplet length |
References
- Adamo, A.; Beingessner, R.L.; Behnam, M.; Chen, J.; Jamison, T.F.; Jensen, K.F.; Monbaliu, J.C.M.; Myerson, A.S.; Revalor, E.M.; Snead, D.R. On-demand continuous-flow production of pharmaceuticals in a compact, reconfigurable system. Science 2016, 352, 61–67. [Google Scholar] [CrossRef] [PubMed]
- Kashid, M.N.; Renken, A.; Kiwiminsker, L. Gas-Liquid and liquid-liquid mass transfer in microstructured reactors. Chem. Eng. Sci. 2011, 66, 3876–3897. [Google Scholar] [CrossRef]
- Anna, S.L.; Bontoux, N.; Stone, H.A. Formation of dispersions using “Flow Focusing” in microchannels. Appl. Phys. Lett. 2003, 82, 364–366. [Google Scholar] [CrossRef]
- Foroughi, H.; Abbasi, A.; Das, K.S. Immiscible displacement of oil by water in a microchannel: Asymmetric flow behavior and nonlinear stability analysis of core-annular flow. Phys. Rev. E 2012, 85, 026309. [Google Scholar] [CrossRef] [PubMed]
- Li, X.-B.; Li, F.-C.; Yang, J.-C.; Kinoshita, H.; Oishi, M.; Oshima, M. Study on the mechanism of droplet formation in T-junction microchannel. Chem. Eng. Sci. 2012, 69, 340–351. [Google Scholar] [CrossRef]
- Garstecki, P.; Fuerstman, M.J.; Stone, H.A. Formation of droplets and bubbles in a microfluidic T-junction-scaling and mechanism of break-up. Lab Chip. 2006, 6, 437–446. [Google Scholar] [CrossRef]
- Tice, J.D.; Song, H.; Lyon, A.D.; Ismagilov, R.F. Formation of droplets and mixing in multiphase microfluidics at low values of the reynolds and the capillary numbers. Langmuir 2003, 19, 796–802. [Google Scholar] [CrossRef]
- Chen, N.; Wu, J.; Jiang, H. CFD Simulation of droplet formation in a wide-type microfluidic T-junction. J. Dispers. Sci. Technol. 2012, 33, 1635–1641. [Google Scholar] [CrossRef]
- Garstecki, P.; Fuerstman, M.J.; Whitesides, G.M. Nonlinear dynamics of a flow-focusing bubble generator: An inverted dripping faucet. Phys. Rev. Lett. 2005, 94, 234502. [Google Scholar] [CrossRef]
- Lu, Y.; Fu, T.; Zhu, C. Experimental investigation on the breakup dynamics for bubble formation in viscous liquids in a flow-focusing device. Chem. Eng. Sci. 2016, 152, 516–527. [Google Scholar] [CrossRef]
- Hoeve, W.V.; Dollet, B.; Versluis, M. Microbubble formation and pinch-off scaling exponent in flow-focusing devices. Phys. Fluids. 2011, 23, 865. [Google Scholar]
- Utada, A.S.; Fernandez-Nieves, A.; Stone, H.A. Dripping to jetting transitions in coflowing liquid streams. Phys. Rev. Lett. 2007, 99, 094502. [Google Scholar] [CrossRef] [PubMed]
- Castro-Hernandez, E.; Gundabala, V.; Fernandez-Nieves, A. Scaling the drop size in coflow experiments. N. J. Phys. 2009, 11, 075021. [Google Scholar] [CrossRef]
- Shahin, H.; Mortazavi, S. Three-dimensional simulation of microdroplet formation in a co-flowing immiscible fluid system using front tracking method. J. Mol. Liq. 2017, 243, 737–749. [Google Scholar] [CrossRef]
- Ferziger, J.H.; Perić, M. Computational methods for fluid dynamics. Phys. Today 1997, 50, 80–84. [Google Scholar] [CrossRef]
- Unverdi, S.O.; Tryggvason, G. A front-tracking method for viscous, incompressible, multi-fluid flows. J. Comput. Phys. 1992, 100, 25–37. [Google Scholar] [CrossRef]
- Hirt, C.W.; Nichols, B.D. Volume of fluid (VOF) method for the dynamics of free boundaries. J. Comput. Phys. 1981, 39, 201–225. [Google Scholar] [CrossRef]
- Sethian, J.A.; Smereka, P. Level set methods for fluid interfaces. Annu. Rev. Fluid Mech. 2003, 35, 341–372. [Google Scholar] [CrossRef]
- Sbragaglia, M.; Benzi, R.; Biferale, L. Surface roughness-hydrophobicity coupling in microchannel and nanochannel flows. Phys. Rev. Lett. 2006, 97, 204503. [Google Scholar] [CrossRef]
- Krüger, T.; Shardt, O.; Kuzmin, A. The Lattice Boltzmann Method Principles and Practice; Springer Nature: Basel, Switzerland, 2017; pp. 54–56. [Google Scholar]
- Chen, S.; Doolen, G.D. Lattice boltzmann method for fluid flows. Annu. Rev. Fluid Mech. 1998, 30, 329–364. [Google Scholar] [CrossRef]
- Shan, X.; Chen, H. Lattice boltzmann model for simulating flows with multiple phases and components. Phys. Rev. E 1993, 47, 1815–1819. [Google Scholar] [CrossRef] [PubMed]
- Shan, X.; Chen, H. Simulation of nonideal gases and liquid-gas phase transitions by the lattice boltzmann equation. Phys. Rev. E 1994, 49, 2941–2948. [Google Scholar] [CrossRef] [PubMed]
- Li, Q.; Luo, K.H.; Li, X.J. Forcing scheme in pseudopotential lattice Boltzmann model for multiphase flows. Phys. Rev. E 2012, 86, 016709. [Google Scholar] [CrossRef] [PubMed]
- Swift, M.R.; Orlandini, E.; Osborn, W.R. Lattice boltzmann simulations of liquid-gas and binary fluid systems. Phys. Rev. E 1996, 54, 5041–5052. [Google Scholar] [CrossRef]
- Grunau, D.; Chen, S.; Eggert, K. A lattice Boltzmann model for multiphase fluid flows. Phys. Fluids A 1993, 5, 2557. [Google Scholar] [CrossRef]
- He, X.; Shan, X.; Doolen, G.D. Discrete boltzmann equation model for nonideal gases. Phys. Rev. E 1998, 68, 035302. [Google Scholar] [CrossRef]
- He, X.; Doolen, G.D. Thermodynamic foundations of kinetic theory and lattice boltzmann models for multiphase flows. J. Stat. Phys. 2002, 107, 309–328. [Google Scholar] [CrossRef]
- Chen, L.; Kang, Q.; Mu, Y. A critical review of the pseudopotential multiphase lattice Boltzmann model: Methods and applications. Int. J. Heat Mass Transfer. 2014, 76, 210–236. [Google Scholar] [CrossRef]
- Yang, L.; Yu, Y.; Pei, H.; Gao, Y.; Hou, G. Lattice Boltzmann simulations of liquid flows in microchannel with an improved slip boundary condition. Chem. Eng. Sci. 2019, 202, 105–117. [Google Scholar] [CrossRef]
- Graeilinezhad, M.; Afrouzi, H.H.; Jahanian, O.; Mehrizi, A.A. Numerical investigation of pseudoplastic fluid flow and heat transfer in a microchannel under velocity slip effect. Eng. Anal. Bound. Elem. 2023, 155, 501–510. [Google Scholar] [CrossRef]
- Karimipour, A.; D’Orazio, A.; Goodarzi, M. Develop the lattice Boltzmann method to simulate the slip velocity and temperature domain of buoyancy forces of FMWCNT nanoparticles in water through a micro flow imposed to the specified heat flux. Phys. A Stat. Mech. Its Appl. 2018, 509, 729–745. [Google Scholar] [CrossRef]
- Mehrizi, A.A.; Besharati, F.; Jahanian, O.; Hassanzadeh Afrouzi, H. Numerical investigation of conjugate heat transfer in a microchannel with a hydrophobic surface utilizing nanofluids under a magnetic field. Phys. Fluids 2021, 33, 052002. [Google Scholar] [CrossRef]
- Prajapati, Y.K. Influence of fin height on heat transfer and fluid flow characteristics of rectangular microchannel heat sink. Int. J. Heat Mass Transf. 2019, 137, 1041–1052. [Google Scholar] [CrossRef]
- Bhandari, P.; Prajapati, Y.K. Thermal performance of open microchannel heat sink with variable pin fin height. Int. J. Therm. Sci. 2021, 159, 106609. [Google Scholar] [CrossRef]
- Prajapati, Y.K.; Bhandari, P. Flow boiling instabilities in microchannels and their promising solutions—A review. Exp. Therm. Fluid Sci. 2017, 88, 576–593. [Google Scholar] [CrossRef]
- Prajapati, Y.K.; Pathak, M.; Khan, M.K. A comparative study of flow boiling heat transfer in three different configurations of microchannels. Int. J. Heat Mass Transf. 2015, 85, 711–722. [Google Scholar] [CrossRef]
- Rahmati, A.R.; Zarareh, A. Application of a modified pseudopotential lattice Boltzmann model for simulation of splashing phenomenon. Eur. J. Mech. B/Fluids 2018, 70, 19–35. [Google Scholar] [CrossRef]
- Wu, S.; Chen, Y.; Chen, L.Q. Three-dimensional pseudopotential lattice Boltzmann model for multiphase flows at high density ratio. Phys. Rev. E 2020, 102, 053308. [Google Scholar] [CrossRef]
- Coclite, A.; Gonnella, G.; Lamura, A. Pattern formation in liquid-vapor systems under periodic potential and shear. Phys. Rev. E 2014, 89, 063303. [Google Scholar] [CrossRef]
- Negro, G.; Busuioc, S.; Ambruş, V.E.; Gonnella, G.; Lamura, A.; Sofonea, V. Comparison between isothermal collision-streaming and finite-difference lattice Boltzmann models. Int. J. Mod. Phys. C 2019, 30, 1941005. [Google Scholar] [CrossRef]
- Giordano, M.G.; Bonelli, F.; Carenza, L.N.; Gonnella, G.; Negro, G. Activity-induced isotropic-polar transition in active liquid crystals. Europhys. Lett. 2021, 133, 58004. [Google Scholar] [CrossRef]
- Favuzzi, I.; Carenza, L.; Corberi, F.; Gonnella, G.; Lamura, A.; Negro, G. Rheology of active emulsions with negative effective viscosity. Soft Mater. 2021, 19, 334–345. [Google Scholar] [CrossRef]
- Peng, C.; Ayala, L.F.; Ayala, O.M.; Wang, L.P. Isotropy and spurious currents in pseudo-potential multiphase lattice Boltzmann models. Comput. Fluids 2019, 191, 104257. [Google Scholar] [CrossRef]
- Guo, Z.; Zheng, C.; Shi, B. Discrete lattice effects on the forcing term in the lattice Boltzmann method. Phys. Rev. E 2002, 65, 046308. [Google Scholar] [CrossRef]
- Kupershtokh, A.L.; Medvedev, D.A.; Karpov, D.I. On equations of state in a lattice boltzmann method. Comput. Math. Appl. 2009, 58, 965–974. [Google Scholar] [CrossRef]
- Shan, X. Analysis and reduction of the spurious current in a class of multiphase lattice Boltzmann models. Phys. Rev. E 2006, 73, 047701. [Google Scholar] [CrossRef]
- Huang, H.; Thorne, D.T.; Schaap, M.G. Proposed approximation for contact angles in Shan-and-Chen-type multicomponent multiphase lattice Boltzmann models. Phys. Rev. E 2007, 76, 066701. [Google Scholar] [CrossRef]
- Liu, X.; Cheng, P.; Quan, X. Lattice Boltzmann simulations for self-propelled jumping of droplets after coalescence on a superhydrophobic surface. Int. J. Heat Mass Transfer. 2014, 73, 195–200. [Google Scholar] [CrossRef]
- Wong, V.L.; Loizou, K.; Lau, P.L. Numerical studies of shear-thinning droplet formation in a microfluidic T-junction using two-phase level-SET method. Chem. Eng. Sci. 2017, 174, 157–173. [Google Scholar] [CrossRef]
- Sivasamy, J.; Wong, T.N.; Nguyen, N.T. An investigation on the mechanism of droplet formation in a microfluidic T-junction. Microfluid. Nanofluid. 2011, 11, 1–10. [Google Scholar] [CrossRef]
- Thorsen, T.; Roberts, R.W.; Arnold, F.H.; Quake, S.R. Dynamic Pattern Formation in a Vesicle-Generating Microfluidic Device. Phys. Rev. Lett. 2001, 86, 4163–4166. [Google Scholar] [CrossRef]
- Shui, L.; Berg, A.V.D.; Eijkel, J.C.T. Capillary instability, squeezing, and shearing in head-on microfluidic devices. J. Appl. Phys. 2010, 106, 124305. [Google Scholar] [CrossRef]
- He, X.; Zou, Q.; Luo, L.S. Analytic solutions of simple flows and analysis of nonslip boundary conditions for the Lattice Boltzmann BGK model. J. Stat. Phys. 1997, 87, 115–136. [Google Scholar] [CrossRef]
- Wu, Z.; Cao, Z.; Sundén, B. Liquid-liquid flow patterns and slug hydrodynamics in square microchannels of cross-shaped junctions. Chem. Eng. Sci. 2017, 174, 56–66. [Google Scholar] [CrossRef]
- Xu, J.H.; Li, S.W.; Tan, J. Correlations of droplet formation in T-junction microfluidic devices: From squeezing to dripping. Microfluid. Nanofluid. 2008, 5, 711–717. [Google Scholar] [CrossRef]
- Zwan, E.V.D.; Sman, R.V.D. Lattice Boltzmann simulations of droplet formation during microchannel emulsification. J. Colloid Interface Sci. 2009, 335, 112–122. [Google Scholar] [CrossRef]
- Bashir, S.; Rees, J.M.; Zimmerman, W.B. Simulations of microfluidic droplet formation using the two-phase level set method. Chem. Eng. Sci. 2011, 66, 4733–4741. [Google Scholar] [CrossRef]
- Wu, L.; Tsutahara, M.; Kim, L.S. Numerical simulations of droplet formation in a cross-junction microchannel by the lattice Boltzmann method. Int. J. Numer. Methods Fluids 2008, 57, 793–810. [Google Scholar] [CrossRef]
- Schulz, V.P.; Abbaspour, N.; Baumeister, T.; Röder, T. Lattice-Boltzmann simulation and experimental validation of a microfluidic T-junction for slug flow generation. ChemEngineering 2019, 3, 48–62. [Google Scholar] [CrossRef]
- Montessori, A.; Tiribocchi, A.; Bogdan, M.; Bonaccorso, F.; Lauricella, M.; Guzowski, J.; Succi, S. Translocation dynamics of high-internal phase double emulsions in narrow channels. Langmuir 2021, 37, 9026–9033. [Google Scholar] [CrossRef] [PubMed]
- Negro, G.; Carenza, L.N.; Gonnella, G.; Mackay, F.; Morozov, A.; Marenduzzo, D. Yield-stress transition in suspensions of deformable droplets. Sci. Adv. 2023, 9, 8106. [Google Scholar] [CrossRef] [PubMed]
Disclaimer/Publisher’s Note: The statements, opinions and data contained in all publications are solely those of the individual author(s) and contributor(s) and not of MDPI and/or the editor(s). MDPI and/or the editor(s) disclaim responsibility for any injury to people or property resulting from any ideas, methods, instructions or products referred to in the content. |
© 2023 by the authors. Licensee MDPI, Basel, Switzerland. This article is an open access article distributed under the terms and conditions of the Creative Commons Attribution (CC BY) license (https://creativecommons.org/licenses/by/4.0/).