
Evaluation of Tight Sandstone Mechanical Properties and Fracability: An Experimental Study of Reservoir Sand−Stones from Lufeng Sag, Pearl River Mouth Basin, Northern South China Sea

 , , ,
, , ,
Abstract
1. Introduction
2. Materials and Methods
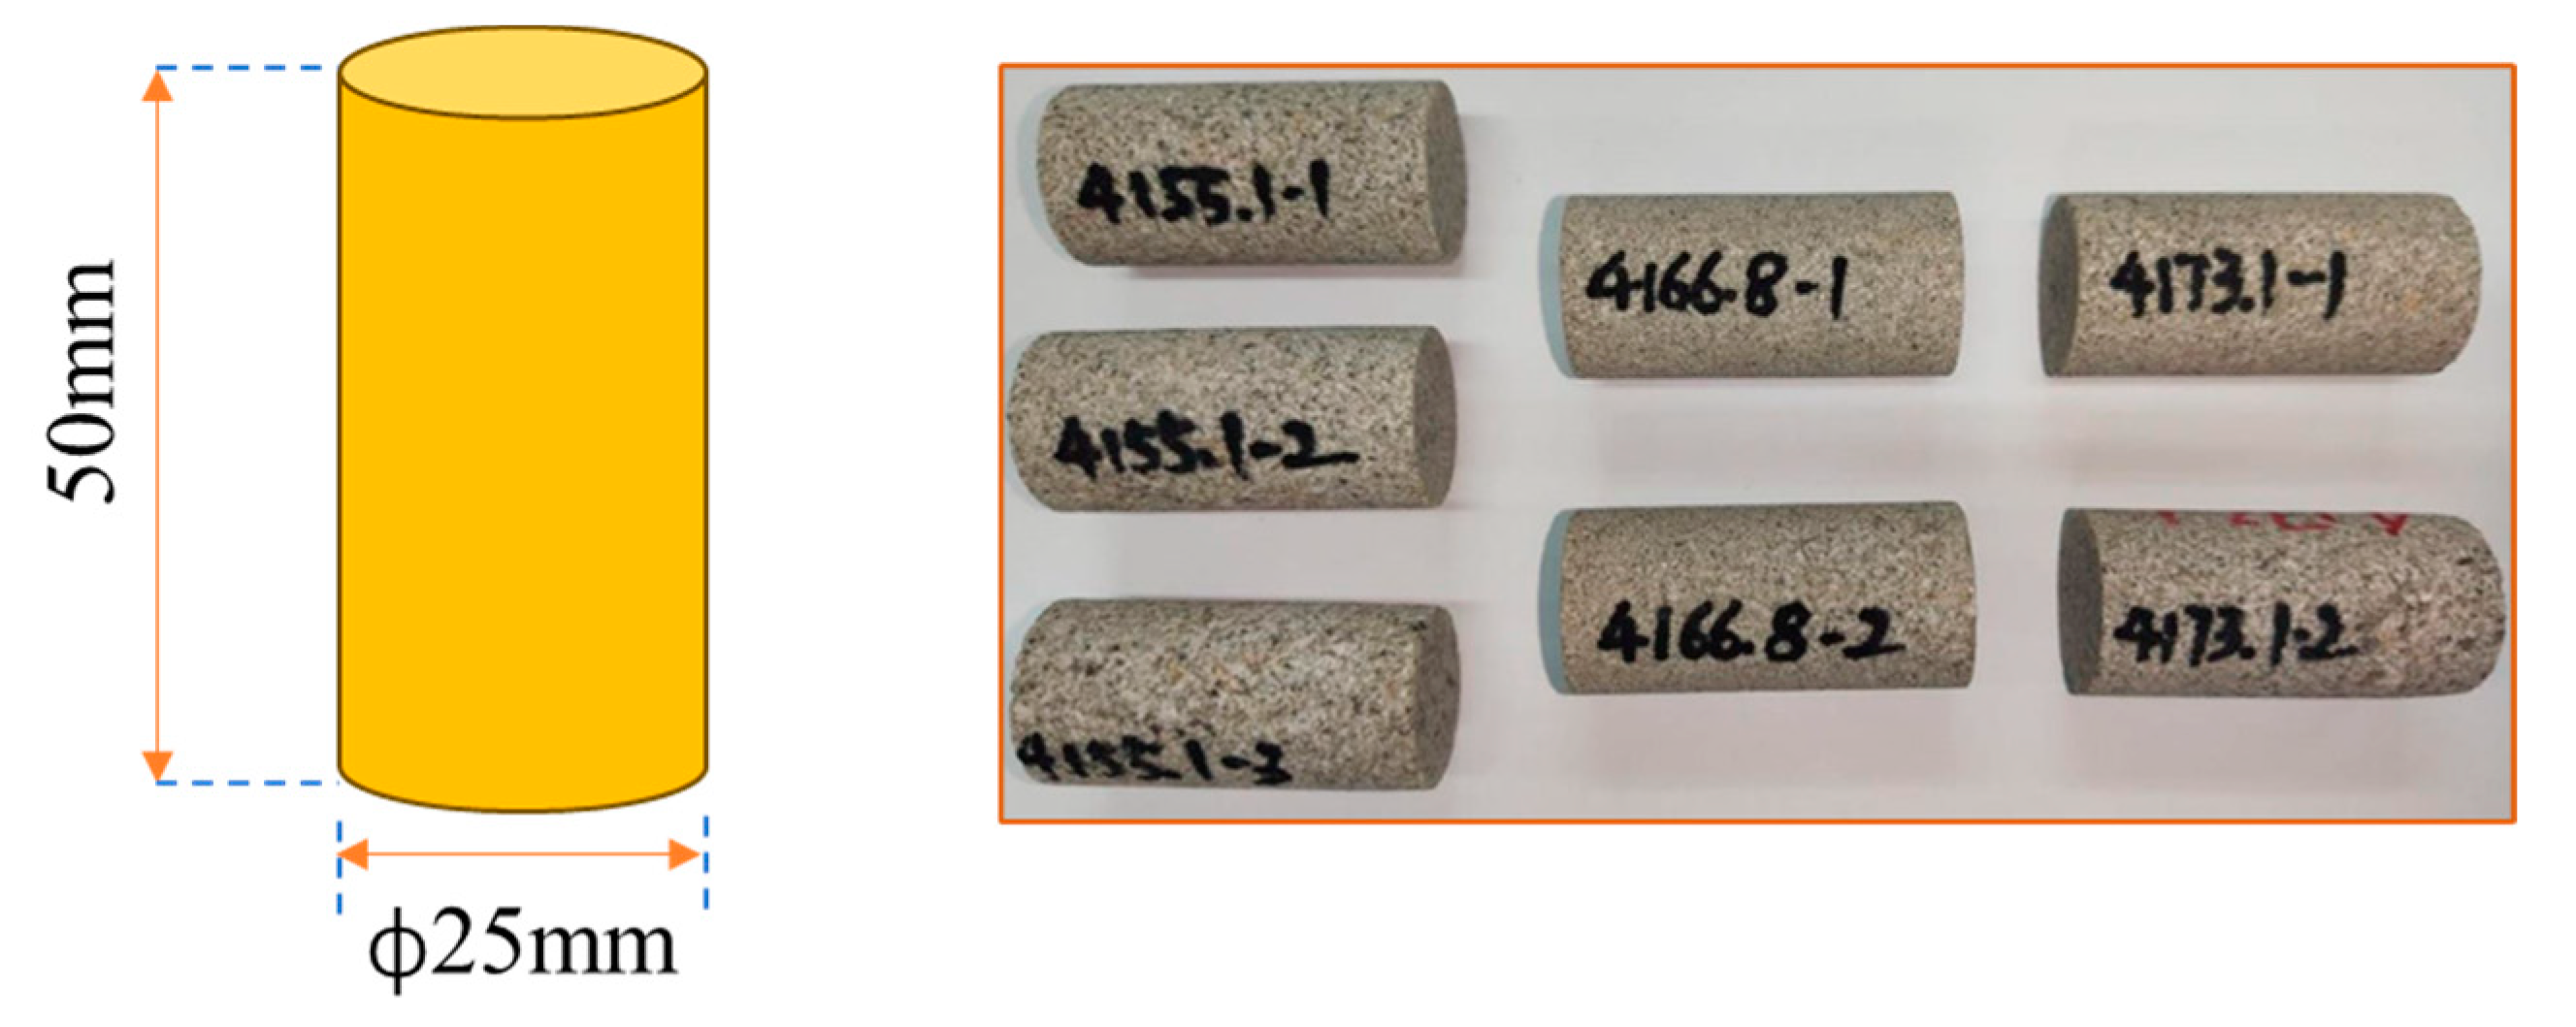
2.1. Sample Preparation
2.2. XRD Analysis
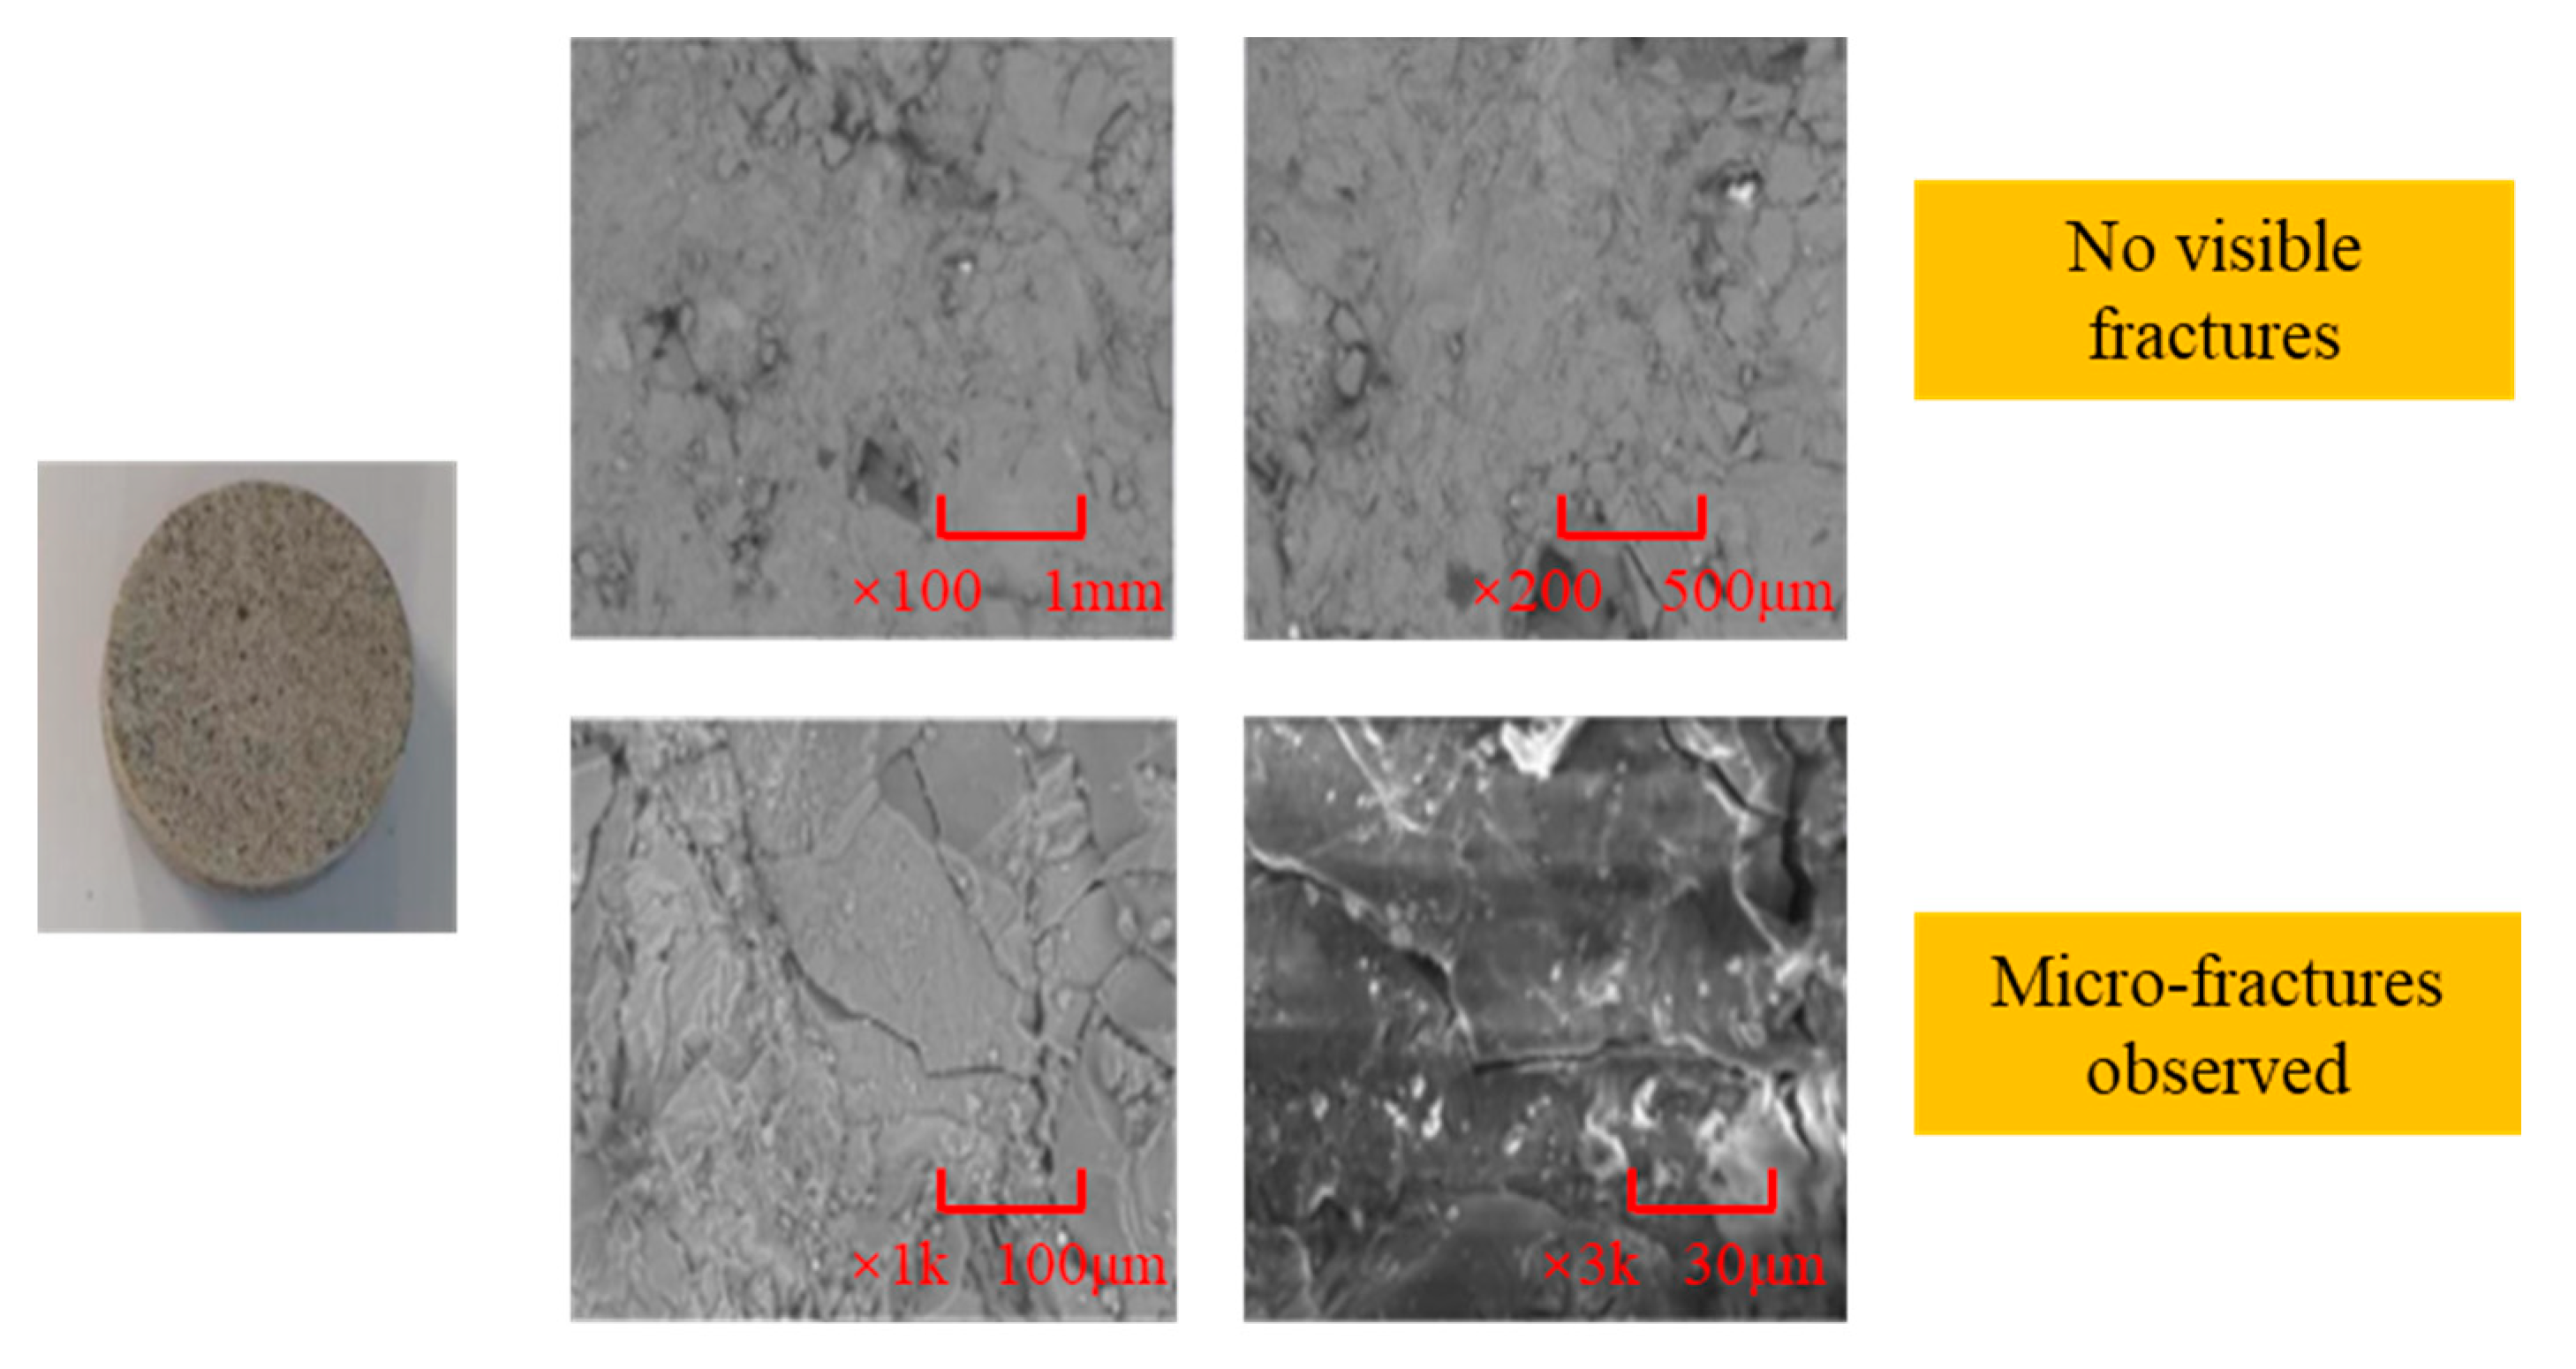
2.3. SEM
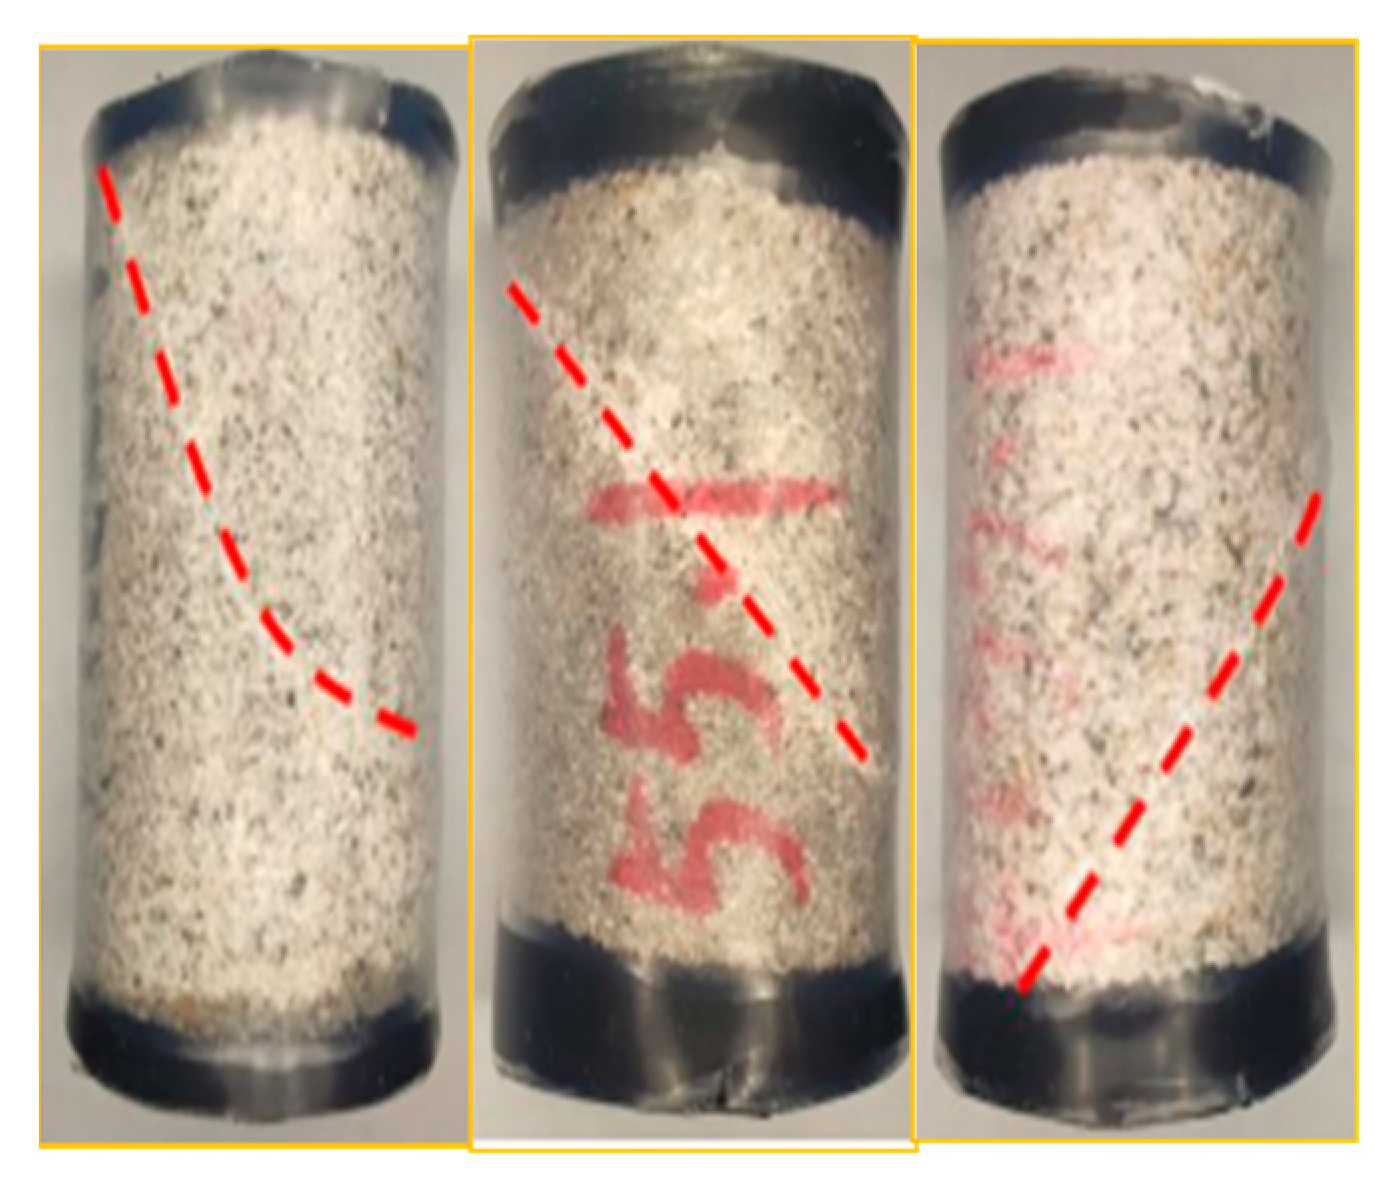
2.4. Triaxial Compression Experiment
2.5. Brazilian Splitting Test
2.6. Fracture Toughness Test
2.7. Acoustic Emission Experiment
3. Fracability Evaluation
3.1. Influencing Factors of the Fracability Index (FI)
3.1.1. Brittleness Index
3.1.2. Shear/Tensile Strength Factor
3.1.3. Fracture Toughness
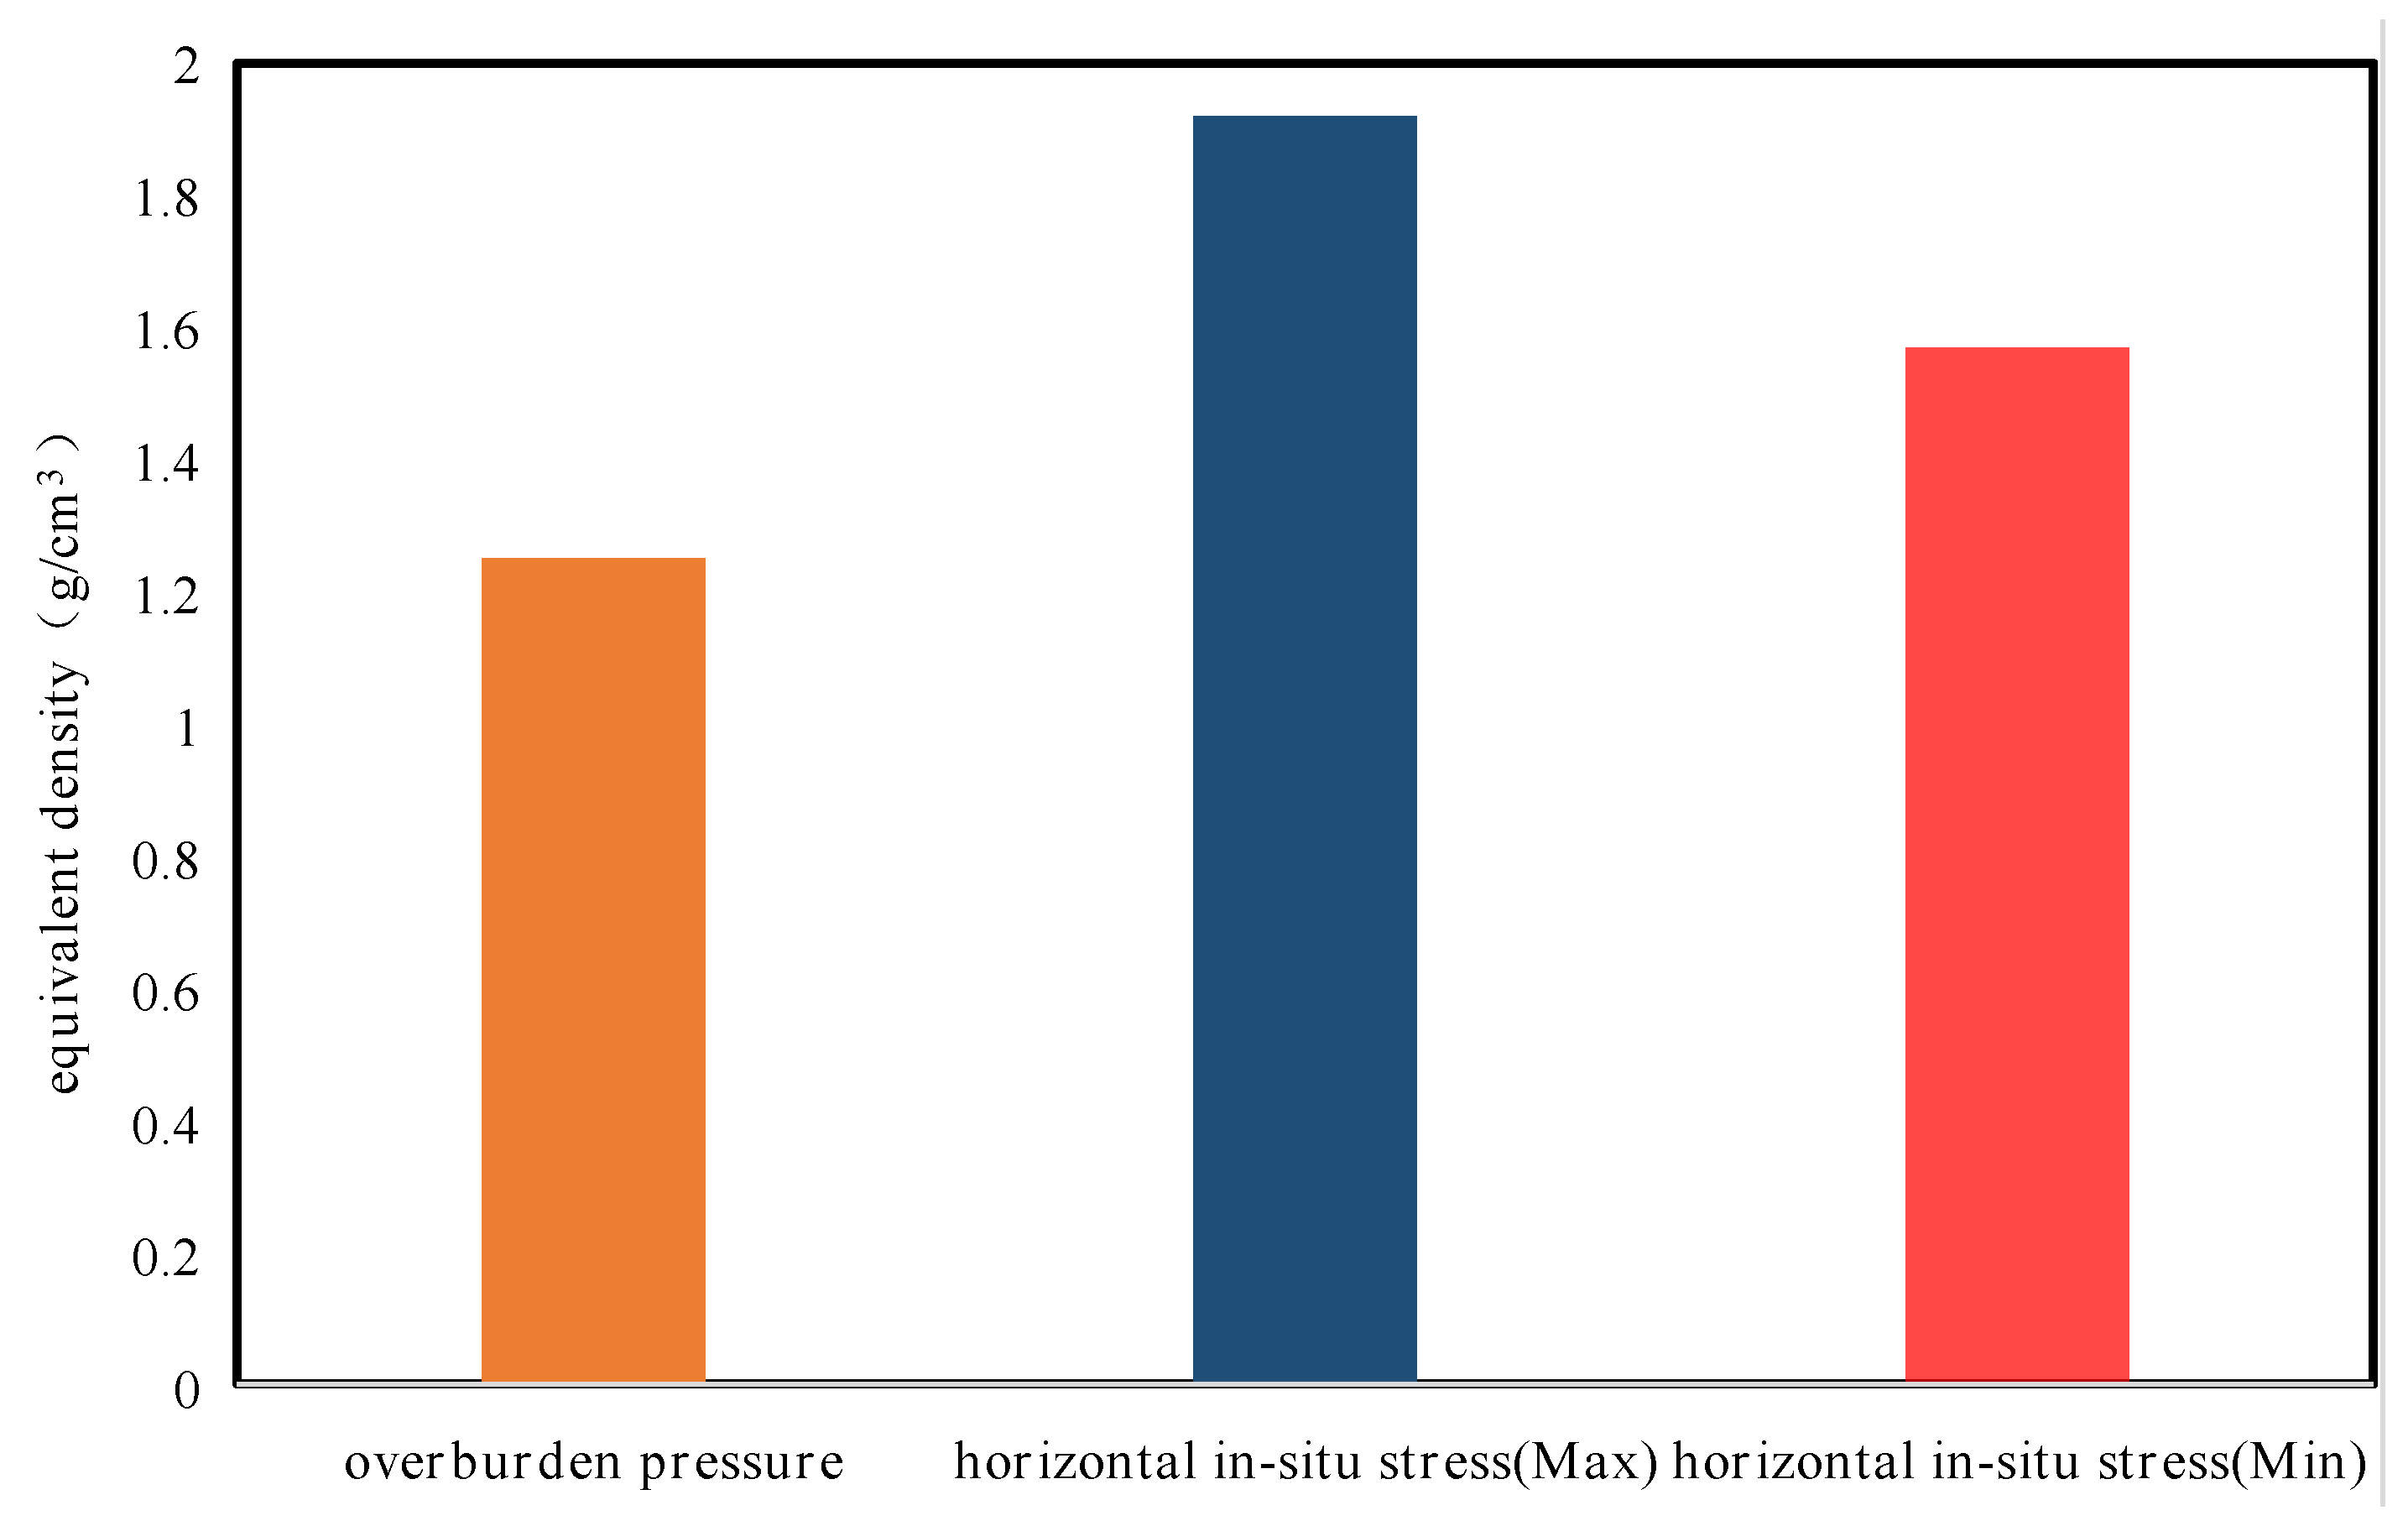
3.1.4. Horizontal Stress Difference Coefficient
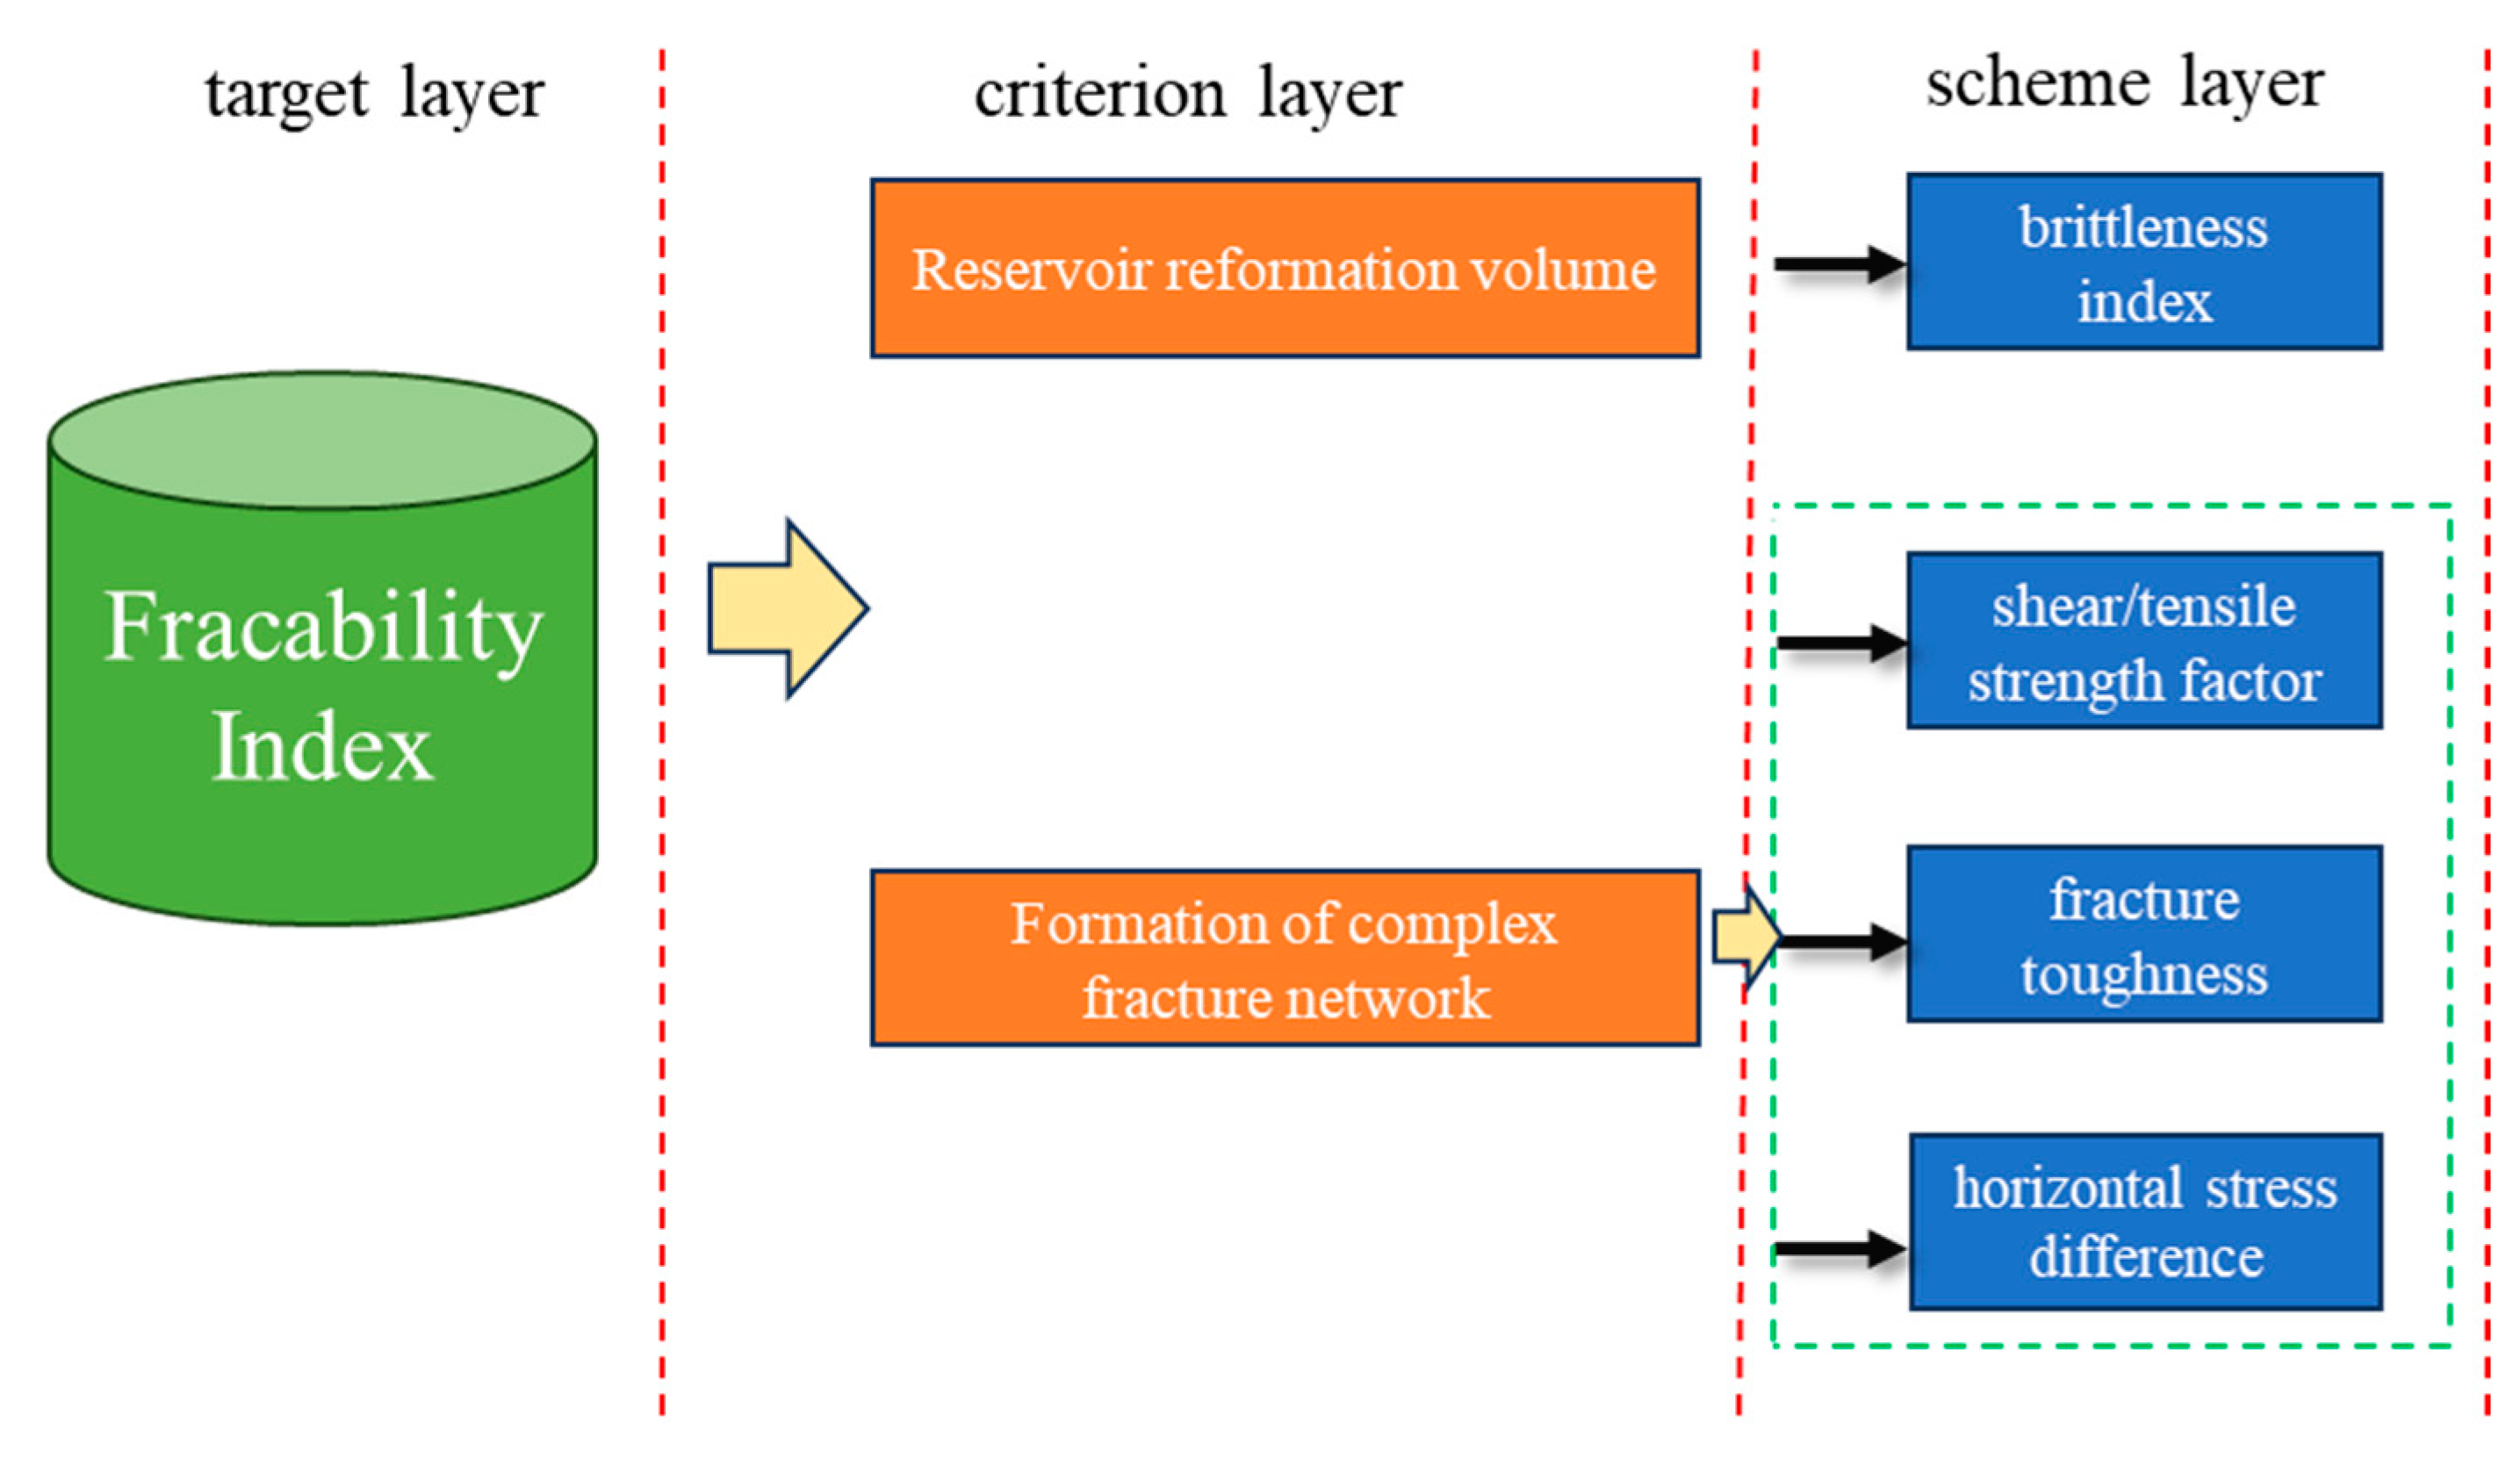
3.2. Evaluation Method
3.2.1. Determination of Weights
- Step 1.
- Establishment of recursive hierarchy
- Step 2.
- Construction of a comparison matrix
- Step 3.
- Determination of the weights and consistency of each factor
3.2.2. Parameter Standardization
4. Results and Discussion
4.1. Microstructure of Tight Sandstone
4.1.1. Mineral Composition
4.1.2. Natural Fracture
4.2. Mechanical Properties of Tight Sandstone
4.3. Evaluation Results
5. Conclusions
- (1)
- The Wenchang formation in Lufeng Sag exhibits a mineral composition characterized by “high quartz, high clay,” resulting in a high content of brittle minerals and a high brittleness index. This geological characteristic favors the fracturing process, facilitating the economic production of oil and gas.
- (2)
- The rock mechanics of the Wenchang formation in Lufeng Sag are characterized by a “high Young’s modulus, high compressive strength, high cohesion, and internal friction angle.” These attributes reflect the rock’s denseness. Additionally, the reservoir exhibits low tensile strength and low fracture toughness, indicating its potential to develop a complex fracture network after hydraulic fracturing.
- (3)
- An Analytic Hierarchy Process-based fracability evaluation model is developed for offshore low-permeability sandstone reservoirs, considering the formation’s ability to form an effective transformation volume and complex fracture network post-fracturing. This model incorporates factors such as shear/tensile strength, fracture toughness, and the horizontal stress difference coefficient.
- (4)
- The fracability index of the reservoir is calculated as 0.548 using the proposed evaluation model. Specifically, the interval from 4155.1 m to 4172.1 m is identified as a high-quality fractured formation. The findings of this study not only provide theoretical guidance for well and formation selection in the Lufeng Sag, but also have practical implications for enhancing oil and gas production from tight sandstone reservoirs.
Author Contributions
Funding
Institutional Review Board Statement
Informed Consent Statement
Data Availability Statement
Acknowledgments
Conflicts of Interest
References
- Qingming, C. Formation Mechanism of Middle-Deep Sandstone Reservoir of Eocene in Zhu I Depression, Pearl River Mouth Basin; Chengdu University of Technology: Chengdu, China, 2021. [Google Scholar] [CrossRef]
- Magoon, L.B.; Dow, W.G. The petroleum system. In The Petroleum System—From Source to Trap; Geologists Memoir 60; Magoon, L.B., Dow, W.G., Eds.; American Association of Petroleum: Tulsa, OK, USA, 1994; pp. 3–24. [Google Scholar]
- Burton, Z.F.M.; Moldowan, J.M.; Magoon, L.B.; Sykes, R.; Graham, S.A. Interpretation of source rock depositional environment and age from seep oil, east coast of New Zealand. Int. J. Earth Sci. 2019, 108, 1079–1091. [Google Scholar] [CrossRef]
- Schulz, H.M.; Yang, S.; Schovsbo, N.H.; Rybacki, E.; Ghanizadeh, A.; Bernard, S.; Mahlstedt, N.; Krüger, M.; Amann-Hildebrandt, A.; Krooss, B.M.; et al. The Furongian to Lower Ordovician Alum Shale Formation in conventional and unconventional petroleum systems in the Baltic Basin—A review. Earth-Sci. Rev. 2021, 218, 103674. [Google Scholar] [CrossRef]
- Bradshaw, M. Australian petroleum systems. Pet. Explor. Soc. Aust. J. 1993, 21, 43–53. [Google Scholar]
- Weimer, P.; Rowan, M.G.; McBride, B.C.; Kligfield, R. Evaluating the petroleum systems of the northern deep Gulf of Mexico through integrated basin analysis: An overview. AAPG Bull. 1998, 82, 865–877. [Google Scholar]
- Mello, M.R.; Peres, W.; Rostirolla, S.P.; Pedrosa, O.A., Jr.; Piquet, A.; Becker, S.; Yilmaz, P.O. The Santos Basin Pre-Salt Super Giant Petroleum System: An Incredible Journey from Failure to Success. In The Supergiant Lower Cretaceous Pre-Salt Petroleum Systems of the Santos Basin; Memoir 124; AAPG: Rio de Janeiro, Brazil, 2021; pp. 1–34. [Google Scholar] [CrossRef]
- Bjørlykke, K. Relationships between depositional environments, burial history and rock properties. Some principal aspects of diagenetic process in sedimentary basins. Sediment. Geol. 2014, 301, 1–14. [Google Scholar] [CrossRef]
- Burton, Z.F.M.; McHargue, T.; Kremer, C.H.; Bloch, R.B.; Gooley, J.T.; Jaikla, C.; Harrington, J.; Graham, S.E. Peak Cenozoic warmth enabled deep-sea sand deposition. Sci. Rep. 2023, 13, 1276. [Google Scholar] [CrossRef]
- Marghani, M.M.; Zairi, M.; Radwan, A.E. Facies analysis, diagenesis, and petrophysical controls on the reservoir quality of the low porosity fluvial sandstone of the Nubian formation, east Sirt Basin, Libya: Insights into the role of fractures in fluid migration, fluid flow, and enhancing the permeability of low porous reservoirs. Mar. Pet. Geol. 2023, 147, 105986. [Google Scholar]
- Peters, K.E.; Cassa, M.R. Applied source rock geochemistry. In The Petroleum System—From Source to Trap; Memoir 60; Magoon, L.B., Dow, W.G., Eds.; American Association of Petroleum Geologists: Tulsa, OK, USA, 1994; pp. 93–120. [Google Scholar]
- Hackley, P.C.; Cardott, B.J. Application of organic petrography in North American shale petroleum systems: A review. Int. J. Coal Geol. 2016, 163, 8–51. [Google Scholar] [CrossRef]
- Hollis, C. Diagenetic controls on reservoir properties of carbonate successions within the Albian–Turonian of the Arabian Plate. Pet. Geosci. 2011, 17, 223–241. [Google Scholar] [CrossRef]
- Soliva, R.; Ballas, G.; Fossen, H.; Philit, S. Tectonic regime controls clustering of deformation bands in porous sandstone. Geology 2016, 44, 423–426. [Google Scholar] [CrossRef]
- Burton, Z.; Dafov, L.N. Salt Diapir-Driven Recycling of Gas Hydrate. Geochem. Geophys. Geosyst. 2023, 24, e2022GC010704. [Google Scholar] [CrossRef]
- Hantschel, T.; Kauerauf, A.I. Fundamentals of Basin and Petroleum Systems Modeling; Springer Science & Business Media: Berlin/Heidelberg, Germany, 2009. [Google Scholar]
- Allen, P.A.; Allen, J.R. Basin Analysis: Principles and Application to Petroleum Play Assessment; John Wiley & Sons: Hoboken, NJ, USA, 2013. [Google Scholar]
- Shanley, K.W.; Cluff, R.M.; Robinson, J.W. Factors controlling prolific gas production from low-permeability sandstone reservoirs: Implications for resource assessment, prospect development, and risk analysis. AAPG Bull. 2004, 88, 1083–1121. [Google Scholar] [CrossRef]
- Lihong, Z.; Xuewei, L.; Daqi, F.U.; Dongping, L.; Xingsong, L.; Shengchuan, Z.; Gongquan, C.; Min, Z.; Fuchun, T.; Yudong, Z.; et al. Evaluation and application of influencing factors on the fracturability of continental shale oil reservoir: A case study of Kong 2 Member in Cangdong Sag. China Pet. Explor. 2019, 24, 670. [Google Scholar]
- Jin, X.; Shah, S.N.; Roegiers, J.C.; Zhang, B. Fracability evaluationin shale reservoirs:an integrated petrophysics and geomechanics approach. In Proceedings of the SPE Hydraulic Fracturing Technology Conference, The Woodlands, TX, USA, 4–6 February 2014; p. 168589. [Google Scholar]
- Enderlin, M.B.; Alsleben, H.; Beye, R.J.A. Predicting fracability in shale reservoirs. In Proceedings of the AAPG Annual Convention and Exhibition, Houston, TX, USA, 10–13 April 2011; pp. 10–13. [Google Scholar]
- Chong, K.K.; Griese, R.W.V.; Passman, A. A completions guidebook to shale play development: A review of successful approaches to wards shale play stimulation in the last two decades. In Proceedings of the Canadian Unconventional Resources and International Petroleum Conference, Calgary, AB, Canada, 19–21 October 2010; pp. 133–874. [Google Scholar]
- De, S.; Sengupta, D. Brittleness estimation and mineralogical analysis for evaluation of fracturability: Application to the Cambay Shale, Gujarat, India. In Proceedings of the American Geophysical Union, Fall Meeting 2020, Online, 1–17 December 2020. [Google Scholar]
- Fang, X.; Feng, H.; Zhang, Z.; Li, F. Brittleness index prediction method of tight reservoir based on grey correlation and analytic hierarchical process. Pet. Sci. Technol. 2023, 1–25. [Google Scholar] [CrossRef]
- Mullen, M.J.; Enderlin, M.B. Fracability Index-More Than Rock Properties. In Proceedings of the SPE Annual Technical Conference and Exhibition, San Antonio, TX, USA, 8–10 October 2012. [Google Scholar]
- Junliang, Y.; Jingen, D.; Dingyu, Z.; Dahua, L.; Wei, Y.; Chaogang, C.; Lijun, C.; Zijian, C. Fracability evaluation of shale gas reservoirs. Acta Pet. Sin. 2013, 34, 523–527. [Google Scholar] [CrossRef]
- Li, H. Research progress on evaluation methods and factors influencing shale brittleness: A review. Energy Rep. 2022, 8, 4344–4358. [Google Scholar] [CrossRef]
- Bai, X.; Li, Z.; Lai, F.; Wang, L.; Wu, D. Method for evaluation of engineering sweet spots tight sandstone reservoir production wells. Arab. J. Geosci. 2021, 14, 2826. [Google Scholar] [CrossRef]
- GB/T50266–99; The National Standards Compilation Group of People’s Republic of China. Standard for Tests Method of Engineering Rock Masses. Planning Press: Beijing, China, 1999.
- SL264–2001; The Professional Standard Compilation Group of People’s Republic of China. Specifications for Rock Tests in Water Conservancy and Hydroelectric Engineering. Water Power Press: Beijing, China, 2001.
- Guo, H.; Aziz, N.I.; Shmidt, L.C. Rock fracture toughness determination by the Brazilian test. Eng. Geol. 1993, 33, 177–178. [Google Scholar] [CrossRef]
- Atkinson, C.; Smelser, R.E.; Sanchez, J. Combined mode fracture via the cracked Brazilian disk test. Int. J. Fract. 1982, 18, 279–291. [Google Scholar] [CrossRef]
- Awaji, H.; Sato, S. Combined mode fracture toughness measurement by the disk test. J. Eng. Mater. Technol. 1978, 100, 175–182. [Google Scholar] [CrossRef]
- Chunlin, L.; Norlund, E. Assessment of damage in rock using the Kaiser effect of acoustic emission. Int. J. Rock Mech. Min. Sci. Geomech. Abstr. 1993, 30, 943–946. [Google Scholar]
- Holcomb, D.J.; Costin, L.S. Detecting damage surfaces in brittle materials using acoustic emissions. J. Appl. Mech. 1986, 208, 356–544. [Google Scholar] [CrossRef]
- Holcomb, D.J. General theory of the Kaiser effect. Int. J. Rock. Mech. Sci. Geomech. Abstr. 1993, 30, 929–935. [Google Scholar] [CrossRef]
- Yongdong, J.; Xuefu, X.; Jiang, X. Research on application of Kaiser effect of acoustic emission to measuring initial stress in rock mass. Rock Soil Mech. 2005, 26, 946–950. [Google Scholar]
- Hu, Y.; Guo, Y.; Qing, H.; Hou, Y. Study on influencing factors and mechanism of pore compressibility of tight sandstone reservoir—A case study of upper carboniferous in ordos basin. Front. Earth Sci. 2023, 10, 1100951. [Google Scholar] [CrossRef]
- Dou, L.; Zuo, X.; Qu, L.; Xiao, Y.; Bi, G.; Wang, R.; Zhang, M. A New Method of Quantitatively Evaluating Fracability of Tight Sandstone Reservoirs Using Geomechanics Characteristics and In Situ Stress Field. Processes 2022, 10, 1040. [Google Scholar] [CrossRef]
- Xu, W.; Zhao, J.; Xu, J. Fracability Evaluation Method for Tight Sandstone Oil Reservoirs. Nat. Resour. Res. 2021, 30, 4277–4295. [Google Scholar] [CrossRef]
- Li, J.; Li, X.R.; Zhan, H.B.; Song, M.S.; Liu, C.; Kong, X.C.; Sun, L.N. Modified method for fracability evaluation of tight sandstones based on interval transit time. Sci. Lett. 2020, 17, 477–486. [Google Scholar] [CrossRef]
- Zhang, D.; Ranjith, P.G.; Perera, M.S.A. The brittleness indices used in rock mechanics and their application in shale hydraulic fracturing: A review. J. Pet. Sci. Eng. 2016, 143, 158–170. [Google Scholar] [CrossRef]
- Obert, L.; Duvall, W.I. Rock Mechanics and the Design of Structures in Rock; John Wiley: New York, NY, USA, 1967; pp. 78–82. [Google Scholar]
- Ramsay, J.G. Folding and Fracturing of Rocks; Mc Graw-Hill: London, UK, 1967; pp. 44–47. [Google Scholar]
- Reuss, A. Berechnung der flieβgrenze von mischkristallen aufgrund der plastizitätsbedingung für einkristalle. ZAMM J. Appl. Math. Mech. 1929, 99, 49–58. [Google Scholar] [CrossRef]
- Jarvie, D. Finding bypassed or overlooked pay zones using geo-chemistry techniques. In Proceedings of the International Petroleum Technology Conference, Kuala Lumpur, Malaysia, 3–5 December 2008; pp. 12–18. [Google Scholar]
- Rickman, R.; Mullen, M.; Petre, E.; Grieser, B.; Kundert, D. A practical use of shale petrophysics for stimulation design optimization: All shale plays are not clones of the Barnett Shale. In Proceedings of the SPE Annual Technical Conference and Exhibition, Denver, CO, USA, 21–24 September 2008; pp. 115–258. [Google Scholar]
- Shuqian, D.; Xiating, F.; Quan, J.; Dingping, X.; Hong, X.; Guofeng, G. Experimental study of mechanical properties of staggered zones under loading and unloading conditions of high stresses. Chin. J. Rock Mech. Eng. 2016, 35, 1090–1101. [Google Scholar]
- Zoback, M.D.; Kohli, A.; Das, I.; McClure, M. The importance of slow slipon faults during hydraulic fracturing stimulation of gas shale reservoirs. In Proceedings of the SPE Americas Unconventional Resources Conference, Pittsburgh, PA, USA, 5–7 June 2012. [Google Scholar]
- Jianmeng, S.; Zhilei, H.; Ruibao, Q.; Jinyan, Z. Log evaluation method of fracturing performance in tight gas reservoir. Acta Pet. Sin. 2015, 36, 74–80. [Google Scholar]
- Lavrov, A. The Kaiser effect in rocks: Principles and stress estimation techniques. Int. J. Rock Mech. Min. Sci. 2003, 40, 151–171. [Google Scholar] [CrossRef]
- Saaty, T.L. The Analytic Hierarchy Process; McGraw Hill: New York, NY, USA, 1980. [Google Scholar]
- Saaty, T.L.; Vargas, L.G.; Dellmann, K. The allocation of intangible resources: The analytic hierarchy process and linear programming. Socio-Econ. Plan. Sci. 2003, 37, 169–184. [Google Scholar] [CrossRef]
- Vaidya, O.S.; Kumar, S. Analytic hierarchy process: An overview of applications. Eur. J. Oper. Res. 2006, 169, 1–29. [Google Scholar] [CrossRef]
- Ying, T.; Yun, X.; Lezhong, L.; Binhai, Z.; Shixin, J. Influence factors and evaluation methods of the gas shale fracability. Earth Sci. Front. 2012, 19, 356–363. [Google Scholar]
- Li, H.; Li, H.; Wang, K.; Liu, C. Effect of rock composition microstructure and pore characteristics on its rock mechanics properties. Int. J. Min. Sci. Technol. 2018, 28, 303–308. [Google Scholar] [CrossRef]
- Price, N.J. Fault and Joint Development in Brittle and Semi-Brittle Rock; Pergamon Press: Oxford, UK, 1966; pp. 221–240. [Google Scholar]
- Wen-Long, D.; Chao, L.; Chun-Yan, L.I.; Chang-Chun, H.U.; Kai, J.; Wei-Te, C. Dominant factor of fracture development in shale and its relationship to gas accumulation. Earth Sci. Front. 2012, 19, 212–220. [Google Scholar]
- Mian, C.; Yan, J. Study on the experiment for fracture toughness under confining pressure. Mech. Eng. 2001, 23, 32–35. [Google Scholar]
- Yan, J.; Xudong, Z. Determination of fracture toughness for deep well rock with geophysical logging data. Chin. J. Rock Mech. Eng. 2001, 20, 454–456. [Google Scholar]
- Yan, J.; Mian, C.; Huaiying, W.; Yang, Y. Study on prediction method of fracture toughness of rock mode II by logging data. Chin. J. Rock Mech. Eng. 2008, 27, 3630–3635. [Google Scholar]
- Yin, S.; Ding, W.; Zhou, W.; Shan, Y.; Xie, R.; Guo, C.; Wang, R.; Wang, X. In situ stress field evaluation of deep marine tight sandstone oil reservoir: A case study of Silurian strata in northern Tazhong area, Tarim Basin, NW China. Mar. Pet. Geol. 2017, 80, 49–69. [Google Scholar] [CrossRef]


| Aij | Meaning |
|---|---|
| 1 | Ai is equally important as compared to Aj |
| 3 | Ai is slightly more important than Aj |
| 5 | Ai is more important than Aj |
| 7 | Ai is more strongly important than Aj |
| 9 | Ai is definitely more important than Aj |
| 2, 4, 6, 8, | Median of two adjacent judgments |
| Well Depth (m) | Confining Pressure (MPa) | Young’s Modulus (GPa) | Poisson’s Ratio | Compressive Strength (MPa) |
|---|---|---|---|---|
| 4155.1–4172.1 | 30.37 | 0.28 | 212.13 | |
| 20 | 30.86 | 0.28 | 187.99 | |
| 30.52 | 0.24 | 201.86 | ||
| 31.28 | 0.28 | 251.59 | ||
| 30 | 31.10 | 0.26 | 216.35 | |
| 31.92 | 0.22 | 222.1 |
| Well Depth (m) | Lithology | Cohesion (MPa) | Angle of Internal Friction (°) |
|---|---|---|---|
| 4155.1–4172.1 | Tight sandstone | 45.31 | 33.47 |
| Tight sandstone | 41.01 | 31.10 | |
| Tight sandstone | 45.08 | 31.00 |
| Well Depth (m) | Thickness (mm) | Diameter to Thickness Ratio | Damage Load (N) | Tensile Strength (MPa) |
|---|---|---|---|---|
| 4155.1–4172.1 | 13.81 | 0.56 | 2309 | 4.34 |
| 13.65 | 0.56 | 2433 | 4.63 | |
| 13.47 | 0.55 | 1990 | 3.85 | |
| 13.61 | 0.56 | 2041 | 3.91 | |
| 12.36 | 0.55 | 2309 | 4.49 | |
| 14.03 | 0.57 | 1979 | 3.67 | |
| 13.62 | 0.56 | 1886 | 3.63 | |
| 12.11 | 0.54 | 1886 | 3.78 |
| Degree of Importance | Brittleness Index | Shear/Tensile Strength Factor | Fracture Toughness | Horizontal Stress Difference Coefficient |
|---|---|---|---|---|
| Brittleness index | 1 | 3 | 2 | 2 |
| Shear/tensile strength factor | 1/3 | 1 | 1/2 | 1/2 |
| Fracture toughness | 1/2 | 2 | 1 | 1 |
| Horizontal stress difference coefficient | 1/2 | 2 | 1 | 1 |
| W1 | W2 | W3 | W4 | CI | CR |
|---|---|---|---|---|---|
| 0.42 | 0.12 | 0.23 | 0.23 | 0.0035 | 0.0039 |
Disclaimer/Publisher’s Note: The statements, opinions and data contained in all publications are solely those of the individual author(s) and contributor(s) and not of MDPI and/or the editor(s). MDPI and/or the editor(s) disclaim responsibility for any injury to people or property resulting from any ideas, methods, instructions or products referred to in the content. |
© 2023 by the authors. Licensee MDPI, Basel, Switzerland. This article is an open access article distributed under the terms and conditions of the Creative Commons Attribution (CC BY) license (https://creativecommons.org/licenses/by/4.0/).
Share and Cite
Peng, C.; Zhou, J.; Wu, J.; Jiang, M.; Zhang, H.; Yin, B.; Liu, S.; Zhang, Y. Evaluation of Tight Sandstone Mechanical Properties and Fracability: An Experimental Study of Reservoir Sand−Stones from Lufeng Sag, Pearl River Mouth Basin, Northern South China Sea. Processes 2023, 11, 2135. https://doi.org/10.3390/pr11072135
Peng C, Zhou J, Wu J, Jiang M, Zhang H, Yin B, Liu S, Zhang Y. Evaluation of Tight Sandstone Mechanical Properties and Fracability: An Experimental Study of Reservoir Sand−Stones from Lufeng Sag, Pearl River Mouth Basin, Northern South China Sea. Processes. 2023; 11(7):2135. https://doi.org/10.3390/pr11072135
Chicago/Turabian StylePeng, Chengyong, Jun Zhou, Jianshu Wu, Mao Jiang, Hao Zhang, Biao Yin, Shanyong Liu, and Yan Zhang. 2023. "Evaluation of Tight Sandstone Mechanical Properties and Fracability: An Experimental Study of Reservoir Sand−Stones from Lufeng Sag, Pearl River Mouth Basin, Northern South China Sea" Processes 11, no. 7: 2135. https://doi.org/10.3390/pr11072135
APA StylePeng, C., Zhou, J., Wu, J., Jiang, M., Zhang, H., Yin, B., Liu, S., & Zhang, Y. (2023). Evaluation of Tight Sandstone Mechanical Properties and Fracability: An Experimental Study of Reservoir Sand−Stones from Lufeng Sag, Pearl River Mouth Basin, Northern South China Sea. Processes, 11(7), 2135. https://doi.org/10.3390/pr11072135