Article

Enhancing the Robustness of Scale-Free Networks: The Simulation of Cascade Failures with Adjustable Initial Load Parameters

College of Civil Aviation, Nanjing University of Aeronautics and Astronautics, Nanjing 211106, China
*
Author to whom correspondence should be addressed.
Processes 2023, 11(7), 2118; https://doi.org/10.3390/pr11072118
Submission received: 11 June 2023 / Revised: 12 July 2023 / Accepted: 14 July 2023 / Published: 16 July 2023
(This article belongs to the Section Automation Control Systems)

Abstract

:
A reasonable definition of nodes load and capacity is essential for improving the robustness of scale-free networks against cascading failure, which has gained significant attention over recent years. This paper presents two methods for defining the load-capacity model: a degree-based method and a betweenness-based method. In these methods, the initial load and capacity of nodes were determined by considering the degrees and betweenness centrality of nodes and their neighbors. These values could be adjusted using both global and local parameters. This paper achieved load redistribution during cascading failures through targeted attacks on network nodes. In addition, this study applied load redistribution to cascading failure processes in networks by targeting network nodes. In order to evaluate the effectiveness of the proposed approach, this paper examines the impact of adjusting two parameters on the minimum critical tolerance coefficient and network robustness. Computer-generated scale-free networks and a real network were used for evaluation purposes. The findings indicated that higher global parameters resulted in a lower average robustness index. Moreover, our degree-based method demonstrated a smaller minimum critical tolerance coefficient and average robustness index compared to existing load definition methods. Therefore, the proposed methods enhanced the robustness and integrity of scale-free networks against attacks.

1. Introduction

Complex networks are abstract models for understanding complex systems in the real world, and they are a valuable framework for understanding the interconnections among various elements in the real world, and research in this field is gaining significant traction among scholars. Numerous complex systems, in reality, can be effectively represented as complex networks [1,2,3,4], including transportation networks [5], power grids [6,7,8], social networks [9,10,11], and many other large-scale real networks. Scale-free networks exhibit a unique characteristic wherein a few hub nodes possess extensive connections, while the majority of these nodes have relatively few connections. This complex network structure significantly influences the evolution of cooperative behavior. To enhance the robustness of scale-free network systems, this collapse process of complex systems is often simulated and analyzed using cascading failure models. In a scale-free network, when a node fails, its load is redistributed to its immediate neighbor nodes. If the load exceeds the capacity of these neighboring nodes, the intricate interplay between network elements can trigger cascading failures on a large scale. Hence, it is crucial to properly distribute the initial node load in the scale-free network.
Cascading failure is a phenomenon observed in various real-life scenarios, including the transmission of diseases like COVID-19 (flu transmission) [12], traffic congestion [13], etc. When cascading failure occurs, the available nodes or edges commonly have to bear the load of failure nodes to maintain the regular network system’s function as much as possible. However, when a node or edge receives the assigned load, it is possible that its own total load is greater than its capacity. This leads to cascading failures in large and complex networks. To resist the cascading process, topology and flow control methods [14,15,16,17], such as link reconnection [14], link addition or removal [15], node load relief [16], flow homogenization [17], etc., are proposed. These methods are considered direct approaches as they are implemented during the spread of failures. These methods directly change the topology of the network, which is a tough issue in real life. Moreover, it takes a lot of human and financial resources to complete the relevant facilities in order to improve the robustness of the network. Additionally, there are numerous uncertainties associated with implementing these methods during the spread of failures. In recent years, researchers have been increasingly drawn to the advantages of initial load assignments, which can effectively reduce or prevent cascading failures without disrupting the operation of the network system. Motter et al. introduced a classical load-capacity model [18], which defined the node load as an intermediate characteristic of a network when network information was exchanged along the shortest path between nodes. Experimental studies have demonstrated that the heterogeneity of scale-free networks makes them particularly vulnerable to attack, as disabling a key node can trigger large-scale cascades. Building upon Motter’s classical load-capacity model [18], researchers have proposed a cascade failure model with adjustable parameters to control the initial load and capacity of the nodes. Additionally, the definition of the initial load in the model takes into account node importance metrics such as the shortest path and degree [18,19,20,21,22,23,24,25]. In terms of the load definition based on the shortest path, Refs. [18,19] consider that the initial load of nodes can be determined by the number of shortest paths passing through them. Qian et al. [20] adopted betweenness centrality to define the initial load of the node and constructed a 1000 BA scale-free network model using two methods. They demonstrated that in specific delay and tolerance coefficients, cascading failure can be avoided to some extent. Considering the load definition based on this degree, Refs. [21,22] proposed a cascading failure model that depended on adjusting weight parameters. These experiments indicate that optimizing parameters can enhance the robustness of the scale-free network. However, the literature [21,22] primarily focuses on the impact of cascading failure through the adjustment of node parameters alone. Since cascading failure propagation involves load redistribution between the nodes, the definition of a node’s initial load should also consider first-order neighbor nodes on the network’s resistance to destruction. Refs. [23,24,25,26] proposed a definition of the initial node capacity by multiplying the node’s degree with the degrees of its first-order neighbors using an adjustable parameter. They conducted a series of studies on network robustness based on this approach. Furthermore, when the initial load of the nodes was positively correlated with their degrees in scale-free networks, load assignment could benefit the network robustness [26]. However, these studies just adjusted the nodes and first-order neighbor nodes as a whole for a single parameter without considering the relationship between the nodes and first-order neighbor nodes.
In previous studies on initial load assignment, the initial load has often been defined in relation to one node importance metric such as degrees [22,26] and betweenness centrality [20], with the adjustment of a single parameter achieving optimal network robustness. During the process of cascading failure, the failure of a node can significantly impact its neighboring nodes. Therefore, in the process of cascading failures, defining the initial load of a node solely based on its degree and betweenness centrality can overlook the influence of first-order neighboring nodes on the network’s cascading failures. However, the current research that has considered both nodes and their first-order neighbor in defining the initial load has only taken them as a whole when studying adjustable parameters, which ignores the relationship between both of them. Therefore, it is necessary to adjust the global and local parameters of the nodes and their first-order neighbors to obtain the initial load effectively. In this paper, we propose two methods for defining the initial load and capacity: the degree-based method and the betweenness-based method. These two methods have two adjustable parameters: ω and θ . ω represents the local weight coefficient of the node and its first-order neighbors, and θ is the global coefficient that controls the overall load strength of the node. This definition allows for more comprehensive network system information, which is beneficial for identifying more robust load assignments. This method can be applied to both computationally generated scale-free networks and real scale-free networks. By adjusting the parameters, the network integrity and robustness can be optimized. The critical tolerance coefficient α c and average robustness index C F N were analyzed. In order to make comparisons, several existing load definition methods were also investigated. The experimental results showed that the degree-based method could significantly improve the network integrity and network robustness when the first-order neighbors were given a higher weight under the optimized θ . Our proposed methods contribute to robust load assignments against cascading failures in the scale-free network field.
The remainder of this paper is organized as follows. Section 2 describes the load-capacity model and the cascading failure process. Section 3 presents the simulation results, the analysis, the critical tolerance coefficient, and robustness. Section 4 concludes the study presented in this paper.

2. Methods

2.1. Load-Capacity Model

The degree and betweenness centrality [27] are two measures that describe the importance of nodes within a network. The degree of a node is defined as the number of edges that connect the node to its neighboring nodes. It assesses the importance of nodes based on local network topology information. On the other hand, the betweenness centrality of a node can be defined as the number of shortest paths that pass through this node. It captures the importance of nodes by obtaining global network topology information. The betweenness centrality of node i is generally calculated using the following formula:
B i = s i t σ s t ( i ) σ s t
where σ s t represents the whole number of the shortest paths from node s to t and σ s t ( i ) represents the total number of the shortest path passing throw node i.
In previous studies, load capacity [18] models in cascading failure models usually use the degree [22,26] and betweenness centrality [20] of a node to define its load and capacity in the network. However, in real networks, the flow is an interaction between pairs of nodes. Therefore, the load assignment on a node should be correlated with both the node itself and its neighbors. Based on this, we propose two methods to define the initial load:
  • The degree-based method with adjustable weighted parameters. We named this the DAW method.
    L i ( 0 ) = ω D i + ( 1 ω ) m τ i D m θ , i = 1,2 , . . . . . . , N
  • The betweenness-based method with adjustable weighted parameters. We named this the BAW method.
    L i ( 0 ) = ω B i + ( 1 ω ) m τ i B m θ , i = 1,2 , . . . . . . , N
In Equations (2) and (3), D i is the degree of node i and B i is the betweenness centrality of node i . τ i is the neighbor group of node i and N is the whole number of nodes in the network. θ is an adjustable parameter that controls the initial strength of L i ( 0 ) and ω is a weight coefficient that controls the weight contribution between the degree of node i and its neighbors. When ω = 0, only the contribution of the node neighbors is considered. When ω = 1, only the contribution of the node itself is considered.
In real networks, nodes usually have a certain tolerance to resist overloading failure. Therefore, we defined the capacity C i of node i by adding the tolerance coefficient α .
C i = ( 1 + α ) × L i ( 0 )
Based on Equation (4), the node in this network could be assumed to fail if the load L i ( t ) was larger than its capacity C i . It showed that a larger α could lead to larger C i , and make the node have a higher ability to resist overloading failure. However, the setting large node capacity in the network inevitably increases the cost. Therefore, we hope that the network can run normally with a lower α . It is meaningful for reducing the cost in real networks. The load-capacity model can be described as follows.
Step 1: Load calculation.
Calculate the load of each node by using the DAW or BAW method and normalize one of the smallest loads of nodes to 1 as the reference node.
Step 2: Unify the load.
Unify the load of the other nodes with the DAW or BAW method.
Step 3: Capacity calculation.
Calculate the capacity Ci of each node by Equation (4).

2.2. Cascading Failure Process

Cascading failure refers to a chain effect in networks, where the failure of certain nodes results in their neighboring nodes bearing the load and potentially failing if they become overloaded. Here, we assumed that nodes with a larger capacity would be assigned a greater share of the failure load during redistribution. This assumption aligns with reality, as nodes with larger capacities have a higher likelihood of avoiding overloading failures and should be prioritized to maintain the system’s functionality as much as possible. Therefore, when node i failed in the network, we assumed that the failure load would be redistributed to the neighbors, where L j ( t ) is proportional to the capacity of the neighbors, as shown in Equation (5).
L j ( t ) = L i ( t ) × C j m Ω i C m
where L i ( t ) represents the load of failure node i, and Ω i are the adjacent nodes of node i. m represents the element in set Ω i .
L j could be updated as:
L j ( t + 1 ) = L j ( t ) + L j ( t ) = L j ( t ) + C j L i ( t ) m Ω i C m
If L j ( t + 1 ) > C j , node i was assumed to be in a failure state. Figure 1 shows the process of the load redistributed to the neighbors after a node failed.
Based on this load redistribution, the cascading failure process is described as follows.
Step 1: Attacking node.
Attack the initial node to make it fail.
Step 2: Assignment of the failed load.
When the nodes fail, the failed load is assigned to their neighbors according to Equation (5).
Step 3: Receive failed load.
The neighbors receive the distribution load of the failed node and recalculate their own load L i ( t + 1 ) . If L i ( t + 1 ) > C i , set the node to the failure state and remove it. By contrast, if L i ( t + 1 ) C i , the node still works normally.
Step 4: Iteration.
Repeat steps 2 and 3 iteratively until the network reaches a balanced state where a giant connected component exists or global failure occurs.
An initial failure could be triggered by selecting nodes and attacking them [18]. When network failure stopped spreading, we could measure the network robustness by calculating the number of failed nodes C F i . However, network topology, in reality, is usually heterogeneous. In order to fairly quantify the robustness of the whole network, we failed each node in each cascading simulation and calculated the average C F N as:
C F N = i = 1 N C F i N ( N 1 )
From Equation (7), we could see that the lower value of C F N indicated higher network robustness.
In summary, the main process of the method is as follows first, a load-capacity model is established. The model first needs to calculate the initial load based on DAW and BAW methods, then unify the node load, and finally calculate the node capacity based on the load results. Second, the initial node is attacked, and its initial load is distributed to the neighboring nodes, which, in turn, triggers the cascade failure and calculates the average C F N . The flow chart of this method is shown in Figure 2.

3. Results and Discussion

Many real networks follow scale-free distribution (SF distribution) [18]. In this section, we generated BA scale-free networks with N = 1000 nodes at different average degrees k to test our method. We first focused on the critical tolerance coefficient that was required to maintain network integrity. Then, we studied the impact of the model parameters on the robustness of the networks. Finally, we applied our methods to investigate a real network while also considering several existing methods for comparison.

3.1. Analysis of Critical Tolerance Coefficient

In the cascading process, the neighbors of a failure node share the load of the failed node. It is known from the introduction in Section 2 that when a node fails, a redistribution of the load can be triggered based on Equation (5). To make the neighbors of the node in the network still available with the lowest cost, we should set a minimal α for the neighbors to bear the failure load. Then, if we attack each node in the network, we could obtain a critical tolerance coefficient α c to avoid initial failure spreading.
α c , L j ( t + 1 ) C j   f o r   α α c   a n d   j Ω i   a n d   i N .
where Ω i is the neighbor’s node-group for node i, and N represents the network nodes. Otherwise, when α < α c , the above conditions cannot be satisfied. It shows that a smaller α c means that the initial load assignment is more robust for resisting the occurrence of cascading failure. α c can be set to measure the network integrity. When α c is lower, it means the method can keep a higher network integrity under attack. In our method, different parameters led to different α c for the same network. We denoted the minimum one as α c m i n , which was different from the robustness index C S N shown in Equation (7) and was used as a key metric for measuring the performance of our method.
Firstly, we focused on the value of α c m i n influenced by parameter ω under a different average degree k . The results are shown in Figure 3 and Figure 4 and were averaged by 400 independent runs. The value of α c m i n increased with ω under DAW and BAW methods. This indicated that a smaller value of ω enabled the network to be more robust for triggering the occurrence of cascading failure. In other words, the greater contribution of node neighbors could maintain the integrity of the network. For different k s, α c m i n decreased gradually under the same ω . This indicated that the network with larger k s could better guarantee the integrity of the network. We also obtained the value of α c m i n under optimal parameter θ . For simplicity, we named it θ o p t . In addition, for different k s, we could find that θ o p t fluctuated with ω s in a certain range.
Several methods have been proposed to define the initial loads, including the degree (DM) [21,22], degree and neighbor degrees multiplication (DNM) [23,24,25], and betweenness centrality (BM) [19]. For comparison purposes, we present them as Equations (8)–(10), respectively.
L i = D i θ
L i = D i × m τ i D m θ
L i = B i θ
In the formulas, D i and B i represent the degree and betweenness centrality of the node i, respectively. In Figure 5, we investigate the α c m i n of the DM, DMN, BM, DAW and BAW under their own θ o p t . First of all, we found that α c m i n out of all the methods decreased with an increase in k . As can be seen, the smallest value of α c m i n could be obtained through the DAW method, and the sub-small α c m i n could be obtained through during the five methods for different k s. In addition, the DM and BM methods processed the largest and sub-largest α c m i n . This meant that the network integrity could be maintain through our methods with node tolerance, which was meaningful for reducing the node cost to avoid cascading failure. Particularly, for the networks with small k s, α c m i n could be significantly reduced using the DAW method.

3.2. Analysis of Robustness

Node tolerance represents the ability of nodes to resist overload failure [17]. According to Equation (4), the ability of nodes to withstand network failure could be enhanced by increasing α . In order to illustrate the influence of increasing the node capacity on the robustness of the network, some graphs plotted C S N as a function of α for different θ s in Figure 6 and Figure 7. In Figure 6 and Figure 7, C F N decreased as α increased, and C F N and θ had a negative correlation in BA scale-free networks. This meant that a larger value of θ s could enhance the network’s robustness against cascading failures to some extent because of the scale-free characteristic of the BA scale-free network. Most nodes have a small load, while only small parts of nodes have a large load. If we attack the node with a small load, it is difficult to trigger cascading failure in the BA scale-free network. With the increase in θ , the initial load assignment on the nodes correlates with the BA scale-free network scale-free topology characteristic and leads to higher network robustness.
In the above experiment, we discussed the critical tolerance coefficient and network robustness in BA scale-free networks, which seemingly presented contradictory analyses. The main reason for this was that the definitions of α c and C F N were different. α c focuses on avoiding failure spreading after the initial failure, while C F N focuses on the cascading failure results.
In order to obtain the ability of both to have a smaller critical tolerance coefficient and higher robustness, we compared our method with the DM, DNM, BM, DAW and BAW methods under their own θ o p t in Figure 8. All C F N s of the five methods decreased when the value of α increased. When α > 0.04 , the smallest C F N could be obtained through the DAW method, which meant that the performance of the DAW method was better than the other four methods in improving network robustness. When α < 0.04 , the BM method decreased faster than the other methods. Compared with the BM method, the DAW method had a lower critical tolerance, and its robustness was lower than the BM method. More importantly, the DAW method was faster than the BM method, which relied on global betweenness information. To sum up, the results suggested that the DAW method not only enhanced network robustness against cascading under the same node tolerance but also had the smallest critical tolerance to maintain network integrity while achieving the same C F N .

3.3. Real Networks

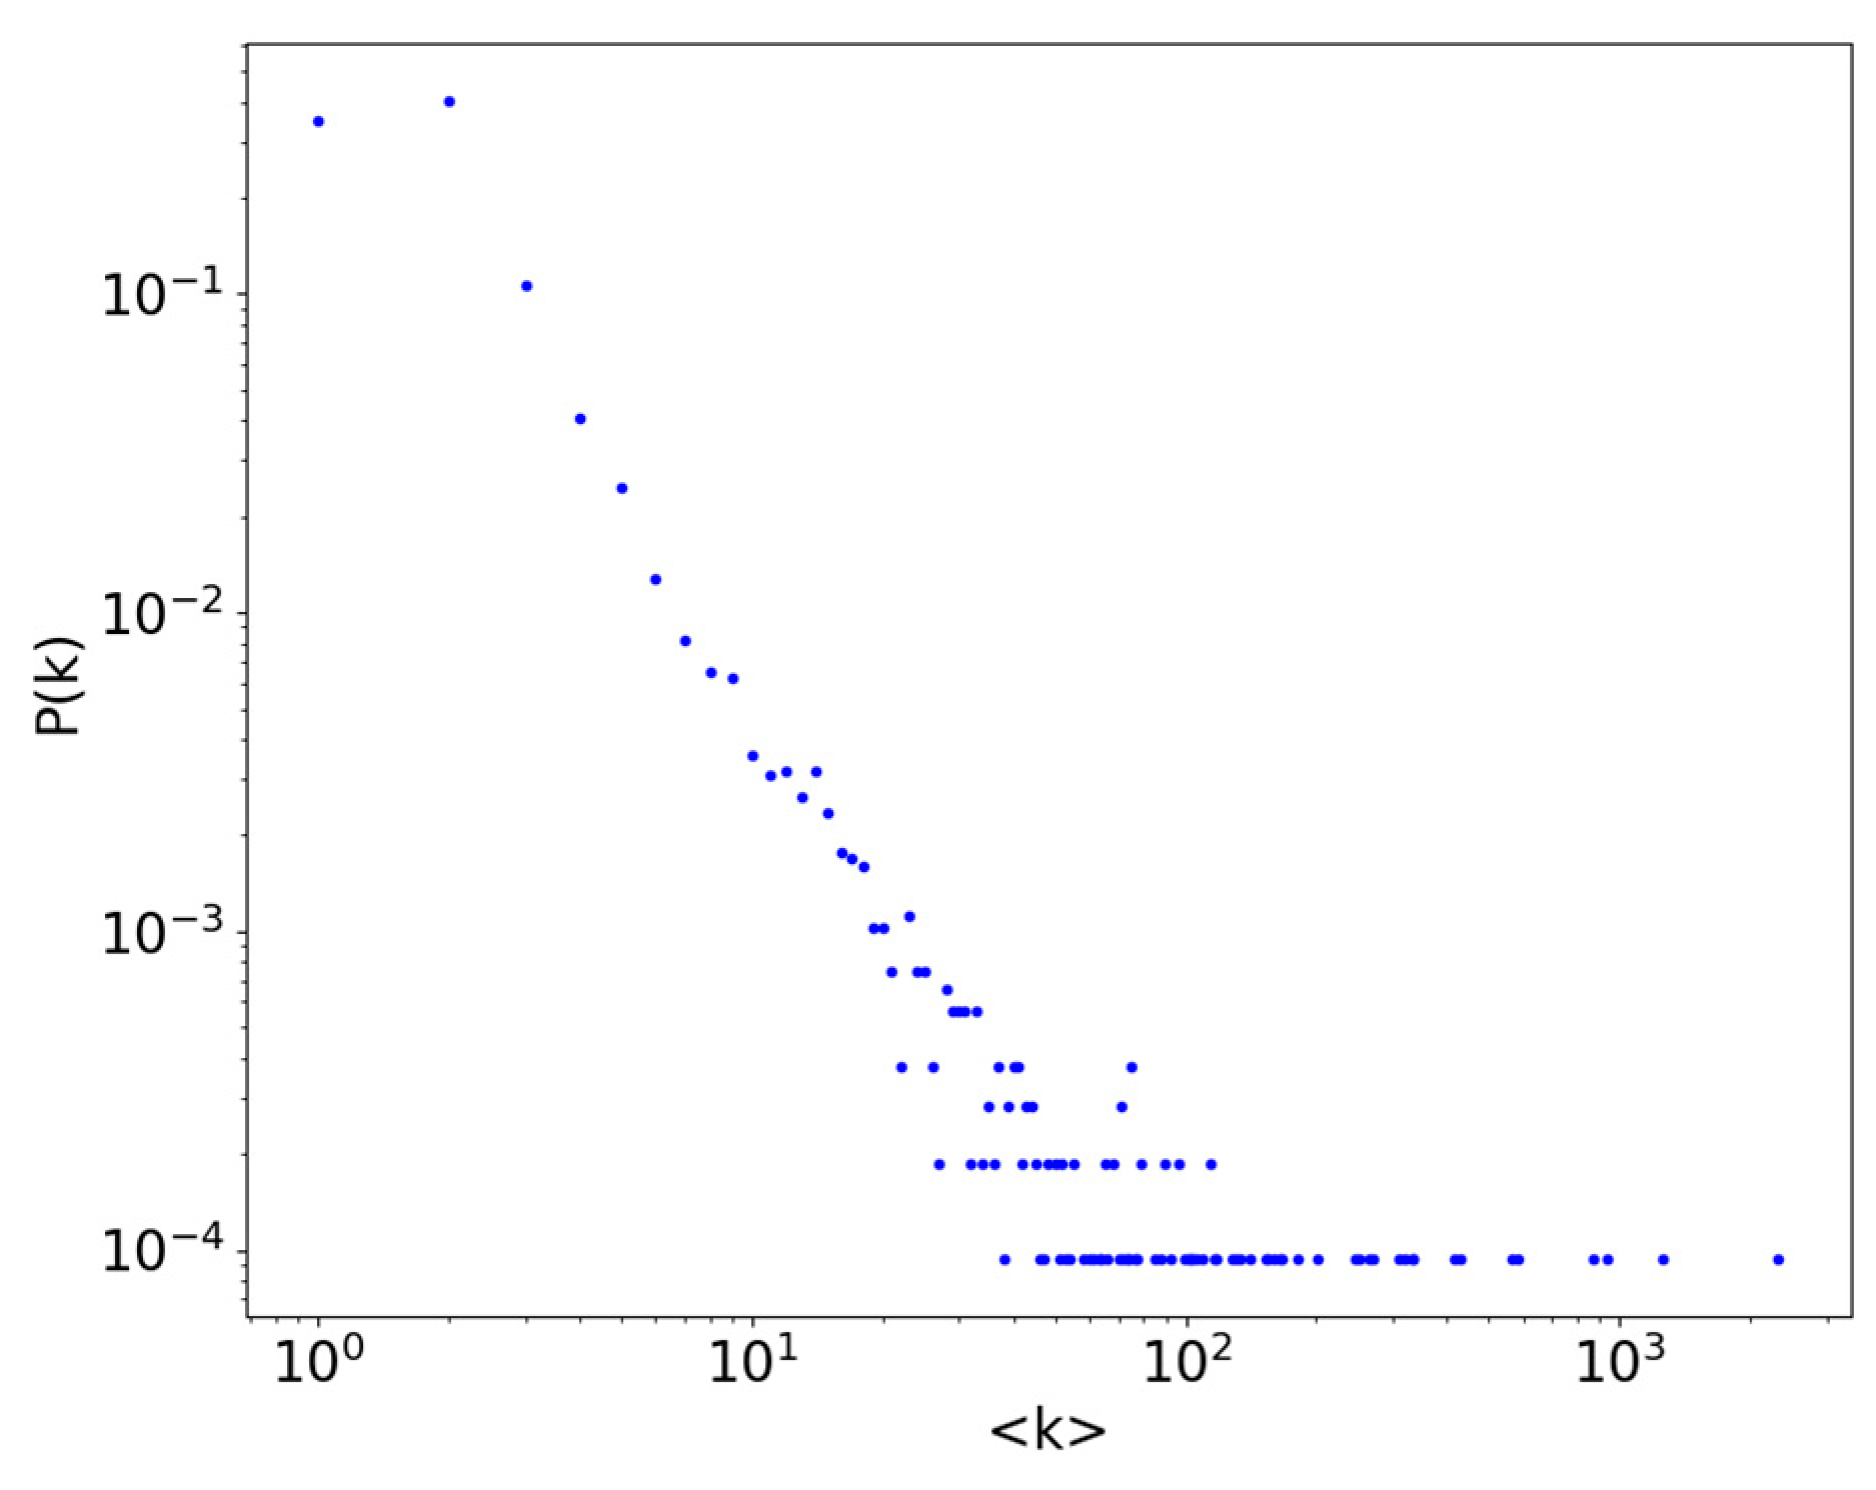
In this section, we applied our method to the Ohio AS network [28] while also investigating several existing methods using their respective optimal parameters. The Ohio AS network consisted of 10,672 nodes and 22,004 edges. To provide a brief overview of the network’s topology, we have plotted the degree distributions in Figure 9. The plot clearly illustrates that the AS network exhibited a significant power-law degree distribution.
Figure 9 compares the α c m i n of these methods for the AS networks, Figure 10 and Figure 11 shows the C F N of these methods as a function of α under θ o p t . From Figure 10, the DAW method is shown as obtaining the smallest α c m i n while the second smallest α c m i n was obtained by the DNM method. The DM method obtained the largest value of α c m i n . The result indicates that the DAW method could make the AS networks have higher integrity under attacks. From Figure 11, when α > 0.0 2, C F N decreased to below 0.2 for the BM and DAW methods. When α = 0.0 3, C F N of the DAW method was the smallest. In addition, the performance of our proposed BAW method was only better than the DM method for the AS network. The results presented above indicate that the DAW method is superior to existing methods in terms of its ability to resist network cascading failures.

4. Conclusions

Ensuring the stable operation of complex systems while minimizing costs is crucial for industries such as power grids, transport, and communications. For instance, in a power grid, a problem at a single node can result in cascading power interruptions due to load distribution. In this paper, we proposed DAW and BAW, two load definition methods, by considering the degree and betweenness centrality of the nodes and their neighbors, respectively. In these methods, the assignments of the initial node load could be flexibly adjusted by two parameters ω and θ . The experiment found that when optimized with θ , the larger contribution of node neighbors could lead smaller α c m i n . Additionally, three existing methods were also investigated for comparisons. The simulation experimental results demonstrated that the DAW outperformed other methods in terms of protecting network integrity and robustness against cascading failures. In addition, the DAW method depending on the local degree information operated faster than the methods that are based on node betweenness centrality. Therefore, studying network load distribution thresholds and robustness can effectively prevent cascade failures and minimize economic losses for investors.
In the future, we aim to research the cascading failure of networks triggered by different attack methods, such as random attacks, maximum traffic point attacks, etc. Additionally, we hope to continue our investigation into the initial load distribution of nodes and different attack strategies to conduct theoretical analysis and validation.

Author Contributions

Conceptualization, H.Z.; methodology, O.F.; validation, G.Z.; writing—original draft preparation, O.F.; visualization, O.F.; project administration, H.L. All authors have read and agreed to the published version of the manuscript.

Funding

This research was funded by the National Natural Science Foundation of China, grant number 71971114 and 52072068.

Institutional Review Board Statement

Not applicable.

Data Availability Statement

Not applicable.

Conflicts of Interest

The authors declare no conflict of interest.

References

  1. Watts, D.J.; Strogatz, S.H. Collective dynamics of ‘small-world’ networks. Nature 1998, 393, 409. [Google Scholar] [CrossRef] [PubMed]
  2. Aacute, B.; Si, A. Emergence of Scaling in Random Networks. Science 1999, 286, 509. [Google Scholar]
  3. Barabsi, A.L.; Albert, R.; Jeong, H. Mean-field theory for scale-free random networks. Phys. A 1999, 272, 173. [Google Scholar] [CrossRef] [Green Version]
  4. Ma, Y.; Zhao, R.; Yin, N. Application of an Improved Link Prediction Algorithm Based on Complex Network in Industrial Structure Adjustment. Processes 2023, 11, 1689. [Google Scholar] [CrossRef]
  5. Yin, X.; Wu, J. Simulation Study on Topology Characteristics and Cascading Failure of Hefei Subway Network. Sustainability 2023, 15, 422. [Google Scholar] [CrossRef]
  6. Rohden, M.; Jung, D.; Tamrakar, S.; Kettemann, S. Cascading failures in ac electricity grids. Phys. Rev. E 2016, 94, 32209. [Google Scholar] [CrossRef] [Green Version]
  7. Zhang, D.; Jia, L.; Ning, J.; Ye, Y.; Sun, H.; Shi, R. Power Grid Structure Performance Evaluation Based on Complex Network Cascade Failure Analysis. Energies 2023, 16, 990. [Google Scholar] [CrossRef]
  8. Yang, L.; Gu, Z.; Dang, Y.; He, P. Analysis of Vulnerability on Weighted Power Networks under Line Breakdowns. Entropy 2022, 24, 1449. [Google Scholar] [CrossRef]
  9. Hu, J.; Gao, S.; Yan, J.; Lou, P.; Yin, Y. Manufacturing enterprise collaboration network: An empirical research and evolutionary model. Chin. Phys. B 2020, 8, 88901. [Google Scholar] [CrossRef]
  10. Zhang, M.; Wang, Y. Network correlation between investor’s herding behavior and overconfidence behavior. Chin. Phys. B 2021, 29, 652. [Google Scholar] [CrossRef]
  11. Pereira, A.J.; Gomes, A.S.; Primo, T.T.; Rodrigues, R.L.; Júnior, R.P.M.; Moreira, F. Learning Mediated by Social Network for Education in K-12: Levels of Interaction, Strategies, and Difficulties. Educ. Sci. 2023, 13, 100. [Google Scholar] [CrossRef]
  12. Zhang, L. General growth model fitting and prediction of COVID-19 epidemic transmission. J. Electron. Sci. Technol. 2022, 3, 345. [Google Scholar]
  13. Luan, S.; Ke, R.; Huang, Z.; Ma, X. Traffic congestion propagation inference using dynamic bayesian graph convolution network. Transp. Res. Part C Emerg. Technol. 2022, 135, 103526. [Google Scholar] [CrossRef]
  14. Cao, X.; Hong, C.; Du, W.B.; Zhang, J. Improving the network robustness against cascading failures by adding links. Chaos 2013, 57, 35. [Google Scholar] [CrossRef]
  15. Hu, K.; Hu, T.; Tang, Y. Cascade Defense via Control of the Fluxes in Complex Networks. J. Stat. Phys. 2010, 141, 555. [Google Scholar] [CrossRef]
  16. Rui, Y.; Wang, W.; Lai, Y.; Chen, G. Optimal weighting scheme for suppressing cascades and traffic congestion in complex networks. Phys. Rev. E 2009, 79, 26112. [Google Scholar]
  17. Motter, A.E.; Lai, Y. Cascade-based attacks on complex networks. Phys. Rev. E 2002, 66, 65102. [Google Scholar] [CrossRef] [Green Version]
  18. Motter, A.E. Cascade Control and Defense in Complex Networks. Phys. Rev. Lett. 2004, 93, 98701. [Google Scholar] [CrossRef] [Green Version]
  19. Qian, Y.; Wang, B.; Xue, Y.; Zeng, J.; Wang, N. A simulation of the cascading failure of a complex network model by considering the characteristics of road traffic conditions. Nonlinear Dyn. 2015, 80, 413. [Google Scholar] [CrossRef]
  20. Wu, Z.; Peng, G.; Wang, W.; Chan, S.; Ming, W. Cascading failure spreading on weighted heterogeneous networks. J. Stat. Mech.-Theory Exp. 2008, 5, 5013. [Google Scholar] [CrossRef]
  21. Wang, J.; Rong, L.; Zhang, L.; Zhang, Z. Attack vulnerability of scale-free networks due to cascading failures. Phys. A 2008, 387, 6671. [Google Scholar] [CrossRef]
  22. Wang, J.; Rong, L. Cascading failures on complex networks based on the local preferential redistribution rule of the load. Acta Phys. Sin. 2009, 58, 3714. [Google Scholar] [CrossRef]
  23. Wang, J.; Rong, L. A model for cascading failures in scale-free networks with a breakdown probability. Phys. A 2009, 388, 1289. [Google Scholar] [CrossRef]
  24. Liu, J.; Xiong, Q.; Shi, X.; Kai, W.A.; Ws, A. Robustness of complex networks with an improved breakdown probability against cascading failures. Phys. A 2016, 456, 302. [Google Scholar] [CrossRef] [Green Version]
  25. Mizutaka, S.; Yakubo, K. Robustness of scale-free networks to cascading failures induced by fluctuating load. Phys. Rev. E. 2015, 92, 12814. [Google Scholar] [CrossRef] [Green Version]
  26. Newman, M.E.J. Scientific collaboration networks. II. Shortest paths, weighted networks, and centrality. Phys. Rev. E 2020, 64, 16132. [Google Scholar] [CrossRef] [Green Version]
  27. Mata, A.S.; Ferreira, S.C. Multiple transitions of the susceptible-infected-susceptible epidemic model on complex networks. Phys. Rev. E. 2014, 91, 12816. [Google Scholar] [CrossRef] [Green Version]
  28. Leskovec, J.; Kleinberg, J.M.; Faloutsos, C. Graphs over time: Densification laws, shrinking diameters and possible explanations. In Proceedings of the ACM SIGKDD International Conference on Knowledge Discovery and Data Minin, Chicago, IL, USA, 21 August 2005. [Google Scholar]
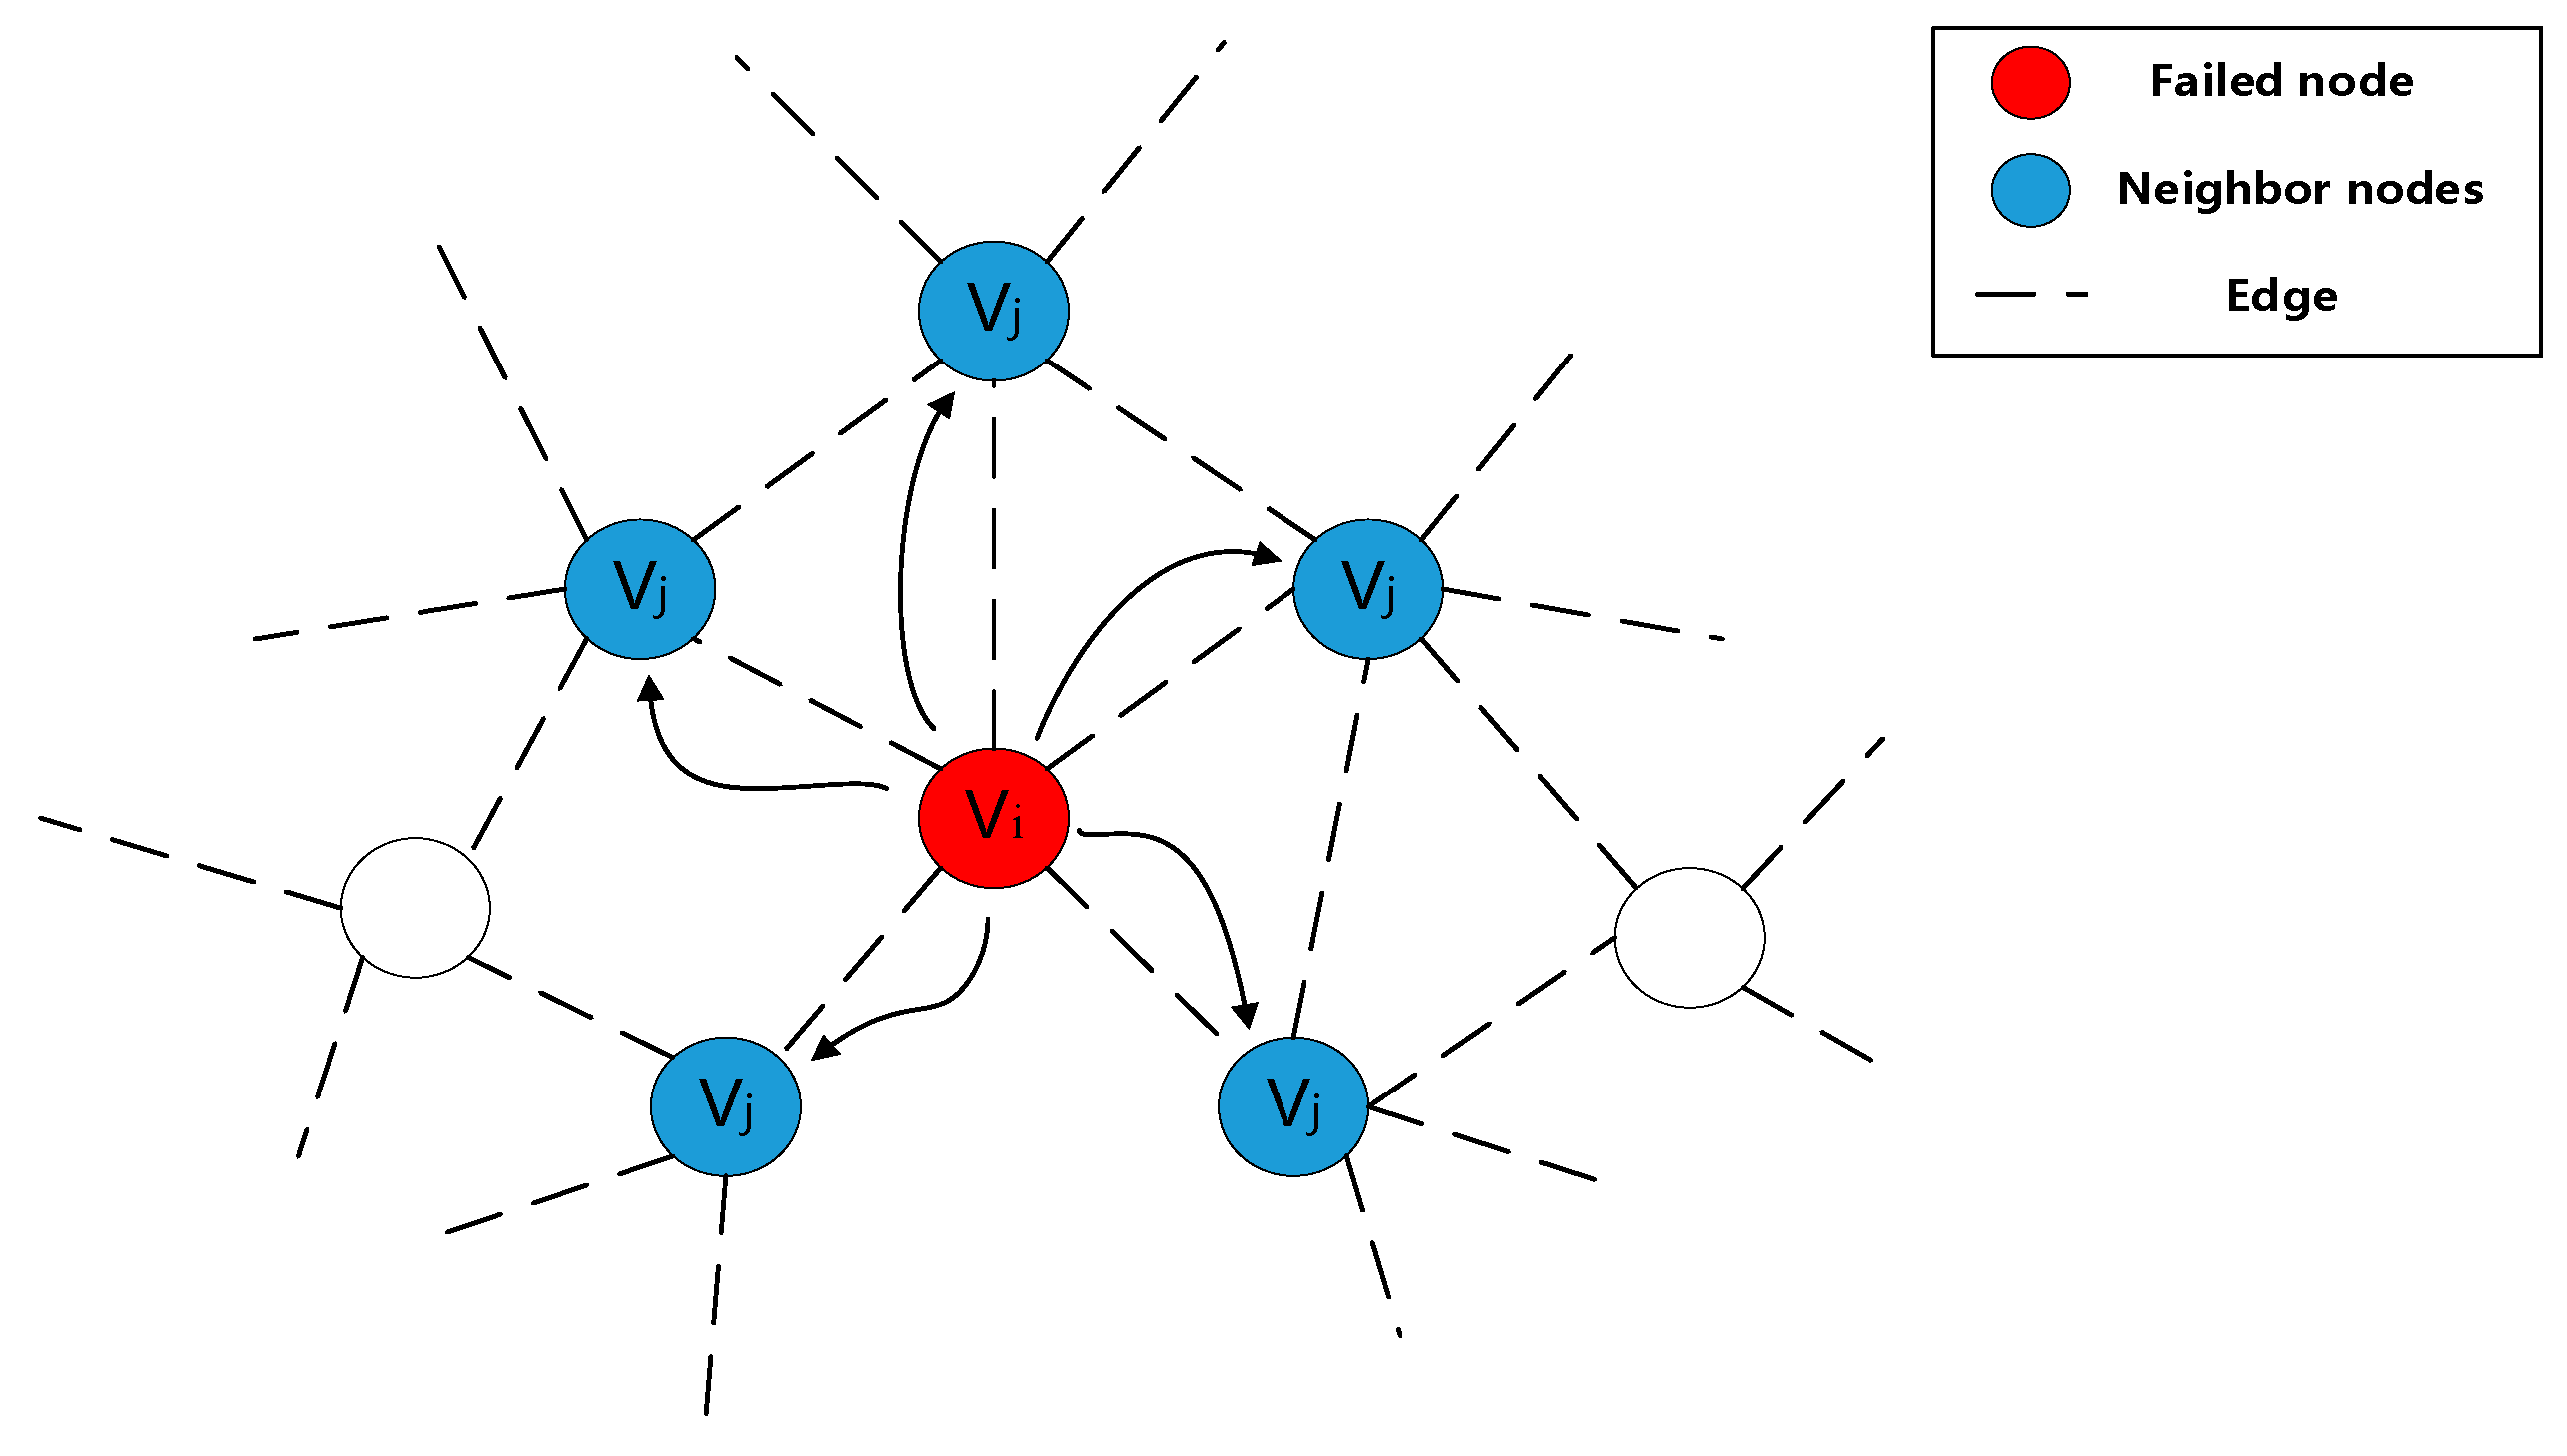
Figure 1. Load redistribution process when node i failed in the network.
Processes 11 02118 g001
Figure 2. The flow chart of the method.
Processes 11 02118 g002
Figure 3. The value of α c m i n influenced by the parameter ω and θ o p t under different. (a) k =6, (b) k = 10 and (c) k = 14 for DAW method.
Processes 11 02118 g003
Figure 4. The value of α c m i n influenced by the parameter ω and θ o p t under different. (a) k = 6, (b) k = 10 and (c) k = 14 for BAW method.
Processes 11 02118 g004
Figure 5. Comparison of α c m i n for the DM, DNM, BM, DAW and BAW methods.
Processes 11 02118 g005
Figure 6. C F N as a function of α for the scale-free networks with k = 6 (a) ω = 0 (b) ω = 0.5 and (c) ω = 1.0 for DAW.
Processes 11 02118 g006
Figure 7. C F N as a function of α for the scale-free networks with k = 6 (a) ω = 0 (b) ω = 0.5 and (c) ω = 1.0 for BAW.
Processes 11 02118 g007
Figure 8. The comparison result of the C F N with an increase in α for the DM, DNM, BM, DAW and BAW methods.
Processes 11 02118 g008
Figure 9. Degree distribution of AS network in Ohio, USA.
Processes 11 02118 g009
Figure 10. Comparison of α c m i n for the DM, DNM, BM, DAW and BAW methods.
Processes 11 02118 g010
Figure 11. Comparison of C S N as a function of α for the DM, DNM, BM, DAW and BAW methods.
Processes 11 02118 g011
Disclaimer/Publisher’s Note: The statements, opinions and data contained in all publications are solely those of the individual author(s) and contributor(s) and not of MDPI and/or the editor(s). MDPI and/or the editor(s) disclaim responsibility for any injury to people or property resulting from any ideas, methods, instructions or products referred to in the content.