Abstract
For this paper, an investigation into the differences in the aerodynamic performance of fans caused by installation heights was conducted using computational fluid simulation. The predictions presented in this paper are in great agreement with the experimental data. The results show that a vortex is observable on the side of the motor, as it first accelerates and then obviously decelerates while passing through the impeller inlet to the front of the blade passage. Higher motor installation heights result in a decrease in static pressure and static pressure efficiency at higher flow rates. At the maximum flow rate, the static pressure efficiency of the fan at a lower installation height increased by 10% with the original fan, and the static pressure coefficient increased by 23% as well. The results reported in this paper demonstrate that installation heights greatly affect the aerodynamic performance of an isolated centrifugal fan under higher flow rate conditions and that the range of fan operation is extended at reasonable heights.
1. Introduction
Isolated centrifugal fans are widely utilized in the field of air conditioning and ventilation systems. These fans have garnered significant attention from researchers who are conducting extensive studies on their aerodynamic performance. At present, many researchers are conducting extensive studies on the aerodynamic performance of fans, and their operational and aerodynamic characteristics are summarized herein to provide valuable references for their optimization of design, testing, and application.
The aerodynamic performance of fans is closely related to the parameters of speed, flow rate, and blade amount of the centrifugal fan [1,2]. With the rapid development of computer hardware and scientific algorithms, the computational fluid dynamic technique has been widely utilized in the modeling and simulation of fluid machinery, making it possible to determine its overall performance.
A centrifugal impeller was designed and manufactured based on a centrifugal volute. Both numerical simulation and experimental measurement were carried out. Results demonstrated that the performance of the centrifugal fan is better than that of a micro fan of the same size under the operation condition of high static pressure demands [3]. Wolfram studied the performance of three different sizes of volute-free centrifugal fans via experimental measurement and numerical simulation. A spiral vortex was found at the impeller inlet. Aerodynamic performance was disturbed due to the fluctuations in blade force as soon as the vortex core was swept by the blade’s rotation [4]. A non-volute centrifugal fan was validated experimentally and simulated numerically. The circumferential distributions of turbulent kinetic energy in the blade passage exhibited non-uniformity characteristics, and its locations varied periodically. This is due to the fact that higher turbulent kinetic energy was driven to the blade pressure surface in the vicinity of the wheel cover by the backflow of the blade passage [5].
As mentioned above, the aerodynamic performance of a fan is greatly affected by the design of the fan, especially in cases where unsteady force on the blade surface results in the serious deterioration of aerodynamic performance and aerodynamic noise [6]. Korakianitis used the CIRCLE method to improve the design of binary and terra-dimensional impeller blades, in which the curved surface curvature and curvature slope of the line between the leading edge and trailing edge of the blade were maintained as continuous distributions. Experimental data show that its aerodynamic behaviors and impeller efficiency were significantly improved [7]. The shunt blades were successfully involved in the fan’s optimized design because the detached vortex was weakened on the suction surface of the blade, and secondary flow within the passage was inhibited, but static pressure and static pressure efficiency were enhanced [8]. As a result, they provided essential references for optimizing fan design, testing procedures, and practical applications. Wu et al. took advantage of the bionics methodology to optimize the design of fan blades via numerical simulation [9].
In addition to numerical simulation techniques, mathematical tools such as neural networks and genetic algorithms are also utilized in the optimal design of fans. A lot of algorithms have also been applied to optimize fan design. The traditional strategies are primarily generated by a Bezier curve. A neural network algorithm is favorable for acquiring fan performance and further cutting the cost of fan testing based on the parameterized structure information, including blade installation angle, fan performance and structural parameters, and specific functions [10,11,12]. David developed a multi-objective automatic optimization process to enhance fan performance for rotating machinery based on a genetic algorithm, but it was limited for the blade profiles [13]. Class and shape transformation functions play a pivotal role in facilitating the parametric design of fan blades [14]. This is primarily due to the intricate relationship between fan efficiency and the unique shape of these profiles. Moreover, these transformative functions offer an extensive range of options for designers to experiment with different shapes and angles. Zhu developed an optimization approach that prioritizes fan efficiency utilizing Kriging models [14]. The prediction results indicate that the Kriging model exhibits a maximum accuracy error of approximately 0.81% when compared to the experimental data. In comparison with the prototype fan, the optimized fan successfully improves the distribution of flow field pressure and velocity, resulting in a 9.03% increase in outlet static pressure and a 2.35% improvement in efficiency [14].
Fan blades are a kind of primary component of fans, and their reasonable design plays important roles in improving performance. However, the cost of manufacturing blade shapes optimized by advanced mathematical algorithms is much higher than that of conventional airfoil blades. Although the collector and outer rotor motor are the non-work components, they also have great effects on performance despite having a relatively low cost. The inlet collector of the fan is used to orient to air evenly into the impeller, and the relative position between the inlet collector and the impeller will affect the shape of the clearance between the dynamic and static components, leading to effects on overall performances. Moreover, reasonable clearances are beneficial for optimized distributions of the flow field and pressure pulsation characteristics [15,16,17]. These studies have yielded valuable insights into the operational and aerodynamic characteristics of these fans.
Despite the development of a strategy that allow us to successfully optimize the performance of isolated centrifugal fans, the manufacturing costs associated with different techniques are still difficult to reduce in the context of the current optimized strategy. However, aerodynamic performances will deteriorate due to higher motor installation heights in the traditional assembly process, while directly installing the motor onto the fan wheel facilitates an external rotor motor.
In this study, an optimized method for determining the installation height of a motor is proposed to improve the efficiency of an isolated centrifugal fan. Also in this paper, the impact of the installation height of an external sub motor on the performance of an isolated centrifugal fan is investigated, and its mechanism is elucidated based on both predictive modeling and experimental data. At maximum flow rate, the static pressure efficiency of the fan installed at a lower height increased by 10% compared to the original fan, and the static pressure coefficient increased by 23% as well. This demonstrates that the performance of an isolated centrifugal fan is greatly affected by installation height under high flow rate conditions, and extending the range of fan operation can be achieved through reasonable height adjustments. The k-epsilon two-equation turbulence model was utilized. The inlet boundary condition was set to the flowrate boundary condition, and the as was the static pressure boundary condition. The flowrate was modified based on the acquired different flow coefficients. Multiple reference frame (MRF) steady calculation method was also used, as described later in this paper. A pair of dynamic and static interfaces were used for data transfer between the rotating part (impeller) and non-rotating part. A multiple reference frame was used for the rotating part (impeller). The rotating speed and torque of the impeller were used to obtain the simulation power of the fan. Under high flow conditions, the top surface of the motor was oriented perpendicular to the direction of airflow, and both sides of the high motor can be regarded as a stepped structure. Vortices tended to develop on the side of the motor. The axial height of the vortex was commensurate with that of the height of the motor extension into the impeller, and its presence resulted in the constriction of a normal flow passage.
2. Experimental Methods and Numerical Calculations
2.1. Fan Geometry Parameter
The isolated centrifugal fan is composed of a collector, impeller, and motor. The main parameters are shown in Table 1. The optimal operation point flow rate is 0.51 m3/s, with a corresponding rotational speed of 1500 revolutions per minute. Experimental studies on fan performance and turbulent flow using computational fluid mechanics were conducted to investigate the impact of two different motor installation heights.

Table 1.
Main parameters.
Figure 1 shows photographs of fans with two different motor installation heights. The motor installation height H refers to the distance from the top of the motor to the wheel of the impeller, which represents the vertical position of the motor relative to the impeller. For this particular model, its original motor installation height is 64.8 mm (H = 64.8 mm). The low motor installation height of the fan is 19.7 mm (H = 19.7 mm).
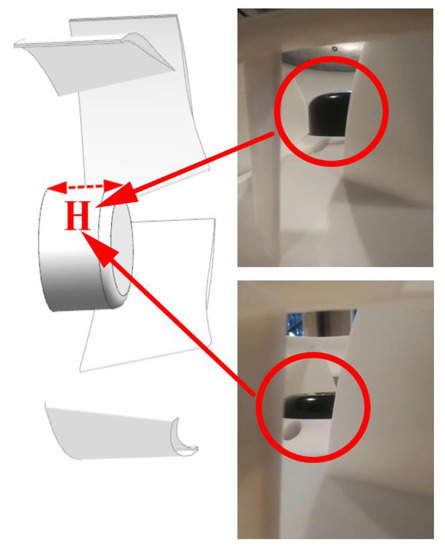
Figure 1.
Photographs of the fan with different motor installation heights.
2.2. Fan Test Method
The fan installation type employs the test method of free inlet and outlet configuration. The photograph of the testing site and a schematic diagram are presented in Figure 2. The static pressure of the fan is determined by measuring the pressure differential between the positive and negative pressure chambers using a pressure sensor, while the flow rate is calculated based on nozzle parameters [18,19]. The muffler section of each air chamber is equipped with four pressure measurement points. The flow is regulated by an automatic air valve combined with an automatic nozzle.
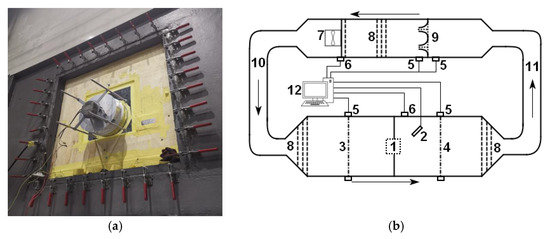
Figure 2.
Test system. (a) Fan outlet. (b) Test system diagram: 1 tested fan, 2 laser velocimeter, 3 negative pressure chamber, 4 positive pressure chamber, 5 pressure sensor, 6 temperature sensor, 7 auxiliary fan, 8 rectifier plate, 9 nozzle adjustment device, 10 air inlet pipe, 11 air outlet pipe, 12 general control console.
The entrance air is drawn from a large wind chamber through an inlet nozzle and discharged into the room, ensuring efficient ventilation and air quality control. The operating flow rate points are controlled by a combination of nozzles and an auxiliary fan. The flow rate is determined by applying the Bernoulli equation, which takes into account the pressure differential across the nozzles. Moreover, there are no eddy currents for the flow measurement. The pressure is determined as the average of four monitoring holes strategically positioned on the circumferential section of the chamber at a specific distance ahead and behind the nozzles. The flow rate Qm is calculated by the ∆Pst in front of and behind the nozzles [18,20].
where ai is the parameter of pipe in the fan performance test installation, which is mainly determined by the size of the wind box, the length of the pipes, and the size and quantity of the nozzles. di is the pipeline cross-sectional area. The static pressure of the isolated centrifugal fan can be determined by calculating the difference between the inlet and outlet static pressure.
The static pressure efficiency η of the fan can be expressed as
where Pst denotes static pressure, Pd denotes dynastic pressure, and η is efficiency, and N is power.
2.3. Numerical Calculation Method
In this paper, two simplified calculation models are established according to the experimental design. The blades and extension sections of the inlet and outlet are the same, but the differences lie in the height of the motor, indicating that it is represented by the mark of mesh division zones. Multiple reference frame (MRF) steady calculation method is used in the paper. Figure 3 shows the computational domain, including the inlet domain, outlet domain, and impeller. Except for the impeller calculation domain, it is also necessary to set up the calculation domain of the inlet and outlet extension sections; the shelters should be positioned at a distance that is 5 times away from the diameter based on the experimental design. Thus, the extension section of the entrance and exit are lengthened and widened. The air flow of the centrifugal fan enters axially and exits radially are considered, as shown in Figure 3a, meaning that the size of the outlet–inlet extension sections are 6D × 2.5D and 5D × 7.5D, respectively.
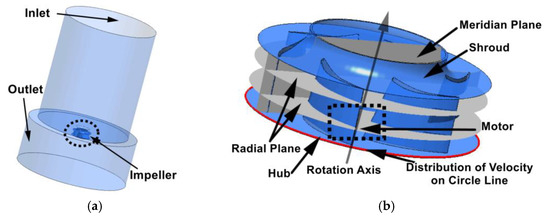
Figure 3.
Fan computational domain. (a) Simulation domain; (b) impeller.
The governing equations are the continuity equation and the momentum equation [21]. The numerical simulation follows mass and energy conservation and Newton’s second law. The flow in the whole simulation can be considered as incompressible fluid flow, with no heat transfer in the process. Fluent software is used for the solution of fan flow field.
where ρ is the density of fluid, U is the velocity vector, p is the translation pressure, and ν is the viscosity coefficient, respectively. The turbulence model k-ε is adopted [22,23]:
where xi are the components of x, y, and z in the coordinate system of cartesian in corresponding directions, where Cε1 = 1.44, Cε2 = 1.92, σk = 1.0, σε = 1.3, Pεk, Pεb represents the energy term generated by buoyancy, and Pk is used to generate the turbulent kinetic energy caused by viscous forces [18]. The upwind discretization is utilized for the convection terms, while central difference schemes are employed for the diffusion terms [23]. Due to the simplified assumption made in the above-mentioned turbulent model, the advanced large eddy simulation should be developed in the next step [24,25,26]. A dimensionless analysis method is employed using pressure and flow rate.
3. Results and Discussion
3.1. Experimental Validation for Modeling and Simulation
This study investigates the impact of installation heights on the performances of centrifugal fans through experimental and numerical simulation methods. The commercially available software Fluent was used to conduct modeling and simulation. The grid-independence tests using 3.21 million, 4.27 million, 7.09 million, and 7.88 million mesh systems are shown in Figure 4. The red dotted line indicates the experimental data. The 7.45 million scheme was chosen for its economic CPU time and ability to achieve a static pressure error of less than 1%.
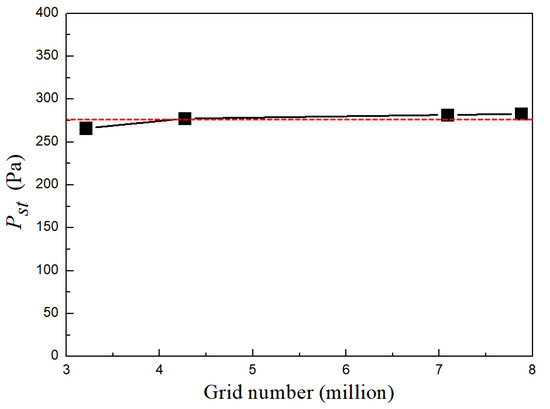
Figure 4.
Grid number with static pressure.
The prediction results for two different motor installation heights were validated successfully after comparison with the experimental data, yielding an acceptable level of errors, as shown in Figure 5. HM-E and HM-S represent the experimental and simulation data using the model with a higher motor installation location. LM-E and LM-S represent the experimental and simulation data for the model with a lower motor installation height.
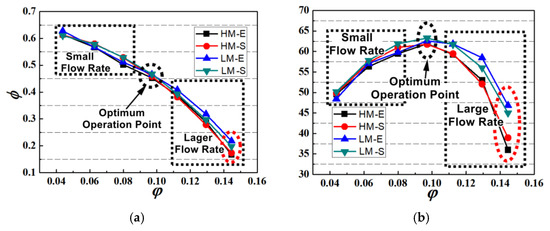
Figure 5.
Comparison of experimental and simulation results. (a) Static pressure coefficient—flow rate; (b) static pressure efficiency—flow rate.
It can be seen from Figure 5 that the static pressure value and static pressure efficiency at higher and lower positions of fans are nearly identical for smaller or standard operation conditions, which is a trend that is antithetical to that of the higher flow rates. In terms of performance, a lower installation height significantly outperforms a higher one, especially for the maximum flow rate, as evidenced by the fact that the values for the lower height increased by 10% and 23%, indicating that installation height greatly affects aerodynamic performance. Therefore, reasonable heights are beneficial for extending the operation range of the fan.
3.2. Effect of Smaller Flow Rate Conditions
The flow coefficient for the smaller flow rate was set to 0.0444. Figure 6 shows the streamline on meridian plane at higher and lower installation positions. The distributions of streamlines of the two models are similar. Along the hub side, fluid passes through the effective flow channel at the impeller entrance because the flow channel is blocked by fluid in the middle of the impeller. It can be observed that there is a negligible impact at a lower flow rate.
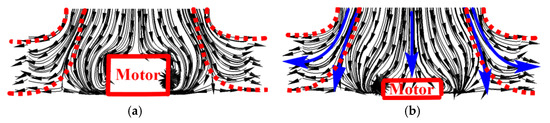
Figure 6.
Streamline on the meridian plane of the fan under a low flow rate. (a) Original model; (b) low-motor model.
The velocity contours on the meridian plane of both models are shown in Figure 7. The lower-speed regions are both observed in the middle of the fan impeller. The meridian plane is divided into two parts, and velocity in these lower-speed regions approaches zero. Although the installation heights of motor cause variations in lower-speed regions, these regions extend axially from the motor to the impeller entrance. Meanwhile, the velocity contours of the flow region on the meridian plane are not affected by installation height.
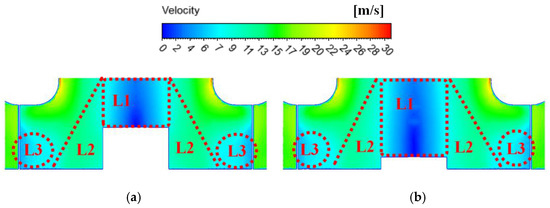
Figure 7.
Meridian velocity contour under low flow rate. (a) Original model; (b) low-motor model.
3.3. Analysis of Calculation Results for Large Flow Conditions
The flow coefficient was set to 0.145, a higher flow rate. As shown in Figure 8a, the upper surface of the motor is oriented perpendicular to the direction of flow. Both sides of the higher motor are simplified into a stepped structure, which is favorable for the formation of vortexes on the motor sides. The axial height of these vortices is approximately equal to that of the motor. Vortexes in middle passage can easily reduce the effective impeller area within the flow channel, where they are accelerated initially and decelerate subsequently as they pass through the impeller. From Figure 8a, it is evident that the cross-sectional areas in the middle flow channel are smaller than both the inlet and outlet of the impeller, leading to an acceleration section (U) and a deceleration section (D). In Figure 8b, the flow channel in the lower motor model is slightly affected by the motor due to the smaller length of both the impeller and vortex; this aligns with the predictions made by the authors of Ref. [4].
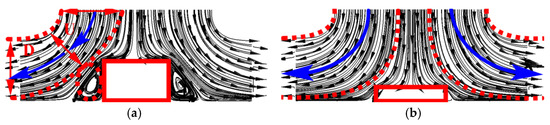
Figure 8.
Meridian streamline under a larger flow rate. (a) Original model; (b) low-motor model.
The analysis presented in Figure 9 clearly demonstrates that variations in installation height have no significant impact on the velocity distributions within the first zone. Although the low-motor model also exhibits a low-speed region 4, due to its lower motor height, the region 4 is close to the wheel and smaller at the bottom of the impeller. This observation provides further depth and insight into our understanding of how installation heights influence velocity distributions within different regions.
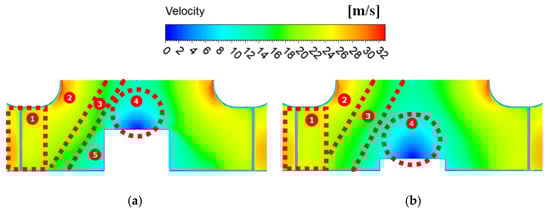
Figure 9.
Meridian static pressure contour at a larger flow rate. (a) Original model; (b) low-motor model. (1) Outlet of blade channel, (2) blade channel near shroud, (3) main blade channel, (4) motor top, (5) motor side.
Therefore, the low-motor model exhibits a larger flow channel area in region 2 and 3 compared to the original model, which is consistent with the meridional streamline shown in Figure 8.
As depicted in Figure 10a, region 1 of the original model, which spans from the impeller inlet to the blade passage inlet, is separated by a distance of three meters from region 3, which is connected to the impeller (refer to Figure 10b). This can be explained by the fact that the absolute velocity of the streamline in the impeller is helical, and the impeller entrance is blocked by region 3 in the original model, making the flow channel smaller and less effective than that of the lower motor, and much more flow loss is generated under the same larger flow conditions.
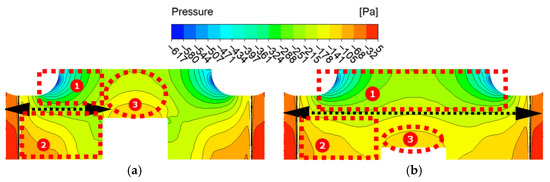
Figure 10.
Meridian static pressure contour under a larger flow rate. (a) Original model; (b) low-motor model. (1) blade channel near shroud and inlet, (2) blade channel between motor and outlet, (3) motor top.
Figure 11 shows a comparison of blade surface streamlines, where LE denotes the leading edge position of the blades. The differences in blade streamlines, resulting from the two installation conditions, were observed near the shroud of the leading edge blade, with a larger vortex in the original model. Velocity differences ranging from 6 to 13 (m/s) were observed at the leading edge of the blade near the hub side, while other parts of the blade surface are close to 0 (m/s). This indicates that variations in motor installation height primarily affect the leading edge of the blade.
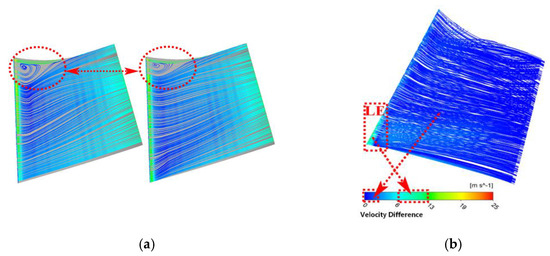
Figure 11.
Streamlines on the blade surface under a larger flow rate. (a) Velocity flow diagram; (b) velocity difference flow diagram.
Figure 12 shows the vorticity distributions, indicating that the viscosity near the blade suction and pressure surfaces is similar for both installation heights. Notably, a vortex near motor in the original model is found, the viscosity of which is similar to the maximum viscosity on the blade suction surface. Therefore, this impacts the flow within the impeller, resulting in the consideration of flow losses. Our study revealed that differences in flow losses are primarily concentrated near the motor.
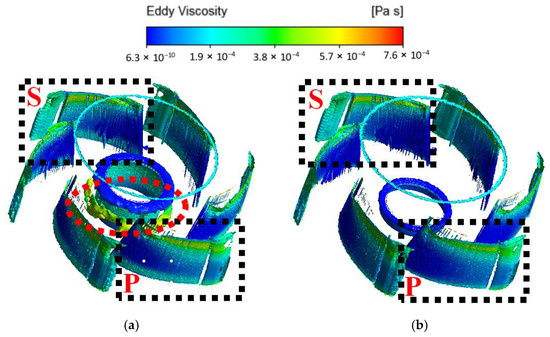
Figure 12.
Vorticity at a larger flow rate. (a) Original model; (b) low-motor model.
The velocity distribution at the impeller outlet on the radial plane is compared in Figure 13, where u2 represents the circumferential velocity. The abscissa denotes the circumferential angle of the radial plane, and its angular azimuth is shown in Figure 13a. As a result of weakened velocity fluctuation in the low-motor model, flow losses caused by jet wake are reduced. The intensity of jet wake at the blade channel outlet has a significant impact on fan performance.
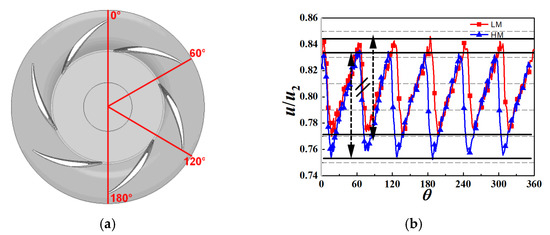
Figure 13.
Radial surface velocity distribution under a larger flow rate. (a) Radial surface angular azimuth; (b) velocity distribution on radial surface.
4. Conclusions
For this paper, an investigation into differences in the aerodynamic performance of fans caused by installation heights was conducted using computational fluid simulation. The presented predictions are in great agreement with the experimental data. The results show that a vortex is observable on the side of the motor, as it first accelerates and then obviously decelerates while passing through the impeller inlet to the front of the blade passage. Larger motor installation heights result in a decrease in static pressure and static pressure efficiency for higher flow rates. At the maximum flow rate, the static pressure efficiency of the fan at a lower installation height increased by 10% with the original fan, and the static pressure coefficient increased by 23% as well. This demonstrates that installation heights greatly affect the aerodynamic performance of isolated centrifugal fans under higher flow rate conditions, and the range of fan operation is extended at reasonable heights. Based on our study, we have drawn the following conclusions:
(1) Higher motor installation heights decrease static pressure and static pressure efficiency at a larger flow rate instead of smaller flow rate, which is favorable for extending the operation range.
(2) The installation heights of the motor at lower flow rate will not take effects on the inner flow in impeller because fluid located at middle position of impeller has blocked the flow channel.
(3) The installation heights of the motor at a lower flow rate will greatly affect the performance of the fan because a vortex is generated on both of its sides, resulting in greater energy loss.
(4) When the motor installation height exceeds 60% for the impeller thickness, this over-installation height will deteriorate fan performance due to the appearance of a vortex and strong velocity fluctuation in the flow channel at a larger flow rate.
Author Contributions
Conceptualization, Z.L.; experiment, P.L.; software, Z.L.; formal analysis, Z.L. and Z.C.; writing—original draft preparation, Z.L. and M.Z.; review and editing, Y.L. and G.L. All authors have read and agreed to the published version of the manuscript.
Funding
This work was supported by the National Natural Science Foundation of China (11872337 and 11902291).
Data Availability Statement
Not applicable.
Conflicts of Interest
The authors declare no conflict of interest.
Nomenclature
| D1 | impeller inlet diameter [mm] |
| D2 | impeller outlet diameter [mm] |
| d | impeller width [mm] |
| p | translation pressure [pa] |
| U | velocity vector [m/s] |
| u2 | outlet velocity of the impeller [m2/s] |
| Pt | total pressure [pa] |
| Pst | static pressure [pa] |
| Pd | dynamic pressure [pa] |
| N | shaft power [W] |
| Ne | effective power [W] |
| Q | rate of flow [m3/s] |
| η | static pressure efficiency [%] |
| ρ | air density [kg/m3] |
| ϕ | pressure coefficient |
| φ | flow coefficient |
| ν | viscosity coefficient |
References
- Jeon, W.H. A numerical study on the effects of design parameters on the performance and noise of a centrifugal fan. J. Sound Vib. 2003, 265, 221–230. [Google Scholar] [CrossRef]
- Carolus, T.H.; McLaughlin, D.K.; Basile, R. Experimental investigation of the unsteady discharge flow field and the noise of a centrifugal fan impeller. In Proceedings of the 7th International Congress on Sound and Vibration, Garmisch-Partenkirchen, Germany, 4–7 July 2000; pp. 1–8. [Google Scholar]
- Tsai, B.J.; Wu, C.L. Investigation of a miniature centrifugal fan. Appl. Therm. Eng. 2007, 27, 229–239. [Google Scholar] [CrossRef]
- Wolfram, D.; Carolus, T.H. Experimental and numerical investigation of the unsteady flow field and tone generation in an isolated centrifugal fan impeller. J. Sound Vib. 2010, 329, 4380–4397. [Google Scholar] [CrossRef]
- Ottersten, M.; Yao, H.D.; Davidson, L. Numerical and Experimental Study of Tonal Noise Sources at the Outlet of an Isolated Centrifugal Fan; Division of Fluid Dynamics, Department of Mechanics and Maritime Science, Chalmers University of Technology: Gothenburg, Sweden, 2020; pp. 1–24. [Google Scholar]
- Sandra, V.S.; Rafael, B.T.; Juan, P.H.C.; Carlos, S.M. Experiment determination of the tonal noise sources in a centrifugal fan. J. Sound Vib. 2006, 295, 781–796. [Google Scholar]
- Korakianitis, T.; Hamakhan, I.A.; Rezaienia, M.A.; Wheeler, A.P.S.; Avital, E.J.; Williams, J.J.R. Design of high-efficiency turbomachinery blades for energy conversion devices with the three-dimensional prescribed urface curvature distribution blade design (CIRCLE) method. Appl. Energy 2012, 89, 215–227. [Google Scholar] [CrossRef]
- Jiří, P.; László, K.; Roman, G. Prediction of dynamic and aerodynamic characteristics of the centrifugal fan with forward curved blades. J. Therm. Sci. 2013, 22, 517–521. [Google Scholar]
- Wu, L.; Liu, X.; Wang, M. Effects of bionic volute tongue on aerodynamic performance and noise characteristics of centrifugal fan used in the air-conditioner. J. Bionic Eng. 2020, 17, 780–792. [Google Scholar] [CrossRef]
- Ni, J.; Liu, R.; Sun, Y. Multidisciplinary assessment of blade number and manufacturing parameters for the performance of centrifugal fans. Proc. Inst. Mech. Eng. Part A J. Power Energy 2021, 235, 766–782. [Google Scholar] [CrossRef]
- Liu, W.; Zhang, Y.; Li, N.; Wang, L. Research on stress intensity factor and fatigue crack propagation rate of the general-purpose gondola car body. Trans. Can. Soc. Mech. Eng. 2021, 45, 297–307. [Google Scholar] [CrossRef]
- Liu, W.; Zhang, Y.; Liu, Q.; Zhang, B.; Fu, Q. Structural optimization of the heavy haul wagon body based on MPSO-BP algorithm. Trans. Can. Soc. Mech. Eng. 2020, 45, 461–472. [Google Scholar] [CrossRef]
- Pasquale, D.; Persico, G.; Rebay, S. Optimization of turbomachinery flow surfaces applying a CFD-based throughflow method. J. Turbomach. 2014, 136, 031013. [Google Scholar] [CrossRef]
- Zhu, M.; Li, Z.; Li, G.; Ye, X.; Liu, Y.; Chen, Z.; Li, N. An Investigation on Optimized Performance of Voluteless Centrifugal Fans by a Class and Shape Transformation Function. Processes 2023, 11, 1751. [Google Scholar] [CrossRef]
- Ottersten, M.; Yao, H.D.; Davidson, L. Tonal noise of voluteless centrifugal fan generated by turbulence stemming from upstream inlet gap. Phys. Fluids 2021, 33, 075110. [Google Scholar] [CrossRef]
- Pérot, F.; Kim, M.S.; Goff, V.L.; Carniel, X.; Goth, Y.; Chassaignon, C. Numerical optimization of the tonal noise of a backward centrifugal fan using a flow obstruction. Noise Control Eng. J. 2013, 61, 307–319. [Google Scholar] [CrossRef]
- Lee, Y.T. Impact of Fan Gap Flow on the Centrifugal Impeller Aerodynamics. J. Fluids Eng. 2010, 132, 091103. [Google Scholar] [CrossRef]
- Li, Z.; Dou, H.S.; Lin, P.; Wei, Y.; Chen, Y.; Lin, L.; Ye, X. Design for a Squirrel Cage Fan with Double Arc Blade. J. Appl. Fluid Mech. 2020, 13, 881–891. [Google Scholar] [CrossRef]
- Li, Z.; Ye, X.; Wei, Y. Investigation on Vortex Characteristics of a Multi-Blade Centrifugal Fan near Volute Outlet Region. Processes 2020, 8, 1240. [Google Scholar] [CrossRef]
- Li, Z.; Cao, W.; Ye, X.; Wei, Y. Experimental Investigation on the Noise Characteristics of a Squirrel-Cage Fan with Different Blade Lengths. Energies 2023, 16, 69. [Google Scholar] [CrossRef]
- Khan, N.S.; Hussanan, A.; Kumam, W.; Kumam, P.; Suttiarporn, P. Accessing the thermodynamics of Walter-B fluid with magnetic dipole effect past a curved stretching surface. ZAMM J. Appl. Math. Mech. 2023, e202100112. [Google Scholar] [CrossRef]
- Meneveau, C.; Lund, T.S.; Cabot, W.H. A Lagrangian Dynamic Subgrid Scale Model of Turbulence. J. Fluid Mech. 1996, 319, 353–385. [Google Scholar] [CrossRef]
- Piomelli, U. High Reynolds Number Calculations Using the Dynamic Subgrid Scale Stress Model. Phys. Fluids 1993, 5, 1484–1490. [Google Scholar] [CrossRef]
- Liu, Y.; Liu, J.T.; Li, G.H.; Zhou, L.X. Four-way Coupled Modelling of Swirling Particle-laden Flow in Methane-central Coaxial Jets. Int. J. Heat Mass Transf. 2023, 214, 124342. [Google Scholar] [CrossRef]
- Liu, Y.; Zhou, L.X. A Novel Particle Subgrid Scale Modeling of Large Eddy Simulation for Swirling Particle-laden Turbulent Flow. Powder Technol. 2022, 402, 117348. [Google Scholar] [CrossRef]
- Liu, Y.; Zhou, L.X. Hydrodynamic Modeling of Non-swirling and Swirling Gas-particle Two-phase Turbulent Flow using Large Eddy Simulation. Process Saf. Environ. Prot. 2022, 161, 175–187. [Google Scholar] [CrossRef]
Disclaimer/Publisher’s Note: The statements, opinions and data contained in all publications are solely those of the individual author(s) and contributor(s) and not of MDPI and/or the editor(s). MDPI and/or the editor(s) disclaim responsibility for any injury to people or property resulting from any ideas, methods, instructions or products referred to in the content. |
© 2023 by the authors. Licensee MDPI, Basel, Switzerland. This article is an open access article distributed under the terms and conditions of the Creative Commons Attribution (CC BY) license (https://creativecommons.org/licenses/by/4.0/).