Article

New Methodology for Benchmarking Hydrodynamics in Bubble Columns with Intense Internals Using the Radioactive Particle Tracking (RPT) Technique

1
Linda and Bipin Doshi Department of Chemical and Biochemical Engineering, Missouri University of Science and Technology, Rolla, MO 65409, USA
2
Department of Medical Physics, Memorial Sloan Kettering Cancer Center, New York, NY 10065, USA
3
Department of Nuclear Engineering and Radiation Science, Missouri University of Science and Technology, Rolla, MO 65409, USA
4
TechCell, Mohammed VI Polytechnic University, Hay Moulay Rachid, Ben Guerir 43150, Morocco
*
Author to whom correspondence should be addressed.
Processes 2023, 11(7), 2107; https://doi.org/10.3390/pr11072107
Submission received: 21 June 2023 / Revised: 9 July 2023 / Accepted: 12 July 2023 / Published: 14 July 2023
(This article belongs to the Section Chemical Processes and Systems)

Abstract

:
A new methodology for implementing radioactive particle tracking (RPT) in bubble columns with intense vertical rod internals was developed and implemented to investigate the effect of dense internals on hydrodynamics. The methodology utilizes a hybrid of Monte Carlo N-Particle (MCNP) simulation and an automated RPT calibration device to generate a large number of calibration points for accurate reconstruction of the instantaneous positions of radioactive particles using a similarity algorithm. Measurements were conducted in a 6-inch (15.24 cm) Plexiglas column using an air–water system at a superficial gas velocity of 40 cm/s. Vertical Plexiglas rods 0.5 in (1.27 cm) in diameter were used to cover ~25% of the total cross-sectional area of the column to represent the effect of a heat-exchanging tube in industrial Fisher–Tropsch synthesis. The results showed that the internals increased liquid velocity near the center of the column by more than 30%, resulting in enhanced liquid circulation and frequency of liquid eddy movement. In addition, turbulence parameters decreased noticeably when using vertical internals in the bubble column due to a reduction in velocity fluctuations. Reliable data can help validate computational fluid dynamics (CFD) models to predict hydrodynamic parameters at other various conditions.

1. Introduction

Bubble/slurry bubble columns have been widely studied and employed as multiphase flow reactors. They have a wide range of applications in chemical, biochemical, petrochemical, pharmaceutical, and metallurgical industries, with the claimed benefits of simple construction, simple operation, and efficient liquid-phase mixing [1,2,3]. Some important hydrodynamics characterizations of these bubble/slurry bubble columns are gas/liquid holdups [4,5], axial and radial liquid velocities and turbulent parameters [6,7,8], and liquid-phase mixing [9]. In addition, some chemical reactions that occur in bubble/slurry bubble columns are very exothermic, such as acetic acid and acetone production, Fischer–Tropsch (FT) synthesis, and many others. These reactions necessitate many vertical cooling tubes inside the reactors to absorb extra heat and keep the temperature at the proper level for the reaction. Additionally, the incorporation of heat-exchanging internals is crucial to prevent localized overheating of the catalyst and to reduce selectivity for the desired products [2,10,11,12]. The presence of a bundle of heat-exchanging tubes in these reactors will affect the hydrodynamics and, as a result, the performance and productivity of these reactors [13,14].
The hydrodynamics of bubble/slurry bubble columns without internals have been extensively studied over the past few decades [15,16,17,18,19,20,21,22,23]. However, few studies have examined the effect of dense internals on the hydrodynamics of bubble/slurry bubble columns [2,13,24,25,26]. Some of the experimental studies were conducted in the presence of dense internals using optical fiber probe measurement techniques [13,24,26]. This technique can be used to provide limited local measurements of bubble dynamics in a bubble column due to the configuration of the internals. On the other hand, gamma-ray computed tomography has been used to study the effect of dense internals on the gas holdup cross-sectional distribution and radial profiles in bubble columns at one level in a fully developed regime (H/D = 5.1) [25,27]. Therefore, these studies with internals were limited. In particular, they did not provide knowledge about 3-D liquid velocities and turbulent parameters, which are important for proper and reliable validation of computational fluid dynamics (CFD) models.
Radioactive Particle Tracking (RPT) is a non-invasive technique developed to evaluate local flow characterizations in multiphase reactors regardless of the operating conditions. The RPT technique was successfully used to investigate and quantify flow patterns and liquid/solid velocities, and turbulent parameters in bubble/slurry bubble column reactors without dense internals [16,28,29]. However, few researchers attempted to address the presence of dense internals in bubble/slurry bubble columns using the RPT technique. Dinesh et al. [30] investigated the liquid hydrodynamics of a bubble column using the RPT technique performed with internals of up to ~13% of its cross-sectional area using only five internals. However, the authors reported that it was not easy to implement the RPT technique with intense vertical internals occupying more than 13% of the cross-sectional area due to practical limitations. Al Mesfer et al. [2] obtained liquid velocity profiles and turbulent parameters of bubble columns with and without dense internals using the RPT technique at three different superficial gas velocities of 0.08, 0.2, and 0.45 m/s. The dense internals bundle was used to cover ~25% of the total cross-sectional area of the column using hexagonal pitch support. However, Al Mesfer et al.’s [2] implementation of RPT in such intense internals in a bubble column is questionable for the following reasons:
  • The calibration points for RPT were not defined properly in the presence of the dense internals during measurements due to narrow distances between the internals.
  • A calibration dataset is critical for reconstructing the positions of radioactive particles during operation. As a result, the post data processing of regular RPT data processes was questionable and required validation. Because of that, Al Mesfer et al. [2] used different and limited approaches to process the data without relying fully on the collected calibration data.
  • When regular RPT processing data were implemented, azimuthal liquid velocity averages were estimated without subtracting the width of the internals where no velocities were measured in these spaces. The data obtained from this study was found to be unreliable [31]. Therefore, Al Mesfer et al. [2] used line-averaged data for the lines that did not pass through internals. Unfortunately, this information is limited and not adequate for reliable CFD validation.
Therefore, for the first time, we have developed a new method to properly implement the RPT technique and properly process data to study the effect of dense internals on 3-D liquid velocities and turbulence parameters in a bubble column to provide reliable benchmarking data for CFD validation. This work focuses on correcting and addressing the shortcomings faced by Al-Mesfer 2013 [31] and Al Mesfer et al. [2] by implementing the following features for the new method, for which more details will be discussed later in the manuscript.
  • Performing limited reliable RPT calibration points and using Monte Carlo N-Particle (MCNP) simulation to generate the needed supplementary calibration dataset in a bubble column with and without dense internals. Due to the difficulties of executing RPT calibration with dense internals, this new method has been undertaken.
  • Validating the new method in identifying radioactive particle positions inside the bubble column with and without internals by reconstructing known positions of the radioactive particle, as discussed in the validation section.
  • When post-processing RPT data and performing azimuthally averaging, the spaces occupied by the internals were subtracted. Hence, estimated liquid field velocities in the bubble column with dense internals are reliable, including turbulence parameters for properly validating CFD models.
In summary, we conducted experiments at a superficial gas velocity of 40 cm/s, considering a free cross-sectional area for gas flow within a churn turbulent flow regime. These experiments were performed with and without internals to demonstrate the implementation of our newly developed method and to generate a reliable dataset. The findings, while potentially qualitatively similar to Al Mesfer et al. [2], offer more quantitative insights. Importantly, our benchmarking data provide reliable coverage of the fully developed region in 3-D.

2. Experimental Setup

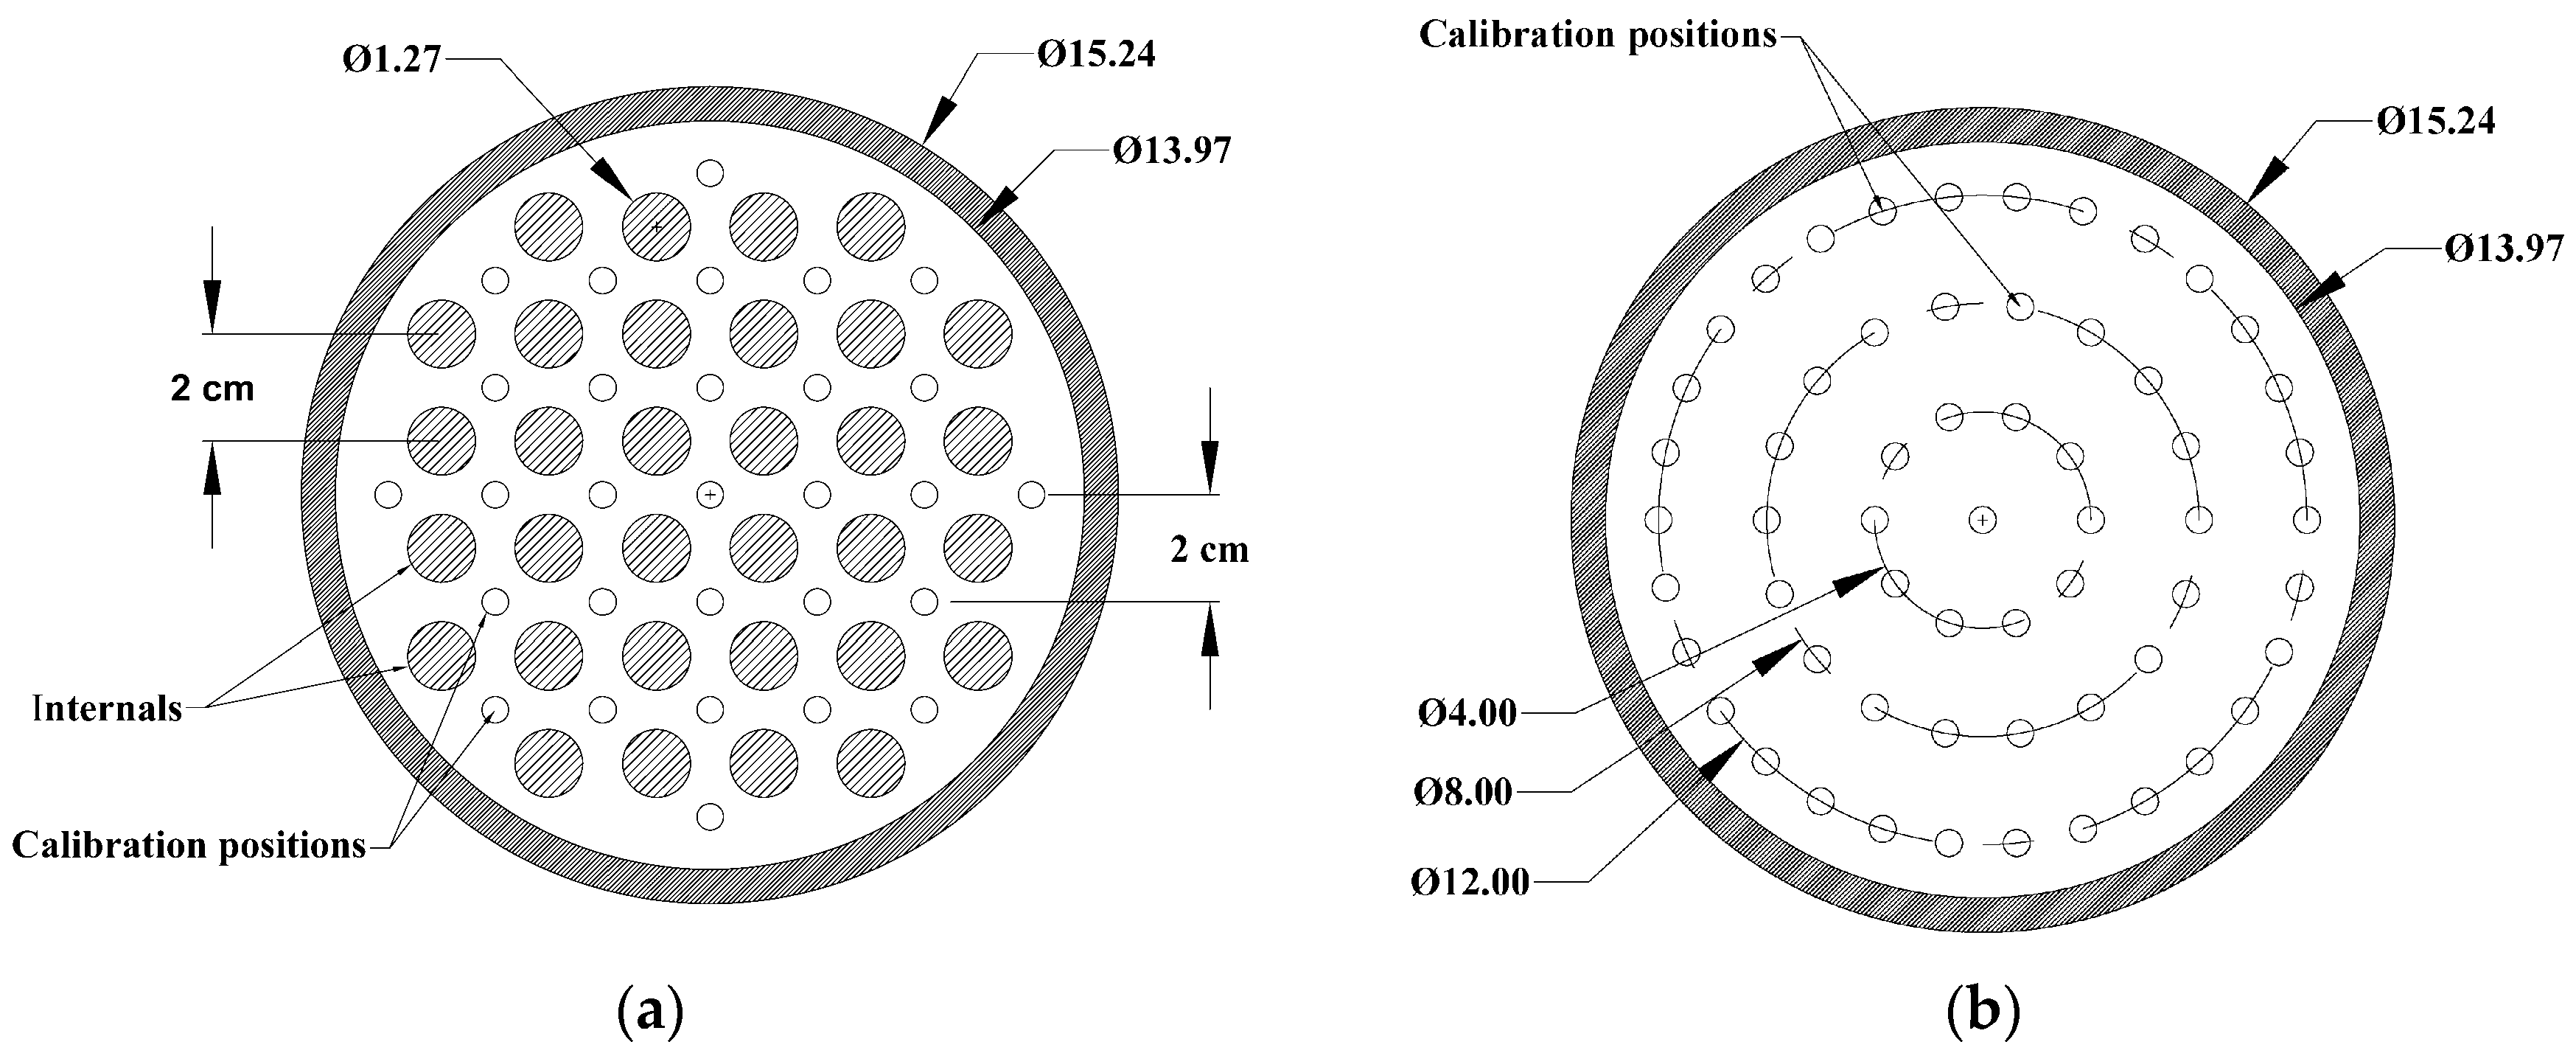
This study carried out experimental works in a Plexiglas column with a 6 in (15.24 cm) diameter and 6 ft (183 cm) height, as shown in Figure 1. The bubble column was operated at ambient conditions using an air–water system. Air as the gas phase was introduced to the bottom of the column, flowing through an aluminum plenum with a perforated plate which is 8 in (20 cm) in diameter under the column [25,27]. The perforated plate had 121 holes (0.132 cm diameter for each hole) arranged in a triangular pitch to provide uniform gas distribution with an open area of 1.09% [24,27]. Vertical Plexiglas rods 0.5 in (1.27 cm) in diameter were used to cover ~25% of the total cross-sectional area of the bubble column to represent the effect of heat-exchanging tubes in industrial Fisher–Tropsch synthesis [11,32,33]. Therefore, there were 32 internal rods arranged in a square pitch (2 cm from center to center of each rod), as shown in Figure 2a. These internal tubes were positioned and secured vertically 5 inches (12.7 cm) above the gas distributor. This design was performed to be more azimuthally symmetric, which helps to quantify the liquid velocity radial profile [34]. This work operated the bubble column at a superficial gas velocity of 40 cm/s at ambient conditions to obtain a churn turbulent flow regime by demonstrating this newly implemented method of RPT technique in the bubble column and to provide a reliable dataset. Compressed air was injected into the column continuously while the water was in batch mode. The averaged dynamic level was kept constant at 155 cm (H/D = 11) above the gas distributor plate with 121 holes of 1.016 mm in diameter with an open area of 1.09% [27,35].

3. Implementation of the RPT Technique with Dense Internals

3.1. Radioactive Particle Tracking (RPT) Technique

RPT is a non-invasive radioisotope technique that can be used to measure and visualize 3-D flow velocities and turbulent parameters in various multiphase flow systems. This technique consisted of 28 high-resolution (2 × 2 inch) NaI(Tl) detectors located strategically around the bubble column. The detectors were fixed on aluminum structures and arranged on seven different levels, with four detectors at each level to cover most of the column height. Also, the detectors were fixed around the bubble column in a circle with a radius of 12.7 cm. The NaI(Tl) detectors were connected to a high-performance data acquisition system that captures gamma-ray photon counts with a frequency of up to 500 Hz. A tracer particle for the RPT experiment was made with the same liquid phase density (water). Co-60 with high-energy peaks of 1.18 MeV and 1.34 MeV (initial activity ~18.5 MBq (500 µci (microcurie)) with 0.6 mm diameter was encapsulated using Polypropylene-N with a final diameter of 2 mm [36], which was used as a radioactive particle.
For RPT technique calibration, a fully automatic calibration system was used to locate the radioisotope particle at different coordinates (r, θ, z) inside the column by fixing the tracer particle at the end of the rod. The main purpose of this unit was to generate a dataset of calibration points during operating conditions. These calibration points are used to identify the instantaneous positions of the radioactive particle in the column during normal operation where the radioactive particle moves freely within the liquid by using different algorithms, such as Weighted Least Square Regression [37], similarity algorithms [38], Monte Carlo [39], Cross-Correlation-based [40] methods, and others. In this work, a similarity algorithm [36] is used.
In this experimental work, the calibration dataset was over 4000 data points for the bubble column without internals. These points were distributed to cover most of the column height and for uniformly locating the radioactive particle at different radiuses and heights, including the center of the column, as shown in Figure 2b. However, there were around 2000 data points for the column with internals due to the limitation of inserting the calibration rod between the internals, as shown in Figure 2a. Therefore, Monte Carlo simulation using the Monte Carlo N-Particle (MCNP) tool has been introduced to generate more calibration points to enhance the accuracy of reconstructing the radioactive particle positions and hence the trajectory, as discussed in the following section.
Since the composite radioactive particle (Co-60) density is the same density as the liquid phase (water), it could move freely inside the bubble column during the experiments. As a result, the data acquisition system would collect gamma-ray photons related to the movement and position of the radioactive particle. The acquisition frequency was 20 Hz for 20 h to allow the particle to have enough time to visit each fictitious compartment dividing the column many times to obtain a plateau in the ensembled averaged velocity in each compartment, thereby providing a reasonable statistical representation. The bubble column was divided into 3640 equal compartments (52 total compartments for each cross-section and 70 divisions in the axial direction) during reconstruction of the tracer positions.

3.2. Monte Carlo Simulation

As mentioned previously, the number of calibration points affects the accuracy of source position estimation when a reconstruction algorithm is used. In bubble/slurry bubble columns with dense internals, generating enough calibration data points is very complex due to the clearance limitation between the vertical internals, leading to a lack of accuracy in tracking the radiation position using the RPT technique. One way to overcome this issue is to use Monte Carlo simulation to produce more calibration data points. The Monte Carlo method is a simulation technique that is widely used in the field of radiation transport. Monte Carlo N-Particle (MCNP) is a general-purpose Monte Carlo radiation transport code that was developed to track various types of particles (neutrons, electrons, and gamma rays) over a broad energy range. The code solves the problem by simulating individual particle trajectories and capturing certain characteristics of their average behavior. The procedure entails tracking each of the numerous radiation particles from when they are emitted from a source until they reach the energy threshold. Absorption, escape, physical cut-off, and other processes contribute to the transfer of radiation energy to matter. To determine the outcome at each trajectory step, the probability of distributions is randomly sampled using transport data. The relevant quantities are totaled along with estimates of the results’ statistical precision. The MCNP code can be used to simulate gamma-ray interactions, including (i) incoherent and coherent scattering and (ii) the possibility of fluorescent emission following photoelectric absorption [41].
When mathematically simulating NaI(Tl) detectors to obtain their response curves, corrections should be made to improve the simulation and bring it closer to reality. Two critical corrections are required: determination of the photon detection efficiency and energy resolution, which is related to the ability to distinguish different peaks in the energy spectrum that are very close to one another. Their determination is critical when performing radionuclide identification or simulating detectors that are close to the real thing [42,43].
In practice, as shown in Equation (1) for the detector, the energy resolution (RE) is defined as the full width at half maximum (FWHM) of the Gaussian peak (pulses per channel) for a given energy (E0) [41].
R E = F W H M E 0 ,
where RE indicates the energy resolution, FWHM represents the photopeak’s full width at half maximum, and E0 is the photopeak’s central energy.
Certain photopeak effects are inherent to the spectrometric system’s electronic circuit, which the MCNP does not simulate. Thus, in order to obtain a more realistic detector response and to account for this effect in the simulation, it is necessary to adjust the detector energy resolution parameters experimentally and then use an MCNP code function to fit a Gaussian to the spectrum, obtaining the necessary corrections as discussed in the validation section [44].
To incorporate the resolution of the real detector, as measured experimentally, the MCNP fitting technique incorporates the (FT8 GEB) card into the code’s input file. Then, the total energy is widened by sampling from the Gaussian, as shown in Equation (2) [41].
f E = C   exp   2 ln 2 E E 0 F W H M ,
where E indicates the photopeak energy, E0 represents the unbroadened energy of the tally, and C indicates the normalization constant.
The Gaussian Energy Broadening (GEB) command, which is used as an input to the MCNP code function, can be used to determine the simulated detector’s energy resolution. This command applies a special treatment to tallies in order to more accurately simulate the operation of a physical radiation detector. To this end, a non-linear least-squares adjustment is used to determine the values of the a, b, and c coefficients from Equation (3) [42]. These parameters are used in conjunction with the GEB command.
F W H M = a + b E + c E 2 ,
where E is the incident gamma ray’s energy (MeV). Equation (3) can be simplified by substituting with Equation (4) [41].
F W H M = a + b E ,
In the detectors, variations in crystals and surrounding material dimensions impact photon detection, although simulation should be modeled with as much accuracy as possible.
In this work, all simulations were carried out and matched the Co-60 source size, the density, and the photons emission as the true source. In addition, the 6-inch (15.24 cm) diameter Plexiglas column, the experimental setup, and 28 (2 × 2) inch high-resolution NaI(Tl) detectors with 512 channels were simulated.
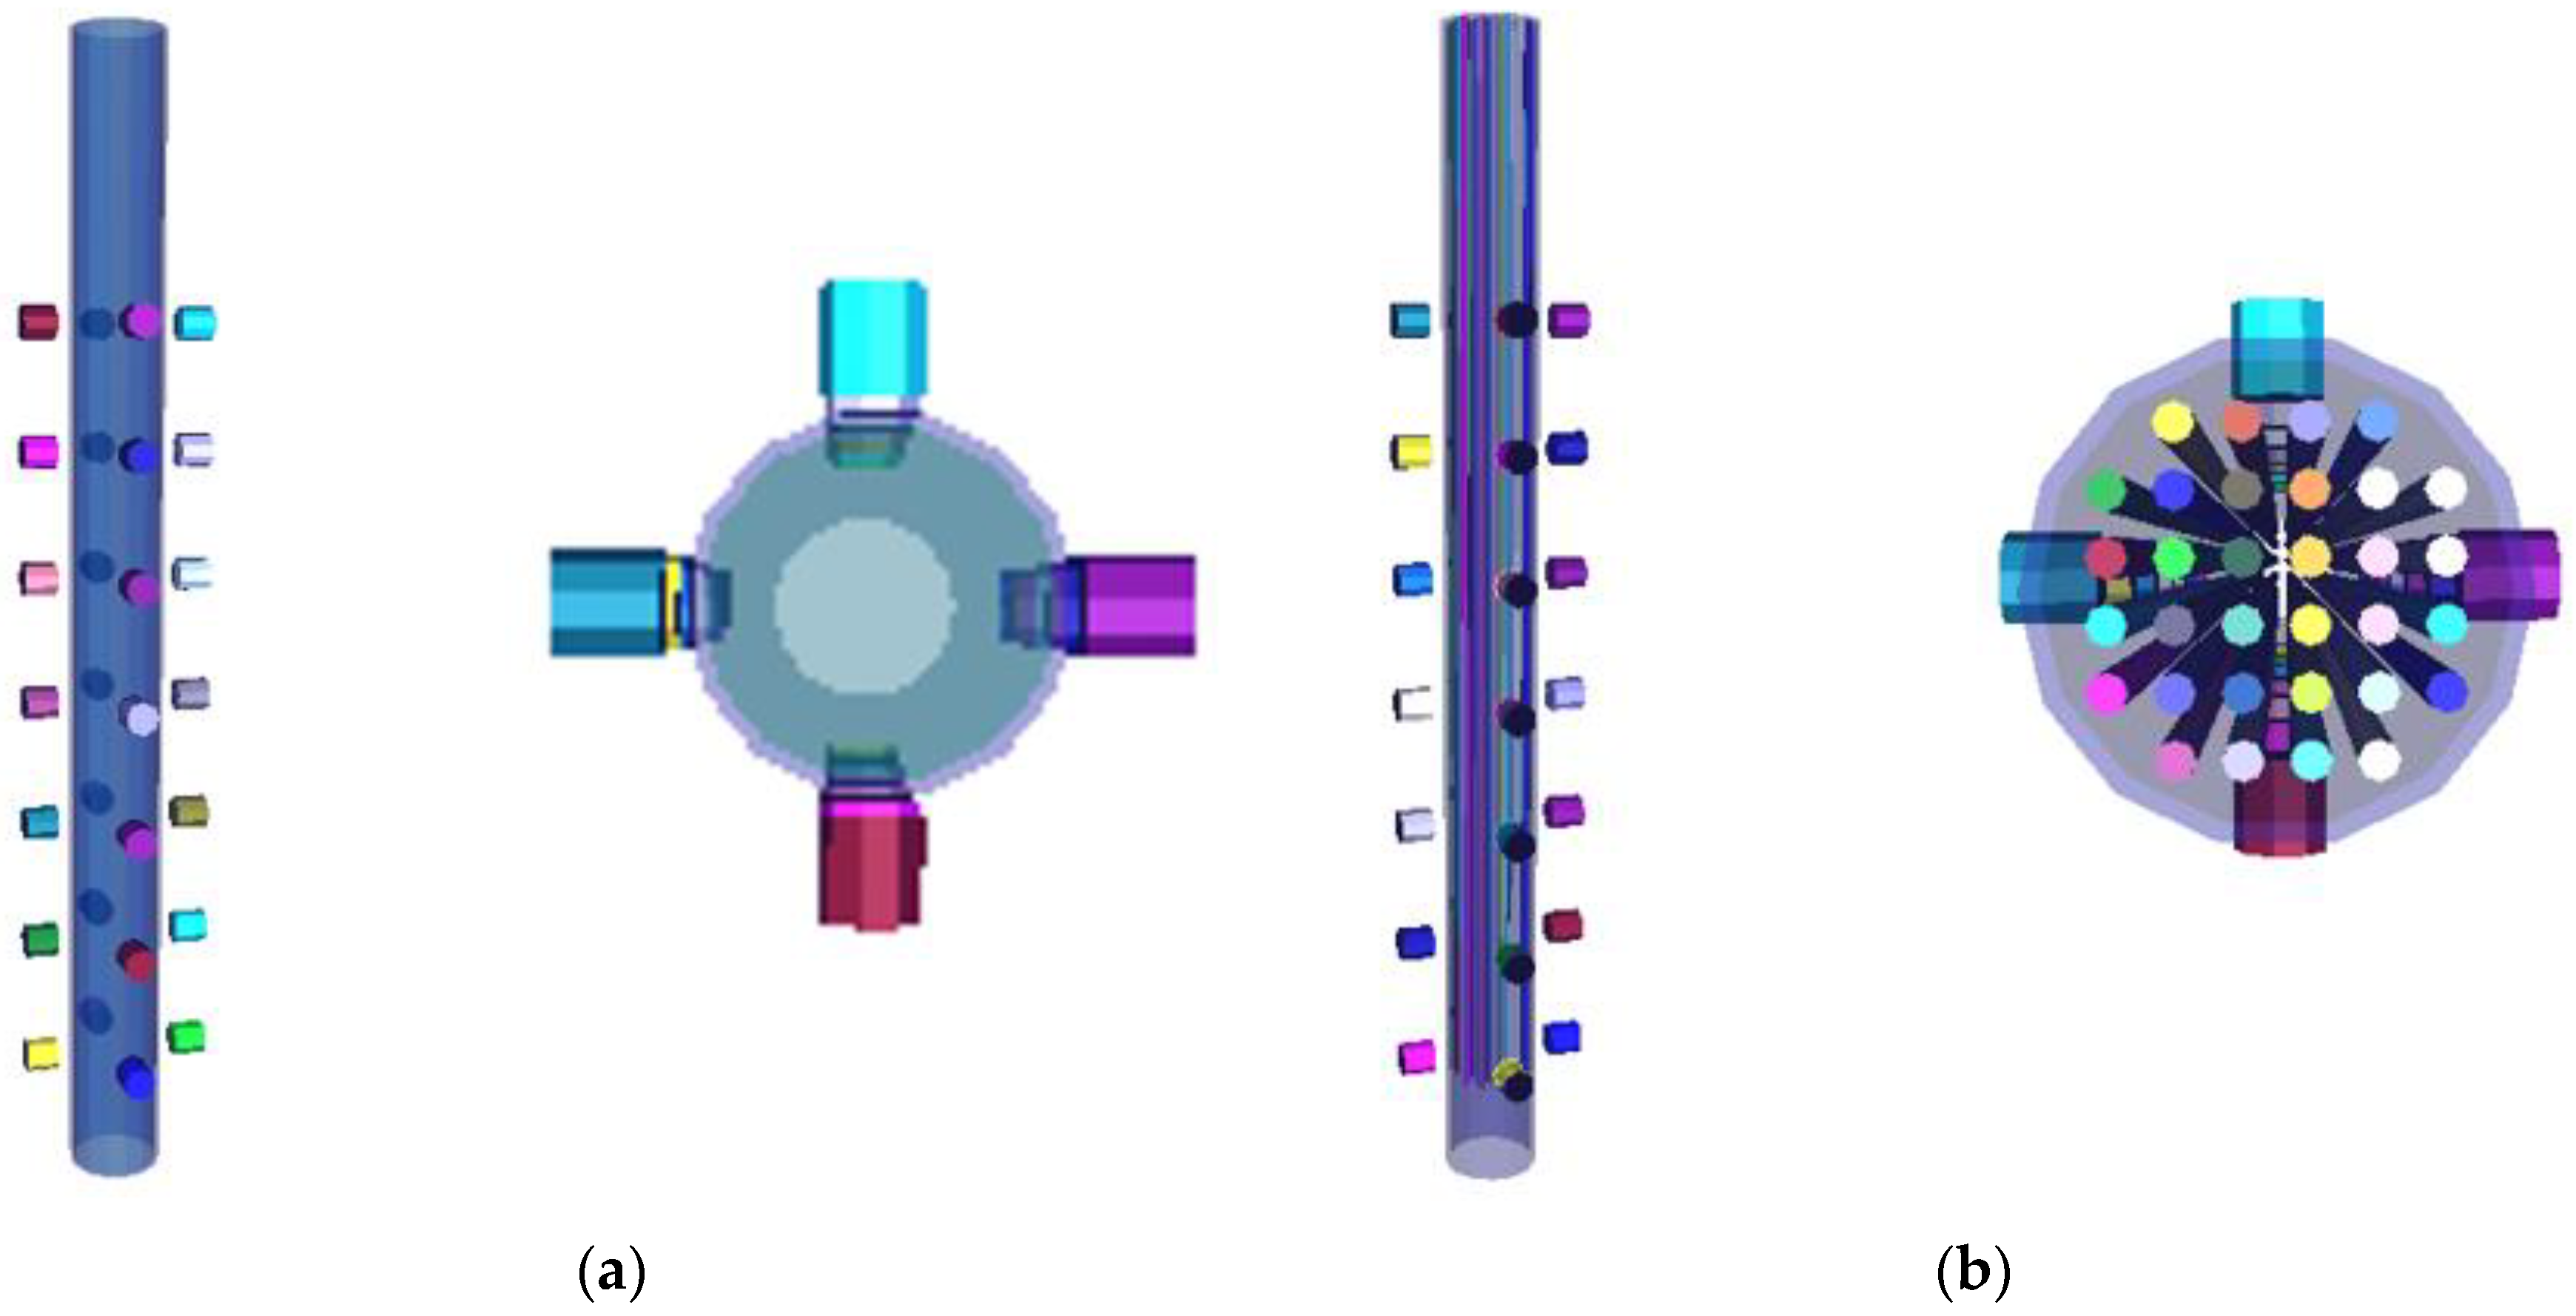
The MCNP 3-D geometry of the bubble column with/without vertical internals is shown in Figure 3. The simulation included the gas distribution profile obtained from the real air–water bubble column to generate a large dataset of calibration points [25,32]. During the simulation process, with and without internals, the simulated gamma-ray source was located at ~7900 different positions in the 3-D geometry to allow all simulated detectors to measure spectrum energies. Therefore, the MCNP simulation significantly contributed to generating a large number of calibration datasets that cannot be generated experimentally in the bubble column with dense internals. More detail about the MCNP environment is available in previous work reported by Mosorov et al. [39].

3.3. Instantaneous Position Identification of the Radioactive Particle

Many reconstruction algorithms are available to estimate radioactive particle positions in different multiphase flow systems, as mentioned above. However, all these algorithms require calibration data points in order to be applicable to define the tracer positions [28,29,40,45,46]. In addition, the number of calibration points plays a significant role; a few calibration points may increase the error between the reconstructed position and the proper position [38,39]. This study planned to identify radioactive particle positions inside the bubble column with and without internals. Thus, it estimates radioactive particle positions by comparing each experimental data point with the calibration data points. It is worth mentioning that the similarity algorithm is characterized by less computation power over a short time.
Mosorov (2013) [38] developed the original algorithm for mapping counts into particle position coordinates by sorting the differences and focusing on the minimum values. The basis of the similarity algorithm used to identify radioactive particle positions is shown in Equation (5):
S j = i = 1 n ln C i P j ln M i P o ,   j = 1 j max ;   i = 1 n
where Sj is the similarities, C i is the calibration counts, P j is the known positions of the radioactive tracer from the calibration points, Mi is the measurement counts, and P o is the estimated position of the tracer during the experiments. Finally, n is the number of detectors used to count the tracer photons. Finally, the particle’s position (xe, ye, ze) must be calculated using the sorted set’s first three minima, as shown in Equations (6)–(8):
x e   =   x ( S min 1 ) w 1 + x ( S min 2 ) w 2 + x ( S min 3 ) w 3 w 1 + w 2 + w 3 ,
y e   =   y ( S min 1 ) w 1 + y ( S min 2 ) w 2 + y ( S min 3 ) w 3 w 1 + w 2 + w 3 ,
z e   =   z ( S min 1 ) w 1 + z ( S min 2 ) w 2 + z ( S min 3 ) w 3 w 1 + w 2 + w 3 ,
where x(Sj), y(Sj), and z(Sj) denote the coordinates (x, y, and z) of the radioactive particle position used to compute the j-th similarity Sj. wi = Smin 1/Smin i, when i = 1, 2, 3, is the similarity weight. Hence, Smin 1, Smin 2, and Smin 3 correspond to the first three minima of the sorted set of similarities {Sj}, j = 1, …, Jmax.
Therefore, by an iterative approach, this algorithm reduces the reconstruction error between the estimated tracer position with its true position by considering the statistical fluctuations of measured counts. These fluctuations of the photons are regulated by a gamma-ray source, and it is important to note that the measurement interval can impact the counts and potentially reduce the accuracy of reconstructing radioactive particle positions.
In order to visualize the distribution of radioactive particle positions (representing the liquid phase) in the bubble column during operation, Kernel Density Estimation (KDE) was used to estimate the probability density distribution as a continuous function of the axial and radial distributions of the radioactive particle positions. KDE is a non-parametric method for estimating the probability density function of random variables. Estimating kernel density is a fundamental data-smoothing problem that involves inferring the population based on a limited sample of data. The results can be visualized and quantified by the radioactive particle tracer distribution representing the liquid phase in the bubble column reactor. KDE can be estimated using Equation (9) [47]:
f x = 1 n h d i = 1 n K x X i h d ,
where n is the total sample number represented by the radioactive particle positions, h d is the bandwidth for d dimensions multivariate KDE, and X i is the value of the i-th observation. K is the kernel density function as a Gaussian kernel density function that can be calculated using Equation (10).
K = 1 2 π exp 1 2 x 2 ,

3.4. Estimation of the Hydrodynamic Parameters

In this work, 3-D liquid velocities, normal stresses, shear stresses, and turbulent kinetic energy were processed in accordance with the works of Devanathan et al. [6], Moslemian et al. [48], Efhaima and Al-Dahhan [49], and others. Thus, the axial liquid distribution in the bubble column with the influence of vertical internals, liquid velocity, and turbulence parameters are presented. For the liquid instantaneous velocities, the difference in time between the middle point of the two following positions of the particle at different coordinates (z, r, θ) is shown in the following equations [1,50]:
u z , i 1 2 = z i z i 1 / Δ T ,
u r , i 1 2 = r i r i 1 / Δ T ,
u θ , i 1 2 = θ i θ i 1 × r i r i 1 / 2 Δ T ,
where i − 1/2 is the middle point between the two following particle positions.
As mentioned earlier, the column was assembled with the same volume compartments that can be averaged to estimate the liquid ensemble’s mean components and resultant velocities. The means of all tracer particle occurrences (instantaneous positions) in a given compartment are used to calculate time-assembled averaged velocities.
The time-averaged (mean) velocities in each direction in each compartment (i, j, k) were calculated as follows [1,2,36]
u ¯ p ( i , j , k ) = 1 N υ i = 1 N υ u p ( i , j , k ) , i                     p = z , r , θ ,
where N υ is the number of liquid velocity occurrences for the given compartment.
For data vitalization, circular azimuth averaging for each (r, z) plane was performed to calculate the azimuthal averaged velocity u ¯ p ( i , j , k ) of the axial and radial components. Thus, for each z-plane, eight positions described by the profile in the radial direction are obtained:
u ¯ ( i , k ) = 1 N θ N ˜ υ ( i , k ) j = 1 N θ u ¯ ( i , j , k ) N υ ( i , j , k ) ,
where N θ is the number of compartments in the azimuthal direction, N ˜ υ ( i , k ) is the averaged velocity occurrences for two compartments (i, k), and N ˜ υ ( i , k ) = 1 N θ j = 1 N θ N ( i , j , k ) .
In addition, the normal and shear stresses and turbulent kinetic energy can be calculated using the following equations [1,36]:
τ p q = u p ( i , j , k ) u q ( i , j , k ) ¯   ,   p , q = z , r , θ ,
T K E = 1 2 ( τ z z + τ r r + τ θ θ ) ,

3.5. Validation of the Monte Carlo N-Particle (MCNP) Simulation

In order to validate MCNP simulation for the calibration points to be generated, real calibration measurement was performed using the same experimental setup (column, radioactive source, and detectors) with and without internals. Real and simulated Co-60 energy spectra for one of the detectors are presented in Figure 4. The simulated and real spectra showed good agreement among energies, which contributes to validating the use of MCNP simulation.
In the bubble column without internals, 60 points with known positions in an hourglass shape were selected for validation. Figure 5a compares the hourglass positions of the real calibration positions of the radioactive particle fixed by the automated calibration device and the position obtained by MCNP simulation by using a similarity algorithm. Due to the limitation of inserting the calibration rod in the bubble column with dense internals, more than 170 validation points were distributed in five different vertical coordinates. Figure 5b illustrates the real positions of the gamma-ray source of the radioactive particle in the bubble column with dense internals compared to the positions reconstructed by the similarity algorithm using the simulated calibration points by MCNP. The relative error of each point was not more than 4.2%, according to the known coordinates (r, θ, z). Thus, the simulated calibration points using MCNP have good agreement with the actual positions of the radioactive particle fixed by the automated calibration device. This agreement made MCNP a tool applicable for whole experimental setups with and without dense internal rods. Furthermore, this contribution provided the starting point for investigating further solid-phase hydrodynamics in a slurry bubble column with dense internals.

4. Results and Discussion

In this study, we paired real calibration and simulated datasets using the MCNP tool to provide a large set of calibration data points for a bubble column with/without vertical internals. Increasing the calibration data points helped enhance the similarity algorithm’s accuracy in reconstructing the tracer’s positions in the system. Instantaneous position data have been used to determine 3-D liquid velocities and turbulent parameter radial profiles, which are presented as axially and azimuthally averaged, respectively. Thus, the axial liquid distribution of the air–water system in a bubble column with the influence of vertical internals is presented, including liquid velocity and turbulent parameters.

4.1. Axial and Radial Liquid-Phase Movement (Frequency of Moving Eddies of Liquid) Distribution

As mentioned earlier, this study used Kernel Density Estimation (KDE) to estimate the probability density distribution of the liquid phase in the bubble column during operation as a continuous function, which reflects the occurrences of the radioactive particle and hence the frequency of movement of eddies of the liquid. KDE can be used to understand and visualize liquid-phase distribution based on the instantaneous positions of the radioactive particle. Figure 6a illustrates the axial distribution of the liquid phase in the bubble column during operation with and without internals. The results indicate that the radioactive particle appeared more frequently at the bottom of the bubble column than at the higher levels during operation, based on the instantaneous positions. Thus, it indicates that the liquid phase is more frequently present and moving at the bottom of the column and is consistent with the literature [26,51].
The presence of internals helped the liquid phase to have more distribution in movement (frequency of the movement of liquid eddies) at a higher column level due to increased liquid-phase circulations. Thus, the results show that increasing the density estimator of the liquid phase with internals along the column height agreed with increasing the gas holdup in the center with internals, as reported by Jasim et al. [24], Al-Naseri et al. [26], and others. Figure 6b shows the radial distribution of liquid-phase movement (frequency of the movement of liquid eddies) in the bubble column with and without internals. The x-axis represents the dimensionless column radius (r/R) by dividing the bubble column into two sides. The liquid phase reached the plateau and was uniformly distributed in movement along the central region of the column diameter of the bubble column without internals. This indicates that there were more occurrences of the radioactive particle at the center of the column compared to at the wall due to liquid circulation driven by and consistent with higher gas holdup in the center compared to at the wall of the column. However, the presence of internals significantly affects radial distribution and liquid movement (frequency of movement of liquid eddies) compared to without internals. The internals generated three main concentrated radial zones based on density estimator values by the liquid phase. One peak is shown in the column center when r/R = 0, despite it having the highest magnitudes of gas holdup [26,32]. This is because of the high axial liquid velocity, which will be discussed in the next section. The highest liquid velocity at the center compared with that at the wall of the column means intensive circulation and hence more occurrences of the particle in the center of the column region. Moreover, the other two peaks are located between the center and the wall zone at approximately r/R = 0.6, as indicated by inversion points when the axial liquid velocities are zero. This means at this point, the liquid velocity changes from positive upward to negative downward, creating more frequent movement of liquid eddies causing more radioactive particle presence in that region and hence a larger peak of KDE in that region. The Kernel Density Estimation (KDE) results in Figure 6b clearly exhibit almost symmetric radial liquid distribution due to the symmetric design of the internals configuration.

4.2. Effect of the Internals on the Liquid Velocity Field

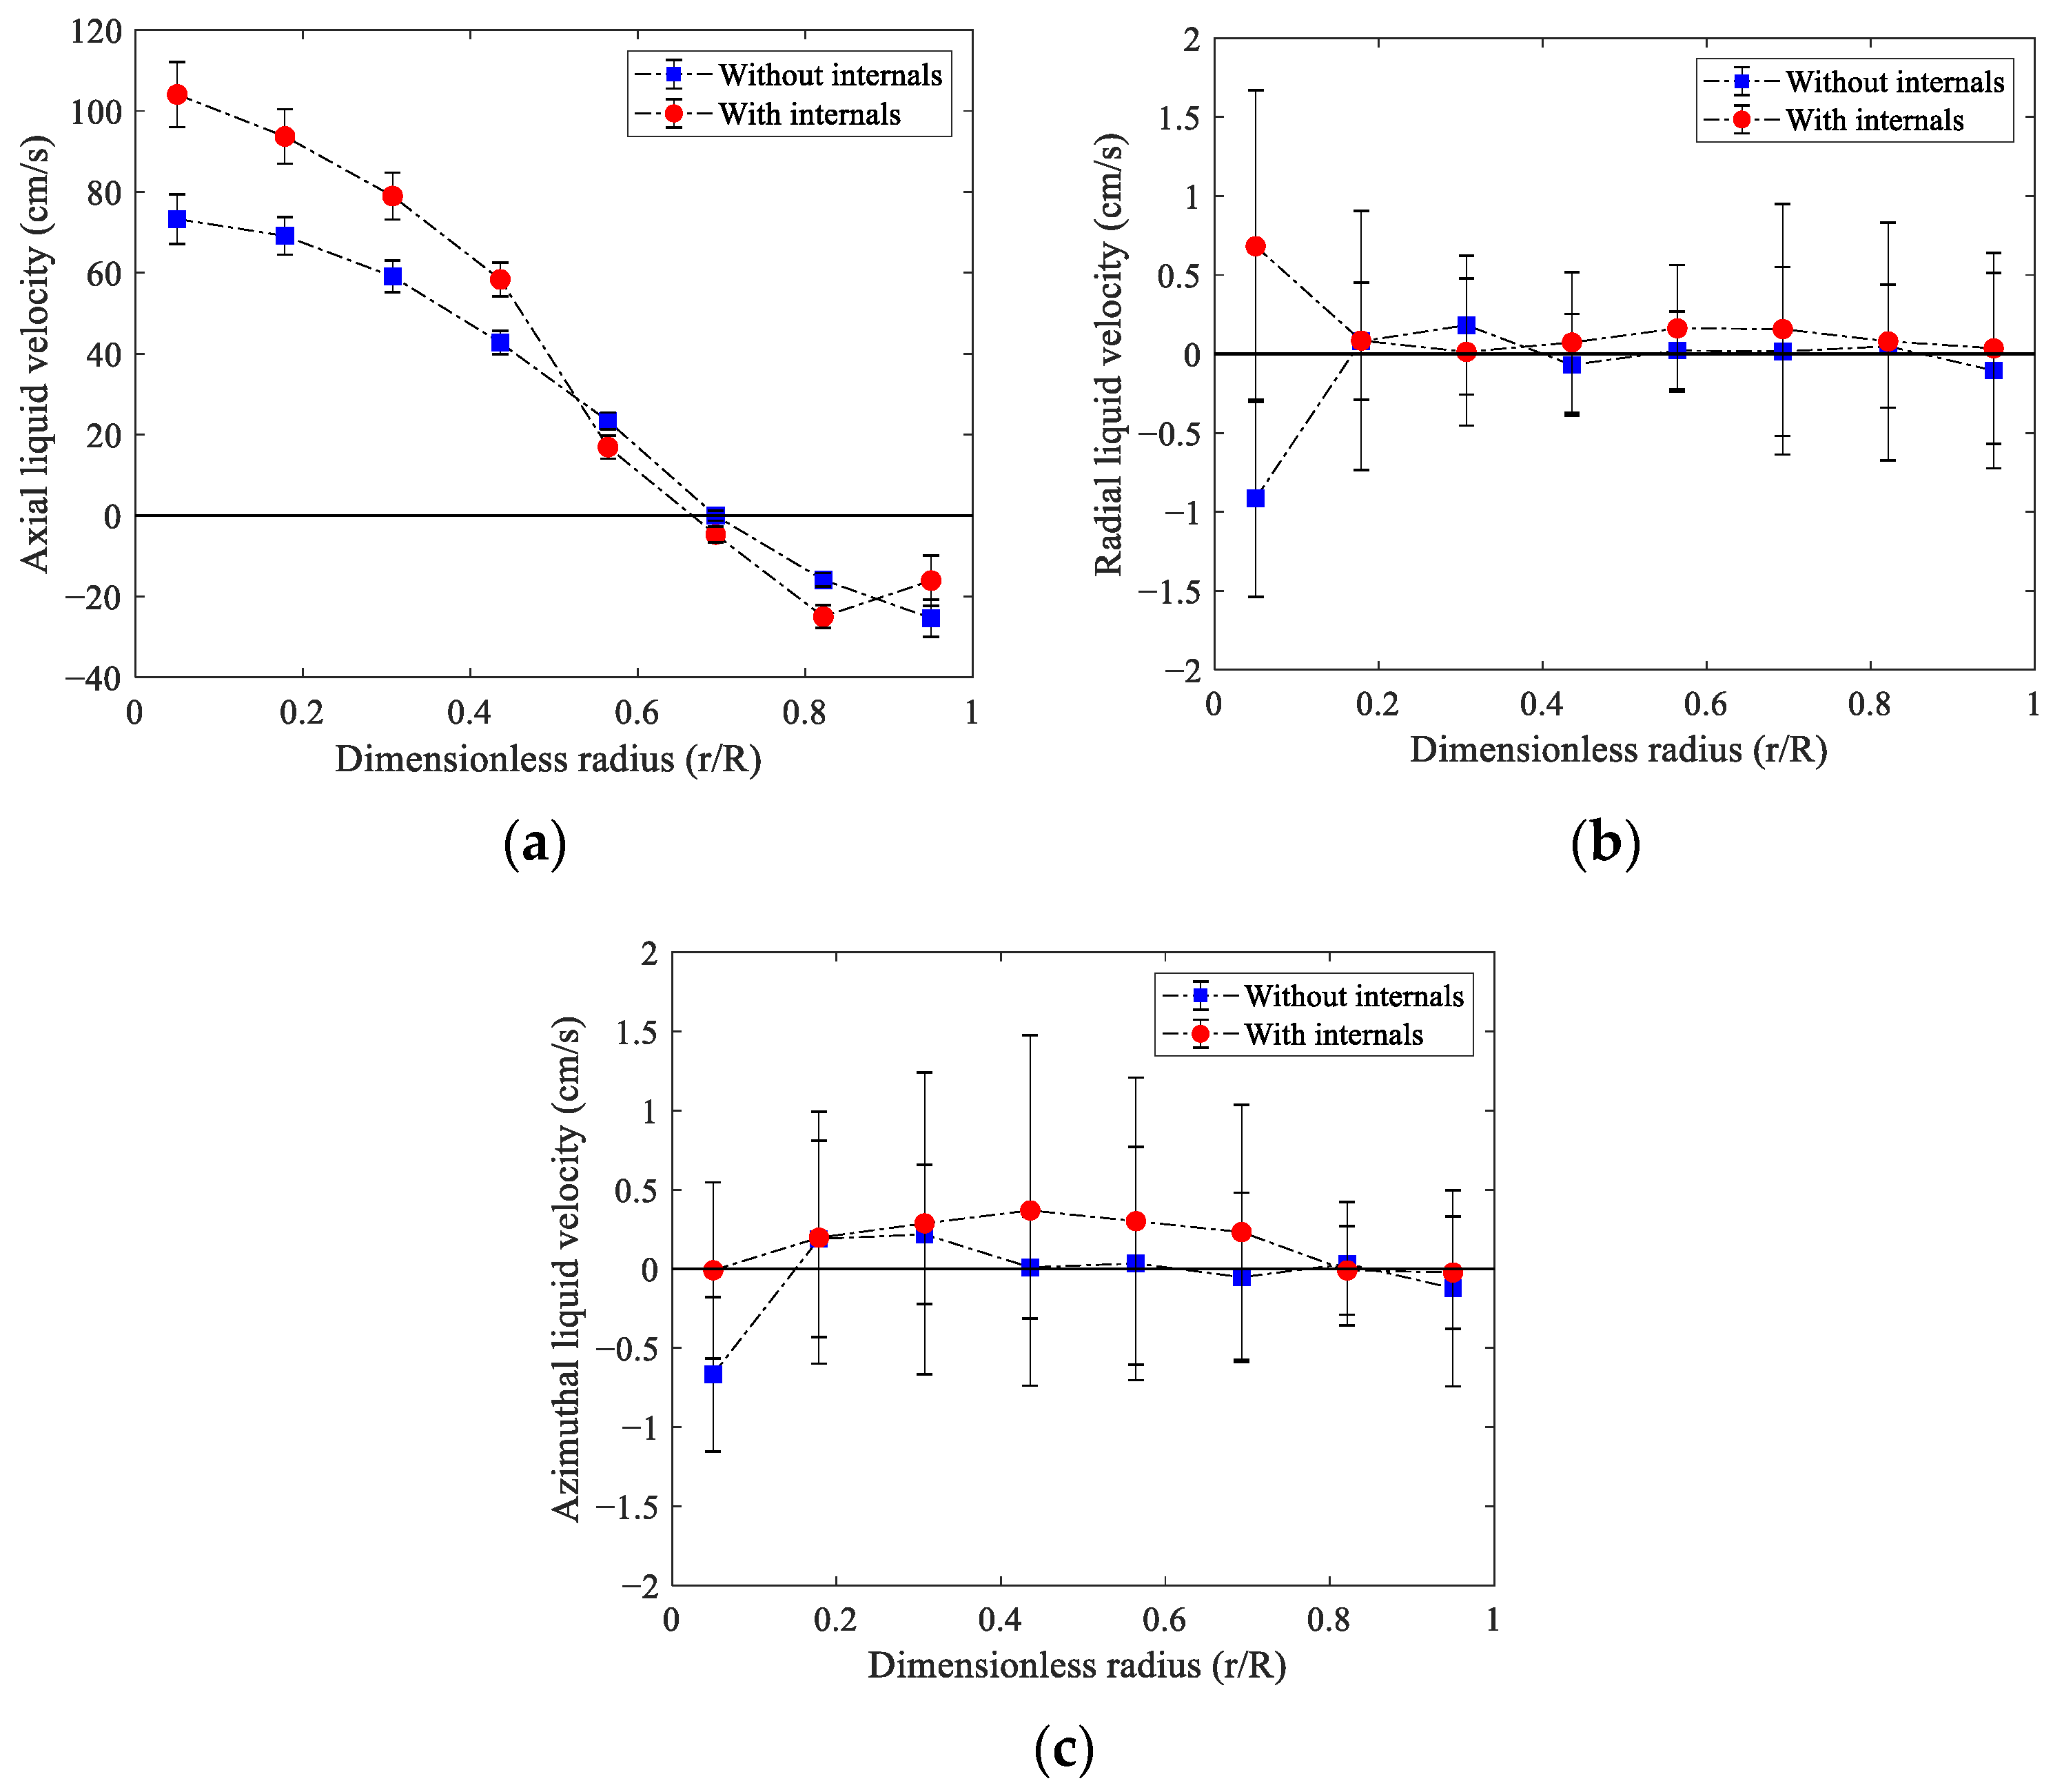
Figure 7 shows the time-averaged, axially averaged, and azimuthally averaged liquid velocities in terms of the dimensionless radius of the bubble column with and without vertical internals. The plotted error bars represent the standard deviation along the axial direction. From Figure 7a, it is shown that the time-averaged axial liquid velocity in the bubble column with and without internals is positive (upward) in the center of the column and negative (downward) near the column wall [2,30,52].
Due to the increased intensity of liquid recirculation, the presence of internals resulted in an increased magnitude of liquid in the center of the column. The axial liquid velocity in the center of the column increased by more than 30% at the same location using internals. When internals were present, the liquid axial velocity profiles became steeper, resulting in intense global recirculation between the column’s central region and the wall. The internals may reduce turbulence intensity, thus reducing fluctuations in liquid velocity components and turbulent diffusion. Therefore, as the mean liquid velocity increases, the liquid velocity profiles become steeper, dissipating the energy of the gas phase. The results generally agreed with the phenomenon of the gas phase in the bubble column that the gas phase is more at the center of the reactor [53,54]. Therefore, the gas phase has more momentum at the center of the column to carry the liquid phase to a higher level.
On the other hand, the value of the liquid velocity decreased near the wall in a downward direction because of the internals. As previously mentioned, the internals assisted in creating small channels inside the bubble column that increased the axial velocity in the center of the column. Jasim et al. [32] reported that dense internals give a consistently larger bubble chord length in the center and wall of bubble column reactors and increase bubble rise velocity. Alternatively, the value of the liquid velocity decreased near the wall in the downward direction because of the internals due to a decrease in gas holdup that forced the generation of eddies to circulate the liquid phase. Hence, the inversion point on the x-axis is when the value of axial liquid velocity is equal to zero. The inversion point of the bubble column without internals was about r/R = 0.69, which is consistent with the results reported in the literature [6,53,55,56]. In contrast, the inversion point was about r/R = 0.64 due to the vertical internals’ effect at the same superficial gas velocity. Thus, the down-flow of liquid at the wall in the bubble column is expected to cause backmixing of the liquid phase.
Figure 8b,c depicts the effect of the vertical internals on the radial and azimuthal liquid velocity in the bubble column. In general, this effect was insignificant compared with the effect of the internals on the axial liquid velocity. The velocities had a small value compared with the superficial gas velocity. However, many researchers have reported this effect due to axis symmetry and vertical construction of the column [1,36,49,53,57].
For the sake of comparison, Figure 8 shows the time-, azimuthally, axially averaged liquid axial velocity radial profile in the bubble column with and without internals of the axial liquid velocity in this study using a superficial gas velocity of 40 cm/s and in the Al-Mesfer et al. study [2] at a superficial gas velocity of 45 cm/s. The comparison is based on the effect of the configuration of the internals in the bubble column at the churn turbulent flow regimes. The main difference in the results is seen close to the wall in the bubble column with internals due to the design of the configuration. Also, the liquid axial velocity profile was smoothly steeper in the bubble column with internals, as reported by Al-Mesfer et al. [2]. As previously mentioned, Al-Mesfer et al. [2] used a hexagonal configuration, and the results were presented as azimuthally averaged liquid velocity radial profiles. This configuration design has been used to evaluate the effect of internals configuration on gas holdup distribution using gamma-ray computed tomography (CT) techniques by Sultan et al. [54]. They found that gas holdup distribution in a bubble column was not uniform based on a time-averaged cross-sectional image based on results of the CT technique. However, a previous study (Moller et al. [58]) has shown the effect of both configurations (hexagonal and square pitch) on the hydrodynamics in a bubble column with dense internals (which covered ~25% of the cross-sectional area) using ultrafast X-ray tomography. The study reported that a square pitch has a more uniform distribution on time-averaged cross-sectional holdup than a hexagonal pitch. Therefore, it is important to compare the axial velocity radial profile in the bubble column with and without internals at a selected level in the fully developed region with axially averaged liquid axial velocity in Figure 7a.
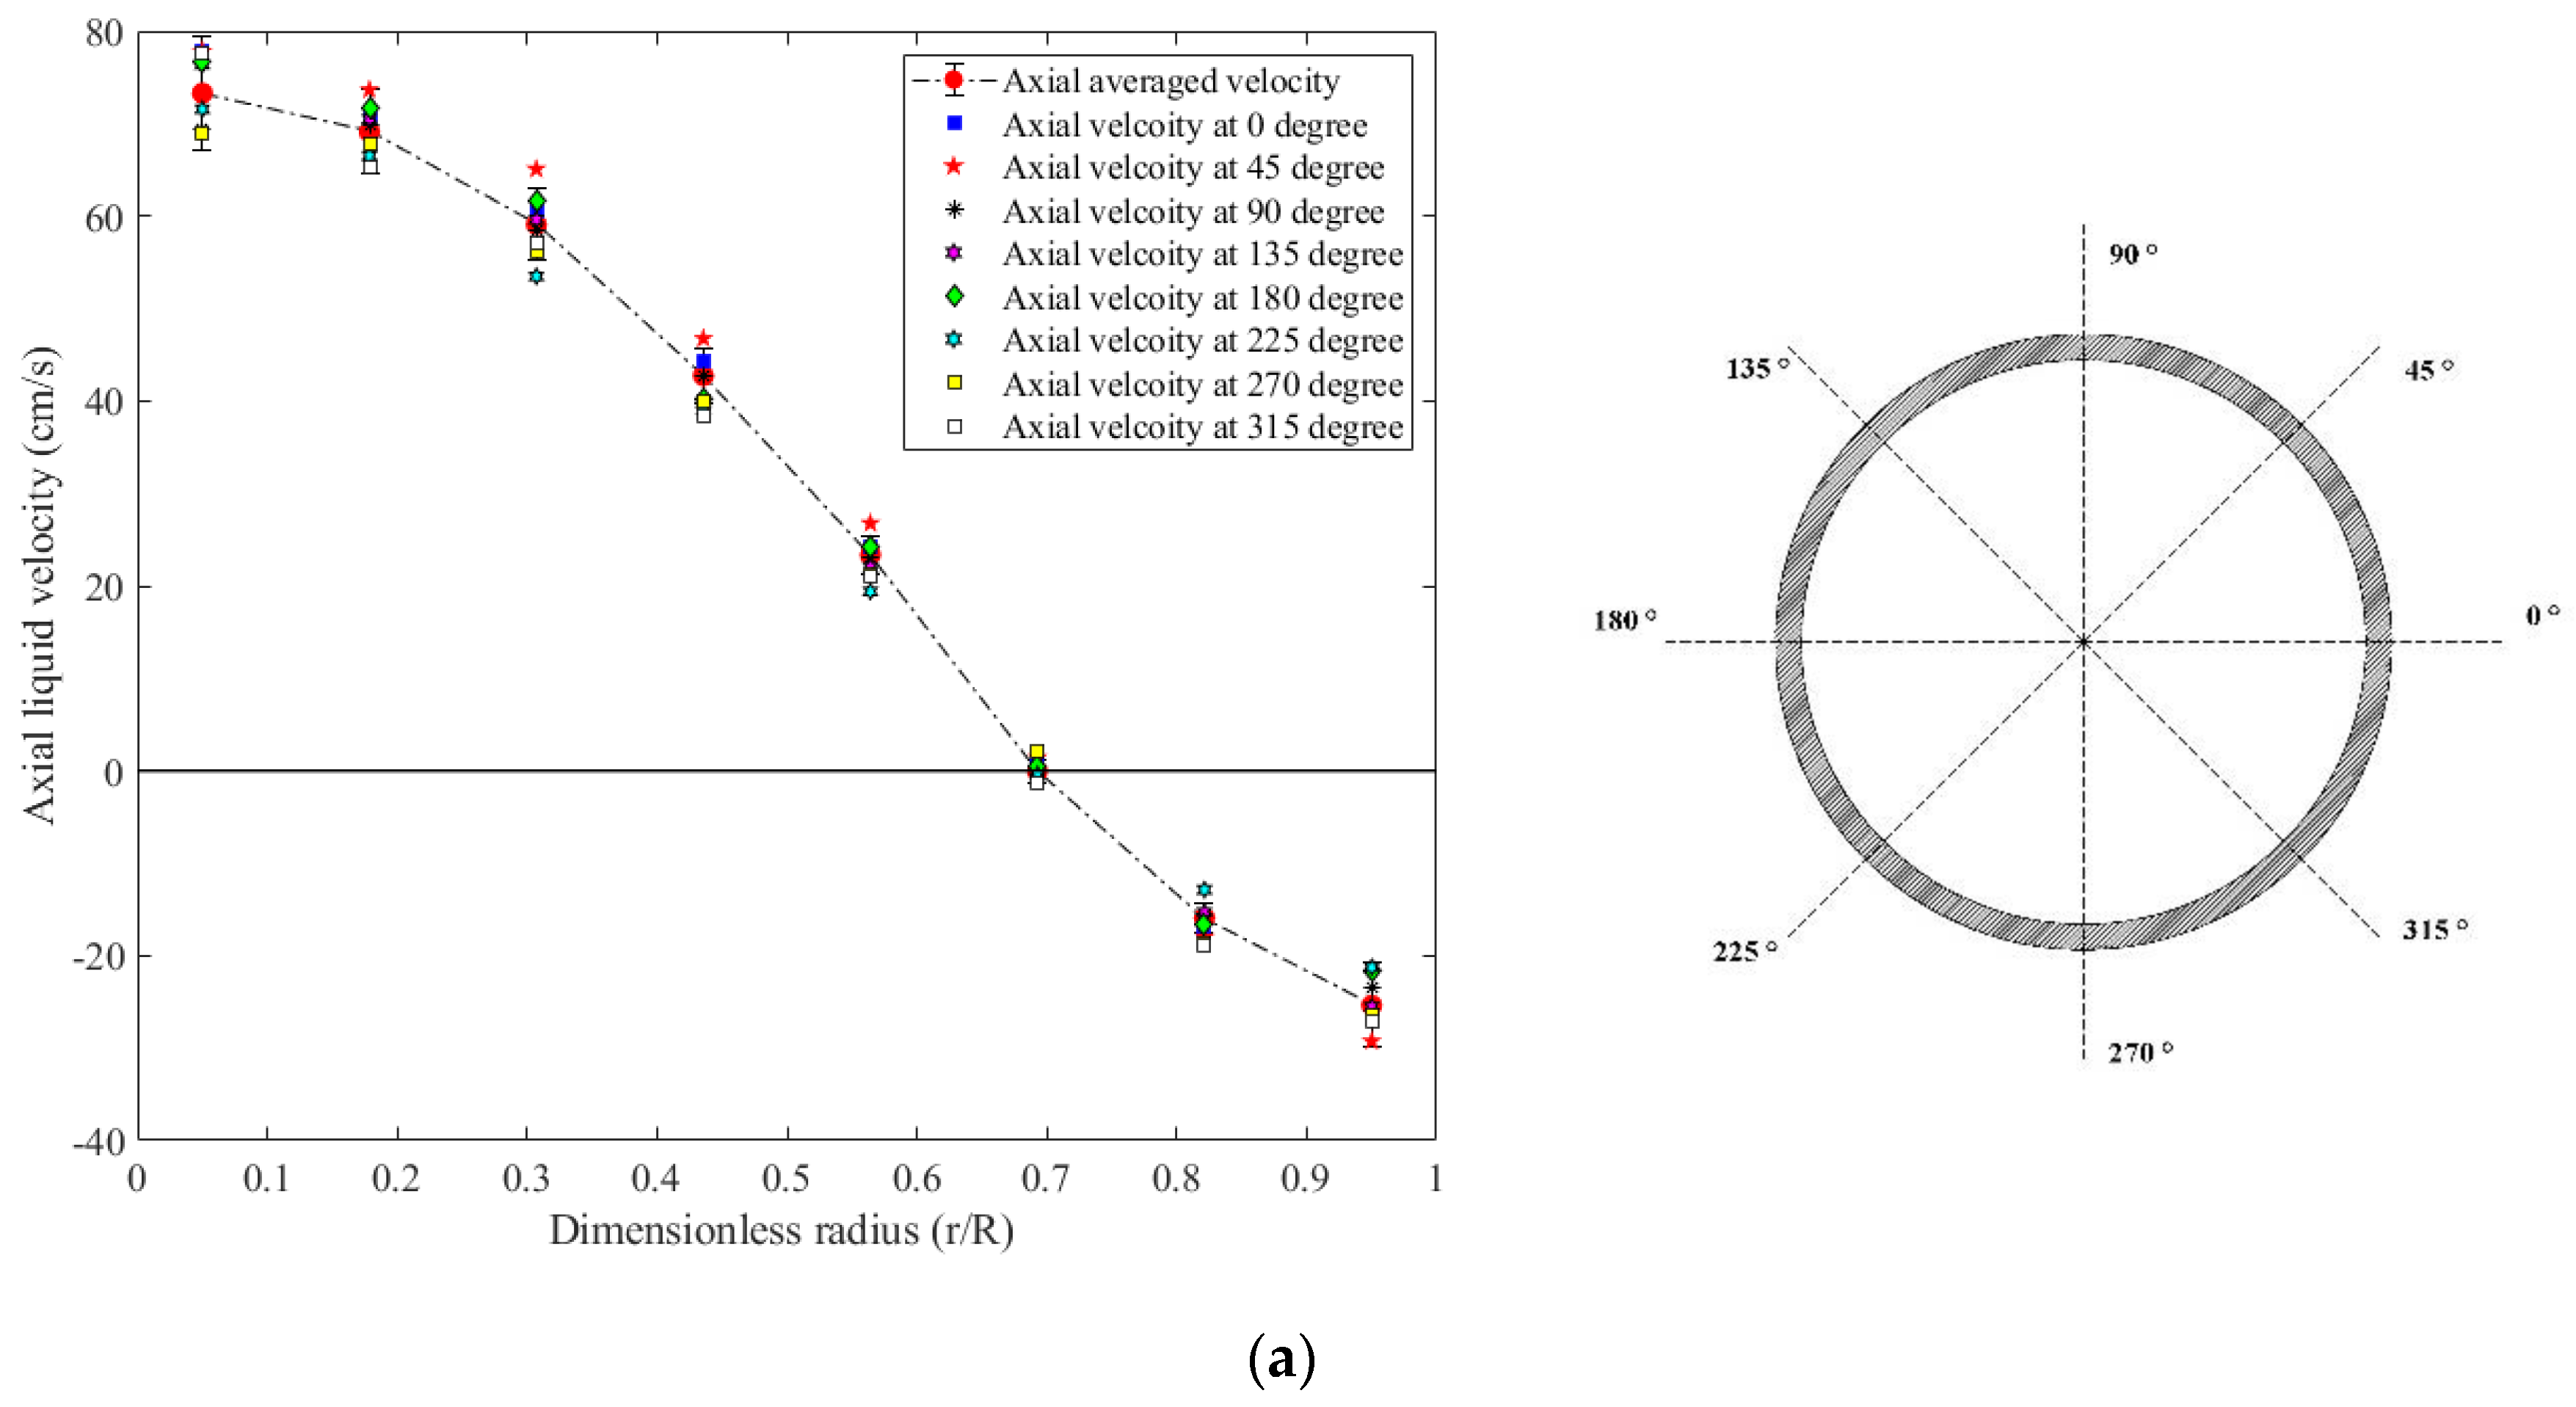
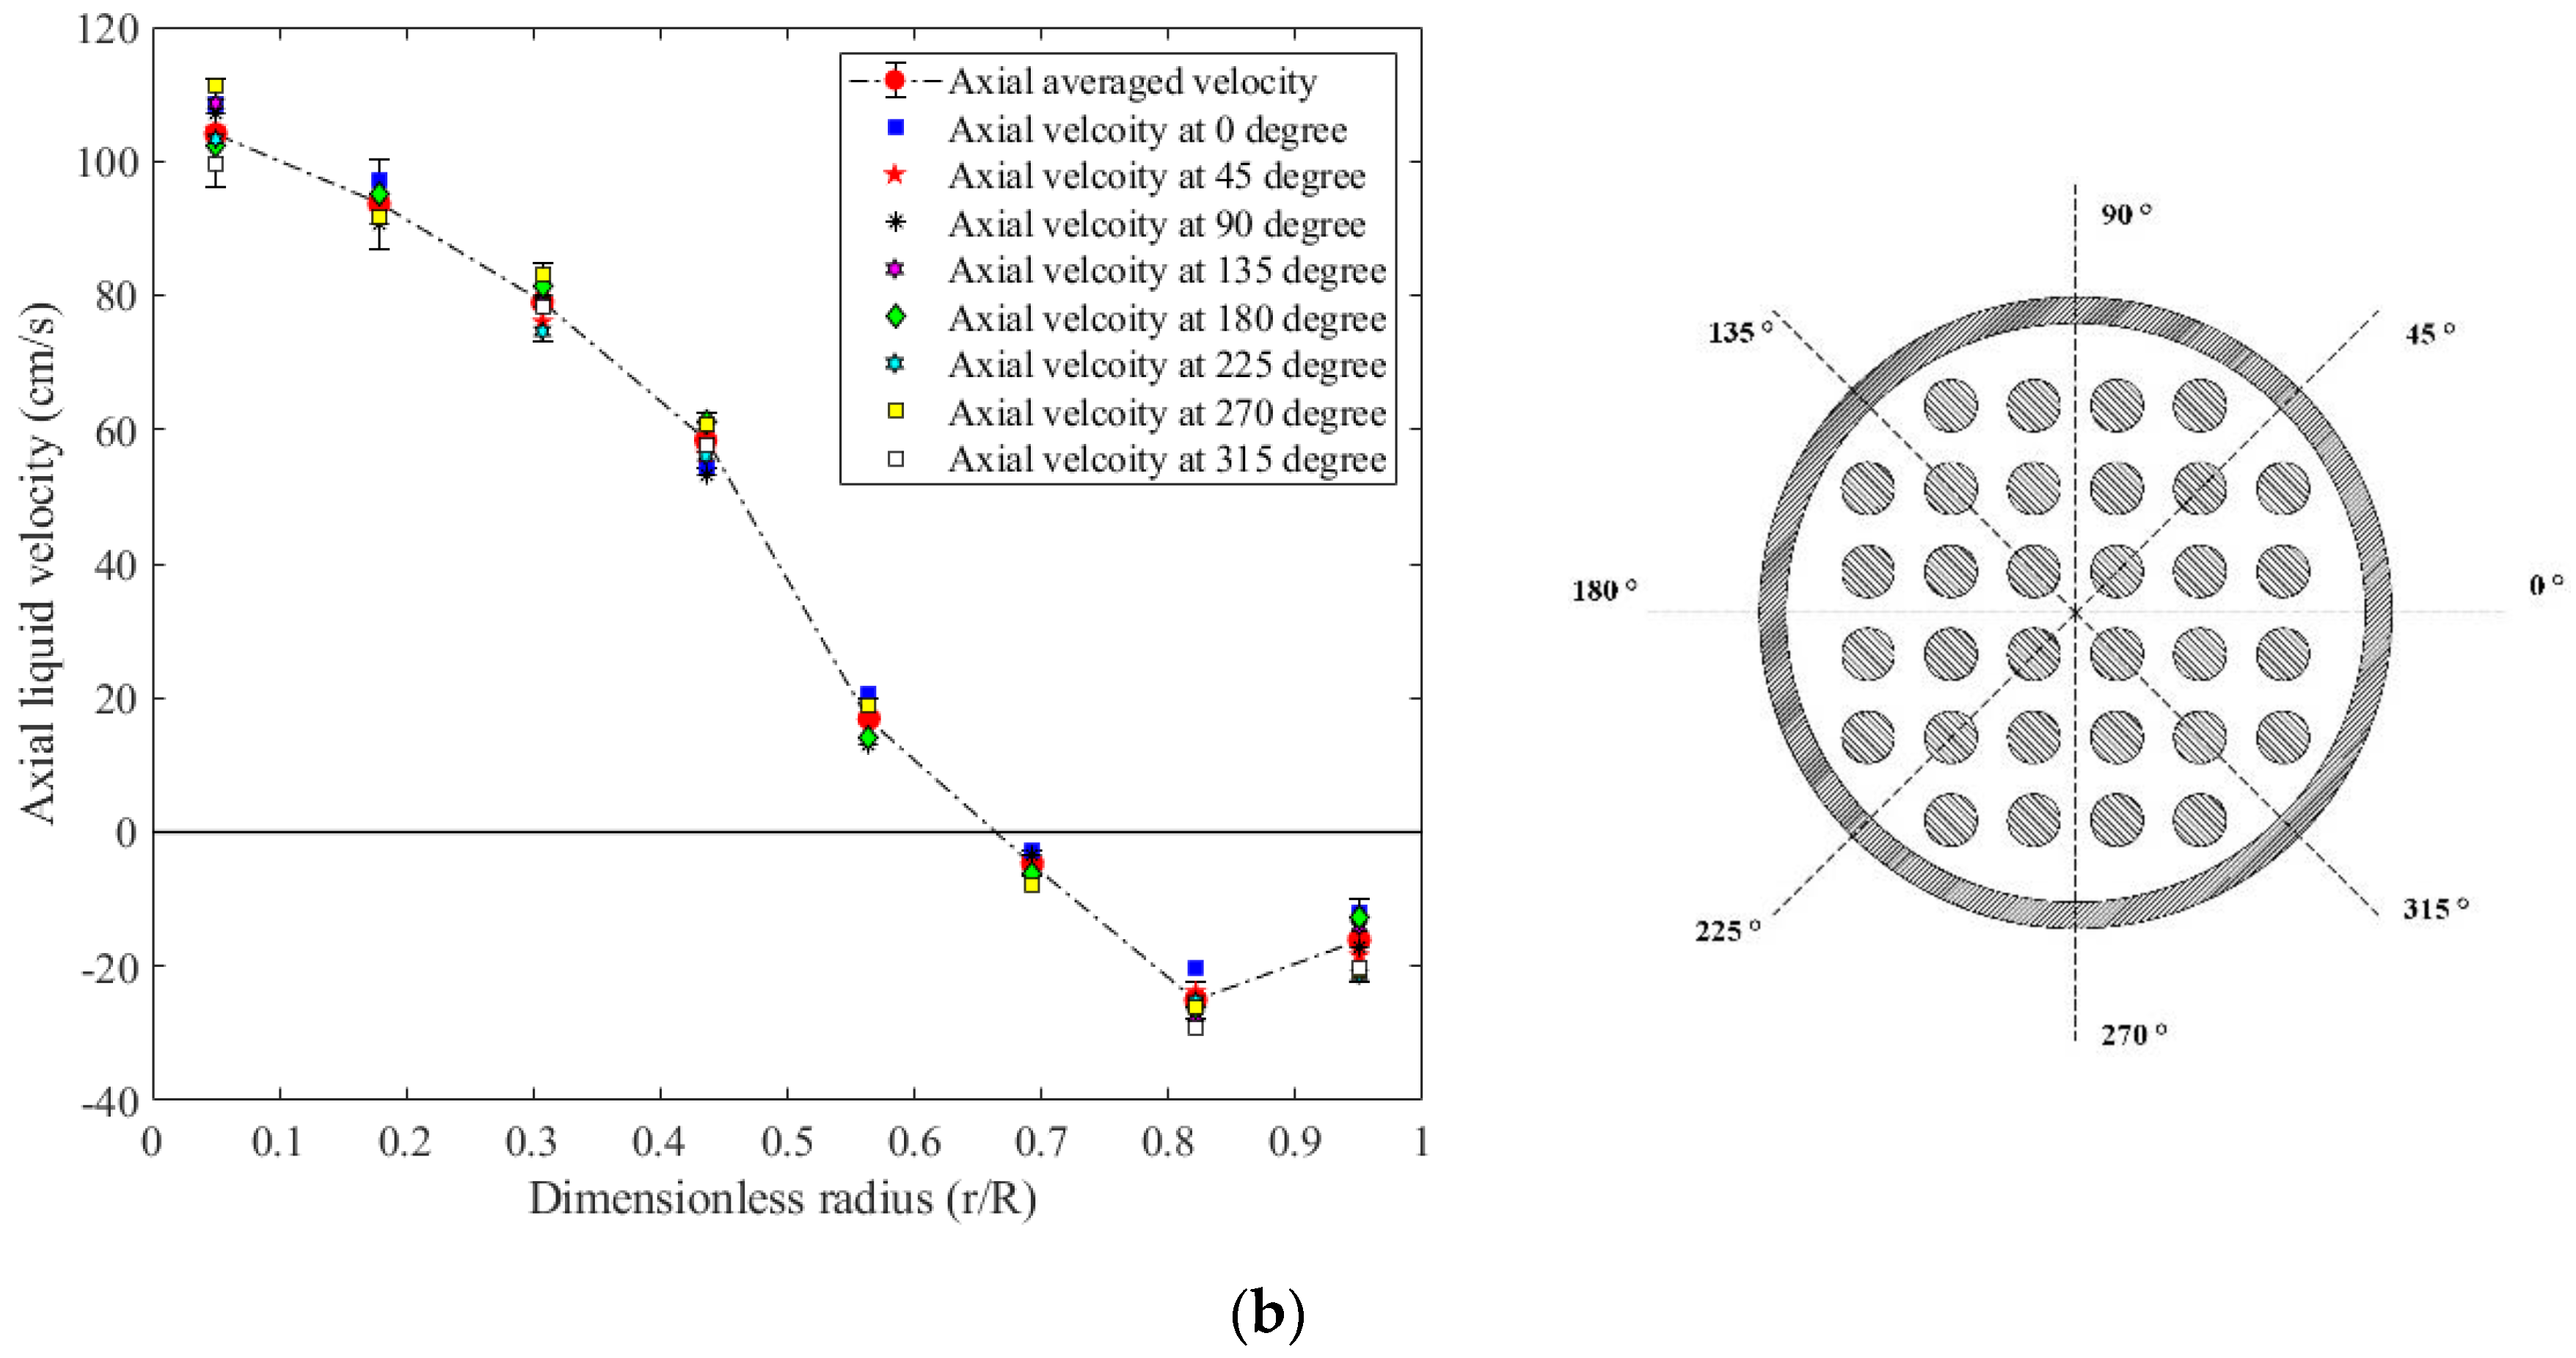
Figure 9a illustrates the local values of axial velocity components across the radius at eight different radius directions: 0, 45, 90, 135, 180, 225, 270, and 315 degrees. The values were close to the axially averaged liquid axial velocity, with a higher standard deviation of 3.67, and the variance is 15.78, close to the center of the column. However, the maximum standard deviation is 3.46, and the variance is 14.01, close to the wall zone in the bubble column with internals, as shown in Figure 9b. It is worth noting that certain compartments at 45, 135, 225, and 315 degrees were excluded from the liquid velocity calculations due to the presence of internals.
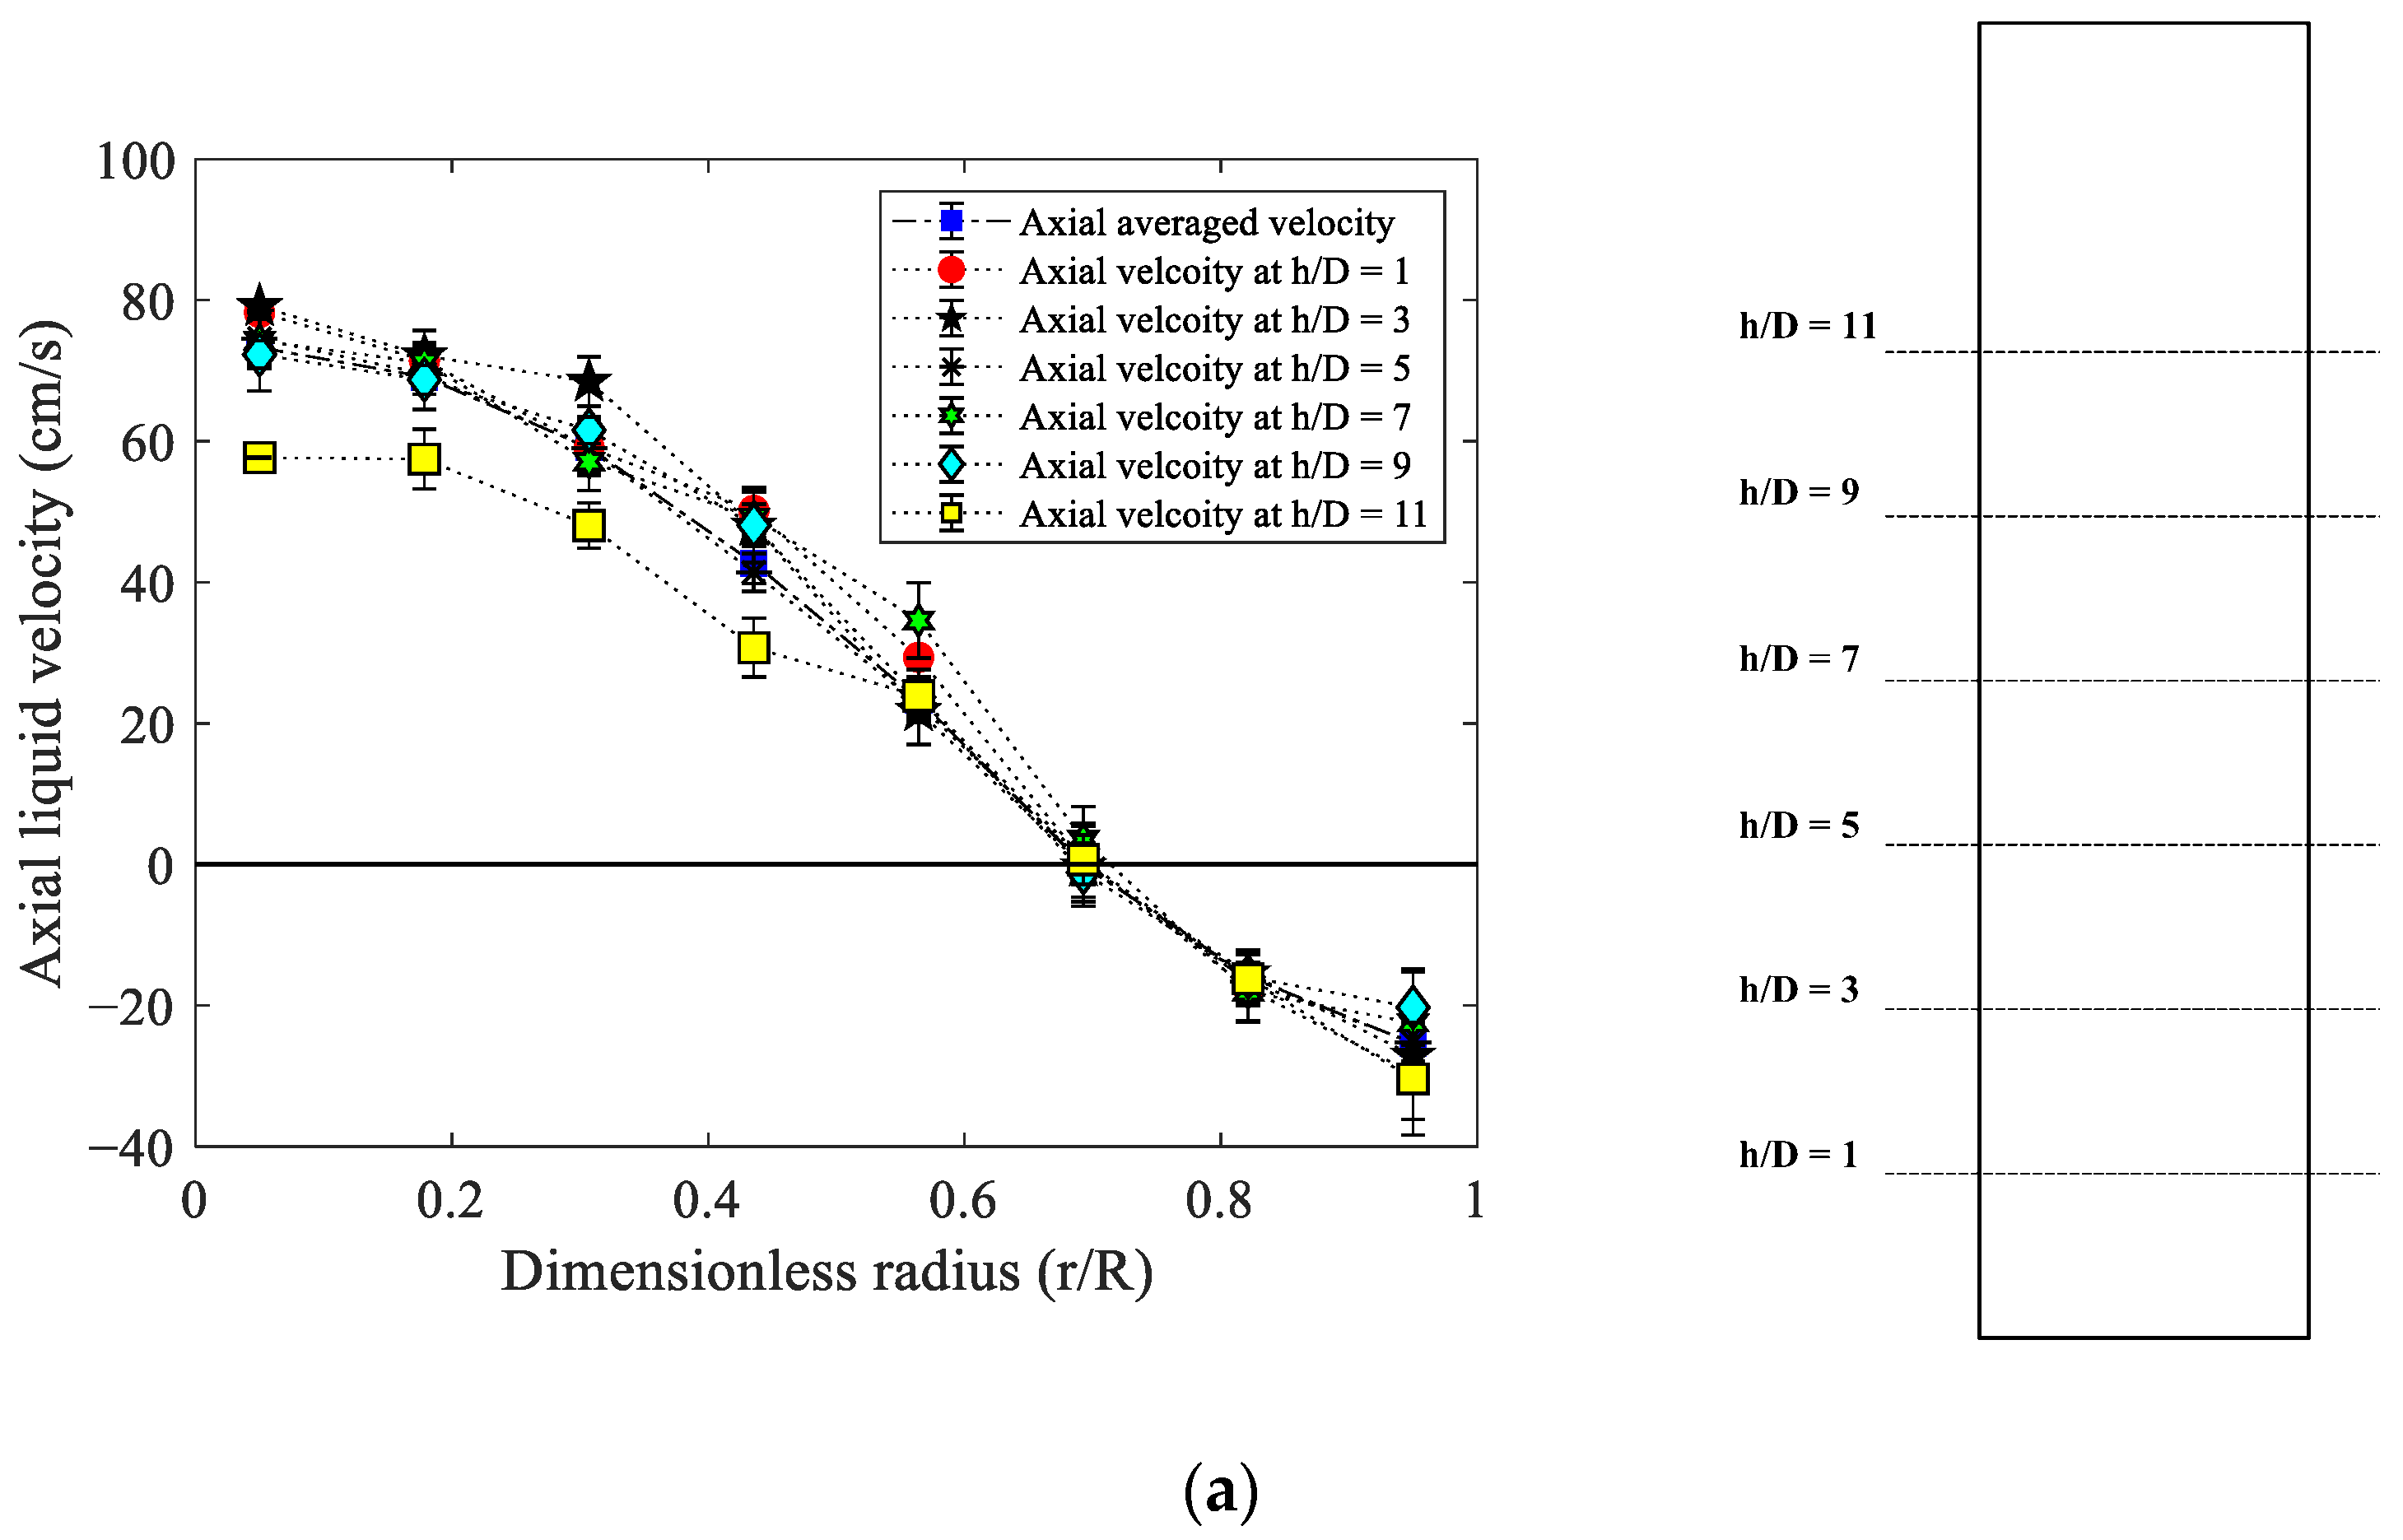
In order to compare the value of the time- and azimuthally averaged liquid axial velocity radial profiles with different axial locations of the bubble column with and without dense internals, six axial levels (h/D = 1, 3, 5, 7, 9, and 11) were selected to evaluate the azimuthally averaged liquid velocity radial profiles, as shown in Figure 10. It can be observed that the liquid velocity radial profiles at h/D = 11 were lower than the mean axial averaged velocity due to liquid circulation from the center of the column to the wall directly with and without internals. The results in Figure 10 are consistent with the axial profile of KDE (Figure 6a) where there was intensive recirculation (higher frequency of eddy movement) in the lower height of the columns and hence more occurrences of the radioactive particle at the lower heights h/D of 1, 2, and 3. Compared to the absence of internals, dense internals increase the variance of the liquid velocity profile along the height of the bubble column. As a result, it is critical to report axial liquid velocity radial profiles at various levels in order to provide a reliable dataset for validating CFD models.
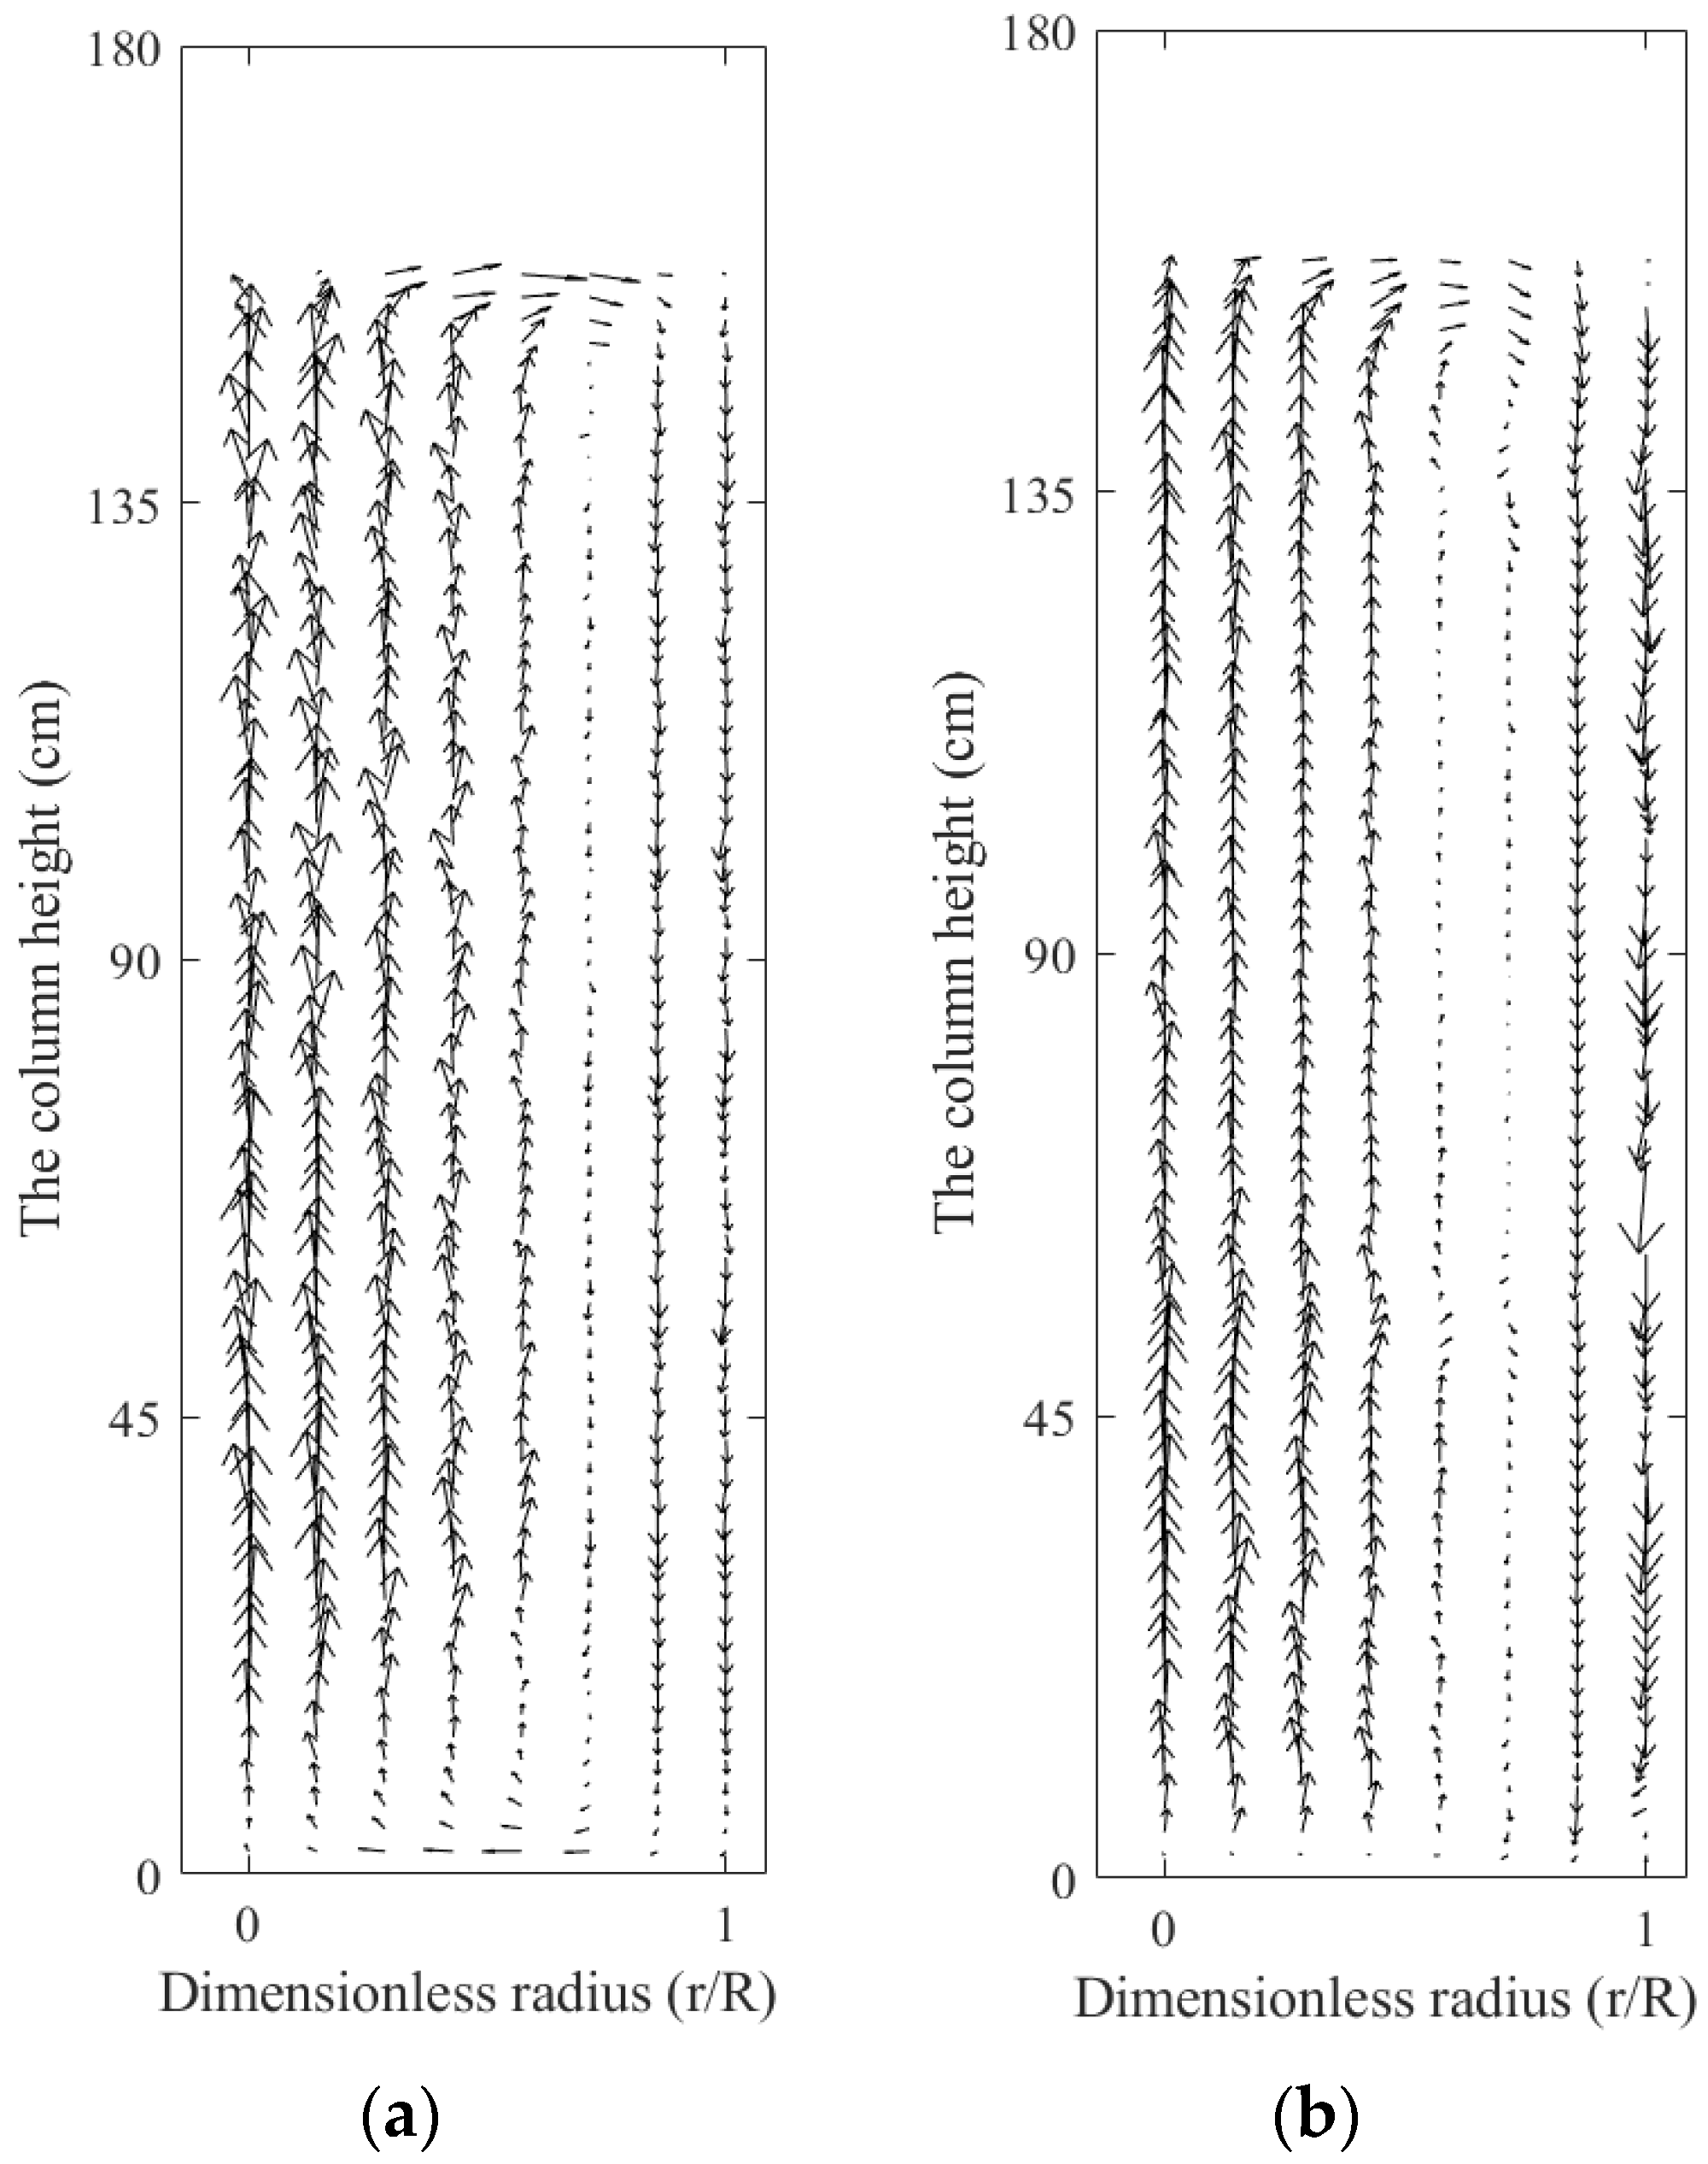
Additionally, liquid-phase velocity vectors in r–z plans of the bubble column with and without vertical internals are plotted in Figure 11. It can be observed that the recirculation pattern for both cases is the vectors pointed upward at the center of the column and downward at the wall. However, the vectors had more inclination radially than the vectors in the bubble column with internal rods and were more structured in the top direction.

4.3. Effect of Internals on Turbulent Parameters

Turbulent parameters of the liquid phase in the bubble column, such as normal stresses, shear stresses, and turbulent kinetic energy (TKE), can be estimated using the RPT technique [2,29,50,59]. Time-averaged turbulent parameters were calculated based on the liquid fluctuation velocities derived by subtracting instantaneous liquid velocities from time-averaged liquid velocities.
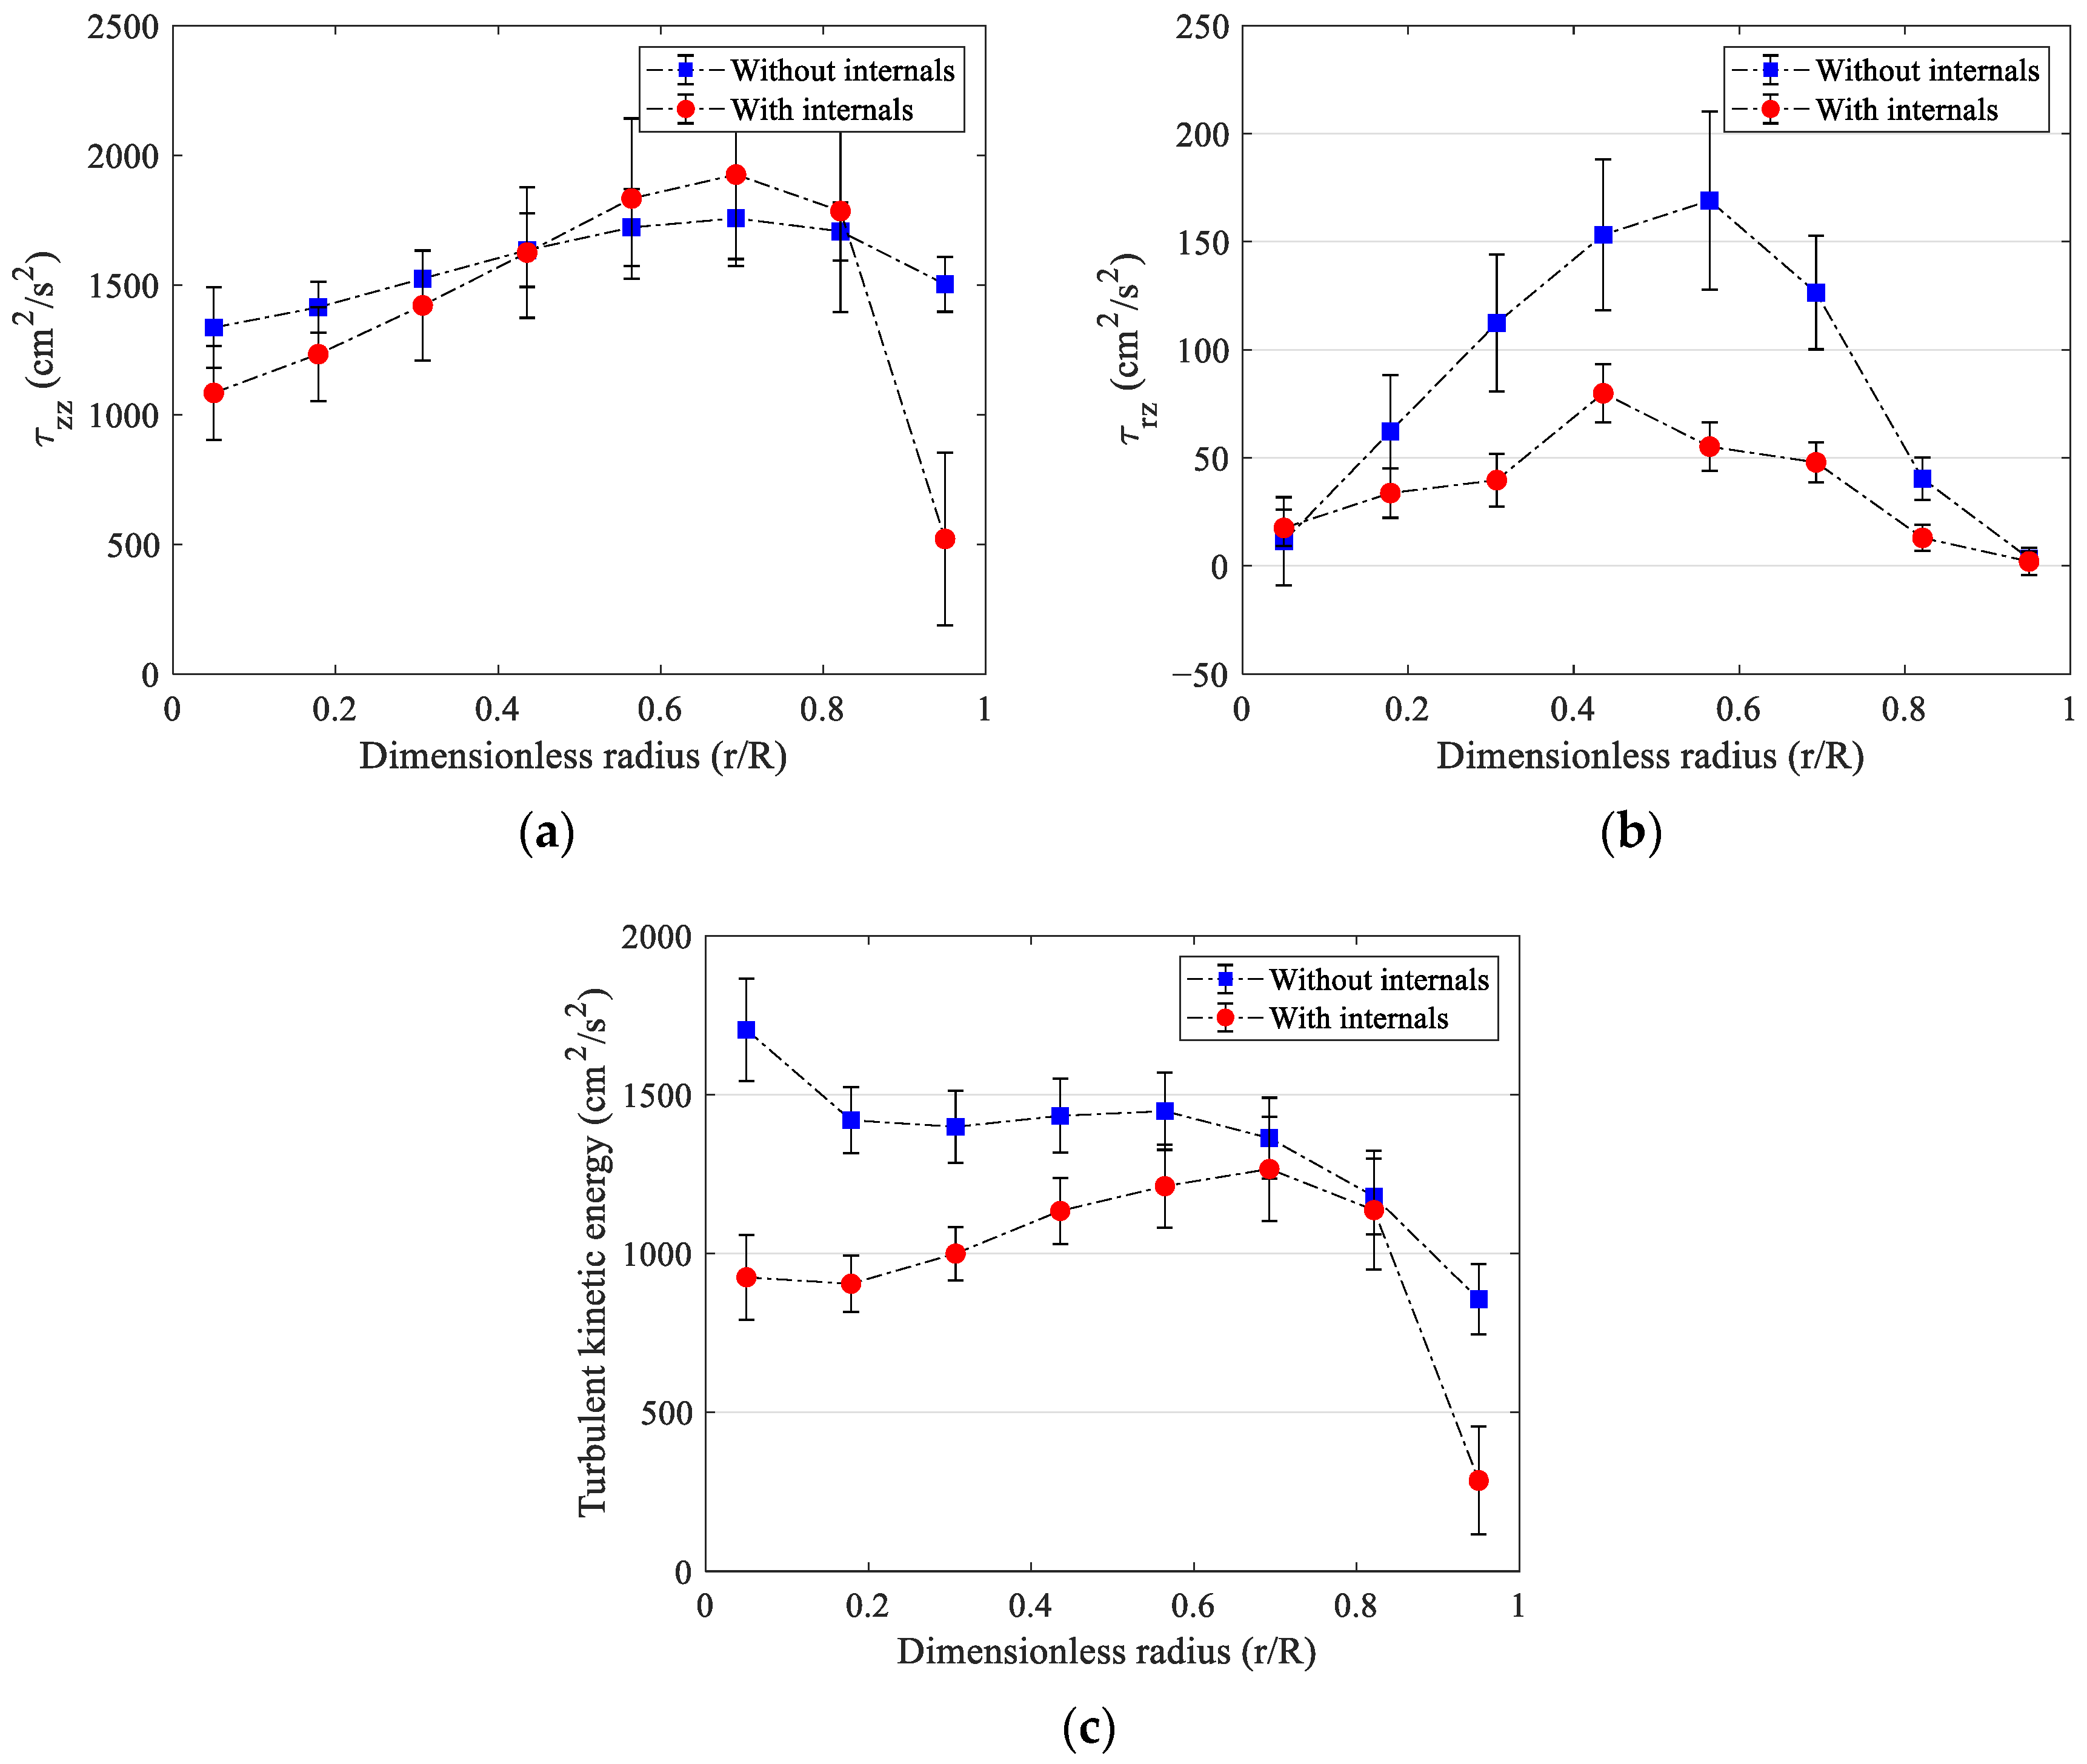
Figure 12a shows that liquid axial normal stress ( τ z z ) values decreased due to the internals effect at the center of the column. Furthermore, the presence of internals resulted in a significant decrease in normal liquid stresses compared to their values near the column’s wall region point without internals by more than 65%. As the flow direction transitions from upward to downward, the magnitudes of peak liquid axial normal stresses were observed to be in close proximity to the inversion. However, when internals were used, fluctuations were reduced, resulting in a decrease in the values of normal liquid stress at the inversion point.
On the other hand, liquid shear stress ( τ r z ) values had a similar behavior to the liquid normal stress. Higher magnitude values are present near the inversion point for the bubble column with/without internals compared to the center and near the wall of the column, as shown in Figure 12b. Nevertheless, the internal rods led to a decrease in the value of liquid shear stress sharply to more than 200% at the inversion point because of the effect of the internals on liquid velocity fluctuations. This effect was more pronounced in this area than near the wall and center of the column.
Figure 12c illustrates the azimuthally averaged radial profile of the liquid phase’s turbulent kinetic energy (TKE) in the bubble column with and without vertical internals. The values of TKE in the column without internals were higher magnitude values than with the presence of internals. The presence of internals resulted in a more abrupt decrease in the liquid TKE value when compared to values located in the center of the column and close to the wall region without internals. For instance, at r ≈ 0.95, TKE magnitude values decreased by more than 65% when internals were present. Furthermore, TKE amounts without internals decreased by around 80% at the column center compared to the column with internals at the same superficial gas velocity. Thus, the effect of the internals decreased the value of TKE by increasing averaged liquid velocities and liquid circulation. This result aligns with the previous study reported by Al Mesfer et al. [2].

5. Conclusions

This work has developed and validated a new methodology for implementing RPT in a bubble column with dense internals. The experimental investigation was conducted to study the impact of dense internals on the hydrodynamics of the liquid phase. The obtained results are deemed reliable for the first time, making them suitable for validation of computational fluid dynamics (CFD) models. The key findings are briefly summarized in the following points:
-
The integrated method using MCNP simulation and a calibration dataset from RPT successfully generated a huge number of calibration points to enhance the accuracy of the reconstruction of radioactive particle positions, as shown in the validation steps of the bubble column with and without dense internals. The maximum relative error for both cases of each validation point was less than 4.2%.
-
A similarity algorithm can be used to reconstruct the instantaneous positions of the radioactive particle with less computation power over a short time.
-
The square pitch configuration generated symmetric flow patterns that can be used to average azimuthally averaged liquid velocity fields.
-
Dense internal rods increased time-averaged axial liquid velocity in the center of the column by creating channels in the bubble column but dampened fluctuations and hence turbulent parameters. Thus, liquid axial normal stress values decreased due to the effect of rods at the center of the column and near the wall.
Further studies to gain insight into the flow of different size bubble columns with and without dense internals using RPT techniques are in progress in our laboratory.

Author Contributions

Conceptualization, M.A.-D.; Methodology, O.J.F., B.Q. and M.A.-D.; Validation, O.J.F.; Formal analysis, O.J.F., A.F.V., B.Q. and M.A.-D.; Investigation, O.J.F., A.F.V., B.Q. and M.A.-D.; Resources, O.J.F. and M.A.-D.; Data Curation, O.J.F.; Writing—Original Draft, O.J.F. and M.A.-D.; Writing—Review and Editing, O.J.F., B.Q. and M.A.-D.; Visualization, O.J.F.; Supervision, M.A.-D.; Funding acquisition, M.A.-D. All authors have read and agreed to the published version of the manuscript.

Funding

This research received no external funding.

Data Availability Statement

Not applicable.

Conflicts of Interest

The authors declare no conflict of interest.

References

  1. Han, L.; Kamalanathan, P.; Al-Dahhan, M. Study of the detailed catalyst hydrodynamics using radioactive particle tracking technique in a mimicked Fischer-Tropsch slurry bubble column. Chem. Eng. Sci. 2021, 241, 116659. [Google Scholar] [CrossRef]
  2. Al Mesfer, M.K.; Sultan, A.J.; Al-Dahhan, M.H. Study the Effect of Dense Internals on the Liquid Velocity Field and Turbulent Parameters in Bubble Column for Fischer–Tropsch (FT) Synthesis by Using Radioactive Particle Tracking (RPT) Technique. Chem. Eng. Sci. 2016, 161, 228–248. [Google Scholar] [CrossRef]
  3. Kagumba, M.; Al-Dahhan, M.H. Impact of internals size and configuration on bubble dynamics in bubble columns for alternative clean fuels production. Ind. Eng. Chem. Res. 2015, 54, 1359–1372. [Google Scholar] [CrossRef]
  4. Kumar, S.B.; Moslemian, D.; Duduković, M.P. Gas-Holdup Measurements in Bubble Columns Using Computed Tomography. AIChE J. 1997, 43, 1414–1425. [Google Scholar] [CrossRef]
  5. Veera, U.P.; Joshi, J.B. Measurement of gas hold-up profiles by gamma ray tomography: Effect of sparger design and height of dispersion in bubble columns. Chem. Eng. Res. Des. 1999, 77, 303–317. [Google Scholar] [CrossRef]
  6. Devanathan, N.; Moslemian, D.; Dudukovic, M.P. Flow mapping in bubble columns using CARPT. Chem. Eng. Sci. 1990, 45, 2285–2291. [Google Scholar] [CrossRef]
  7. Yang, Y.B.; Devanathan, N.; Duduković, M.P. Liquid backmixing in bubble columns via computer-automated radioactive particle tracking (CARPT). Exp. Fluids 1993, 16, 1–9. [Google Scholar] [CrossRef]
  8. Upadhyay, R.K.; Pant, H.J.; Roy, S. Liquid flow patterns in rectangular air-water bubble column investigated with Radioactive Particle Tracking. Chem. Eng. Sci. 2013, 96, 152–164. [Google Scholar] [CrossRef]
  9. Degaleesan, S.; Roy, S.; Kumar, S.B.; Duduković, M.P. Liquid mixing based on convection and turbulent dispersion in bubble columns. Chem. Eng. Sci. 1996, 51, 1967–1976. [Google Scholar] [CrossRef]
  10. Jung, H.; Yang, J.I.; Yang, J.H.; Lee, H.T.; Chun, D.H.; Kim, H.J. Investigation of Fischer-Tropsch synthesis performance and its intrinsic reaction behavior in a bench scale slurry bubble column reactor. Fuel Process. Technol. 2010, 91, 1839–1844. [Google Scholar] [CrossRef]
  11. Basha, O.M.; Sehabiague, L.; Abdel-Wahab, A.; Morsi, B.I. Fischer-Tropsch Synthesis in Slurry Bubble Column Reactors: Experimental Investigations and Modeling—A Review. Int. J. Chem. React. Eng. 2015, 13, 201–288. [Google Scholar] [CrossRef]
  12. Van de Loosdrecht, J.; Botes, F.G.; Ciobica, I.M.; Ferreira, A.C.; Gibson, P.; Moodley, D.J.; Saib, A.M.; Visagie, J.L.; Weststrate, C.J.; Niemantsverdriet, J.W. Fischer-Tropsch Synthesis: Catalysts and Chemistry; Elsevier Ltd.: Amsterdam, The Netherlands, 2013; Volume 7. [Google Scholar]
  13. Youssef, A.; Al-Dahhan, M. Impact of Internals on the Gas Holdup and Bubble Properties of a Bubble Column. Ind. Eng. Chem. Res. 2009, 48, 8007–8013. [Google Scholar] [CrossRef]
  14. An, M.; Guan, X.; Yang, N.; Bu, Y.; Xu, M.; Men, Z. Effects of internals on fluid dynamics and reactions in pilot-scale slurry bubble column reactors: A CFD study for Fischer-Tropsch synthesis. Chem. Eng. Process. Process Intensif. 2018, 132, 194–207. [Google Scholar] [CrossRef]
  15. Manjrekar, O.N.; Dudukovic, M.P. Application of a 4-point optical probe to a Slurry Bubble Column Reactor. Chem. Eng. Sci. 2015, 131, 313–322. [Google Scholar] [CrossRef]
  16. Shaikh, A.; Al-Dahhan, M. A new method for online flow regime monitoring in bubble column reactors via nuclear gauge densitometry. Chem. Eng. Sci. 2013, 89, 120–132. [Google Scholar] [CrossRef]
  17. Behkish, A.; Men, Z.; Inga, J.R.; Morsi, B.I. Mass transfer characteristics in a large-scale slurry bubble column reactor with organic liquid mixtures. Chem. Eng. Sci. 2002, 57, 3307–3324. [Google Scholar] [CrossRef]
  18. Abdulmohsin, R.S.; Abid, B.A.; Al-Dahhan, M.H. Heat transfer study in a pilot-plant scale bubble column. Chem. Eng. Res. Des. 2011, 89, 78–84. [Google Scholar] [CrossRef]
  19. Ahmed, F.S.; Sensenich, B.A.; Gheni, S.A.; Znerdstrovic, D.; Al Dahhan, M.H. Bubble dynamics in 2D bubble column: Comparison between high-speed camera imaging analysis and 4-point optical probe. Chem. Eng. Commun. 2015, 202, 85–95. [Google Scholar] [CrossRef]
  20. Esmaeili, A.; Guy, C.; Chaouki, J. The effects of liquid phase rheology on the hydrodynamics of a gas-liquid bubble column reactor. Chem. Eng. Sci. 2015, 129, 193–207. [Google Scholar] [CrossRef]
  21. Gupta, A.; Roy, S. Euler-Euler simulation of bubbly flow in a rectangular bubble column: Experimental validation with Radioactive Particle Tracking. Chem. Eng. J. 2013, 225, 818–836. [Google Scholar] [CrossRef]
  22. De Mesquita, C.H.; De Sousa Carvalho, D.V.; Kirita, R.; Vasquez, P.A.S.; Hamada, M.M. Gas-liquid distribution in a bubble column using industrial gamma-ray computed tomography. Radiat. Phys. Chem. 2014, 95, 396–400. [Google Scholar] [CrossRef]
  23. Besagni, G.; Inzoli, F. The effect of liquid phase properties on bubble column fluid dynamics: Gas holdup, flow regime transition, bubble size distributions and shapes, interfacial areas and foaming phenomena. Chem. Eng. Sci. 2017, 170, 270–296. [Google Scholar] [CrossRef]
  24. Jasim, A.A.; Sultan, A.J.; Al-Dahhan, M.H. Impact of heat exchanging internals configurations on the gas holdup and bubble properties in a bubble column. Int. J. Multiph. Flow 2019, 112, 63–82. [Google Scholar] [CrossRef]
  25. Sultan, A.J.; Sabri, L.S.; Al-Dahhan, M.H. Influence of the size of heat exchanging internals on the gas holdup distribution in a bubble column using gamma-ray computed tomography. Chem. Eng. Sci. 2018, 186, 1–25. [Google Scholar] [CrossRef]
  26. Al-Naseri, H.; Schlegel, J.P.; Al-Dahhan, M.H. The effects of internals and low aspect ratio on the fully developed flow region and bubble properties in a pilot-plant bubble column. Exp. Therm. Fluid Sci. 2019, 104, 284–301. [Google Scholar] [CrossRef]
  27. Sultan, A.J.; Sabri, L.S.; Shao, J.; Al-Dahhan, M.H. Overcoming the gamma-ray computed tomography data processing pitfalls for bubble column equipped with vertical internal tubes. Can. J. Chem. Eng. 2018, 96, 2206–2226. [Google Scholar] [CrossRef]
  28. Rados, N. Slurry Bubble Column Hydrodynamics; Washington University: St. Louis, MO, USA, 2003. [Google Scholar]
  29. Rados, N.; Shaikh, A.; Al-Dahhan, M.H. Solids flow mapping in a high pressure slurry bubble column. Chem. Eng. Sci. 2005, 60, 6067–6072. [Google Scholar] [CrossRef]
  30. Kalaga, D.V.; Yadav, A.; Goswami, S.; Bhusare, V.; Pant, H.J.; Dalvi, S.V.; Joshi, J.B.; Roy, S. Comparative analysis of liquid hydrodynamics in a co-current flow-through bubble column with densely packed internals via radiotracing and Radioactive Particle Tracking (RPT). Chem. Eng. Sci. 2017, 170, 332–346. [Google Scholar] [CrossRef]
  31. Al Mesfer, M. Effect of Dense Heat Exchanging Internals On the Hydrodynamics of Bubble Column Reactors Using Non-Invasive Measurement Techniques. Ph.D. Thesis, Missouri University of Science and Technology, Rolla, MO, USA, 2013; pp. 1–198. [Google Scholar]
  32. Jasim, A.A.; Sultan, A.J.; Al-Dahhan, M.H. Influence of heat-exchanging tubes diameter on the gas holdup and bubble dynamics in a bubble column. Fuel 2019, 236, 1191–1203. [Google Scholar] [CrossRef]
  33. Youssef, A.A.; Hamed, M.E.; Grimes, J.T.; Al-Dahhan, M.H.; Duduković, M.P. Hydrodynamics of pilot-scale bubble columns: Effect of internals. Ind. Eng. Chem. Res. 2013, 52, 43–55. [Google Scholar] [CrossRef]
  34. Youssef, A.A.; Al-Dahhan, M.H.; Dudukovic, M.P. Bubble columns with internals: A review. Int. J. Chem. React. Eng. 2013, 11, 169–223. [Google Scholar] [CrossRef]
  35. Farid, O.; Qi, B.; Uribe, S.; Al-dahhan, M. New dual modality technique of gamma-ray densitometry (GRD) and optical fiber probe (OFP) to investigate line-averaged diameter profiles of gas, liquid, and solid holdups along the height of a slurry bubble column. Chem. Eng. Sci. 2023, 119032. [Google Scholar] [CrossRef]
  36. Sabri, L.S.; Sultan, A.J.; Al-Dahhan, M.H. Mapping of microalgae culturing via radioactive particle tracking. Chem. Eng. Sci. 2018, 192, 739–758. [Google Scholar] [CrossRef]
  37. Vesvikar, M.S.; Al-Dahhan, M. Hydrodynamics investigation of laboratory-scale Internal Gas-lift loop anaerobic digester using non-invasive CAPRT technique. Biomass Bioenergy 2016, 84, 98–106. [Google Scholar] [CrossRef] [Green Version]
  38. Mosorov, V. An iterative position reconstruction algorithm for radioactive particle techniques. Appl. Radiat. Isot. 2013, 79, 56–61. [Google Scholar] [CrossRef]
  39. Mosorov, V.; Abdullah, J. MCNP5 code in radioactive particle tracking. Appl. Radiat. Isot. 2011, 69, 1287–1293. [Google Scholar] [CrossRef]
  40. Bhusarapu, S.; Al-Dahhan, M.; Dudukovic, M.P. Quantification of solids flow in a gas-solid riser: Single radioactive particle tracking. Chem. Eng. Sci. 2004, 59, 5381–5386. [Google Scholar] [CrossRef]
  41. Velo, A.F.; Hamada, M.M.; Carvalho, D.V.S.; Martins, J.F.T.; Mesquita, C.H. A portable tomography system with seventy detectors and five gamma-ray sources in fan beam geometry simulated by Monte Carlo method. Flow Meas. Instrum. 2017, 53, 89–94. [Google Scholar] [CrossRef]
  42. Salgado, C.M.; Brandão, L.E.B.; Schirru, R.; Pereira, C.M.N.A.; Conti, C.C. Validation of a NaI(Tl) detector’s model developed with MCNP-X code. Prog. Nucl. Energy 2012, 59, 19–25. [Google Scholar] [CrossRef]
  43. Moreira, M.C.F.; Conti, C.C.; Schirru, R. A new NaI(Tl) four-detector layout for field contamination assessment using artificial neural networks and the Monte Carlo method for system calibration. Nucl. Instrum. Methods Phys. Res. Sect. A Accel. Spectrometers Detect. Assoc. Equip. 2010, 621, 302–309. [Google Scholar] [CrossRef]
  44. Jehouani, A.; Ichaoui, R.; Boulkheir, M. Study of the NaI(Tl) efficiency by Monte Carlo method. Appl. Radiat. Isot. 2000, 53, 887–891. [Google Scholar] [CrossRef]
  45. Khane, V.; Said, I.A.; Al-Dahhan, M.H. Experimental investigation of pebble flow dynamics using radioactive particle tracking technique in a scaled-down Pebble Bed Modular Reactor (PBMR). Nucl. Eng. Des. 2016, 302, 1–11. [Google Scholar] [CrossRef] [Green Version]
  46. Salierno, G.; Maestri, M.; Piovano, S.; Cassanello, M.; Cardona, M.A.; Hojman, D.; Somacal, H. Solid motion in a three-phase bubble column examined with Radioactive Particle Tracking. Flow Meas. Instrum. 2018, 62, 196–204. [Google Scholar] [CrossRef]
  47. Qi, B.; Farid, O.; Velo, A.F.; Mendil, J.; Uribe, S.; Kaneko, Y.; Sakakura, K.; Kagota, Y.; Al-Dahhan, M. Tracking the Heavy Metal Contaminants Entrained with the Flow into a Trickle Bed Hydrotreating Reactor Packed with Different Catalyst Shapes Using Newly Developed Noninvasive Dynamic Radioactive Particle Tracking. Chem. Eng. J. 2021, 429, 132277. [Google Scholar] [CrossRef]
  48. Moslemian, D.; Devanathan, N.; Dudukovic, M.P. Radioactive particle tracking technique for investigation of phase recirculation and turbulence in multiphase systems. Rev. Sci. Instrum. 1992, 63, 4361–4372. [Google Scholar] [CrossRef]
  49. Efhaima, A.; Al-Dahhan, M.H. Bed diameter effect on the hydrodynamics of gas-solid fluidized beds via radioactive particle tracking (RPT) technique. Can. J. Chem. Eng. 2017, 95, 744–756. [Google Scholar] [CrossRef]
  50. Ali, N.; Al-Juwaya, T.; Al-Dahhan, M. An advanced evaluation of the mechanistic scale-up methodology of gas–solid spouted beds using radioactive particle tracking. Particuology 2017, 34, 48–60. [Google Scholar] [CrossRef]
  51. Chabot, J.; de Lasa, H.I. Gas Holdups and Bubble Characteristics in a Bubble Column Operated at High Temperature. Ind. Eng. Chem. Res. 1993, 32, 2595–2601. [Google Scholar] [CrossRef]
  52. Agahzamin, S.; Pakzad, L. A comprehensive CFD study on the effect of dense vertical internals on the hydrodynamics and population balance model in bubble columns. Chem. Eng. Sci. 2019, 193, 421–435. [Google Scholar] [CrossRef]
  53. Al Mesfer, M.K.; Sultan, A.J.; Al-Dahhan, M.H. Impacts of dense heat exchanging internals on gas holdup cross-sectional distributions and profiles of bubble column using gamma ray Computed Tomography (CT) for FT synthesis. Chem. Eng. J. 2016, 300, 317–333. [Google Scholar] [CrossRef]
  54. Sultan, A.J.; Sabri, L.S.; Al-Dahhan, M.H. Impact of heat-exchanging tube configurations on the gas holdup distribution in bubble columns using gamma-ray computed tomography. Int. J. Multiph. Flow 2018, 106, 202–219. [Google Scholar] [CrossRef]
  55. Mezui, Y.; Cartellier, A.; Obligado, M. An experimental study on the liquid phase properties of a bubble column operated in the homogeneous and in the heterogeneous regimes. Chem. Eng. Sci. 2023, 268, 118381. [Google Scholar] [CrossRef]
  56. Azizi, S.; Yadav, A.; Lau, Y.M.; Hampel, U.; Roy, S.; Schubert, M. Hydrodynamic correlations for bubble columns from complementary UXCT and RPT measurements in identical geometries and conditions. Chem. Eng. Sci. 2019, 208, 115099. [Google Scholar] [CrossRef]
  57. Lindner, G.A.; Mišković, S. GIPPE-RPT: Geant4 interface for particle physics experiments applied to Radioactive Particle Tracking. Appl. Radiat. Isot. 2022, 180, 110041. [Google Scholar] [CrossRef]
  58. Möller, F.; Lau, Y.M.; Seiler, T.; Hampel, U.; Schubert, M. A study on the influence of the tube layout on sub-channel hydrodynamics in a bubble column with internals. Chem. Eng. Sci. 2018, 179, 265–283. [Google Scholar] [CrossRef]
  59. Al-Juwaya, T.; Ali, N.; Al-Dahhan, M. Investigation of hydrodynamics of binary solids mixture spouted beds using radioactive particle tracking (RPT) technique. Chem. Eng. Res. Des. 2019, 148, 21–44. [Google Scholar] [CrossRef]
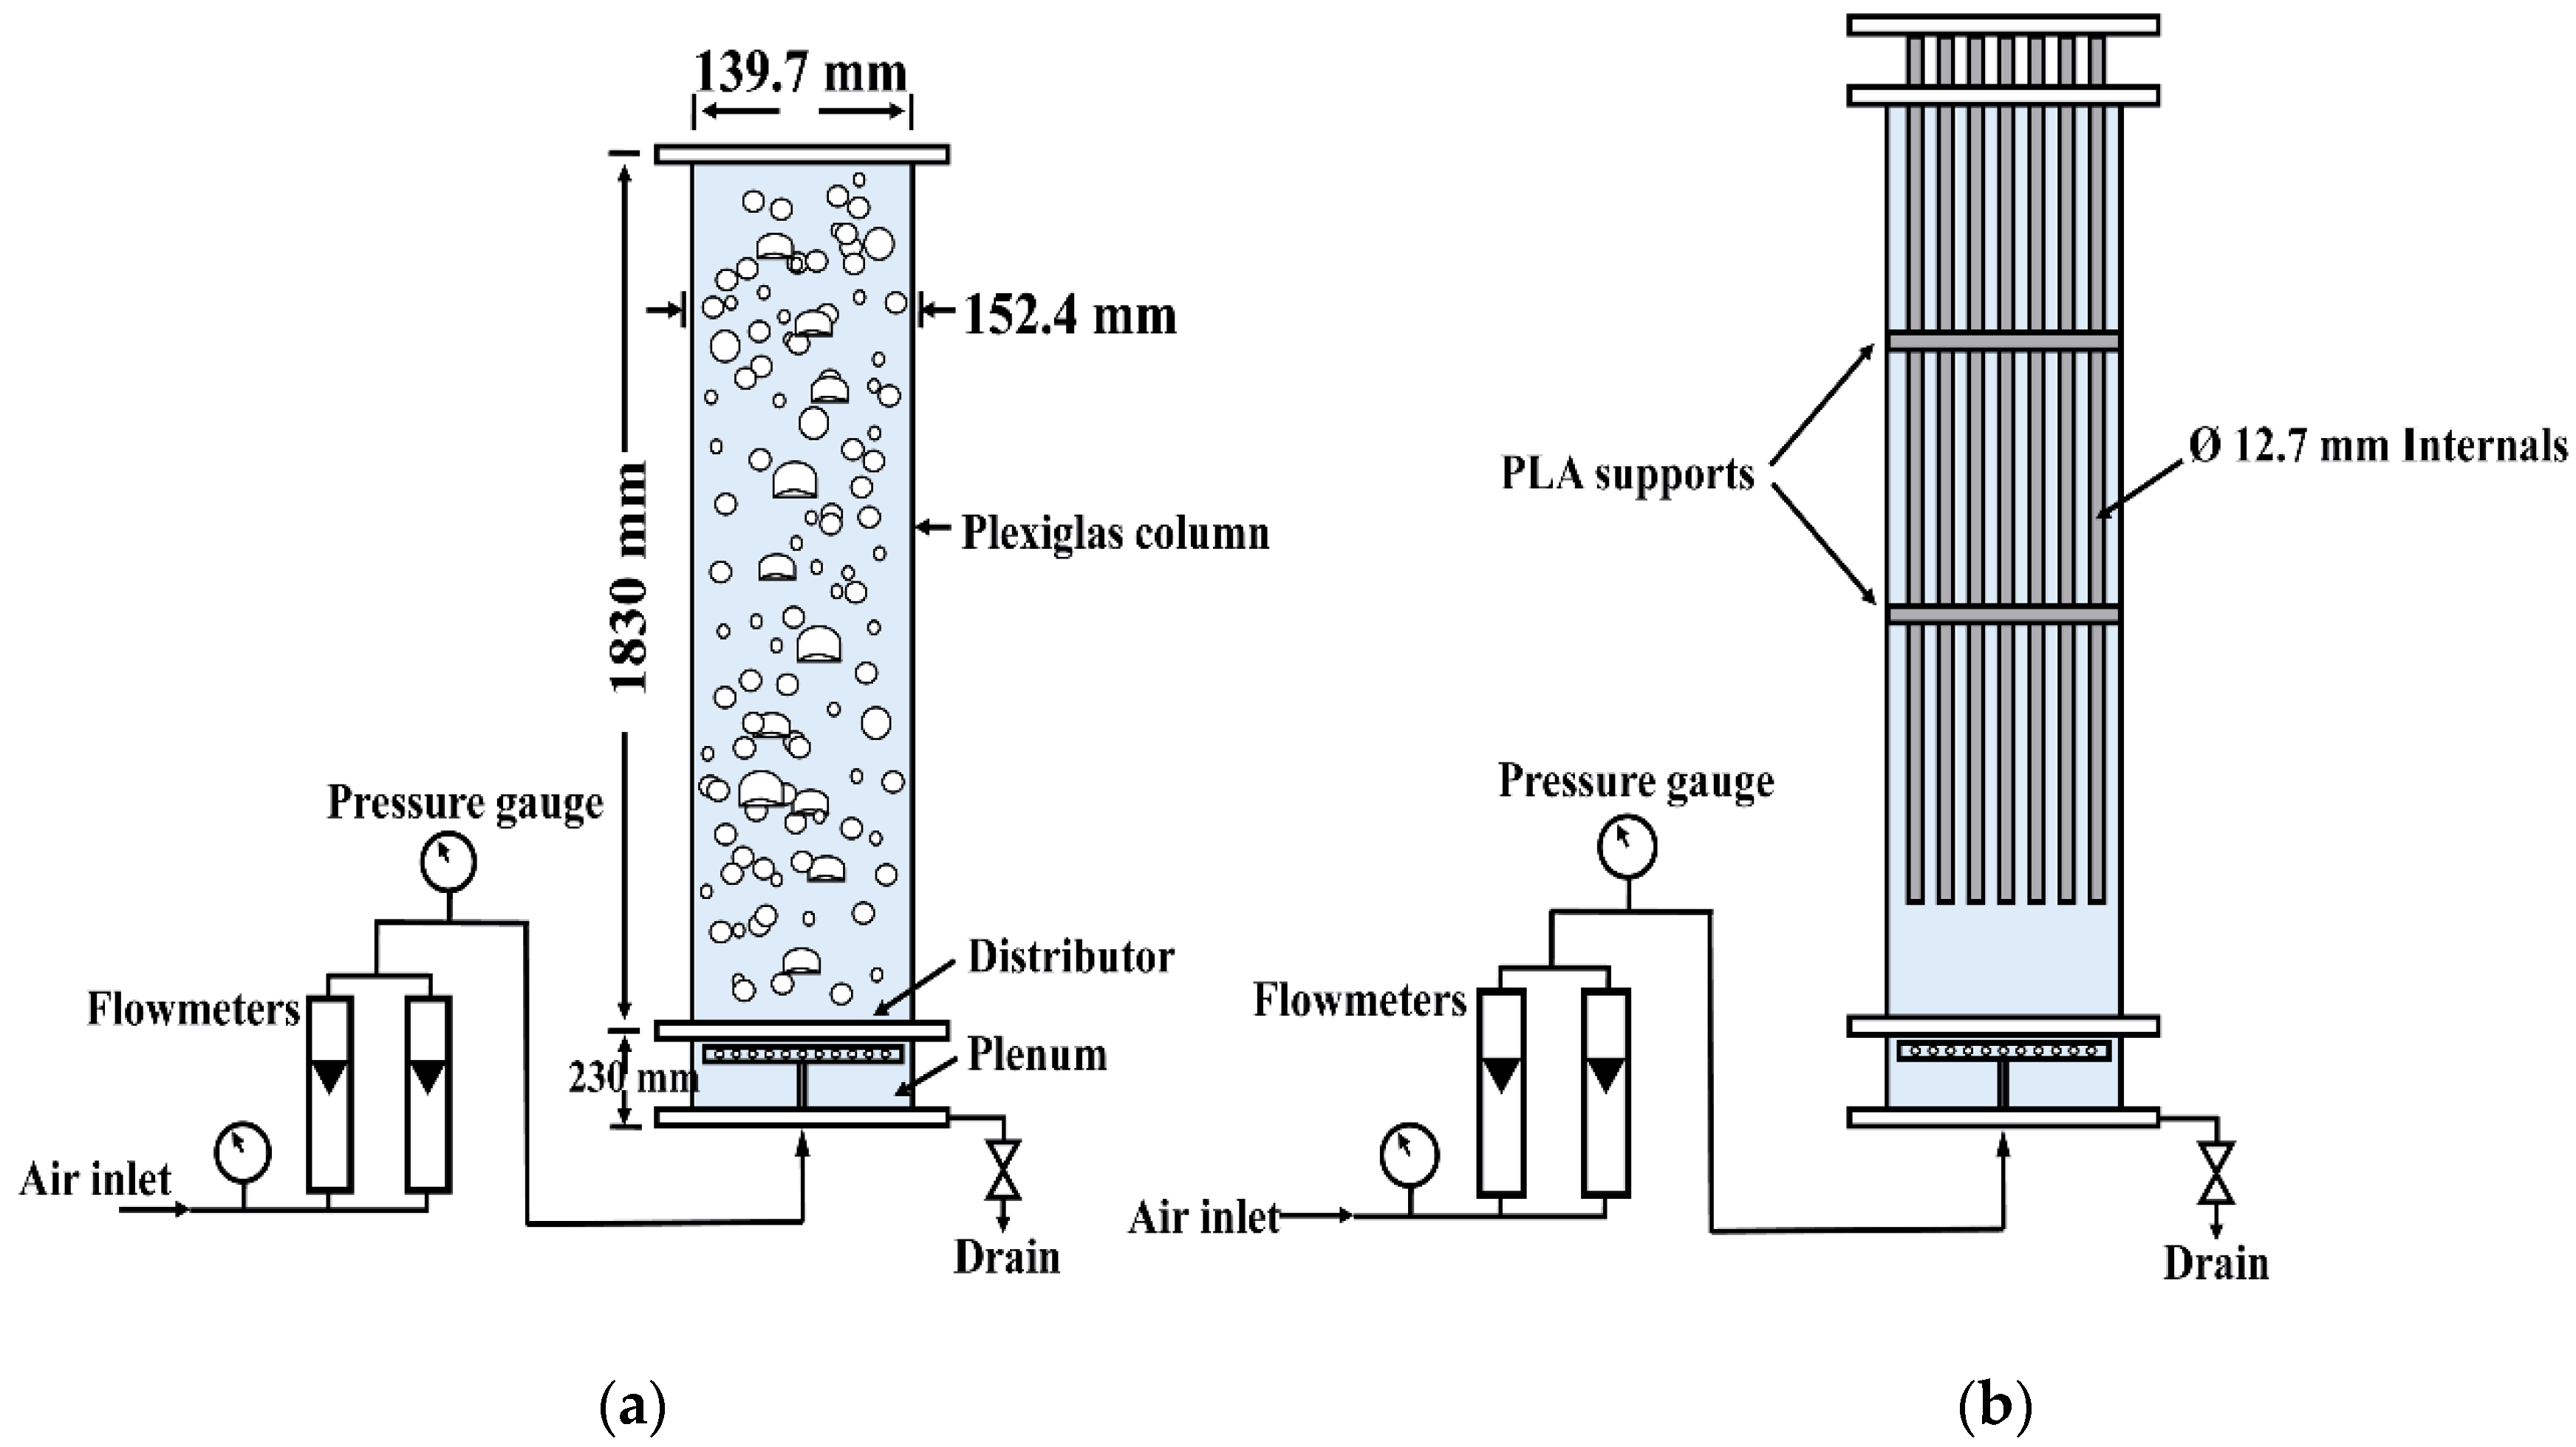
Figure 1. Schematic diagram of the used bubble column: (a) without internal rods; (b) with the presence of internals.
Processes 11 02107 g001
Figure 2. (a) Schematic diagram of the square pitch configuration for the internals and the calibration measurement positions; (b) calibration positions distributed in the bubble column without internals.
Processes 11 02107 g002
Figure 3. MCNP geometry of the simulated bubble column and the 28 NaI(Tl) detectors: (a) without internals; (b) with internals.
Processes 11 02107 g003
Figure 4. Comparison of the real measured spectrum and simulated spectrum of Co-60 for a selected detector.
Processes 11 02107 g004
Figure 5. Validation of the MCNP simulation which compares the positions of the radioactive particles obtained by MCNP simulation with the related ones of real positions of the radioactive particles fixed by an automated calibration device: (a) without internals; (b) with internals.
Processes 11 02107 g005
Figure 6. Kernel Density Estimation (KDE) of the liquid-phase distribution in the bubble column with and without internals based on the tracer positions: (a) axial direction; (b) radial direction.
Processes 11 02107 g006
Figure 7. Effect of the internals on time- and azimuthally averaged liquid velocity radial profiles in the bubble column at superficial gas velocity 40 cm/s: (a) axial liquid velocity; (b) radial liquid velocity; (c) azimuthal liquid velocity.
Processes 11 02107 g007
Figure 8. (a) Comparison of the internals configuration on time-, azimuthally, and axially averaged liquid velocity radial profiles in the bubble column at superficial gas velocity 40 cm/s in this study and 45 cm/s in the Al-Mesfer et al. [2] study; (b) hexagonal pitch configuration of the Al-Mesfer et al. [2] study; (c) square pitch configuration of this study.
Processes 11 02107 g008
Figure 9. Comparison of the eight axial velocity radial profile radius directions with axially averaged liquid axial velocity in the bubble column at 71 cm above the gas sparger: (a) without internals; (b) with internals.
Processes 11 02107 g009aProcesses 11 02107 g009b
Figure 10. Comparison of the time- and azimuthally averaged liquid axial velocity radial profiles with six different levels of azimuthally averaged liquid velocity radial profiles in the bubble column: (a) without internals; (b) with internals.
Processes 11 02107 g010aProcesses 11 02107 g010b
Figure 11. Time-averaged velocity vector plots (r-z plans) of the bubble column: (a) without internals; (b) with internals.
Processes 11 02107 g011
Figure 12. Effect of vertical internals on turbulence parameters in the bubble column: (a) liquid axial normal stress (τzz) (cm2/s2); (b) liquid shear stress (τrz) (cm2/s2); (c) liquid turbulent kinetic energy (TKE) (cm2/s2).
Processes 11 02107 g012
Disclaimer/Publisher’s Note: The statements, opinions and data contained in all publications are solely those of the individual author(s) and contributor(s) and not of MDPI and/or the editor(s). MDPI and/or the editor(s) disclaim responsibility for any injury to people or property resulting from any ideas, methods, instructions or products referred to in the content.