Article

Multi-Time Scale Economic Dispatch of Integrated Electricity and Natural Gas Systems with Flexibility Constraints Based on Chance-Constrained Programming

1
State Grid Hebei Electric Power Co., Ltd., Shijiazhuang 050051, China
2
State Grid Shijiazhuang Electric Power Supply Company, Shijiazhuang 050051, China
3
Key Lab of Power Electronics for Energy Conservation and Motor Drive of Hebei Province, Yanshan University, Qinhuangdao 066004, China
4
State Grid Jinzhou County Electric Power Supply Company, Shijiazhuang 052200, China
*
Author to whom correspondence should be addressed.
Processes 2023, 11(7), 1987; https://doi.org/10.3390/pr11071987
Submission received: 18 May 2023 / Revised: 25 June 2023 / Accepted: 28 June 2023 / Published: 30 June 2023
(This article belongs to the Section Energy Systems)

Abstract

:
The connection between various energy types in the integrated power and natural gas system has grown stronger in recent years, as has the penetration rate of clean energy. Wind power generation volatility offers a considerable barrier to power system operation. This research provides a multi-time scale economic dispatch model with flexibility limitations to address this issue. Through chance-constrained programming, the equipment flexibility is described by probability functions and predetermined confidence levels in this model, and the generating cost and wind power consumption are improved through day-ahead and intra-day optimal scheduling. Finally, the effectiveness of the proposed model is verified by two case studies of integrated energy systems, where the results show that about 68.0–72.1% wind power curtailment can be effectively reduced while satisfying all load and system safety requirements.

1. Introduction

In recent years, with the environmental deterioration caused by fossil fuels, renewable energy power generation, such as wind power, has developed rapidly, but the volatility and uncertainty in wind power generation brings new challenges to the optimal scheduling of the power system. With the continuous development of gas turbines [1], power-to-gas (PtG), and other coupling equipment [2], the integrated power and natural gas system (IENGS) provides an effective way to absorb renewable energy [3]. Through multi-energy system coordination, the IENGS may unify the independent operation modes of power supply systems and gas supply systems, improve the overall efficiency of the integrated energy system, and boost the flexible consumption of renewable energy.
At present, there are many studies focusing on the modeling of the component equipment of the IENGS. The IENGS includes various equipment for energy production, storage and conversion, which can cope with system uncertainties to certain degrees. PtG equipment can convert excess clean energy in the power system into hydrogen or natural gas. In [4], the water–electricity–gas coupling process between the electrolytic cell and the methanation reactor in the power-to-gas system is discussed in detail, and the model of the power-to-gas system in the IENGS is proposed. In [5], the IENGS model considering the dynamic characteristics of gas networks is proposed. But the gas network characteristics are not considered in the above literature. In addition to the conventional economic dispatch of the power grid, fully tapping the potential of gas networks can promote wind power consumption [6]. In [7], P2G is extended into the IENGS with a high wind power penetration level in order to absorb renewable energy and reduce the external gas dependency. Through the storage characteristics of the gas network management, the operational flexibility of the integrated network is improved [8].
The above studies focus on the modeling of the IENGS and seldom describe the flexibility of multiple energy sources within the IENGS. In the literature, there are many studies on the flexibility of electric power systems. For example, a flexibility-based evaluation method for wind and solar energy and a flexibility evaluation index for distributed generation units are proposed in [9] to assess the degree of clean energy consumption. Reference [10] presents an original methodology to quantify the flexibility the gas network can provide to the power system, as well as the constraints it may impose on it, also with the consideration of different heating scenarios. In [11], flexibility is described by a probability distribution, and a method to improve the flexibility of the power grid under a probability model is proposed. However, the above research mainly focuses on the concept of flexibility and its evaluation methods but does not apply these flexibilities to reduce the cost of economic dispatch for the power grid.
There are two common modeling techniques for handling uncertain problems: stochastic optimization and robust optimization. Stochastic optimization needs to assume that the uncertain variables obey a known probability distribution, and then the uncertain problem is transformed into a deterministic problem [12]. In [13], stochastic optimization is used to deal with uncertainty in operating a renewable-based microgrid, and the proposed method decreases the operation cost by 18.8%. However, due to the use of the scenario reduction technique to simplify the calculation, some low-probability scenarios are ignored, affecting the system’s security [14]. In the robust optimization method, it does not need to know the distribution function of uncertain variables but relies on the feasible region of uncertain variables and considers the optimal results in the worst scenarios [15]. This approach will lead to conservative optimization results [16]. As a new uncertain optimization method, chance-constrained programming has gradually attracted more attention. This chance-constrained programming can be solved efficiently by transformation into a convex optimization problem under certain uncertainty distribution assumptions [17]. This chance-constrained method has been successfully applied in [18] for the optimal dispatch of an electrothermal coupling system, and it can effectively reduce the negative impact of system uncertainty and greatly improve the power grid efficiency. Therefore, chance-constrained programming can be applied for the energy scheduling problem of the IENGS, too.
Because the uncertainty of forecasted power source and load will decrease when finer time sampling is applied in the forecast, the combination of the uncertainty processing method and multi-time scale can significantly improve the uncertainty handling performance of the IENGS. For instance, article [19] presents a model predictive control (MPC)-based multi-time scale co-optimized dispatch for an integrated electricity and natural gas system considering the bidirectional interactions and renewable uncertainties. In [20], transmission characteristics and time scale characteristics of multiple heterogeneous energy flows are used to coordinate an integrated energy system. In order to increase the ability of the power system to suppress power fluctuation, a multi-time scale optimization scheduling method is applied to improve the multi-energy flexibility of the system [21]. However, the available research primarily focuses on the optimal scheduling of microgrids, with only a few studies focusing on the optimal scheduling of large-scale power gas systems.
From the literature reviewed above (Table 1), it can be found that the existing research rarely takes into account the flexibility provided by the natural gas network storage capacity in the economic dispatch of the IENGS, especially the application of new methods such as chance-constrained planning and multi-time scales to the optimal dispatch under the uncertainty of the IENGS. To solve these issues, this paper proposes a multi-time scale economic dispatch model based on chance-constrained programming, where the flexibility of the IENGS operation will be improved using the storage capabilities of the gas network.
The main contributions are as follows:
(1)
A mathematical model for the energy production, conversion, and storage of an IENGS is established, and a quasi-steady-state model of the natural gas pipeline network is built. Then, the obtained nonlinear optimization model is transformed into a linear model to facilitate the application of the powerful software tool CPLEX.
(2)
A multi-time scale economic dispatching model of an IENGS is proposed. According to the difference in prediction errors under different time scales, two different decision-making objectives are presented for two different scheduling periods.
(3)
Considering the flexibility in energy supply and load demand of the coupled system, the flexibility constraints are adjusted according to different time scales, and the chance-constrained programming is applied to the economic dispatch problem of an IENGS.
(4)
The chance-constrained programming is linearized by the sample average approximation approach (SAA).
The other parts of this article are arranged as follows: in Section 2, the economic scheduling model of the IENGS is proposed. Section 3 discusses two case studies, and Section 4 presents the main conclusions.

2. Multi-Energy Flexibility Model of the IENGS

The IENGS considered here is the same as [22] and is depicted in Figure 1, where the power system and the natural gas system are bidirectionally interconnected through gas-fired units and PtG facilities. In addition, the power system uses electricity from coal-fired power units and wind farms to supply electrical loads. The natural gas system produces gas through gas wells, and the gas storage devices can improve the flexibility of the natural gas system. Transmission constraints and pipeline constraints are modeled in the transmission of power and natural gas in the system, and the pipeline storage effect is considered, too.

2.1. Equipment Model

2.1.1. Power Generation Equipment

(1)
Thermal power unit
Equation (1) represents the fuel consumption function of the unit. Equations (2) and (3) constrain the unit output and ramp rate, respectively.
G ( P f , t ) = a f , t P f , t 2 + b f , t P f , t + c f , t
P f min P f , t P f max
RD f P f , t P f , t 1 RU f
The ramp up or down flexibility provided by the unit is related to its maximum and minimum output power and ramp rate, as shown in Equations (4) and (5).
0 R i , t up min ( P i , max P i , t , R i , t u )
0 R i , t down min ( P i , t P i , min , R i , t d )
(2)
Wind power generation
The predicted value of wind farm should not exceed its installed capacity, thus:
0 P w , t P ¯ w
Due to the limitation of the installed capacity, the power generation ramp rate should satisfy the following inequality.
Δ P w t P ¯ w P w , t , w Ω W F

2.1.2. Coupling Equipment

The IENGS is coupled by gas units and PtG facilities, and their coupling relationships are shown as follows.
Q g , t = P g , t ς e , h η g H NG , g Ω GU
Q p t g , t = P p t g η p t g ς e , h H H 2 ϕ H 2 - CH 4 , p t g Ω ptg
P p t g min P p t g P p t g max

2.1.3. Gas Storage Facility

The gas storage facility satisfies the following constraints:
E g s , t = E g s , t 1 + ( Q g s , t in Q g s , t out ) Δ t
E g s , min E g s , t E g s , max
E g s , 0 = E g s , N T
Q g s , min in Q g s , t in Q g s , max in
Q g s , min out Q g s , t out Q g s , max out
where Equation (11) represents the relationship between the gas storage and the injected and released power, Equation (12) represents the constraints on the maximum and minimum values of gas storage, Equation (13) represents the setting of the gas storage cycle end value, and Equations (14) and (15) represent the limitation of the injection and release flow.

2.1.4. Power Flow

(1)
Power grid flow
To simplify computation challenges, the following DC model is adopted to calculate power flow.
P L l , t = ( θ l 1 , t θ l 2 , t ) / x l
P L l max P L l , t P L l max
θ m min θ m , t θ m max
θ ref = 0
Power balance at power system nodes is shown below:
w Ω WF H m , w P w , t p t g Ω PtG H m , p t g P p t g , t in + i Ω p H m P i , t E L m , t = l Ω TL H m , l P L l , t
(2)
Gas grid flow
The velocity of natural gas in the pipe network is affected by the pressure at both ends of the pipe, and the velocity ranges from several meters to tens of meters per second, which results in the flow rate being unable to reach a steady value after a fluctuation of the load. Therefore, the following quasi-steady-state model [23] of the natural gas system is adopted in this paper to describe the average flow rate.
Q p , t av = sgn ( π p 1 , t , π p 2 , t ) C p π p 1 , t 2 π p 2 , t 2 , p Ω pp
sgn ( π p 1 , t , π p 2 , t ) = + 1 , π p 1 , t π p 2 , t 1 , π p 1 , t < π p 2 , t , p Ω pp
The compressibility and slow flow of natural gas makes it possible to store a large amount of natural gas in the natural gas pipeline network. Equations (23) and (24) represent the relationship between the average pipeline flow rate and the first and last pipeline flow rates, and the relationship between pipe storage and the average pressure, respectively.
Q p , t av = ( Q p , t in + Q p , t out ) / 2 , p Ω pp
Q p , t lp = C p lp π p , t av , p Ω GP
The average pipe pressure can be expressed by the pressure at the end of the pipe:
π p , t av = ( π p 1 , t + π p 2 , t ) / 2 , p Ω GP
The pipeline storage capacity is similar to the gas storage devices:
Q p , t lp = Q p , t 1 lp + Q p , t in Q p , t out , p Ω GP
p Ω GP Q p , 0 lp = p Ω GP Q p , N T lp
Because of the slow dynamic characteristics of natural gas flow, a natural gas pipeline can provide a lot of flexible space for system operation. Equation (28) gives the gas pipeline storage dynamic balance relation, while (29) shows the total flexibility constraints of nodes of the natural gas network in each region. In addition to the above constraints, the pipeline storage capacity should also be limited by the maximum and minimum value of pipe storage [24].
Q p , t , min lp Q p , t lp Q p , t , max lp
In order to compensate for the pressure loss in the pipeline, a compressor needs to be installed in the corresponding pipeline [25].
K p , min π p 1 , t π p 2 , t K p , max π p 1 , t , p Ω AP
Q p , t in = Q p , t out , p Ω AP
where (30) shows that the new pipe tail pressure π p 2 , t after compression should satisfy the capable range of pressure offered by the compressor, and (30) means that the flow rates in and out of the considered pipe are consistent.
Gas production from a gas well is constrained by the well capacity (31) and the pressure at the endpoints of the connecting nodes (32).
Q ω , min Q ω , t Q ω , max , ω Ω GW
π n , min π n π n , max , n Ω N
The flow balance of whole natural gas system is given below:
ω Ω G W H n , ω Q ω , t + s Ω N S H n , s ( Q s , t NG , out Q s , t NG , in ) + p t g Ω ptg H n , p t g Q p t g , t g Ω GU H n , g Q g , t + p Ω G P H n , p ( Q p , t out Q p , t in ) = G L n , t

2.2. Multi-Energy Flexibility

2.2.1. The Flexibility of Power Grid

Power load and wind power forecasting mistakes in the power system necessitate a flexible supply, which power generation units provide. As the peak of wind power generation is often in the early morning low-demand period, wind power curtailment should be avoided as much as possible.
The rapid development of PtG facilities has brought a lot of flexible operation opportunities to the power system. The flexibility margin provided by PtG is determined jointly by its operating status and the maximum and minimum operating power as shown in (34) and (35). Due to economic constraints in practice, the converted power of PtG generally does not exceed the reduced power of wind power, so in order to make the model reasonable, the ramping-up flexibility provided by PtG cannot be greater than the wind power output (36).
0 R p t g , t up P p t g , max P p t g , t
0 R p t g , t down P p t g , t P p t g , min
p t g Ω PtG R p t g , t up w Ω wF ( P w , t f P w , t )

2.2.2. The Flexibility of Gas Grid

Similar to the power system, the load forecasting error of the gas system will require a flexible gas supply, which will be met by the flexibility provided by the PtG unit while meeting the flexible demand of the gas turbine. Due to the slow dynamic characteristics of the natural gas system, the flexibility requirement of each node is fulfilled by the gas pipeline, PtG facilities, and gas storage facilities.
The flexibility constraints of upward and downward regulations provided by the heat supply network pipeline are as follows:
0 Q p , t lp , up Q p , t lp Q p , t , min lp
0 Q p , t lp , down Q p , t , max lp Q p , t lp
The PtG unit can provide the natural gas system with the following upward and downward regulation flexibilities:
0 Q P t G d o w m Q P t G I P t G Q P t G , min
0 Q P t G u p I P t G Q P t G , max Q P t G
Equations (41)–(44) concern the flexibility provided by gas storage facilities:
0 Q g s , t in , up min ( Q g s , t in Q g s , min in , E g s , max E g s , t )
0 Q g s , t out , up min ( Q g s , min out Q g s , t out , E g s , t E g s , min )
0 Q g s , t in , down min ( Q g s , max in Q g s , t in , E g s , max E g s , t )
0 Q g s , t out , down min ( Q g s , t out Q g s , min out , E g s , t E g s , min )

2.3. Flexibility Constraints Based on Chance-Constrained Programming

Chance constraints can ensure that the relevant conditions are established at a certain confidence level to balance the robustness and cost of the optimization results. For the flexibility constraints in the operation scheduling problem, the following opportunity constraints can fully model the impact of uncertainties.

2.3.1. Mathematical Expression of Flexibility Constraints

For the flexible supply and demand requirement of power systems, the opportunity constraint is introduced and expressed in the form of probability constraints with expected confidence levels as follows:
Pr i Ω FU R i , t up + p t g Ω PtG R p t g , t down b Ω B Δ L b , t + b Ω B Δ P w , t β 1
Pr i Ω p R i , t down + p t g Ω PtG R p t g , t up b Ω B Δ L b , t + b Ω B Δ P w , t down β 2
Similarly, the chance-constrained programming model of the natural gas system with given confidence levels is given below:
Pr g s S ( n ) ( Q g s , t in , up + Q g s , t out , up ) + p t g Ω PtG Q p t g , t up + p Ω P Q p t lp , up g Ω G R g , t up ζ e , h η g HHV NG + Δ L n , t β 3
Pr p t g Ω P t G Q p t g , t down + p Ω P Q p , t lp , down + s S ( n ) ( Q g s , t in , down + Q g s , t out , down ) g Ω G R g , t down ζ e , h η g HHV NG + Δ L n , t β 4

2.3.2. Transformation to Deterministic Problem

This paper assumes that the prediction errors are independent and normally distributed.
Δ L b , t , Δ L n , t N ( 0 , ( 0.05 L x , t ) 2 )
Δ P w , t N ( 0 , ( 0.1 P w , t f ) 2 )
The Latin extraction sampling method [26] is adopted for sampling, and the total number of samples is Nsa = 1000. The net fluctuation of the power system and natural gas system is given by the following equation:
Δ e k t = b Ω B Δ L b , k , t + b Ω B Δ P w , k , t
Δ N k t = Δ L n , k , t
where Δ e k t , Δ n k t , are matrices of 1 × N s a .
Through the method of sample average approximation, the above probability constraints can be transformed into a deterministic model [27]. Taking the downward adjustment flexibility in (46) as an example, combining (46) with (51), we obtain:
W d o w n , z , t sa = 1 , i Ω p R i , t down + p t g Ω PtG R p t g , t up Δ e z , t down , sa t , s _ a = 1 , 2 , , N s _ a 0 , others
sa = 1 N sa W down , z , t sa = β 2 · N sa
where W down , z , t sa represents the 0–1 variables, and Δ e z , t down , sa represents the sath sample value of the matrix.
According to the rank method [26], the following can be further obtained:
i Ω p R i , t down + p t g Ω PtG R p t g , t up Δ e t , sort down ( floor ( N s a ( 1 β 2 ) ) ) t Δ e t , sort down = sort ( Δ e t down )
sort ( Δ e t down ) = sort ( [ Δ e t down , 1 , Δ e t down , 2 , , Δ e t down , sa , , Δ e t down , N sa ] )
In the same way, the flexibility of upward adjustment in (47) can be obtained, which will not be repeated here.

3. Multi-Time Scale Optimal Scheduling Strategy

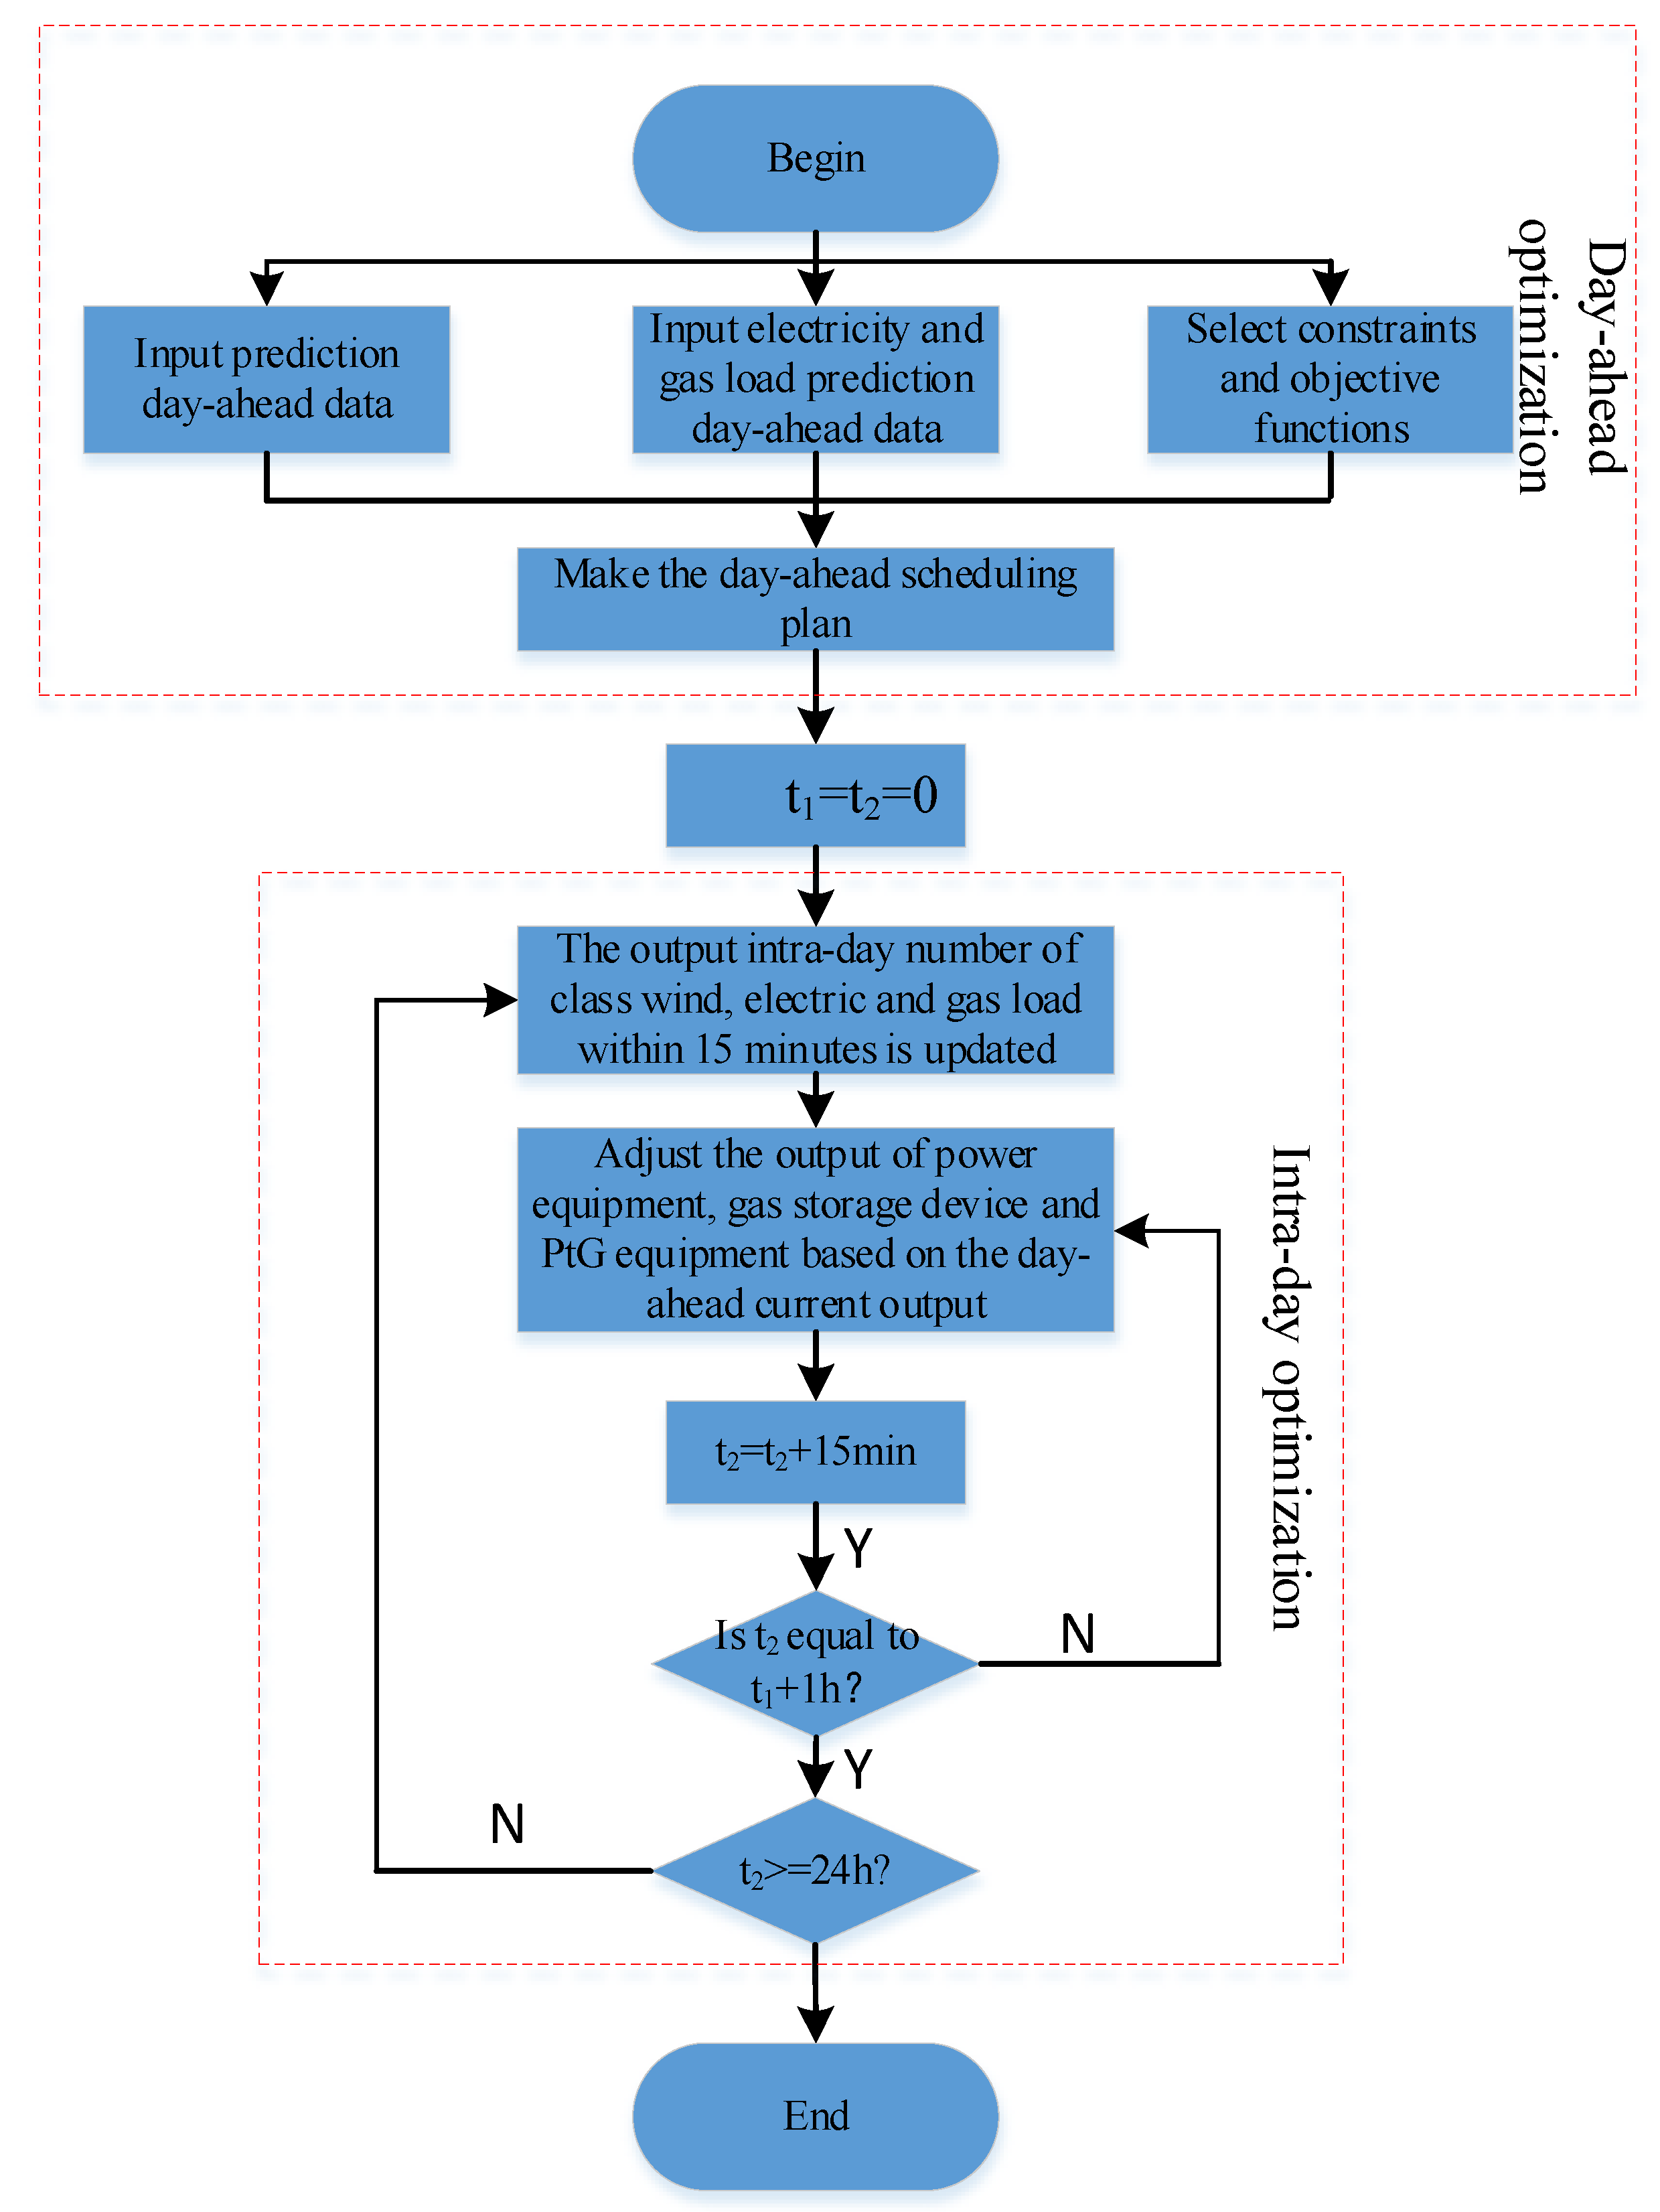
Considering the storage capabilities of the gas network, this paper proposes a multi-time scale optimal scheduling strategy for day-ahead and intra-day market participation. In the day-ahead operation, the 24 h day-ahead operation plan of each piece of equipment is obtained considering the uncertainty of wind power and load. Within the day, following the unit startup and shutdown plans before the day, we conduct short-time dispatching with time sampling for each 15 min. The strategy is shown in Figure 2.
In an IENGS, the prediction accuracy of wind power and load will increase when a finer sampling time scale is used in the prediction. According to this feature, this paper considers the multi-energy flexibility constraints in the day-ahead scheduling to deal with the fluctuations caused by wind power and load forecasting errors. Within a day, the 15 min forecast results are very close to the real values, and thus these 15 min forecast results are not considered in the chance-constrained optimization.

3.1. Day-Ahead Optimization Model

3.1.1. Objective Function

The day-ahead energy dispatch takes the daily operation cost of the IENGS as the objective function, which mainly includes three parts: fuel cost of coal-fired generation units, gas cost, and operation cost of flexible facilities, which can be expressed as:
min F 1 = t Ω T f Ω FU ρ f G ( P f , t ) Δ t + C t + ω Ω GW ρ ω Q ω , t Δ t
C t = ρ ptg ptg Ω ptg P ptg , t Δ t + ρ gs st Ω NS Q gs , t out Δ t

3.1.2. Constraints

(1)
Equipment constraints are given by Equations (1)–(15).
(2)
The power balance constraints of the power grid and gas grid are given by Equations (16)–(33).
(3)
The multi-functional flexibility constraints are given by Equations (34)–(48).

3.2. Intra-Day Optimization Model

3.2.1. Objective Function

In the process of intra-day scheduling, this paper adopts a 4 h scheduling cycle with 15 min sampling period and 1 h rolling execution window [23]. The purpose is to track the existing units’ startup and shutdown plans and minimize the operation cost.
The objective function of daily dispatching cost includes fuel cost, gas cost, and the penalty costs for power fluctuation and equipment status changes:
min F 2 = t Ω T i Ω FU ρ f G ( P f , t ) Δ t + h Ω GW ρ ω Q ω , t Δ t + λ 1 i Ω p ( P i , t P i , t , ref ) 2 + λ 2 i Ω st ( E g s , t E g s , t , ref ) 2

3.2.2. Constraints

The chance-constrained programming model ensures the security of the system under uncertainty in the day-ahead operation. For the intra-day operation, the 15 min sampling interval gives very satisfactory prediction results, and thus, the opportunity-constrained planning is no longer required.
Constraints for the intra-day operation include similar constraints for equipment, power balance, and flexibility constraints as the above day-ahead case. Furthermore, the following additional constraints are also required:
(1)
The operation status of the equipment shall comply with the day-ahead operation plan:
u i , t = u i , t , d a
(2)
The storage capacity of the heat supply network pipes at the beginning and end of each scheduling cycle is consistent with the day-ahead scheduling results.
Q p , t = 1 lp = Q p , t = 24 lp

3.3. Solution Method for Model

In the integrated energy dispatching model established in this paper, not only is the chance-constrained programming problem nonlinear, but the power generation fuel cost Function (1) and the flow equation of an ordinary natural gas Pipeline (21) are also nonlinear. Therefore, the model established in this paper is a mixed-integer nonlinear programming problem. Through the piecewise linearization method in [28] and [29], the model can be transformed into a mixed-integer linear problem which can be solved by the powerful CPLEX solver. Then, the obtained linearized multi-time scale problem can be solved by the following flow chart in Figure 3.

4. Case Studies

In this section, two case studies are conducted to verify the effectiveness of the proposed model: one is for a 6-node power system coupled with a 7-node natural gas system, and the other is a 118-bus power system coupled with a 12-node natural gas system. The mathematical model and constraints of the IENGS were constructed based on the Yalmip toolbox of the MATLAB platform and solved by CPLEX 12.8.

4.1. A Six-Node Power System Coupled with a Seven-Node Natural Gas System

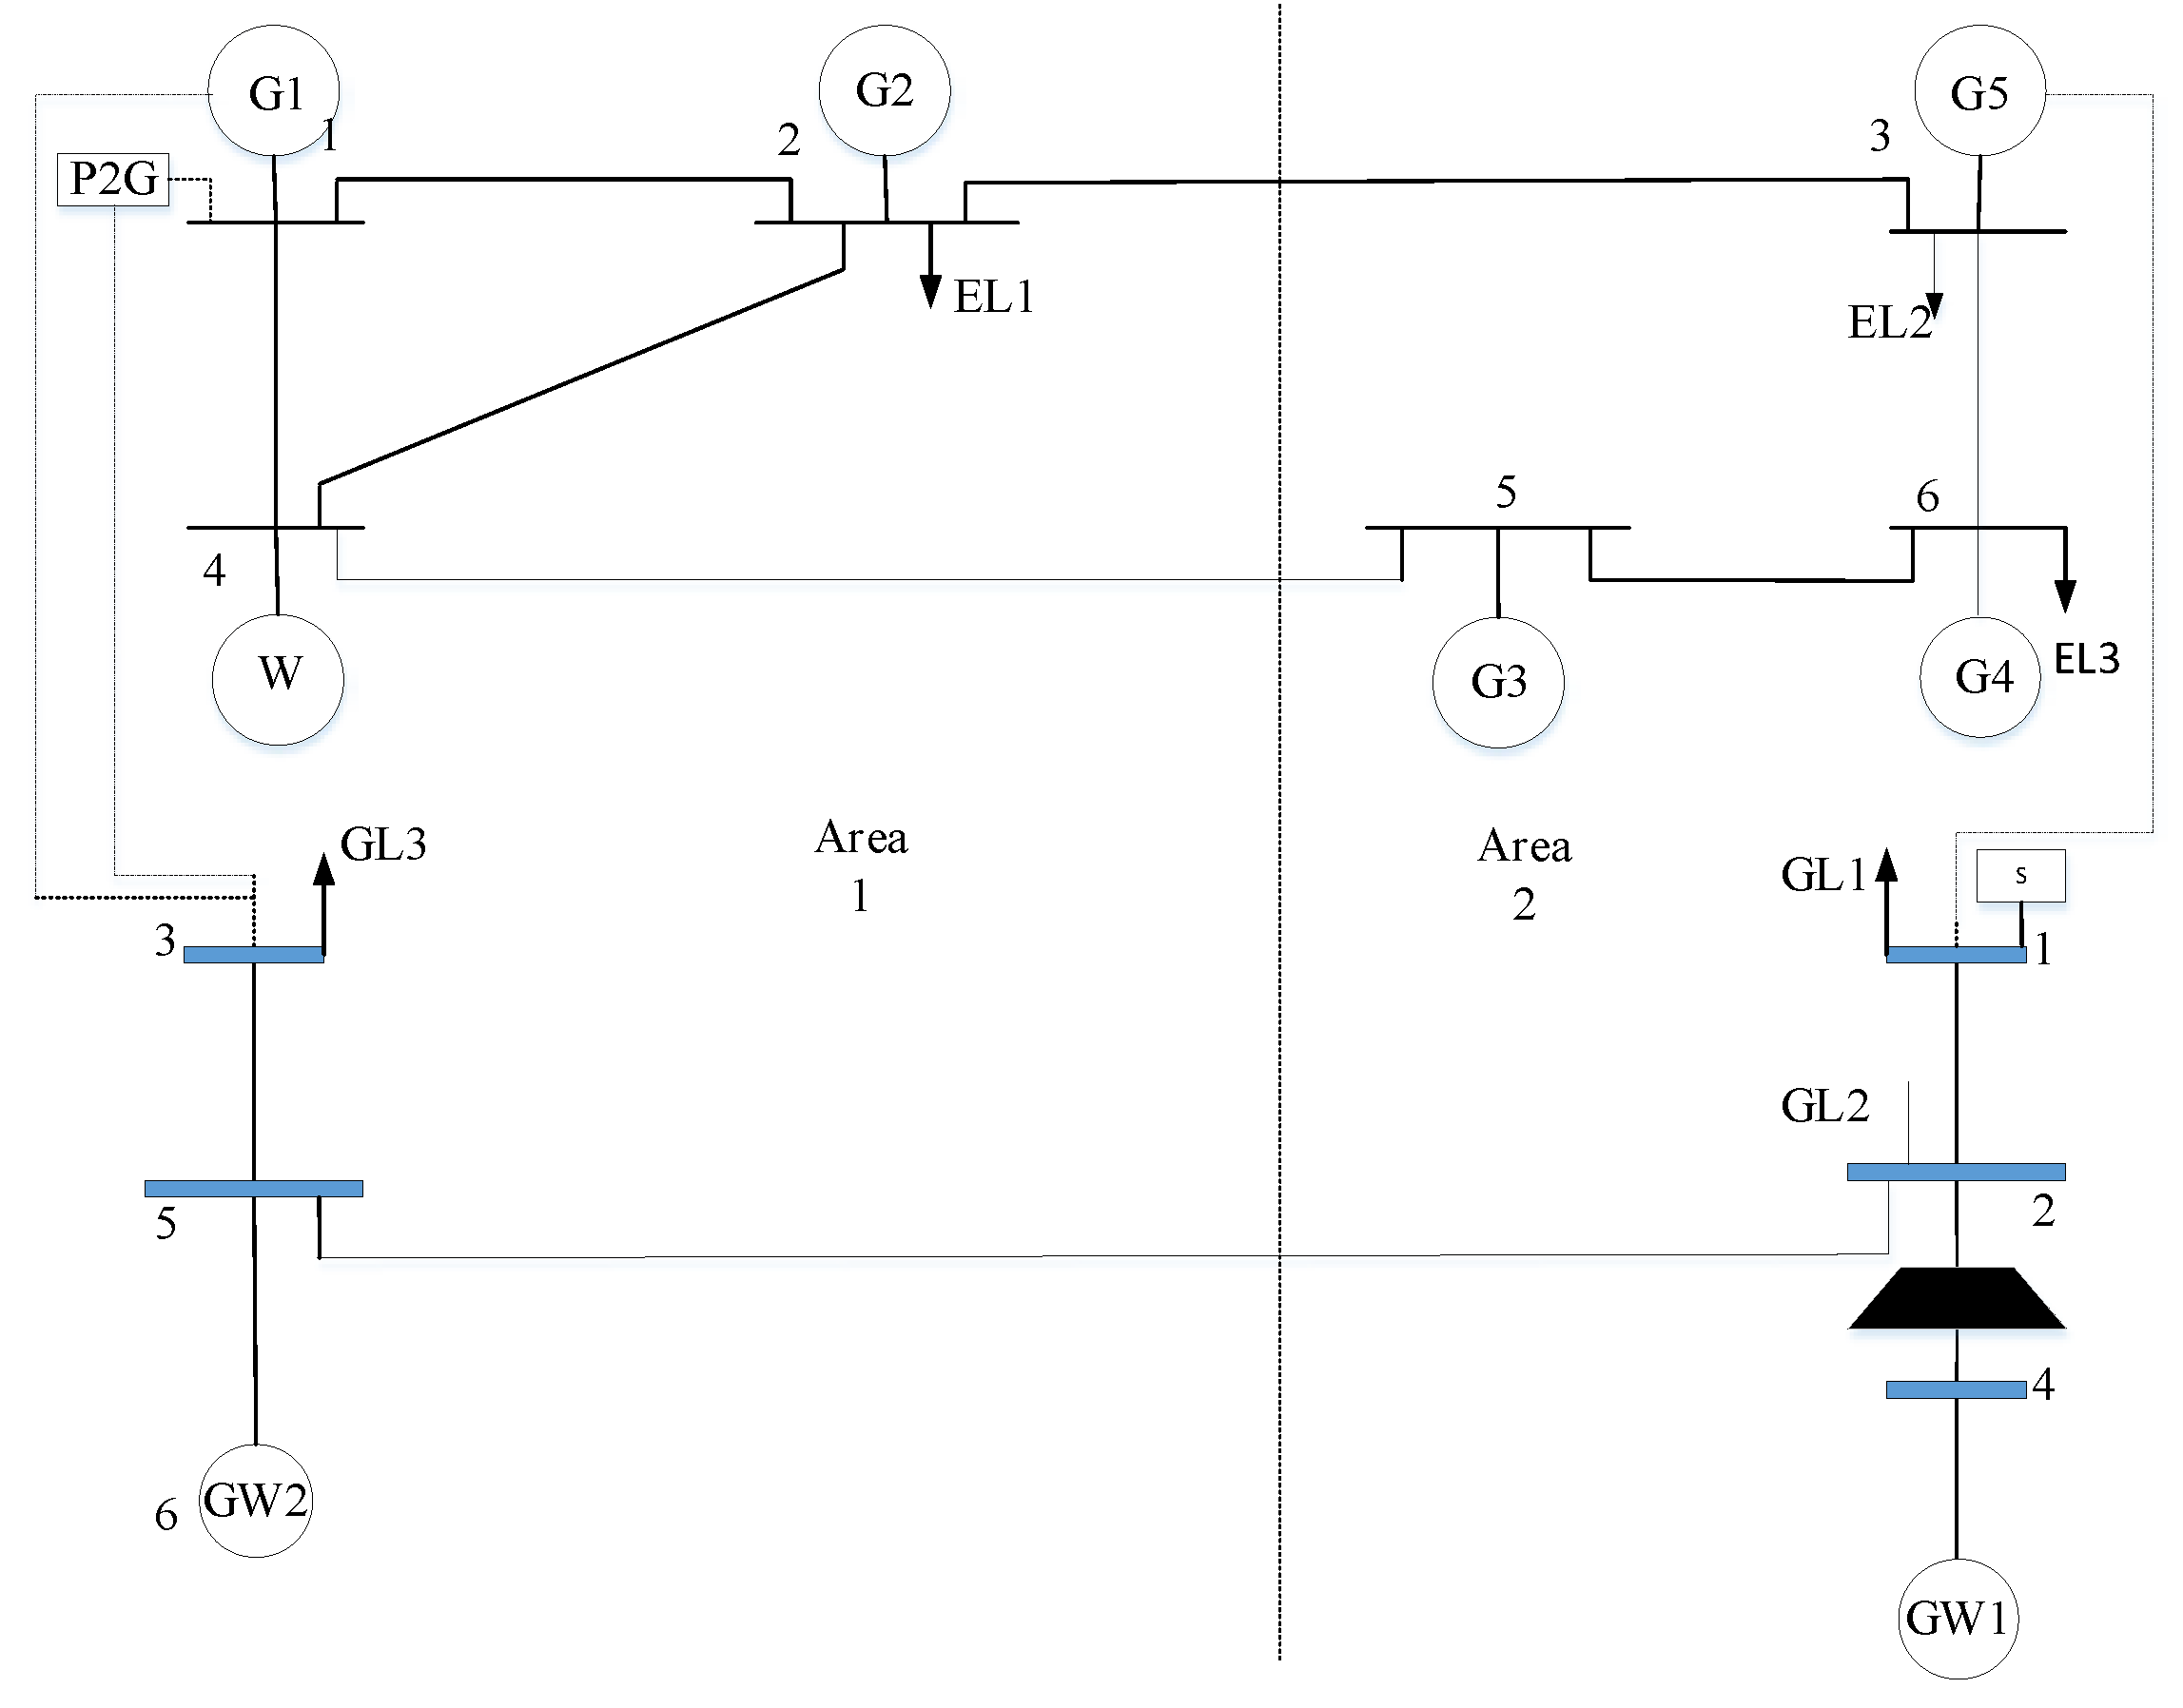
Wind farms are often located in areas with less human activities and a low power load. Wind power is usually transmitted to areas with large industrial loads by high-voltage transmission lines. Therefore, in the integrated six-node power system and seven-node natural gas system in Figure 4, wind power in bus 4 is transmitted to supply the high industrial load in Area 2. The left part of the figure is Area 1, with a relatively small residential load and a wind farm. On the right side of the figure is Area 2, where the industrial cluster has a large load and a small amount of distributed load can be ignored. The power system in Area 1 includes one gas turbine, G1; one coal-fired unit, G2; one wind farm; one PtG facility; and one electrical load. Area 2 includes one gas unit, G5; two coal units, G3 and G4; and two power loads. The gas system in Area 1 includes one gas well, GW1, and one gas load. Area 2 includes a well, GW2; two gas loads; a gas storage unit; and a compressor. Gas unit G1 and PtG facilities are connected to one node of the power system and three nodes of the natural gas system, and gas unit G5 is connected to three nodes of the power system and one node of the natural gas system.
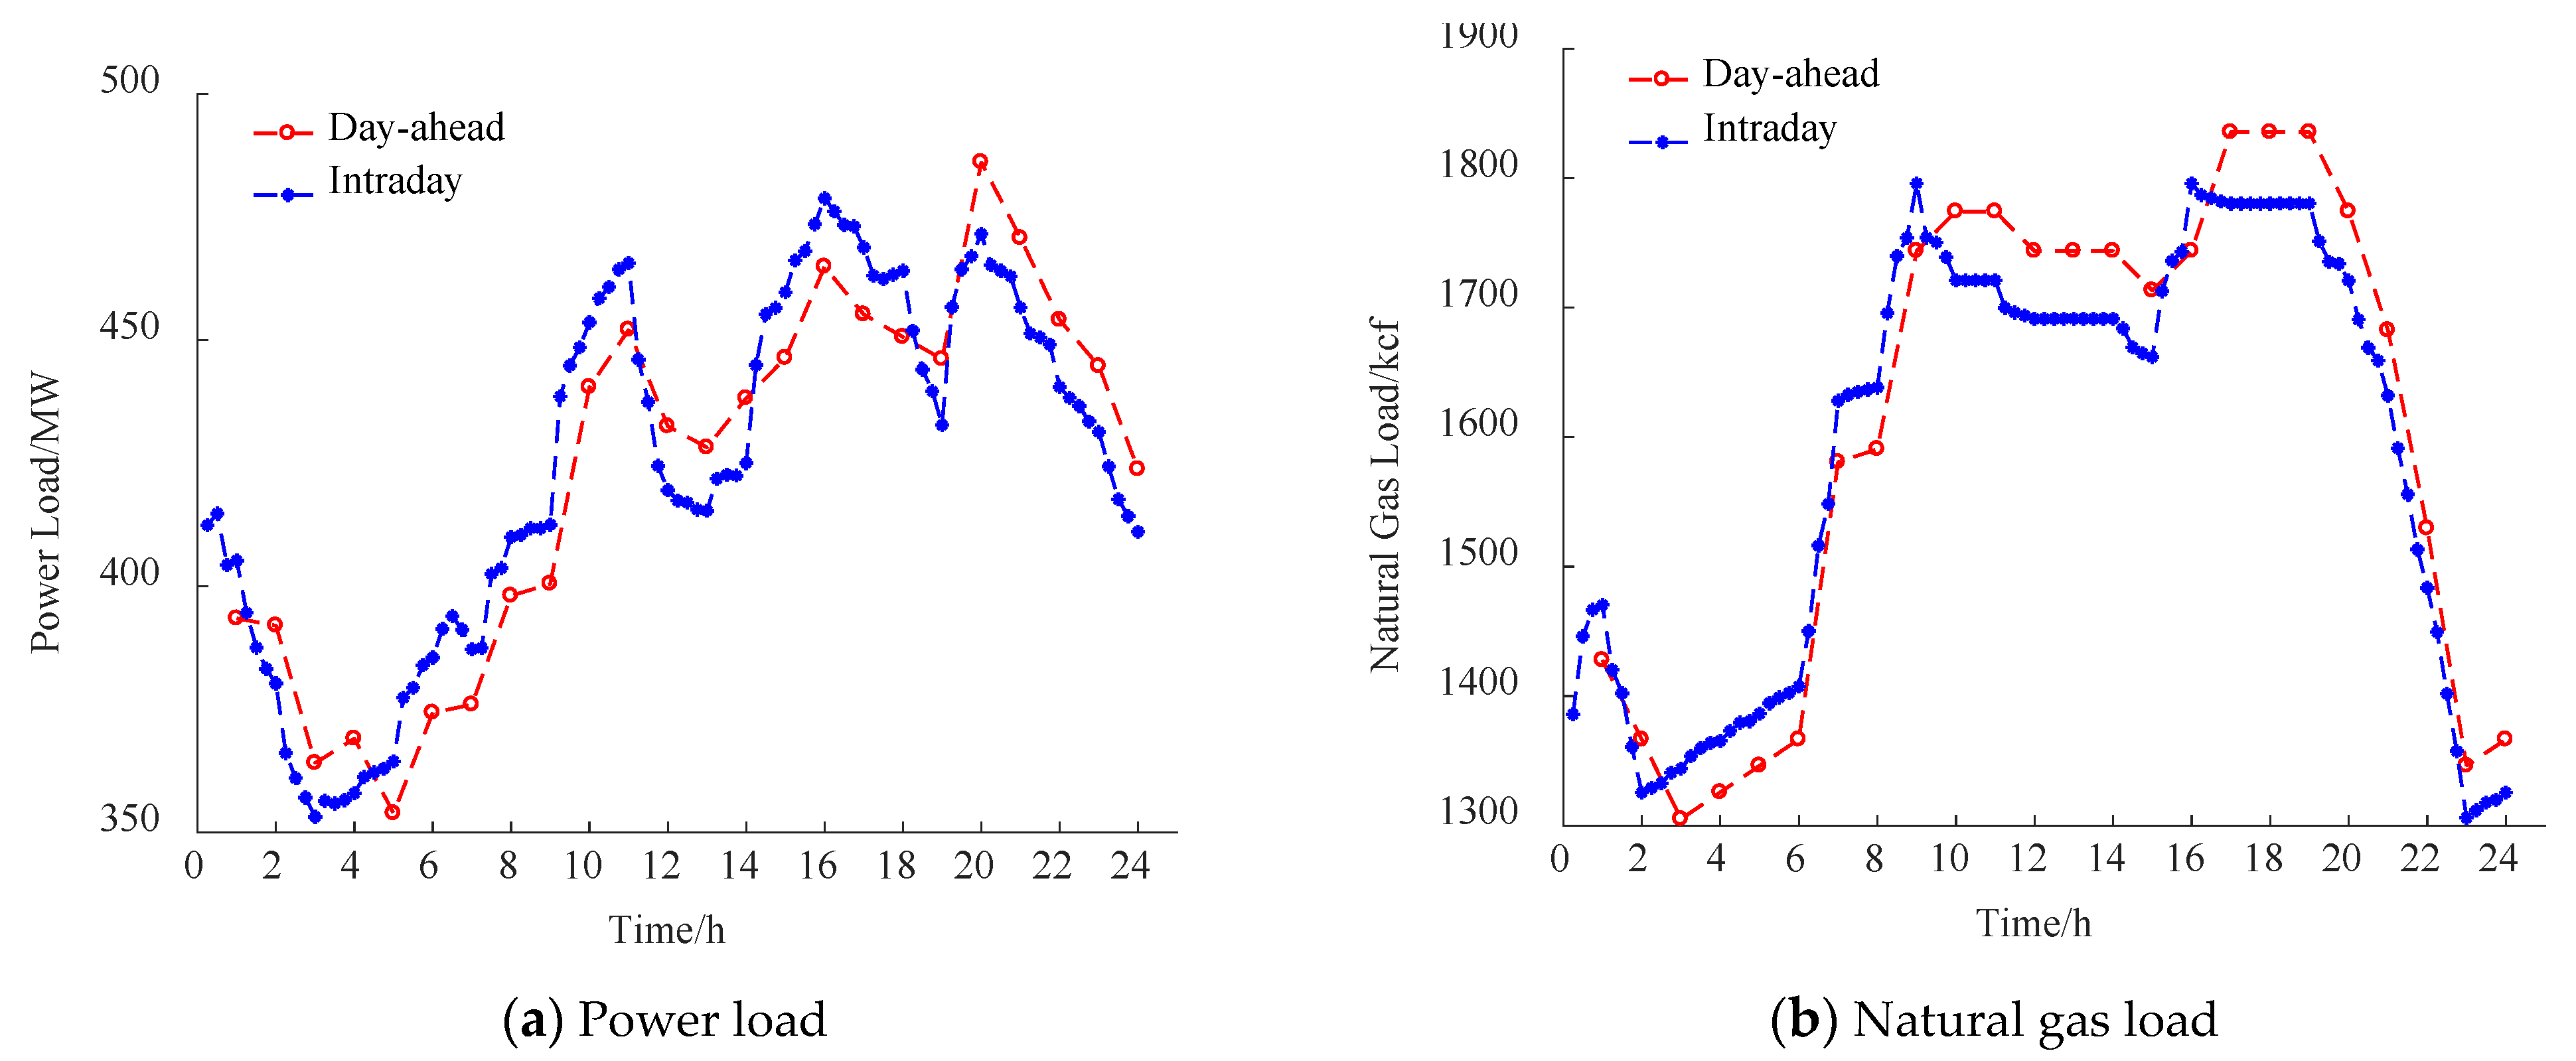
The upper and lower limits of the gas production flow rates of gas well GW1 are 1000 kcf/h and 400 kcf/h, respectively, while the corresponding gas production flow’s upper and lower limits of GW2 are 1500 kcf/h and 500 kcf/h, respectively. The output power range of power-to-gas conversion is 7.5 MW-37.5 MW [30]. The gas storage device maintains the gas to be in the range of 250 kcf-1000 kcf, and the upper limit of the pipe exchange power is 250 kcf/h. For other data of the integrated system, please refer to references [31]. Figure A1 in the Appendix shows forecasted day-ahead and intra-day load curves of Areas 1 and 2, where the intra-day curves are very close to real data and can be treated as real data. Figure A2 shows the predicted day-ahead and intra-day wind farm power generation.
To study the influence of the method proposed in this paper on the cost and security of the coupled system, the following three cases are considered:
Case 1: Day-ahead economic dispatch of the IENGS without considering the flexibility constraints in Equations (34)–(48) and (60)–(61)
Case 2: Day-ahead economic dispatch of the IENGS considering the flexibility constraint.
Case 3: The multi-time scale economic dispatch model for the IENGS proposed in this paper (i.e., intra-day dispatch is considered together with the day-ahead operation in Case 2 using the multi-time scale approach).

4.2. Results and Analysis

Table 2 shows the operating costs of the three cases. It is found that Case 2 has a higher operating cost than Case 1 due to the added flexibility-related constraints to handle uncertainties. Compared with Cases 1 and 2, the PtG operating cost in Case 3 decreases significantly because of its capability to absorb wind power. By comparing Cases 1, 2, and 3, it can be observed that the multi-time scale scheduling method proposed in this paper can keep the same safety margin as Case 2 while reducing the operation cost to the same level as Case 1.
Compared with the day-ahead hourly dispatching results of Case 1 and Case 2, Case 3 includes both the hourly day-ahead operation and the 15 min intra-day operation which can better absorb the fluctuating wind power generation. As can be seen from Figure 5, the dispatching method in Case 3 can better absorb wind power during 0:00–8:00, which significantly reduces wind power curtailment. In Case 3, the maximum wind power curtailment is 5.76 MW, while the maximum wind power curtailment in Case 2 is 18 MW, and thus, Case 3 has reduced about 68% of the wind power curtailment. This is mainly because the IENGS in Case 3 has more flexibility to increase the wind energy consumption and make the best use of renewable energy.
(1)
Power balance of the IENGS in Case 3
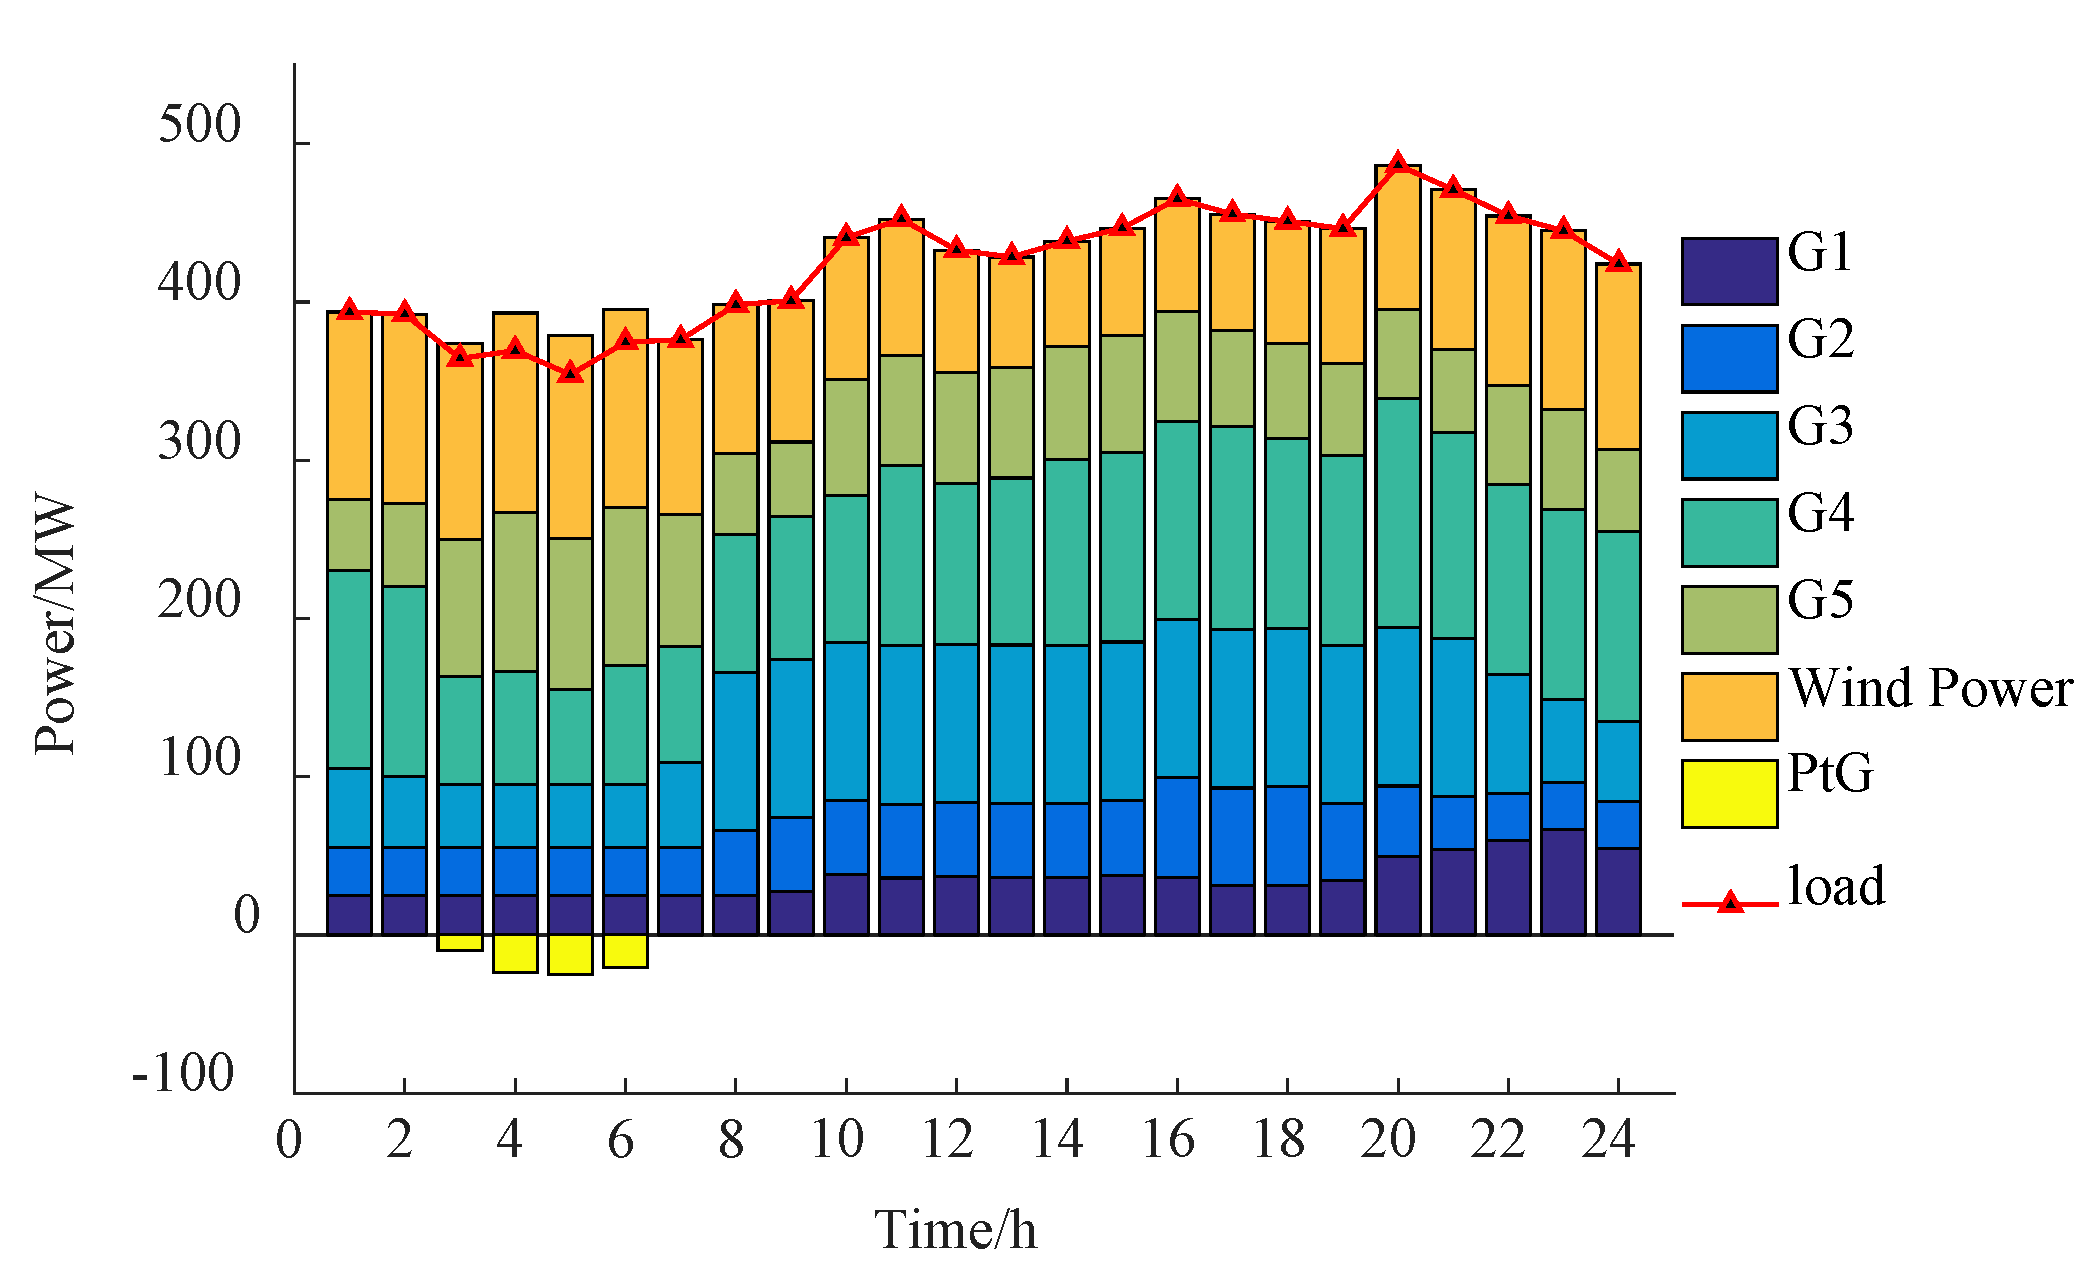
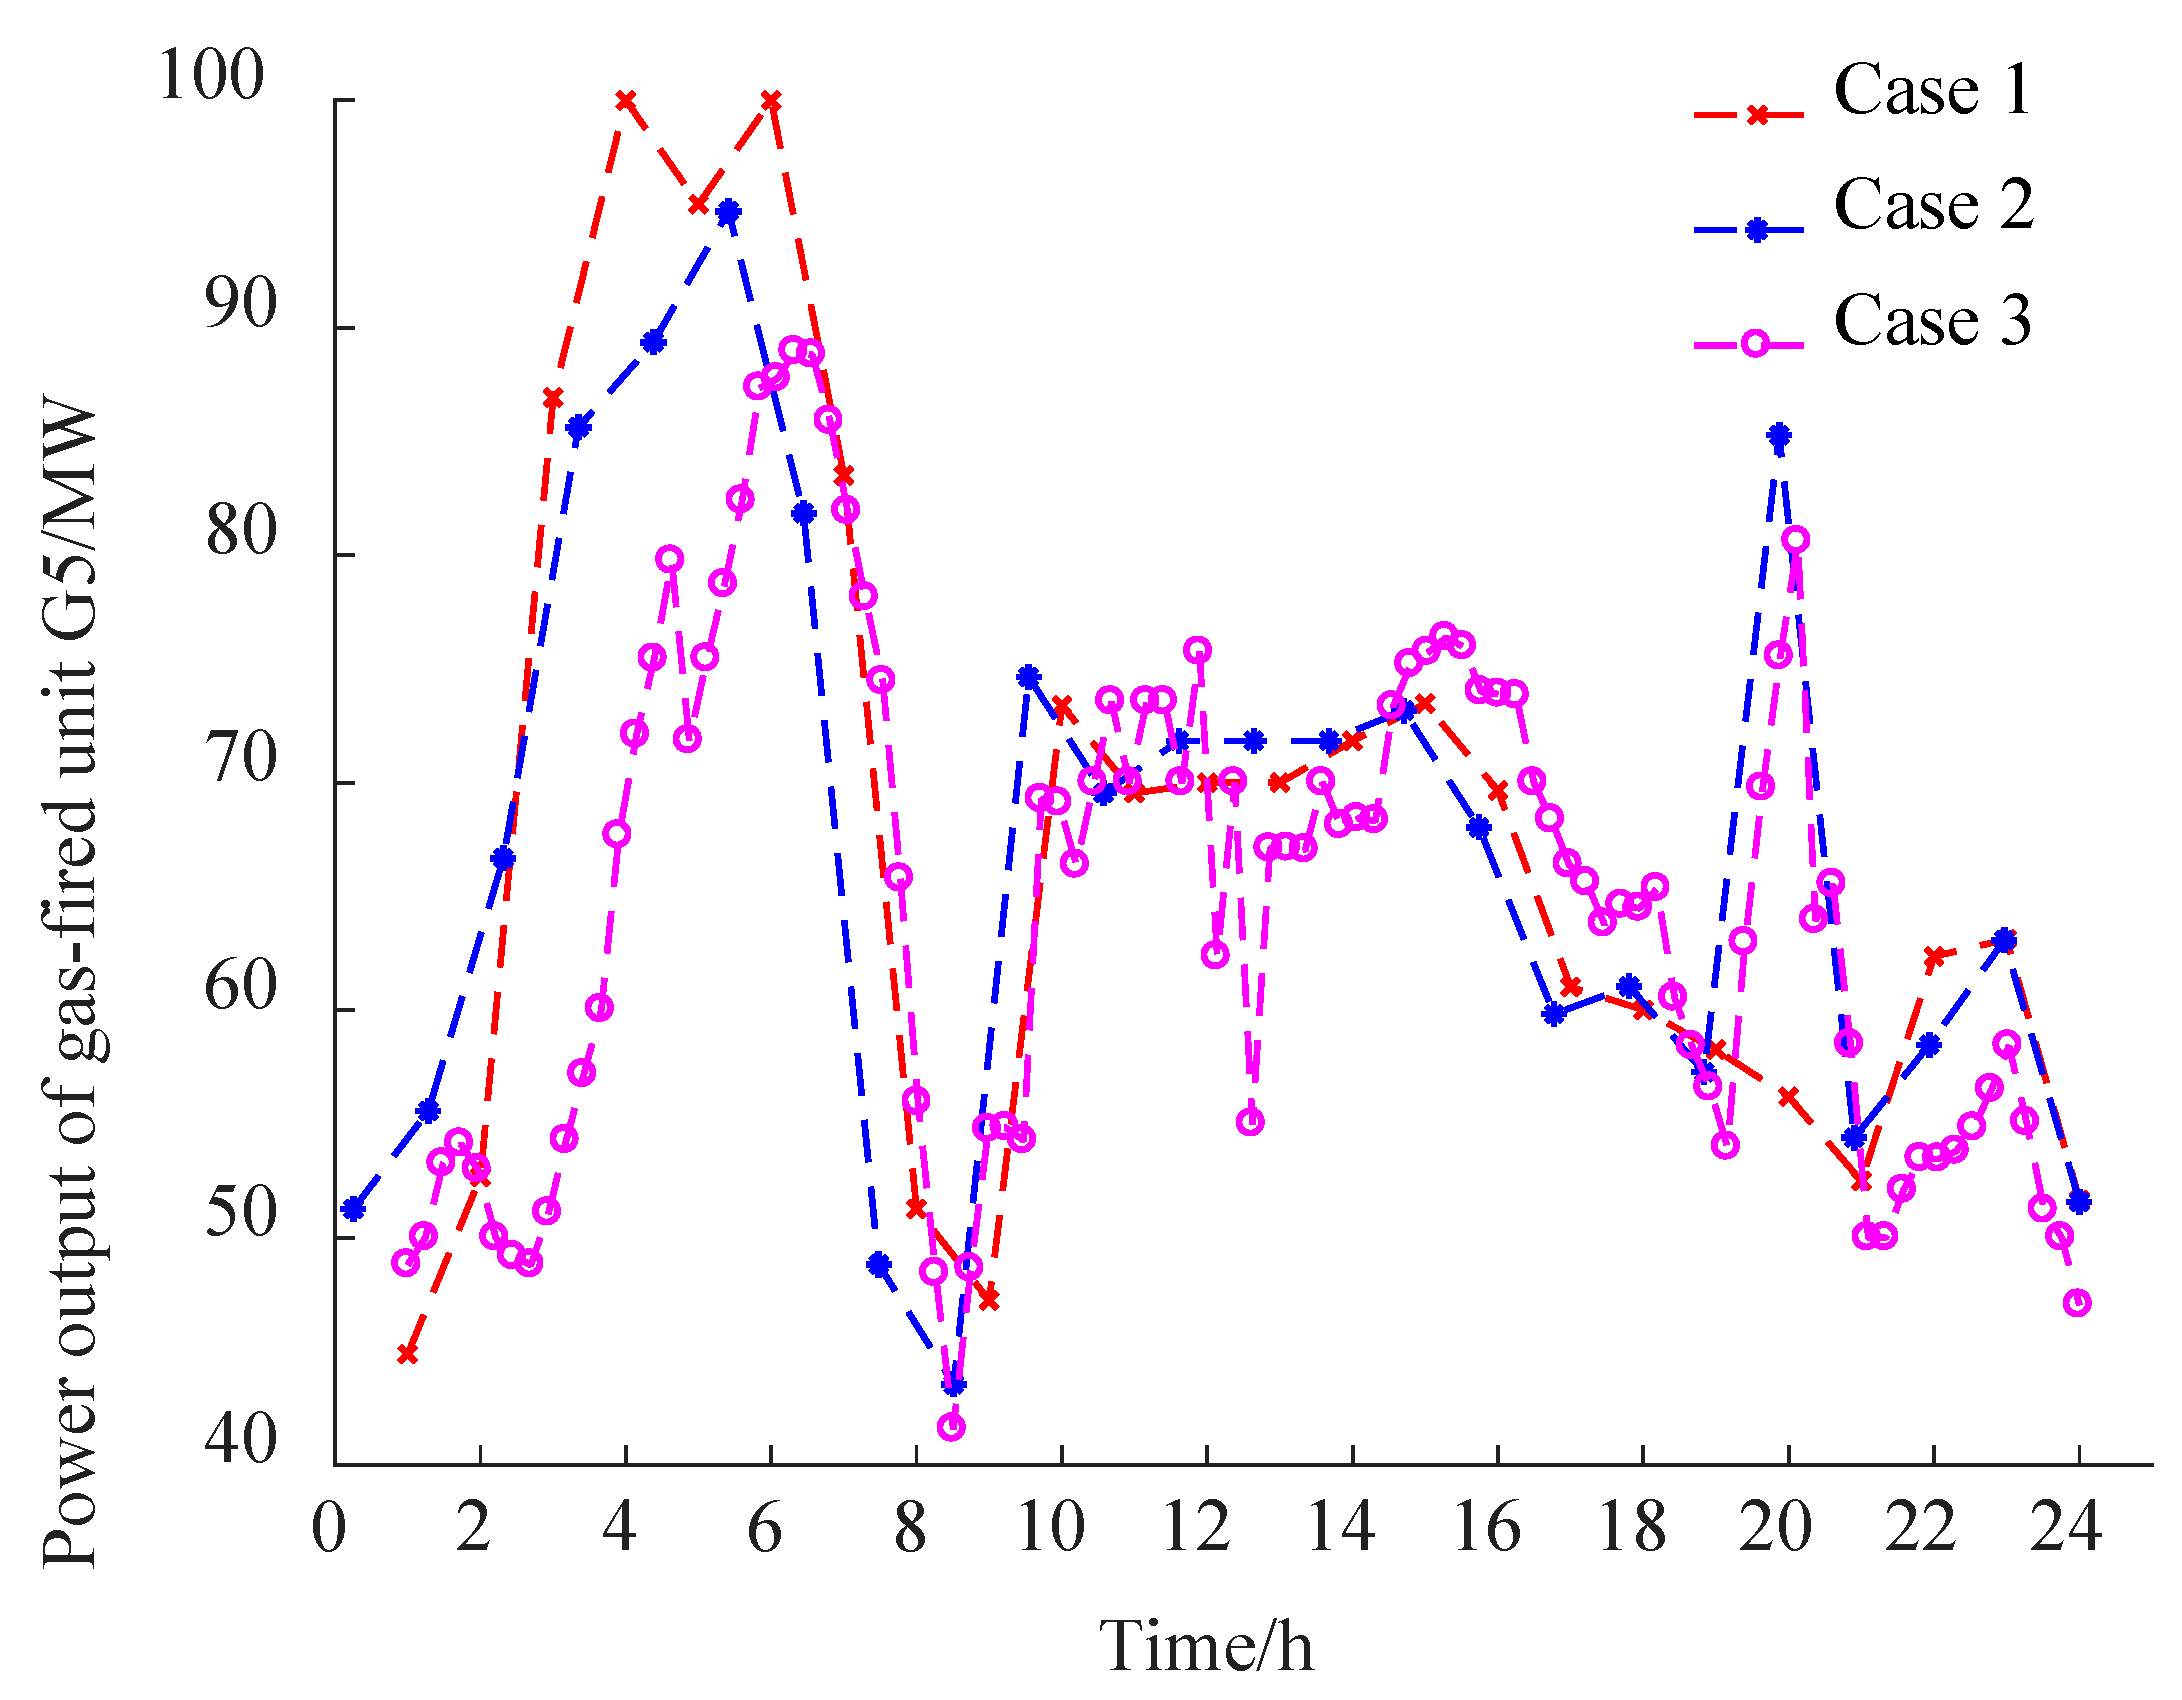
It can be seen from Figure 6 that during 3:00–6:00, the load is small, while wind power generation is still high. The excess wind power is absorbed by the PtG equipment because it cannot be transported to other regions due to the limitation of power transmission at inter-regional connection lines. Because the coal cost is usually cheap, the electricity in the IENGS is mainly provided by coal-fired generation units. However, because the gas load is low from 2:00 to 8:00 in the early morning, the corresponding gas price is cheap, and then the gas turbine G5 generates more power during this period. After 8:00, due to the increase in gas load, the gas price increases, the output power of gas turbine G5 is reduced, and the remaining power is supplied by coal-fired units G3 and G4 with lower cost. After the rise in gas price, coal-fired unit G3 has the lowest power generation cost, and it will generate at its maximum power after 8:00.
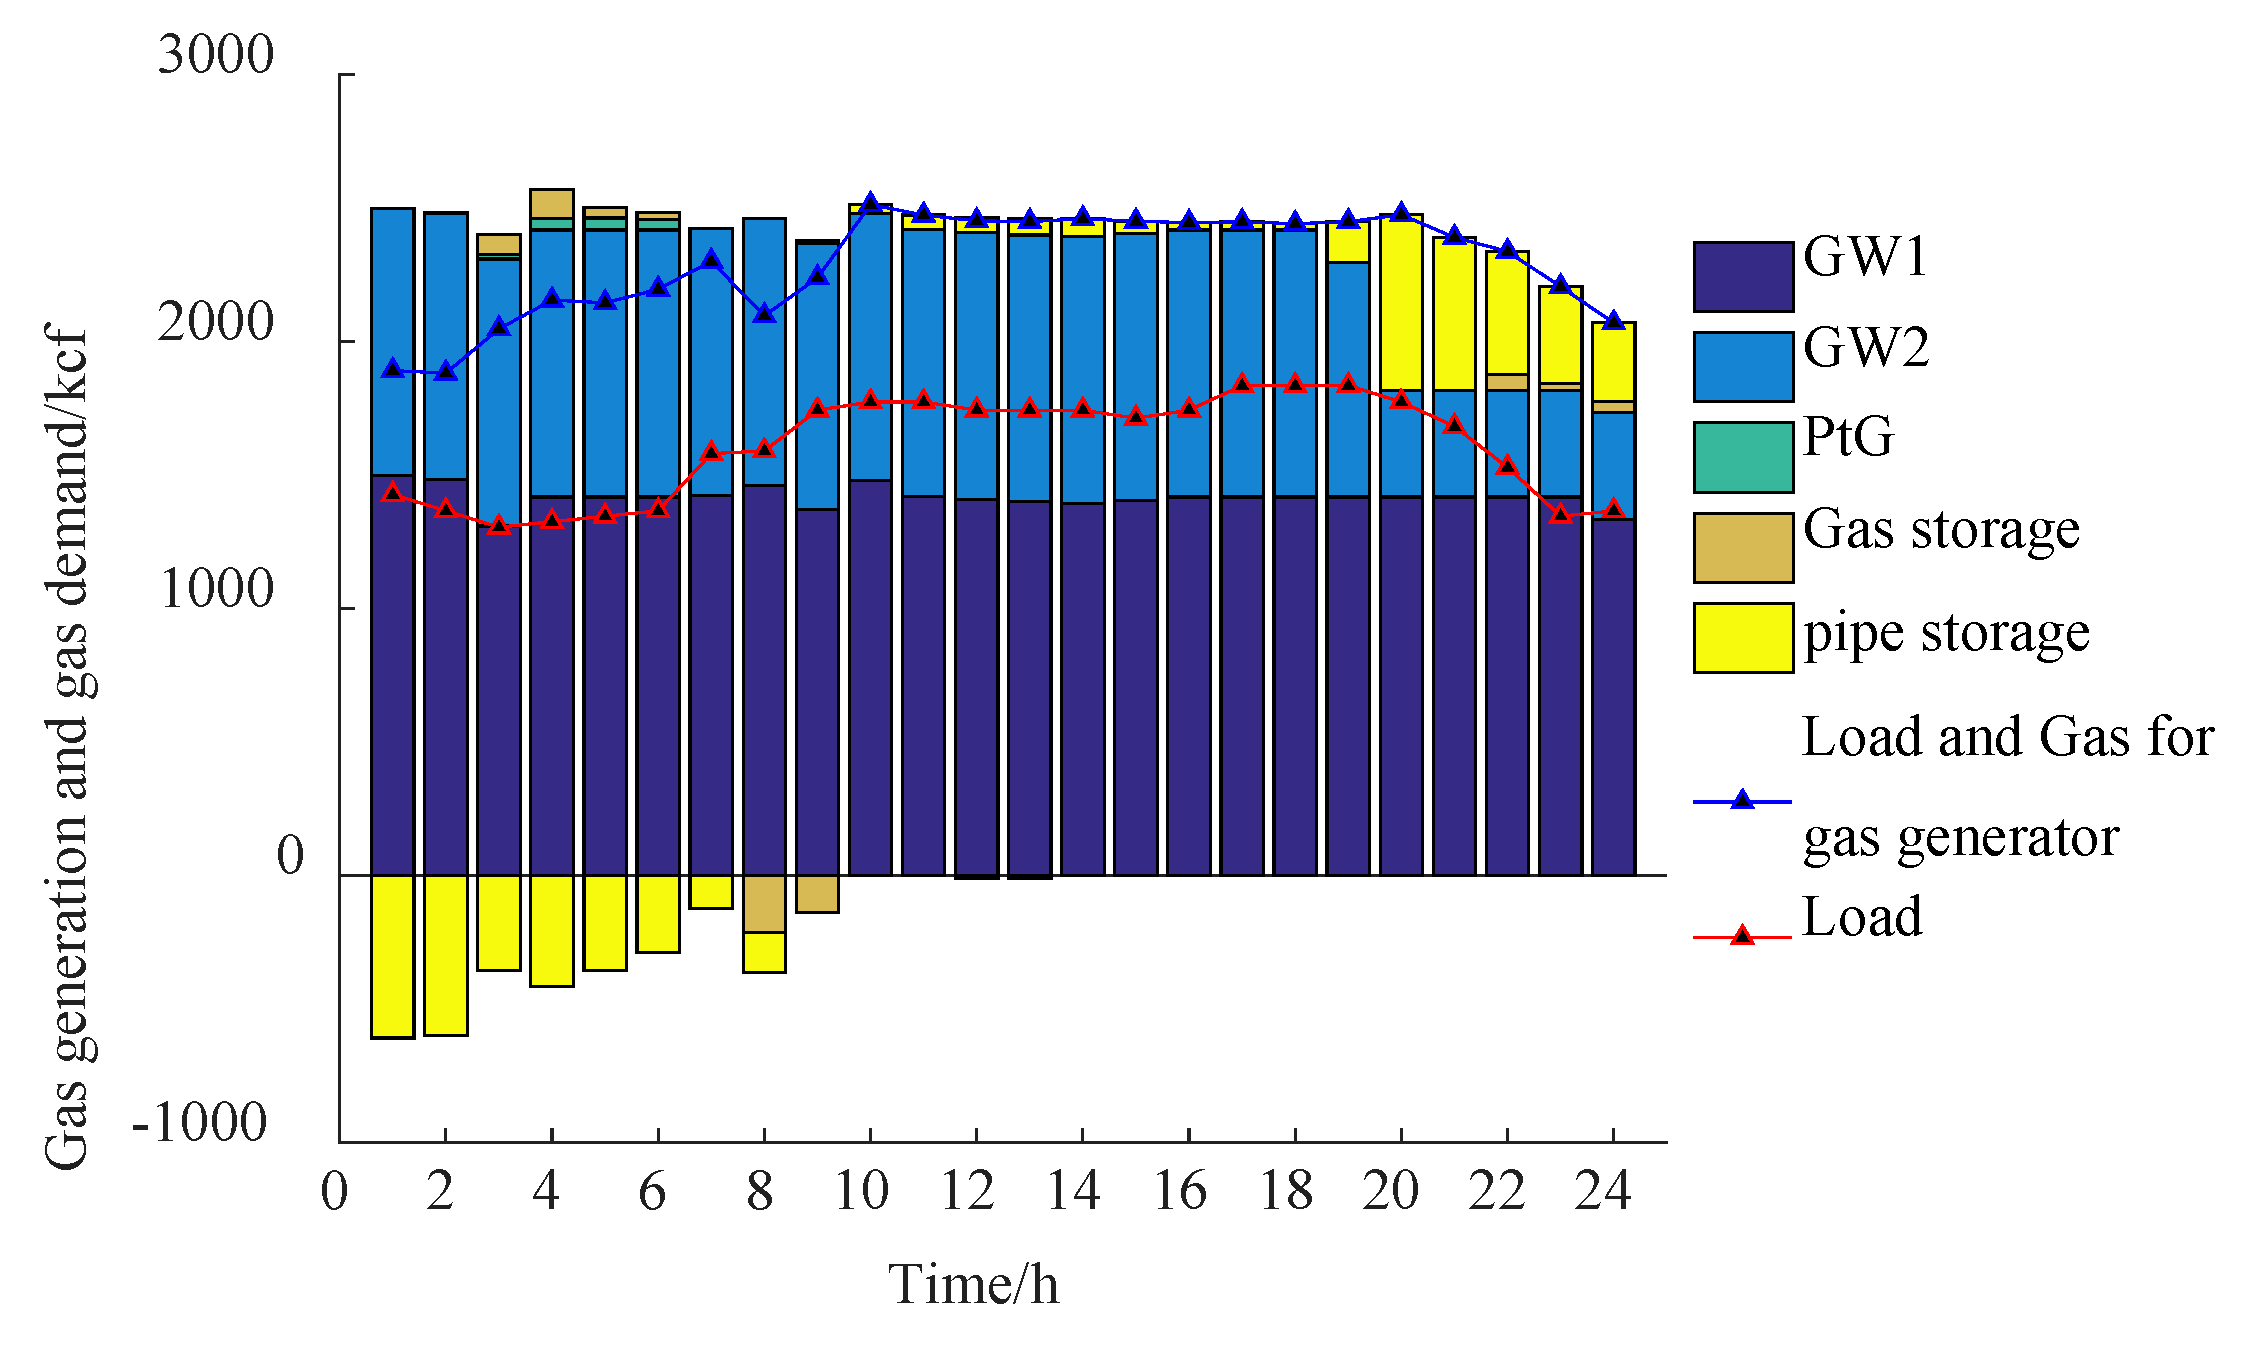
For the seven-node natural gas system, it can be seen from Figure 7 that gas storage can increase the operational flexibility of the natural gas system. The storage stores gas in the period of low load and supplies gas to the system when the load is large, which effectively reduces the production pressure of gas well W2. More gas from gas well W1 with a lower price is used to achieve the lower cost of the IENGS.
(2)
Analysis for flexibility constraints of Case2
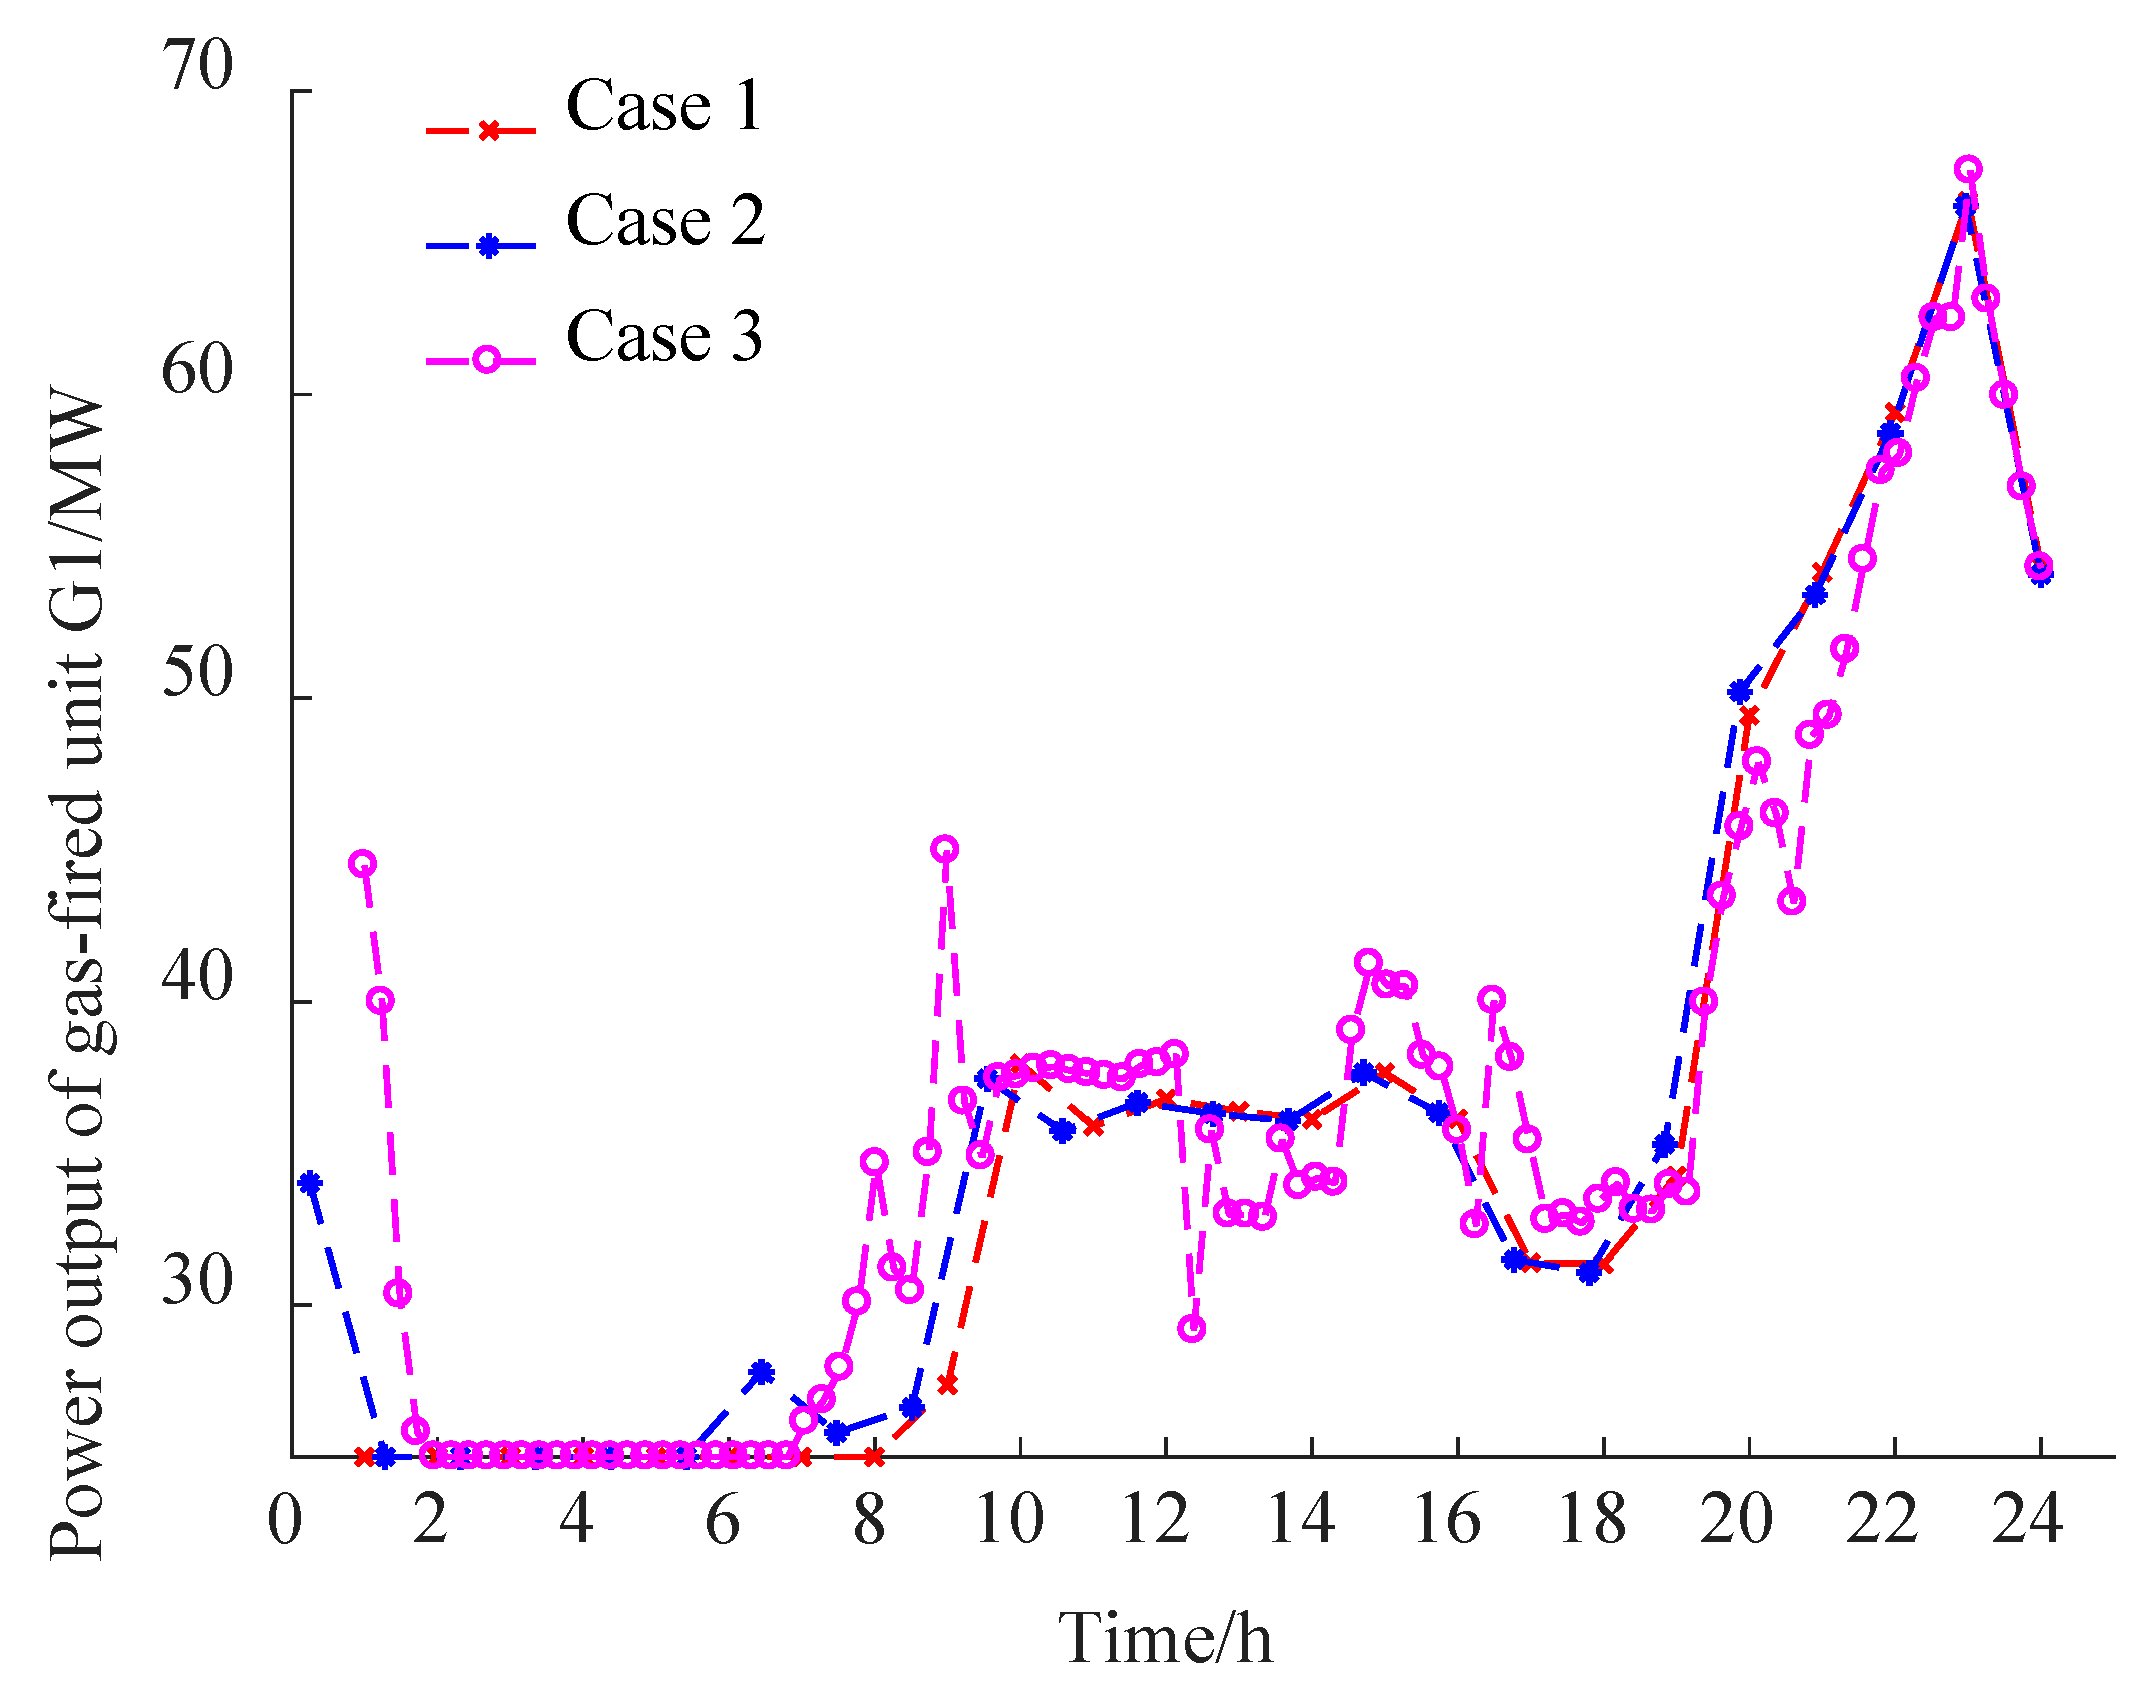
Figure 8, Figure 9, Figure 10, Figure 11 and Figure 12 show the output comparison of units G1-G5 in different cases. It can be seen that units G2, G4, and G5 have a larger fluctuation range compared with Case 1, which ensures the power balance of the system, while units G1 and G3 cannot provide spare capacity for the system in most periods due to the higher marginal cost. Even if the wind power can provide the electric load at the time of 1:00–3:00, the unit G2 needs to adjust output power to meet the region’s decreasing load demand together with the PtG equipment. Because PtG needs to provide backup capacity to the system during 1:00–4:00 and 7:00, it cannot output its maximum power, so a certain amount of wind power will be curtailed at these time periods.
For the seven-node natural gas system, gas supply to gas turbine G5 is reduced during 2:00–7:00 to meet the flexible requirements of the system, which also makes gas unit G5 reduce its output power during this period and turn to coal unit G4 for power supply. At the same time, the gas storage device also chooses to maintain the existing gas storage to meet the flexibility requirements at 2:00–7:00. As shown in Figure 13, due to the increase in gas load at 9:00, the gas has to be provided by gas well W2 at a higher price, so the gas storage device stops to store more gas.
(3)
Analysis for multi-time scale optimal scheduling strategy of Case 3
For the six-bus power system, Figure 9, Figure 11 and Figure 12 show that units G2, G4, and G5 are the pieces of equipment that mainly deal with the fluctuation of wind power and power load in Case 3, which is consistent with the flexibility capacity of the units in the day-ahead operation in Case 2. Due to economic reasons, G3 in Case 3 almost repeats the same dispatching results as Cases 1 and 2 most of the time, and only deviates from the dispatching results of Case 2 in a few periods. To absorb wind power as much as possible at 1:00–4:00, the downward flexibility of unit G2 is used to reduce the power generation of unit G2 and inject more wind power into the system, see Figure 9. At 8:00–18:00, as the wind power generation gradually decreases and the power load gradually increases, the output power of G2 and G4 gradually increase, which ensures sufficient power supply. Figure 11 and Figure 12 show that G4 and G5 are the main generators to serve flexibility in Case 2. In Case 3, the expensive gas-fired unit G5 is mostly used to cater for system needs during certain high-load-fluctuation periods, while the inexpensive coal-fired unit G4 will take care of the increasing load during load fluctuations.
For the seven-node natural gas system, Figure 13 shows apparent fluctuations in the stored gas in the gas storage in Case 3 compared with Case 2. This fluctuation is to ensure the minimum operation cost of the whole IENGS.

4.3. The 118-Bus Power System Coupled with 12-Node Natural Gas System

To further investigate the effectiveness of the presented model, a large-scale IENGS is adopted for this paper. It consists of the modified IEEE 118-bus power system and a 12-node natural gas system. The topology of the modified IEEE 118-bus power system is the same as [6], which includes 42 coal-fired units (5666.2 MW), 8 gas-fired units (300 MW each), 4 wind farms (300 MW each), 4 PtG facilities (100 MW each), 186 transmission lines, and 99 electrical loads. The 12-node natural gas system is shown in Figure 14, and it is composed of 3 gas wells (5000 kcf + 4800 kcf + 7000 kcf), 2 compressors, and 2 gas storage facilities (2000 kcf each).
The three cases in Section 4.1 are also considered for this large test system.
Although Case 2 considers the constraint of flexibility, the total cost only increases by USD 25,108.46 compared with Case 1, accounting for 0.4% of the total cost. This is due to the adoption of the chance-constrained programming approach to handle the random variables. As a result, the system performs well in terms of cost reduction. However, 118.88 MW of wind power output is curtailed in Case 2, which is a significant waste. Therefore, multi-time scale scheduling for both day-ahead and intra-day operation are considered in Case 3 to solve this issue. It can be seen from Table 3 that the total cost of Case 3 is almost close to that of Case 1. Moreover, the scheduling cost in Case 3 for flexible equipment such as PtG increases significantly, which makes the whole system achieve high utilization efficiency for wind power—only 24.78 MW of wind power is curtailed, i.e., 72.1% wind power curtailment has been reduced compared to Case 1. From the above analysis, the method in this paper can effectively improve the economy and wind power utilization while ensuring safety for large systems.

5. Conclusions

Considering uncertainties from wind generation and load forecast, this paper constructs an economic dispatch model for an integrated electric power and natural gas system to minimize the total operating cost, where uncertainties are handled with the help of flexibility modeling and chance-constrained programming. A quasi-steady-state model for the natural gas pipeline network, gas network storage, and a multi-time scale economic scheduling model are proposed to assist the day-ahead and intra-day operations. The above nonlinear model is also converted into a linear model for the ease of applying powerful optimization tools in CPLEX. The case study shows that about 68.0–72.1% wind power curtailment can be effectively reduced while satisfying all load and system safety requirements.
In our future work, demand response will be included in the economic operation for the integrated electric power and natural gas network.

Author Contributions

Conceptualization, Z.L. (Zhenyu Liu); methodology, L.H.; software, P.Y.; validation, H.C.; formal analysis, J.Z.; writing—original draft preparation, Y.L.; supervision, Z.L. (Zhigang Lu). All authors have read and agreed to the published version of the manuscript.

Funding

This paper is financially supported by the Science and Technology Project of State Grid Hebei Electric Power Company (kjcb2021-019).

Data Availability Statement

The datasets supporting the conclusions of this article are included within the article.

Conflicts of Interest

The authors declare no conflict of interest. The funders had no role in the design of the study; in the collection, analyses, or interpretation of data; in the writing of the manuscript; or in the decision to publish the results.

Nomenclature

Indices and Sets
b , n Buses of the electric network and nodes of the gas network, respectively
f , p t g , w Indexes for thermal generation units, PtG (power to gas), and wind farms
l , l 1 , l 2 Transmission lines, buses of the line head and tail
p , p 1 , p 2 Gas pipelines, nodes of the pipeline head and tail
s , ω Storage facilities and wells of the natural gas system
t Scheduling scale (hours, 15 min)
Ω T , Ω FU , Ω GW Sets of time, coal-fired units and gas wells, respectively
Ω ptg , Ω NS Sets of PtG facilities and gas storage unit
Ω p , Ω TL Sets of generators and lines, respectively
Variables
G ( P f , t ) Fuel consumption of unit f at time t
Q ω , t Natural gas produced by well w at time t (kcf)
ρ f , ρ ω Unit prices of energy and natural gas, respectively
P ptg , t , Q gs out Input power of power-to-gas equipment (MW) and the level of natural gas storage equipment (kcf) at time t
θ ( . ) , t Bus voltage angle at time t (rad)
P L l max Maximum power flow of line l (MW)
P m , w , P p t g , t in , L m , t , L l , t Wind farm output, PtG converted power, node load, and power flow of line l at time t
π p 1 , t , π p 2 , t Pressure of pipe p 1 , p 2 at time t
Q p , t av , Q p , t out , Q p , t in Average flow, output flow, and input flow of pipeline p in time t (kcf/h)
π p , t av Average pressure of pipeline p at time t
Q p , t lp , Q p , t 1 lp The gas storage capacity of pipeline p at time t and t-1 (kcf/h)
Q p , 0 lp , Q p , N T lp The gas storage capacity of pipeline p at initial time and N T
Q ω , t , Q g s , t out , Q g s , t in Gas well gas production flow, gas storage device, gas discharge flow (kcf/h)
Q p t g , t , Q g , t , Q p , t out , Q p , t in The conversion flow of PtG facilities, the consumption flow of gas unit f, the discharge and inflation flow of pipeline p (kcf/h)
L n , t Gas load flow of node n
P f , t , P f , t 1 Output power of unit f at time t and t-1 (MW)
P w , t Power outputs of wind farm w at time t (MW)
Δ P w , t Net fluctuation value of wind farm w at time t (MW)
ζ e , h Electrical energy is converted to an equivalent thermal coefficient
E g s , t Gas storage of gas storage device (kcf)
Q g s , t in , Q g s , t out The flow rate injected and released by the gas storage device (kcf/h)
R i , t up , R i , t down Flexibility provided by the unit i (MW)
R p t g , t up , R p t g , t down Flexibility provided by PtG facilities ptg (MW)
β 1 , β 2 The confidence level of the upward and downward flexibility
Constants
ρ ptg , ρ gs Unit costs for electric power consumed (USD/kWh) and natural gas released (USD)
P f min , P f max Maximum and minimum unit output
η g , η p t g Gas turbine power generation efficiency and PtG conversion efficiency
H NG , H H 2 High calorific values of natural gas and hydrogen
RD f , RU f Maximum ramp down and up power of unit f
R f , t u , R f , t d The flexibility provided by unit f at time t
floor Floor function of a real number
sort sorting function to sort a vector in ascending order
λ 1 , λ 2 Power fluctuation penalty and energy storage penalty coefficient
P i t , E i t Actual output power and actual state of energy storage in actual operation
P i , t , ref , E g s , t , ref Unit output power and energy storage status obtained by day-ahead scheduling
E g s , min , E g s , max Upper and lower limits of gas storage capacity
H m , w , H m , p t g , H m , f , H m , l The correlation matrix of wind power, PtG facilities, unit, and line
C p lp Storage constant of pipe p
K p , min , K p , max Minimum and maximum compression ratios of compressors in pipeline p
a f , b f , c f Fuel curve coefficients of coal-fired units f

Appendix A

Figure A1. Forecasted electricity and natural gas loads for day-ahead and intra-day operations.
Processes 11 01987 g0a1
Figure A2. Forecasted wind power for day-ahead and intra-day operations.
Processes 11 01987 g0a2

References

  1. Karimi, M.; Rahimpour, M.R.; Rafiei, R.; Jafari, M.; Iranshahi, D.; Shariati, A. Reducing environmental problems and increasing saving energy by proposing new configuration for moving bed thermally coupled reactors. J. Nat. Gas Sci. Eng. 2014, 17, 136–150. [Google Scholar] [CrossRef]
  2. Lynch, M.; Devine, M.T.; Bertsch, V. The role of power-to-gas in the future energy system: Market and portfolio effects. Energy 2019, 185, 1197–1209. [Google Scholar] [CrossRef]
  3. Yang, Z.; Gao, C.; Zhao, M. Coordination of integrated natural gas and electrical systems in day-ahead scheduling considering a novel flexible energy-use mechanism. Energy Convers. Manag. 2019, 196, 117–126. [Google Scholar] [CrossRef]
  4. Zhang, D.; Zhu, H.; Zhang, H.; Hui, H.; Liu, H.; Wu, T. An optimized design of residential integrated energy system considering the power-to-gas technology with multi-functional characteristics. Energy 2022, 238, 121774. [Google Scholar] [CrossRef]
  5. Zhong, J.; Li, Y.; Cao, Y.; Tan, Y.; Peng, Y.; Zeng, Z.; Cao, L. Stochastic optimization of integrated energy system considering network dynamic characteristics and psychological preference. J. Clean. Prod. 2020, 275, 122992. [Google Scholar] [CrossRef]
  6. Zhou, D.; Wang, C.; Yan, S.; Yan, Y.; Guo, Y.; Shao, T.; Li, T.; Jia, X.; Hao, J. Dynamic modeling and characteristic analysis of natural gas network with hydrogen injections. Int. J. Hydrogen Energy 2022, 78, 33209–33223. [Google Scholar] [CrossRef]
  7. Zhang, X.; Zhang, Y. Environment-friendly and economical scheduling optimization for integrated energy system considering power-to-gas technology and carbon capture power plant. J. Clean. Prod. 2020, 276, 123348. [Google Scholar] [CrossRef]
  8. Chen, F.; Deng, H.; Chen, Y.; Wang, J.; Jiang, C.; Shao, Z. Distributed robust cooperative scheduling of multi-region integrated energy system considering dynamic characteristics of networks. Int. J. Electr. Power Energy Syst. 2023, 145, 108605. [Google Scholar] [CrossRef]
  9. Tang, J.; Ding, M.; Lu, S. Operational flexibility constrained intraday rolling dispatch strategy for CHP microgrid. IEEE Access 2019, 7, 96639–96649. [Google Scholar] [CrossRef]
  10. Clegg, S.; Mancarella, P. Integrated electrical and gas network flexibility assessment in low carbon multi-energy systems. IEEE Trans. Sustain. Energy 2016, 7, 718–731. [Google Scholar] [CrossRef]
  11. Su, X.; Bai, X.; Zheng, Y. Data-driven Robust Dispatch of Integrated Electricity-gas Energy Systems Considering Uncertainty of Wind Power. In Proceedings of the 2019 IEEE Power & Energy Society General Meeting (PESGM), Atlanta, GA, USA, 4–8 August 2019; pp. 1–5. [Google Scholar]
  12. Mu, Y.; Xu, Y.; Cao Yan Chen, W.; Jia, H.; Yu, X.; Jin, X. A two-stage scheduling method for integrated community energy system based on a hybrid mechanism and data-driven model. Appl. Energy 2022, 323, 119683. [Google Scholar] [CrossRef]
  13. Hamza, A.; Woan-Ho, P.; Mark, B.; Yun-Su, K. Two-Stage stochastic optimization for operating a Renewable-Based Microgrid. Appl. Energy 2022, 325, 119848. [Google Scholar]
  14. Firmansyah, N.; Makbul, A.; Ahmad, H.; Houssem, R.; Muhyaddin, R.; Rifqi, F.; Mustafa, M. Stochastic optimization for the scheduling of a grid-connected microgrid with a hybrid energy storage system considering multiple uncertainties. Energy Rep. 2022, 8, 7444–7456. [Google Scholar]
  15. Arsalan, N.; Mahdi, P.; Michal, J.; Matti, L.; Zbigniew, L. A max–min–max robust optimization model for multi-carrier energy systems integrated with power to gas storage system. J. Energy Storage 2022, 48, 103933. [Google Scholar]
  16. Arsalan, N.; Mahdi, P.; Michal, J.; Matti, L.; Zbigniew, L. A medium-term hybrid IGDT-Robust optimization model for optimal self scheduling of multi-carrier energy systems. Energy 2022, 238, 121661. [Google Scholar]
  17. Wang, H.; Xing, H.; Luo, Y.; Zhang, W. Optimal scheduling of micro-energy grid with integrated demand response based on chance-constrained programming. Int. J. Electr. Power Energy Syst. 2023, 144, 108602. [Google Scholar] [CrossRef]
  18. Liang, W.; Lin, S.; Liu, M. Stochastic economic dispatch of regional integrated energy system considering the pipeline dynamics using improved approximate dynamic programming. Int. J. Electr. Power Energy Syst. 2022, 141, 108190. [Google Scholar] [CrossRef]
  19. Zhang, Z.; Wang, C.; Chen, S.; Zhao, Y.; Dong, X.; Han, X. Multitime Scale Co-Optimized Dispatch for Integrated Electricity and Natural Gas System Considering Bidirectional Interactions and Renewable Uncertainties. IEEE Trans. Ind. Appl. 2022, 58, 5317–5327. [Google Scholar] [CrossRef]
  20. Yi, Z.; Xu, Y.; Gu, W.; Wu, W. A Multi-Time-Scale Economic Scheduling Strategy for Virtual Power Plant Based on Deferrable Loads Aggregation and Disaggregation. IEEE Trans. Sustain. Energy 2020, 11, 1332–1346. [Google Scholar] [CrossRef]
  21. Cheng, Z.; Jia, D.; Li, Z.; Si, J.; Xu, S. Multi-time scale dynamic robust optimal scheduling of CCHP microgrid based on rolling optimization. Int. J. Electr. Power Energy Syst. 2022, 139, 107957. [Google Scholar] [CrossRef]
  22. Wu, G.; Xiang, Y.; Liu, J.Y. Decentralized day-ahead scheduling of multi-area integrated electricity and natural gas systems considering reserve optimization. Energy 2020, 198, 117271. [Google Scholar] [CrossRef]
  23. Correa-Posada, C.; Sánchez-Martın, P. Integrated power and natural gas model for energy adequacy in short-term operation. IEEE Trans. Power Syst. 2015, 30, 3347–3355. [Google Scholar] [CrossRef]
  24. Liu, H.; Fan, Z.; Xie, H.; Wang, N. Distributionally Robust Joint Chance-Constrained Dispatch for Electricity–Gas–Heat Integrated Energy System Considering Wind Uncertainty. Energies 2022, 15, 1796. [Google Scholar] [CrossRef]
  25. Tran, T.H.; Frenc, S.; Ashman, R. Linepick planning models for gas transmission network under uncertainty. Eur. J. Oper. Res. 2018, 268, 688–702. [Google Scholar] [CrossRef] [Green Version]
  26. MacKinnon, L.; Li, H.; Swartz, C.L.E. Robust model predictive control with embedded multi-scenario closed-loop prediction. Comput. Chem. Eng. 2021, 149, 107283. [Google Scholar] [CrossRef]
  27. Wang, Q.; Guan, Y.; Wang, J. A chance-constrained two-stage stochastic program for unit commitment with uncertain wind power output. IEEE Trans. Power Syst. 2012, 27, 206–215. [Google Scholar] [CrossRef]
  28. Soliman, M.S.; Belkhier, Y.; Ullah, N.; Achour, A.; Alharbi, Y.M.; Al Alahmadi, A.A.; Abeida, H.; Khraisat, Y.S.H. Supervisory energy management of a hybrid battery/PV/tidal/wind sources integrated in DC-microgrid energy storage system. Energy Rep. 2021, 7, 7728–7740. [Google Scholar] [CrossRef]
  29. Sahri, Y.; Belkhier, Y.; Tamalouzt, S.; Ullah, N.; Shaw, R.N.; Chowdhury, S.; Techato, K. Energy management system for hybrid PV/wind/battery/fuel cell in microgrid-based hydrogen and economical hybrid battery/super capacitor energy storage. Energies 2021, 14, 5722. [Google Scholar] [CrossRef]
  30. He, L.C.; Lu, Z.G.; Geng, L.J. Low-carbon economic dispatch for electricity and natural gas systems considering carbon capture systems and power-to-gas. Appl. Energy 2018, 224, 357–370. [Google Scholar] [CrossRef]
  31. He, L.C.; Lu, Z.G.; Geng, L.J. Environmental economic dispatch of integrated regional energy system considering integrated demand response. Int. J. Electr. PowerEnergy Syst. 2020, 116, 105525. [Google Scholar] [CrossRef]
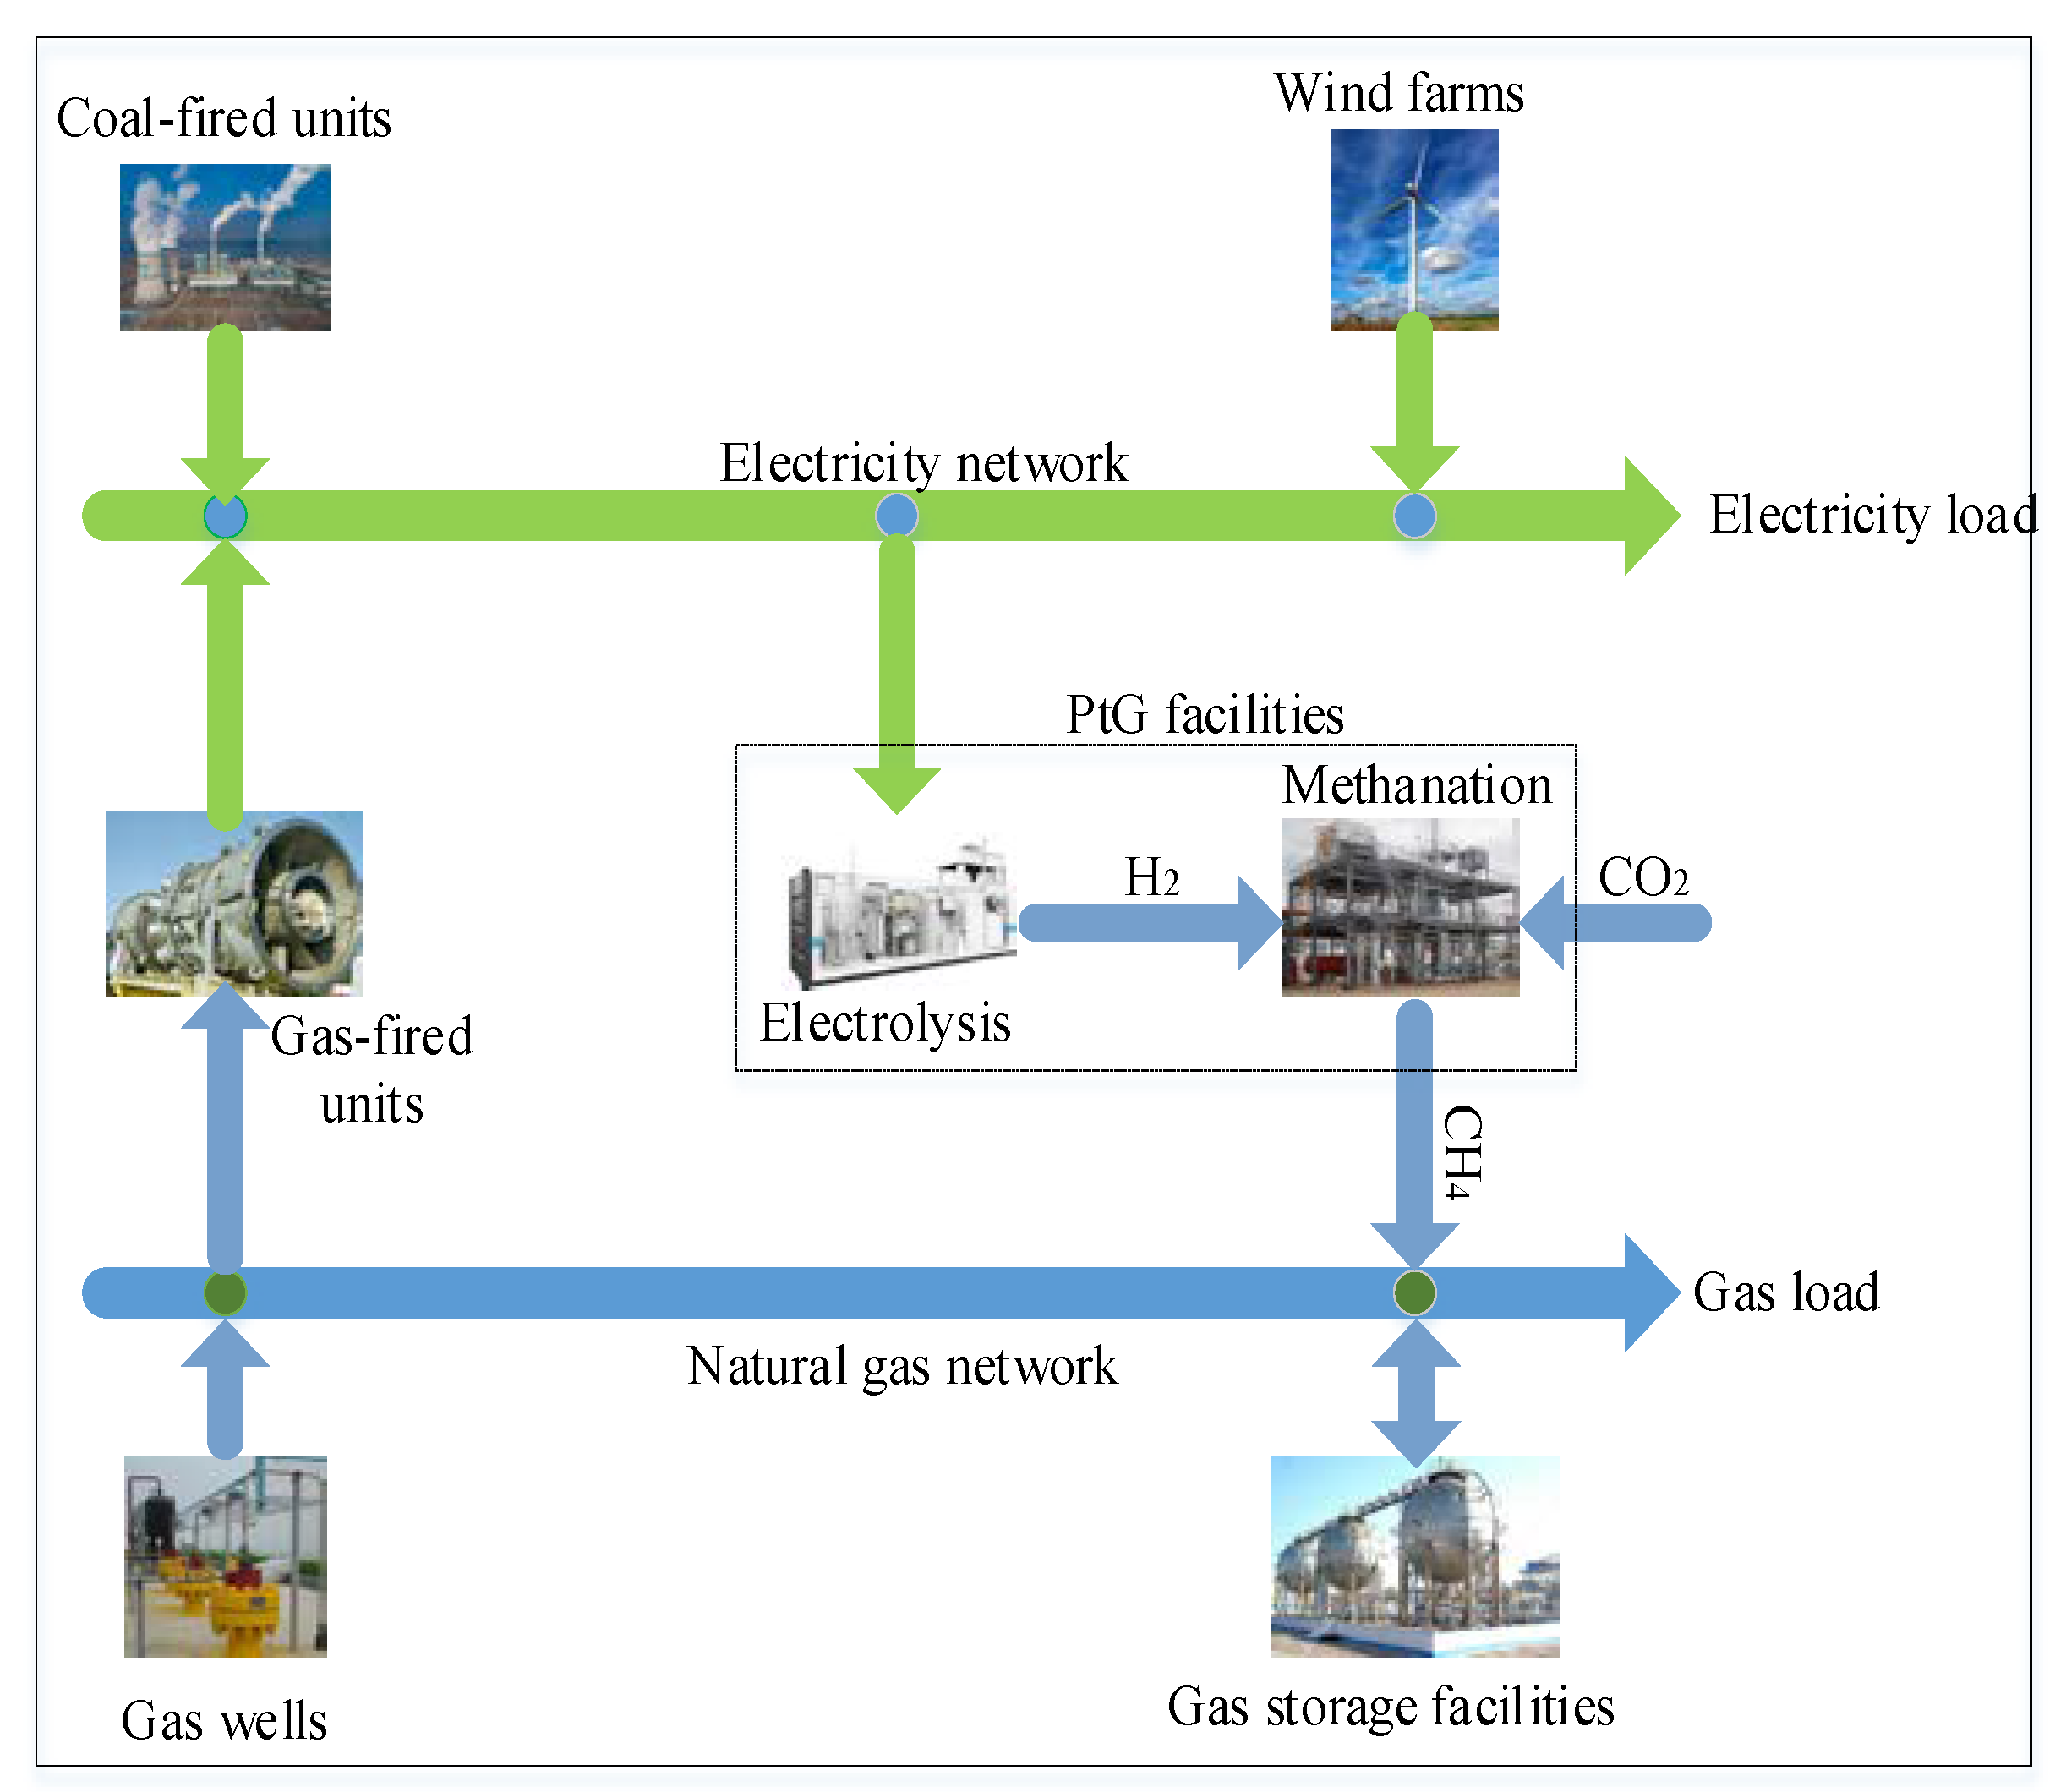
Figure 1. Structure of the IENGS.
Processes 11 01987 g001
Figure 2. Optimal dispatching framework for multi-time scale economic dispatch of the IENGS.
Processes 11 01987 g002
Figure 3. Flow chart of multi-time scale optimization strategy.
Processes 11 01987 g003
Figure 4. Six-bus power system and seven-node natural gas system.
Processes 11 01987 g004
Figure 5. Wind power curtailment.
Processes 11 01987 g005
Figure 6. Power generation and load in Case 3.
Processes 11 01987 g006
Figure 7. Balance of natural gas system flow in Case 3.
Processes 11 01987 g007
Figure 8. Power output of gas-fired unit G1.
Processes 11 01987 g008
Figure 9. Power output of coal-fired unit G2.
Processes 11 01987 g009
Figure 10. Power output of coal-fired unit G3.
Processes 11 01987 g010
Figure 11. Power output of coal-fired unit G4.
Processes 11 01987 g011
Figure 12. Power output of gas-fired unit G5.
Processes 11 01987 g012
Figure 13. Gas storage levels of gas storage facility.
Processes 11 01987 g013
Figure 14. The 12-node natural gas system.
Processes 11 01987 g014
Table 1. Summary of key aspects of the cited articles related to IENGS.
AuthorsStudied IssuesSystem SettingsSolution MethodContribution
[4]Modeling of equipment in IENGSCHP, Fr, AC, PVMILP, GAMS/CPLEXThe electrolytic cell and the methanation reactor in P2G are discussed in detail
[5]54-node IENGS networkMILP, GAMS/CPLEXThe IENGS model considering the dynamic characteristics of the gas network is proposed
[6]14-node gas networkdynamic simulationDynamic model of the natural gas network is established
[7]PV, GT, ES, PtG, CCSMILPP2G is extended into the IENGS with a high wind power penetration level
[8]CHP, WP, GTMISOCPThe dynamic transmission model of the gas network can converge reliably and provide a flexible scheduling scheme for the IENGS
[9]Flexibility of the IENGSa hypothetical microgrid in North ChinaGUROBIPropose an operational flexibility metric to quantify the ability of the microgrid
[10]29 busbar networkDC OPFA novel metric using zonal linepack is introduced to assess the IENGS flexibility
[11]CHP, WP, GT, DRMILPFlexibility is described by a probability distribution
[12]Dealing with uncertain problemsEPS, DHS, NGStwo-stage stochasticA two-stage stochastic scheduling scheme is proposed for the IENGS
[13]PV, ESS, UPS, ATStwo-stage stochasticA two-stage stochastic optimization for a renewable-based microgrid is proposed
[14]ORNL-DESSstochastic schedulingStochastic scheduling of a hybrid energy storage system is proposed.
[15]CHP, PtG, ESS, WTrobust schedulingProposing a new approach to robust max–min–max self-scheduling of the IENGS
[16]CHP, DA, PtG, ESSIGDT-RobustProposing a linear hybrid IGDT-robust optimization model for operation of the IENGS
[17]EV, CHP, PtG, IDRMILPProposing a chance-constrained programming model in the background of renewable uncertainty
[18]54-node IENGS networkADP methodAn SMES model of the IENGS considering the pipeline dynamics is proposed
[19]Multi-time scaleIEEE118-GAS40MISOCPPresenting a multi-time scale dispatch for the IENGS considering the interactions
[20]DGs, RES, ESS, DLMILPProposing a multi-time scale economic scheduling strategy for a virtual power plant
[21]CCHP MGMATLAB/YALMIPProposes a multi-time scale scheduling of CCHP microgrid based on rolling optimization
Table 2. Costs of objective function.
CaseTotal Operational Cost (USD)Fuel Cost of Coal-Fired Units (USD)Gas Production Cost of Gas Wells (USD)PtG Operating Costs (USD)Operational Cost of Gas Storage Facility (USD)
1471,135.24240,537.60229,934.61287.61375.42
2474,366.36243,859.15229,891.37262.37353.47
3471,524.99243,818.82226,972.06109.48624.63
Table 3. Costs of objective function.
CaseTotal Operational Cost (USD)Fuel Cost of Coal-fired Units (USD)Gas Production Cost (USD)PtG Operating Cost (USD)Gas Storage Cost (USD)
15,705,800.243,449,438.712,252,534.563102.81724.16
25,730,908.703,465,589.732,261,325.913156.30836.76
35,714,642.463,452,225.732,257,681.683415.171319.88
Disclaimer/Publisher’s Note: The statements, opinions and data contained in all publications are solely those of the individual author(s) and contributor(s) and not of MDPI and/or the editor(s). MDPI and/or the editor(s) disclaim responsibility for any injury to people or property resulting from any ideas, methods, instructions or products referred to in the content.