Article

Experimental Study on Wide-Graded Soil Transport in Unsteady Flow

1
Diagnostic Technology on Health of Hydraulic Structures Engineering Research Center, Chongqing Education Commission of China, Chongqing Jiaotong University, Chongqing 400074, China
2
Qinghai Water Resources and Hydropower Survey, Planning, Design and Research Institute Co., Ltd., Xining 810001, China
3
Geotechnical Engineering Department, Nanjing Hydraulic Research Institute, Nanjing 210029, China
*
Author to whom correspondence should be addressed.
Processes 2023, 11(7), 1965; https://doi.org/10.3390/pr11071965
Submission received: 29 May 2023 / Revised: 25 June 2023 / Accepted: 27 June 2023 / Published: 29 June 2023

Abstract

:
A special study on the interaction mechanism between flow and soil is of great significance for revealing the macro breaching mechanism of barrier dams. To study the scouring characteristics of wide-graded sediment under different flow conditions, flume scour tests were conducted regarding the grading curve of dam material and the discharge process of the Tangjiashan barrier dam. The results show that: (1) The scouring process of narrow-graded or uniform sediments is the formation and movement of the sand wave, while the scouring mode of wide-graded sediment is mainly the formation, expansion, and movement of the scouring pit. (2) Under the condition of weak unsteady flow, the surrounding and shielding effect of coarse particles on fine particles is obvious, and the erosion resistance of the material is strong. However, under the condition of strong unsteady flow, the erosion resistance is weak. (3) The erosion of wide-graded sediment is mainly caused by slope angle collapse at the initial stage, and mainly reflected by traceable erosion at the later stage. Therefore, in the initial stage of erosion, the downstream erosion intensity is high, and the bed surface can easily form a slope inclined downstream. (4) The scouring intensity under the condition of unsteady flow is greater than that under the condition of steady flow. The sediment transport formula based on the condition of steady flow cannot be used to calculate the dam break process directly.

1. Introduction

Barrier dam failure is a typical scenario of wide-graded sediment transport under strong unsteady flow. The water system in Southwest China is highly developed, with most mountains and hills and large slope areas, and frequent has geological disasters such as landslides and collapses. Once the slip body gushes into the river, it is easy to form barrier dams, which usually have short life spans. According to the statistics, most barrier dams fail within one year [1]. Once the dam breaks, it will bring serious flood disasters and seriously threaten residents downstream [2].
For barrier dam failure, scholars have conducted a series of research works, mainly involving the formation process of barrier dams [3,4,5], failure mechanism based on experiments [6,7,8,9], and numerical simulation methods for the dam failure process [10,11,12,13]. In fact, barrier dam and even artificial dam failure are, in terms of microscopic mechanisms, the interaction between the dam-break flow and the soil particles at the breach. The overtopping water flows along the downstream slope through the initial breach, and the scouring force acts on the soil particles, which carries some of the dispersed particles or particle clusters to the downstream channel. An inaccurate estimate of local scouring in landslide deposits may cause the rapid and episodic failure of a hazard mitigation structure [14] (Li et al., 2021). Therefore, the continuous expansion of the breach is essentially a process of dam material transport under the action of unsteady overtopping flow.
For the scouring problem of soil particles, scholars have studied soil and sand particles’ starting and transporting laws through a series of experimental tests. As early as the 1910s, Gilbert [15] pioneered the use of flume tests to investigate sediment and bed load movements. Meyer-Peter [16] designed a systematic flume scour test for each influencing factor and derived a sediment transport rate equation based on the test data results. Mason [17] studied the erosion of scour holes caused by free-trajectory jets, and presented formulae for calculating the probable depths of erosion under free jets. Based on experimental results, Jing [18] investigated the non-equilibrium transport of suspended sediment from one equilibrium state to another, and developed a numerical model for flow with suspended sediment by considering the effect of concentration-dependent settling velocity. Khosravi [19] studied the mobility of non-uniform sediment mixtures resulting from dam break flows and how these differ from uniform-sized sediment. Then, a large number of scholars have studied the aspects of mechanics, energy balance, statistical theory, and macro motion law of sediment particles, and a series of formulas for calculating bed load transport rate are developed, such as the Bagnold formula [20], the Einstein formula [21], the Han Qiwei formula [22], etc.
For the law of transport movement of non-uniform sand, most of the early studies applied the starting law of uniform sand to different grain sizes of non-uniform sand to obtain parameters such as group starting flow rate and sand transport rate [23]. Jin [24] studied the starting law of non-uniform sand in different stages through flume tests, and based on the principle of minimum energy dissipation, three modes of sand starting and the corresponding incipient velocity equation were developed. Xu [25] analyzed the effect of flow intensity and bed sand compositions on the transport rate of continuous and discontinuous bed sand through water flume tests, and studied the relationship between relative flow intensity and bed load sediment transport rate. Through flume tests, Wang [26] studied the incipient and scouring characteristics of uniform, continuous, and discontinuous non-uniform sand. Taking the discontinuous bed sand as an example, Wei [27] conducted an experimental study on the vertical velocity structure of the bed surface and found that there was an S-shaped turning near the bottom of the discontinuous bed surface, and that the position was related to the flow intensity and bed shape. Xu [28] studied the effect of mud density on the sediment initiation pattern of fully disturbed coastal sediment in the South China Sea estuary through model tests. Mohamed [29], on the basis of the sand transport mechanism revealed by model tests and data regression analysis, established a non-uniform sediment bed load model considering the sediment carrying density. Pilarczyk [30] studied the protection of the seabed from erosion caused by the increased speed of the currents. Based on a case study in the Ansai Area (China), Xu [31] studied the internal erosion damage process and the failure models of loess stacked dams. Faraci [32] investigated the hydrodynamic effects of an orthogonal regular wave on a current propagating over a sandy and gravelly rough bed.
As stated above, scholars have gained much valuable experience in soil and sand erosion characteristics, and many scholars started to explore the law of non-uniform sand incipient and transport through model tests. However, most of these studies focus on the scouring of river sediment, and the test conditions are very different from the typical cases of barrier dam failure, such as the width of sediment gradation. The particle size difference of the research object in the flume test is often small, generally less than four orders of magnitude [33]. However, the materials of barrier dams have a wide grading range from cohesive particles less than 0.075 mm to boulders with a diameter of several meters [34]. Furthermore, the current flow conditions of the tests are quite different from the dam break flow [35]. In summary, the research results above are of great significance for the study of a dam break, but they cannot be used directly, and there are few soil erosion tests specifically carried out for the overtopping of barrier dam break.
Since barrier dam failures are the interaction process between the dam-break flow and the soil particles at the breach in terms of microscopic mechanism, by simulating the flow conditions of dam break overtopping, a flume test was carried out to analyze the wide-graded total-load sediment transport, which could provide references for research on the failure mechanism of barrier dams.

2. Experimental Apparatus and Methods

2.1. Unsteady Flow Scouring Experimental System

The unsteady flow sand transport test system consists of a test flume, inlet flow control system, hydraulic element measurement system, and sand transport measurement system. The details are as follows:
(1)
Test flume
The effective length, width, and height inside the flume are 600 cm, 25 cm, and 25 cm, respectively. The bottom slope angle of the flume is 5.5‰. The glass beads at the inlet position have the function of energy dissipation and anti-scour. Other settings of the flume are shown in Figure 1.
(2)
Inlet flow control system
The inflow control system consists of an electromagnetic flowmeter, direct-stroke electric control valve, electric actuator, and industrial control computer. Before the test, the flow control system is calibrated. During the test, by inputting the flow process curve in time-sharing steps in the industrial computer, the unsteady flow that meets the requirements of the test conditions can be output in the forebay at the inlet of the water tank.
(3)
Hydraulic element measurement system
Three automated water level meters and high-speed cameras comprise the hydraulic measuring system. Water level meters can detect the process of water level change in real-time, identify sediment particles, and determine the composition of moving sediment particles using threshold segmentation processing of sediment grayscale pictures.
(4)
Sand transport measurement system
The sand transfer measurement system consists of a sand collecting funnel, a sand collection tank, and an electronic balance. The soil and sand particles that transferred downstream during the test are collected by the sand catching funnel and the sand collection tank and are weighed by electronic balance. Thus, the specific gravity of soil particles washed away by water flow can be calculated, and the erosion resistance of soil can be further judged.
During the test, the sand laying section was 200 cm long, with a thickness of 7.5 cm and a slope ratio of 1:1 upstream and downstream. The sand laying section was 180 cm from the water inlet of the flume and 130 cm from the tailgate. The test flume arrangement is shown in Figure 1.

2.2. Test Condition

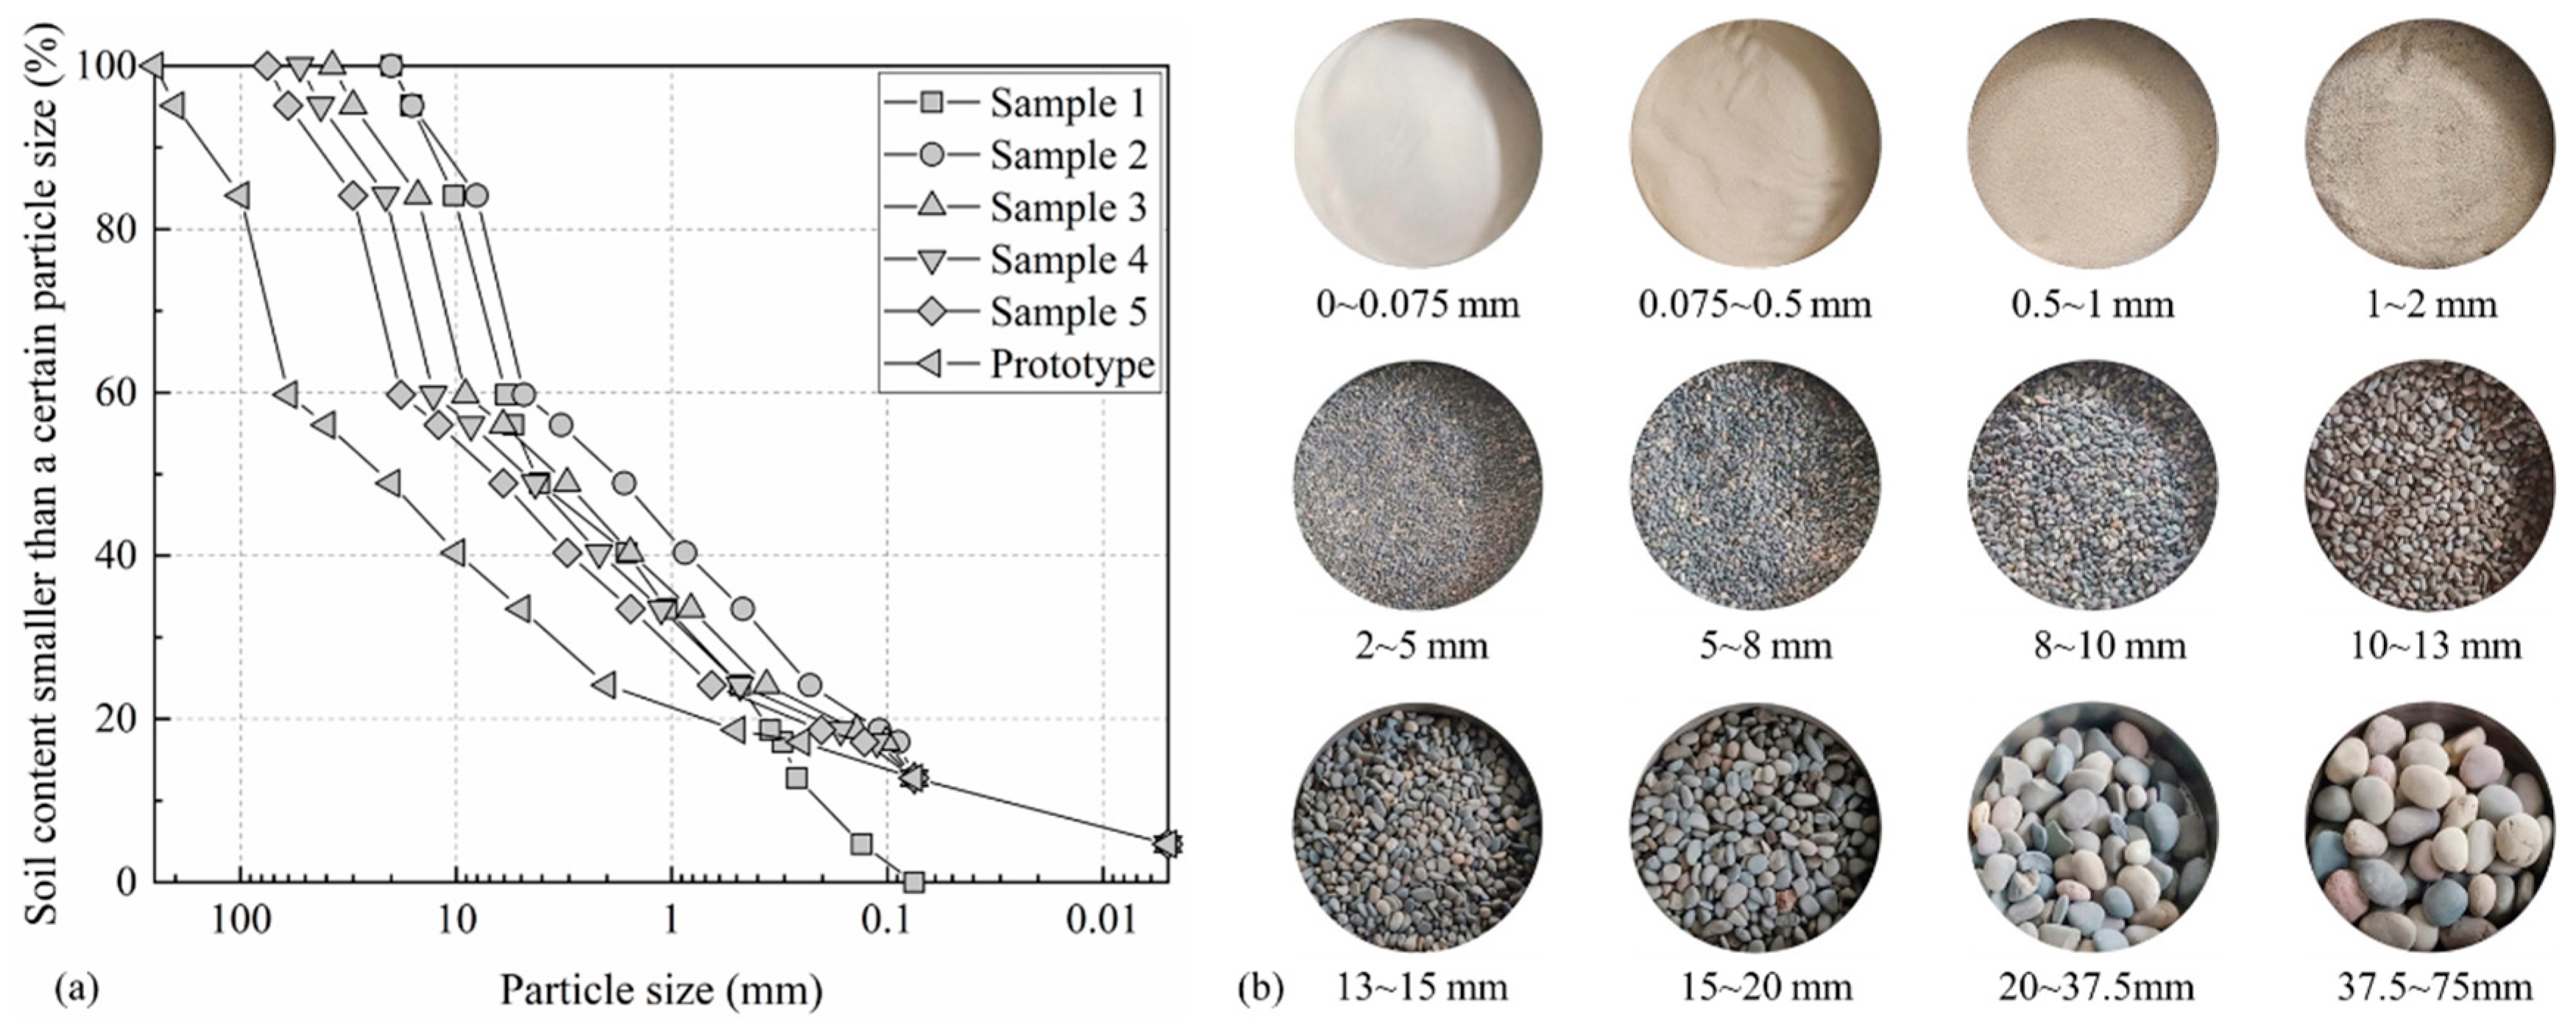
Six groups of soil and rock materials were designed for the test, including five groups of non-uniform sand and one group of uniform sand. In the selection of non-uniform soil and sand material gradation, the wide gradation characteristics of the dam material of the barrier dam were focused on, and the dam material gradation obtained from nine boreholes of the Tangjiashan barrier dam was referred to [36]. To ensure that the soil properties remain unchanged, the equivalent substitution method was adopted for particle size reduction, which involved using the non-cohesive particles smaller than the control size to proportionally replace the non-cohesive particles larger than the control size, while keeping the content of cohesive particles unchanged. In this study, the control sizes, which are the largest particles size in the flume, were determined to be 20 mm, 37.5 mm, 53 mm, and 75 mm, respectively, according to the effective internal dimensions of the flume, and the clay content was kept constant to obtain 1#~4# non-uniform sand specimen particle gradation. In addition, based on 1# non-uniform sand gradation, the maximum particle size was controlled, and the cohesive particles were replaced with non-cohesive sand parts in equal amounts to obtain a non-cohesive sand sample (5# non-uniform sand) as the control group to analyze the influence of cohesive particles in soil and sand material on the transport pattern of sediments. The 6# uniform sand was selected as the average particle size with the median particle size d50 (5 mm) of 3# non-uniform sand, and natural uniform gravel was selected as the test sand sample. The gradation curves of the samples and the prototype dam material are shown in Figure 2, which also shows the samples of each grain group after the screening. After determining the content of each particle group according to the grading curve, we laid the test sand in the flume according to the dry density of 1.59 g/cm3.
In this paper, the research focuses on soil erosion under unsteady flow, so the experimental flow needs to meet the similarity criterion of unsteady flow. If the prototype and model are to conform to unsteady flow similarity, their respective Strouhal numbers must be equal. In the unsteady flow, acceleration u t is not equal to 0, and because of the ratio of the inertial force generated by this acceleration to the time-varying acceleration, the unsteady flow similarity criterion can be obtained as follows:
λ u λ t λ l = 1
in which, λ u is the velocity scale, λ t is the time scale and λ l is the geometric scale. Since the fluid used in the test in this paper is the same as that in the prototype, and the difference between the temperature during the test and the prototype is ignored, there is λ μ = λ ν = 1 , and then λ u λ l = 1 . From this, it can be obtained that the speed scale and the time scale are λ u = 1 / λ l and λ t = λ l 2 , respectively, and thus Equation (1) is satisfied, which means that the Strouhal number of the prototype and the model are equal.
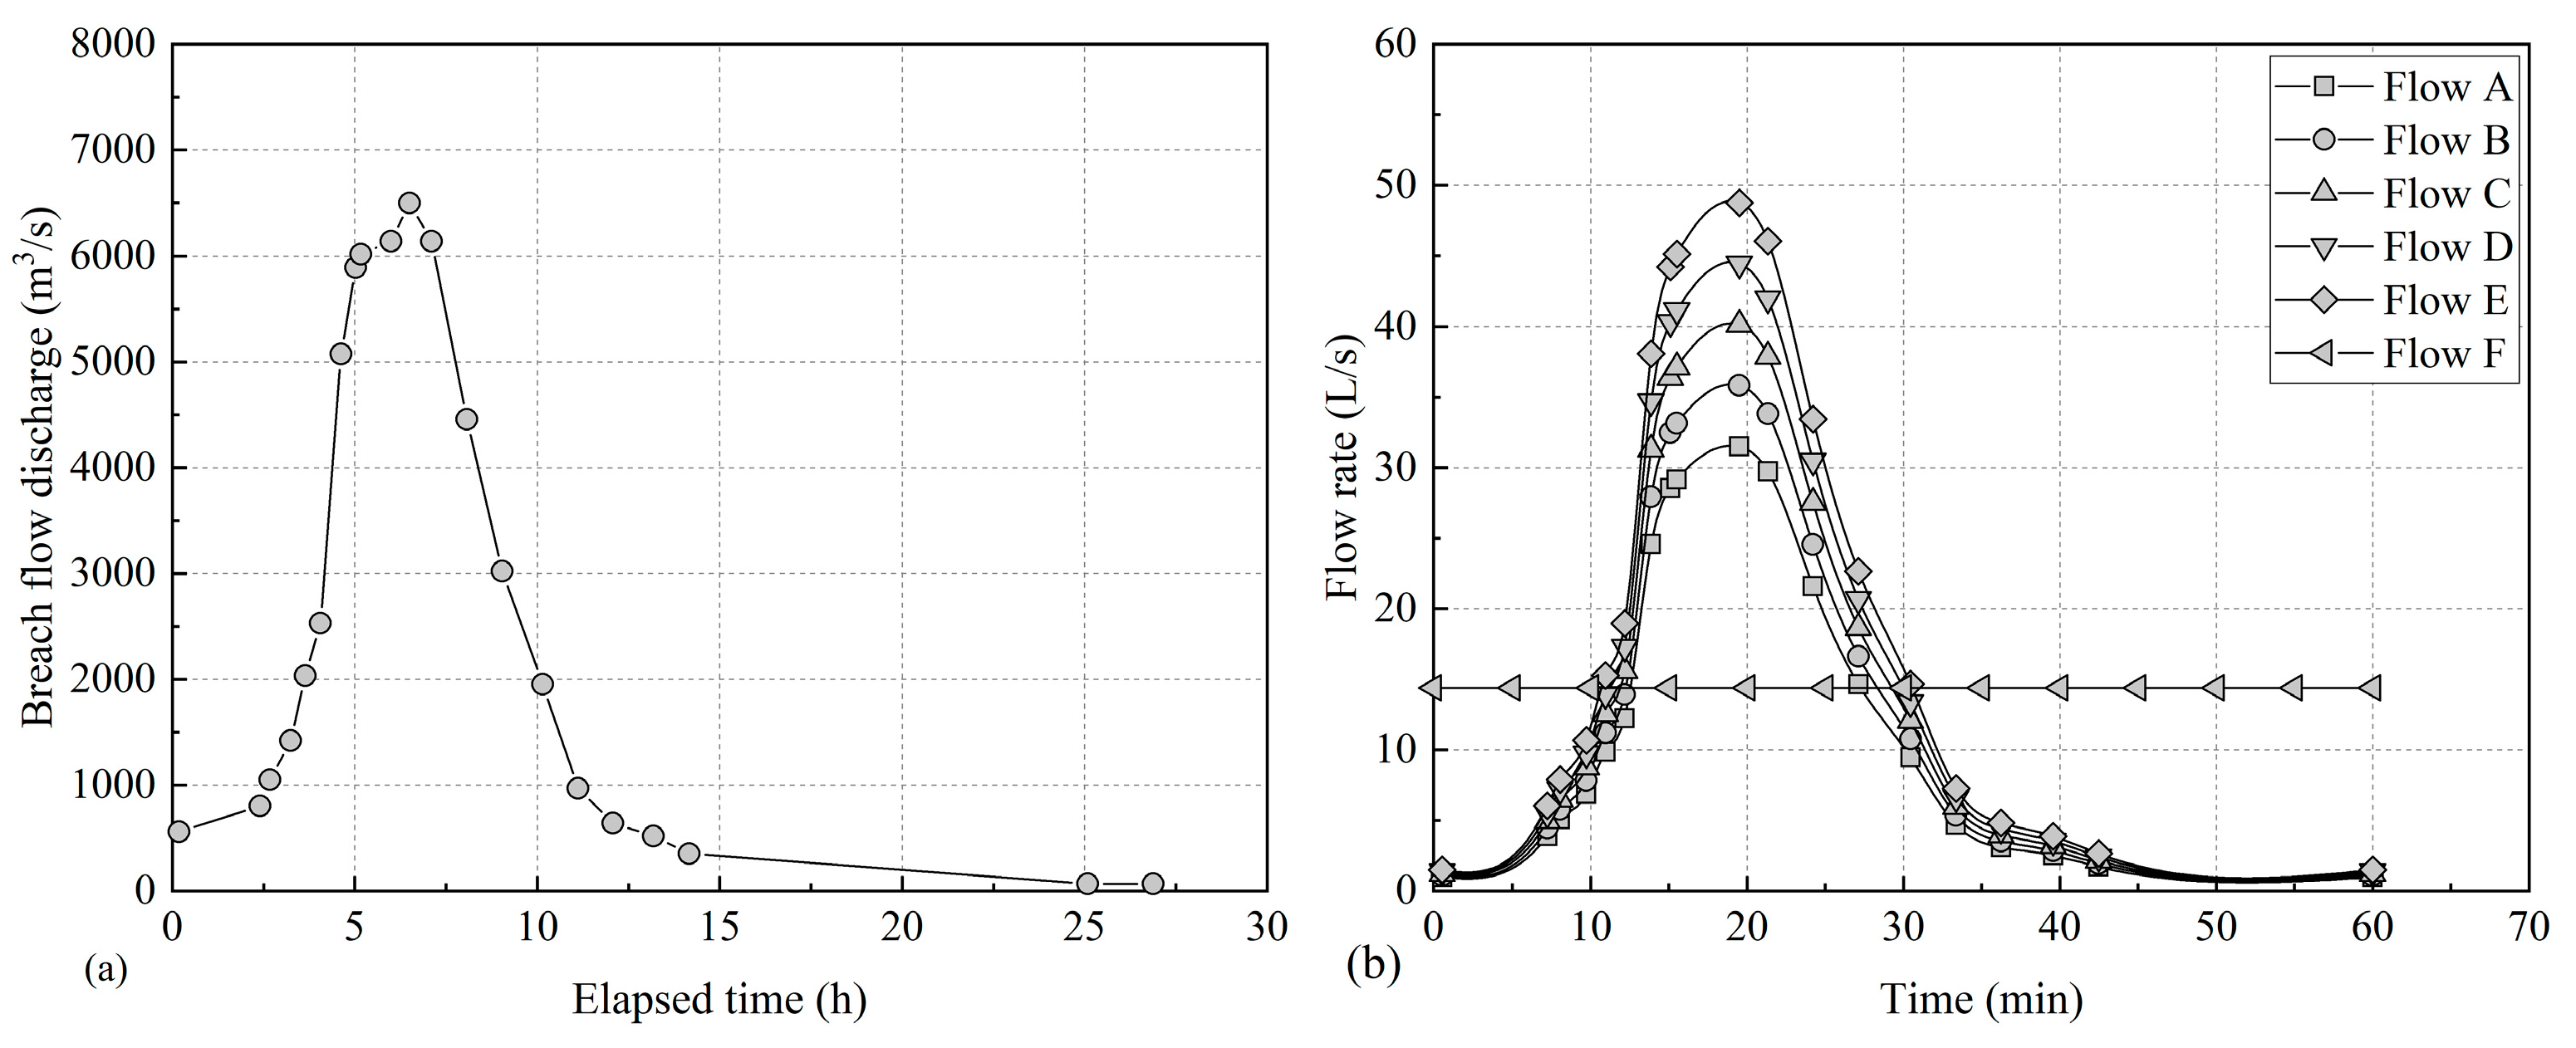
According to the particle gradation of the residual dam body after the discharge of the Tangjiashan barrier dam, the maximum starting particle size of the test soil and sand material is determined to be d70, according to the data of 1# test sand d70, the incipient velocity of sediment is calculated using the formula developed by Zhang [37], and the maximum flow rate of Flow A is determined to be 31.5 L/s by combining this with the calibration results of water level and flow previously. Keeping the unsteady characteristics of the flow, based on the discharge process data of the Tangjiashan barrier dam (as shown in Figure 3), the flow peak was scaled to obtain the flow process curve of Flow A.
In addition, four groups of maximum control flow rates of 35.8 L/s, 40.1 L/s, 44.4 L/s, and 48.8 L/s were added, and the same scaling process was used to obtain flow process curves of B, C, D, and E as shown in Figure 3. Additionally, the average flow of Flow E was selected as the input flow rate of steady Flow F in the control group.
The non-constant intensity of the scouring water flow used in this test can be calculated according to the dimensionless non-constant intensity parameter calculation method (Equation (2)) proposed by Ma [38] as shown in Table 1.
P = 1000 B T r Q p Q b h p h b T r 2 Q p Q b 0 Q p = Q b
where P is the dimensionless non-constant intensity parameter, B is the flume width, Tr is the unsteady flow up period calendar time, Qp is the peak flow rate, Qb is the base flow rate, hp is the peak flow water depth, hb is the base flow water depth.
During the test, the tailgate downstream of the flume was opened to maintain an open drainage state to prevent the formation of reflected waves from the tailgate grate backwater from affecting the incoming hydraulic elements. During the test, the bed particle movement images were continuously collected, and the sand transport values were monitored for the soil and rock scouring process. After each group of tests, the sediment in the sand collecting tank was dried, sieved, and weighed to obtain the gradation curves of the scouring sediments.
In addition, it should be noted that the Tangjiashan barrier dam draining process has not been simulated in this test, but is a reference to the actual conditions in terms of the selection of flow processes and materials for the test.

3. Characteristics of Sediment Transport Movement in Unsteady Flow

3.1. Wide-Graded Sediment Scouring and Transport Process

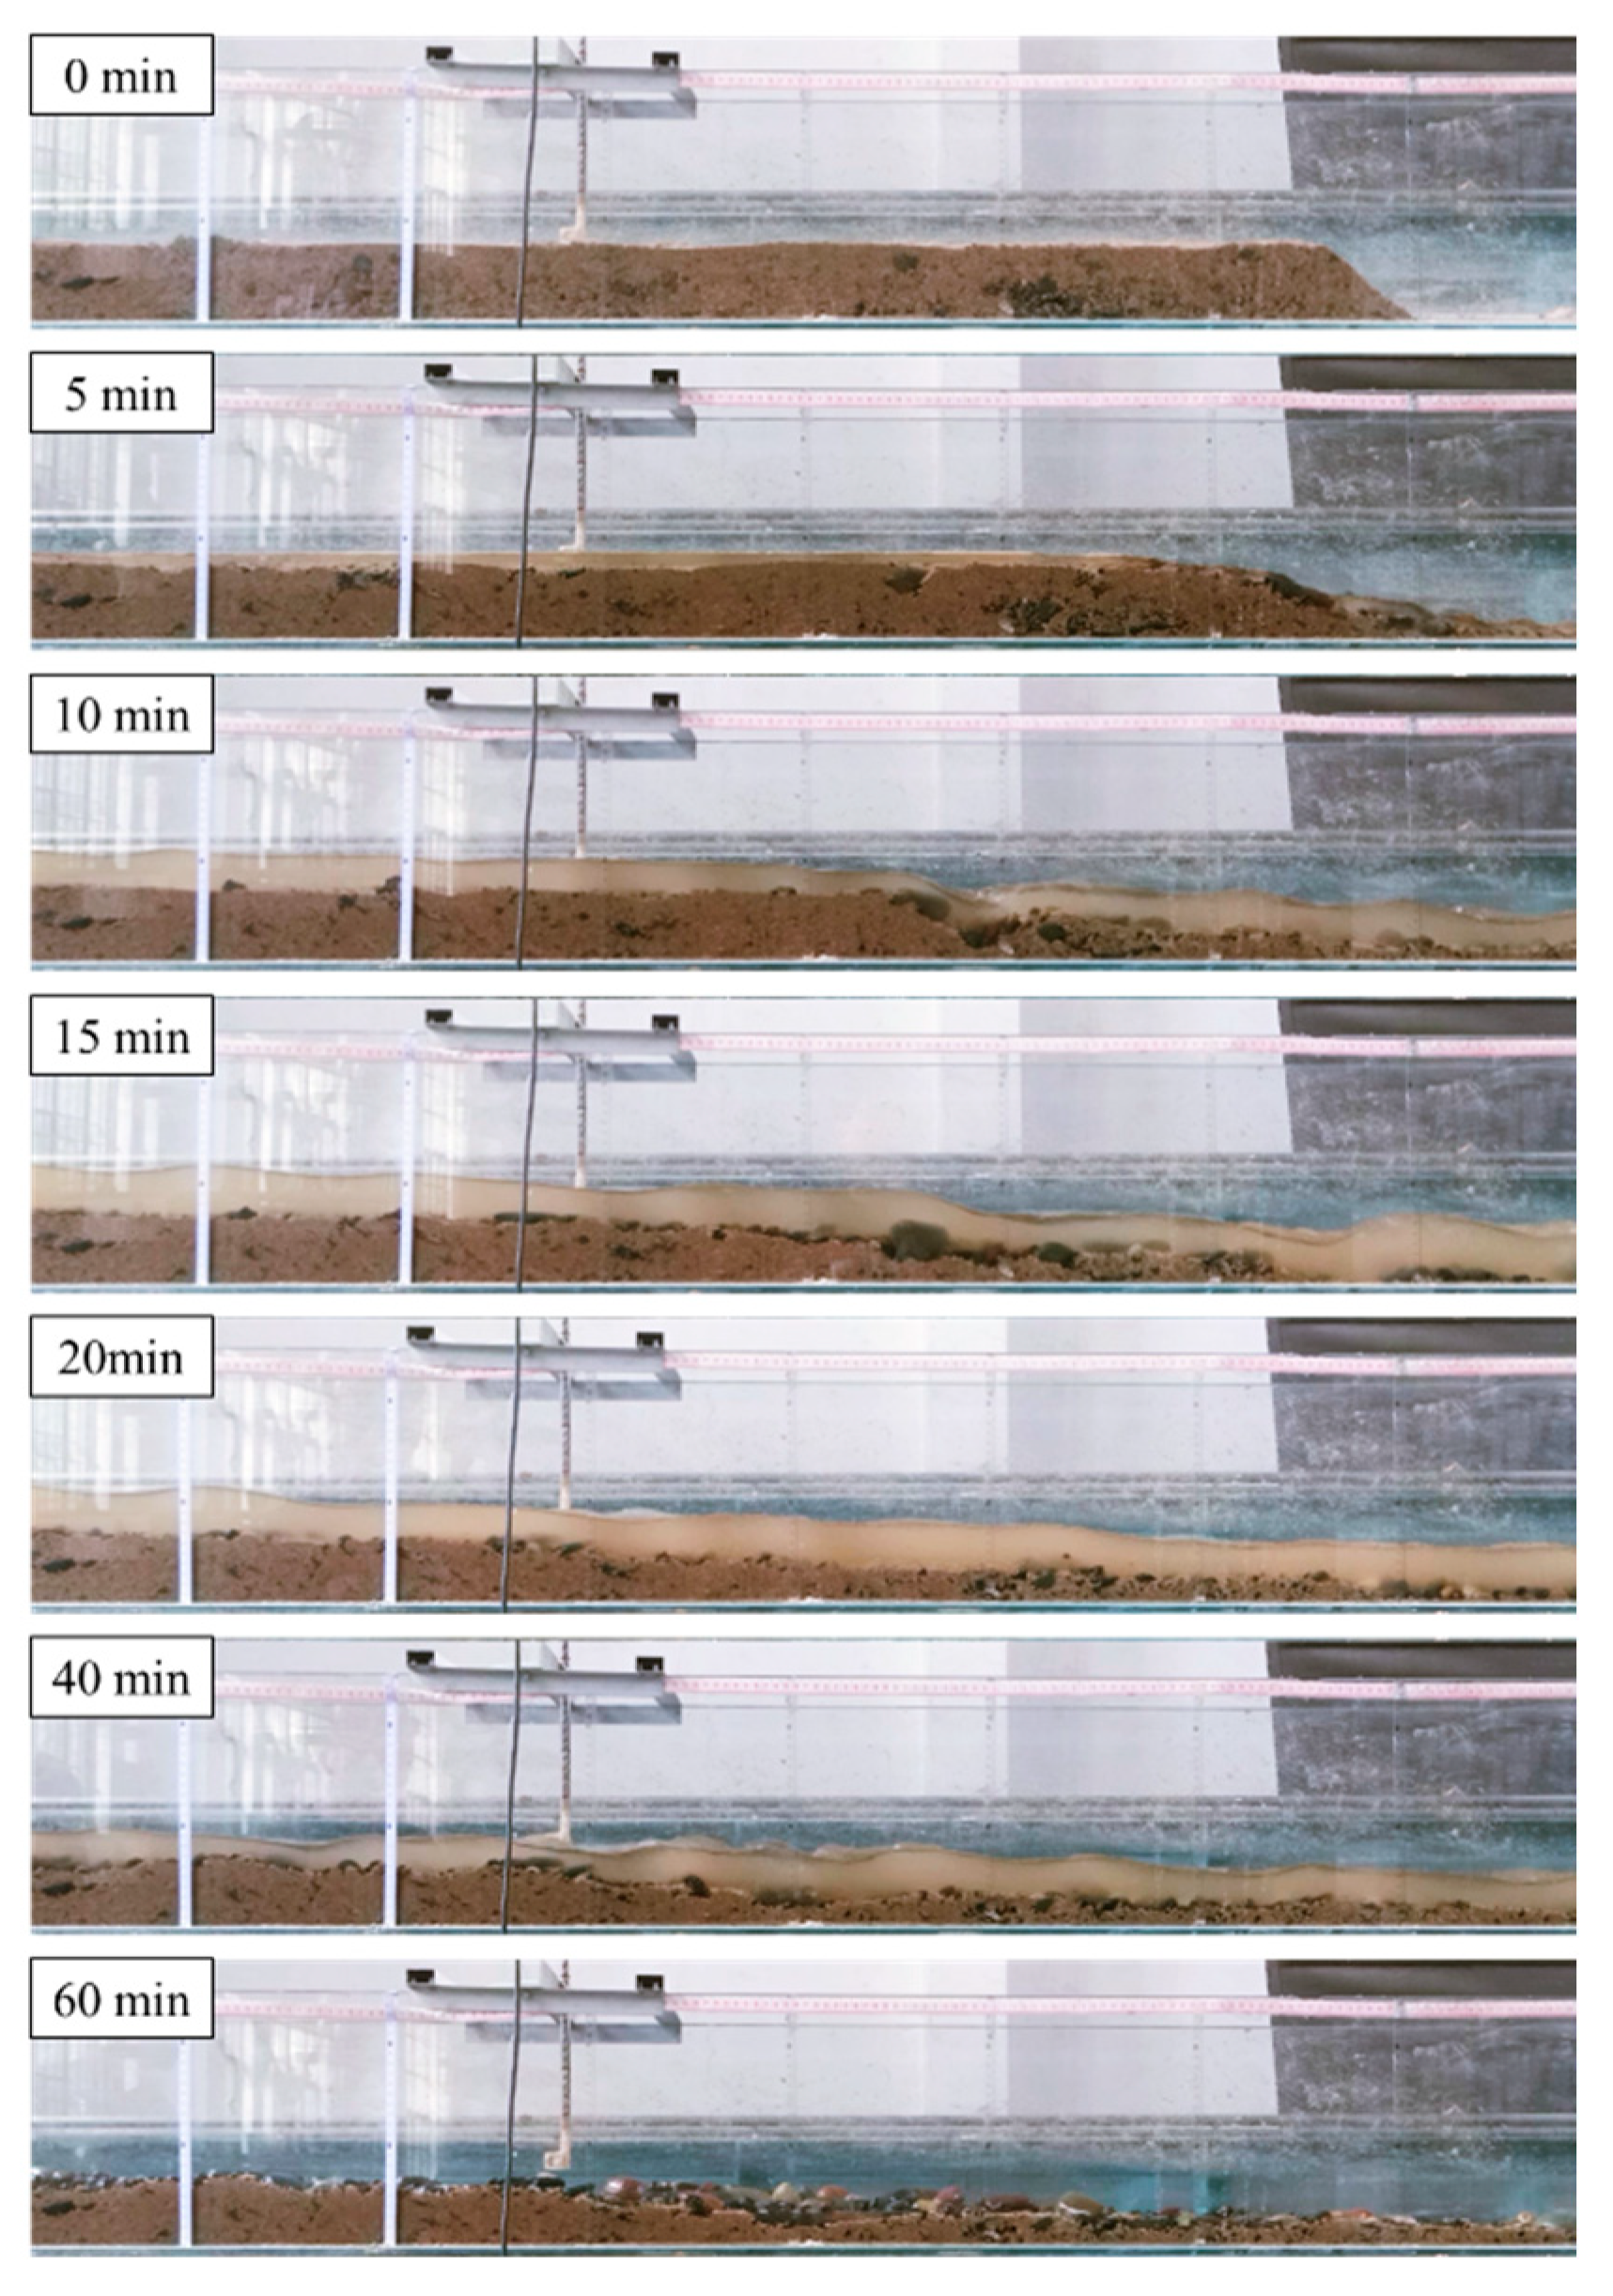
We selected Sample 4# and Flow A to carry out the scouring test. The high-speed camera on the side of the flume collected the real-time images of the sediment scouring transport process. We took the moment that the water level of the front pool rises to the top of the sediment in the sand-laying section as the zero time when the scouring begins. We intercepted the scouring process images at different times thereafter, and the scouring development process of wide-graded sediment was obtained as shown in Figure 4.
From this scouring process, it was found that at the beginning, there was a water drop after the flow entered the sand laying section, and the fine particles on the surface layer were carried and transported downstream by the flow. The surface layer of the bed was coarsened rapidly. After the scouring, water flooded the whole sand laying section, the downstream end could not maintain the original slope, and then collapsed, forming a 13.3° slope angle and maintained stability for a short time. Within 5 min from the beginning of the scouring, the flow rate increased from 0 to 2.7 L/s, and the surface layer of fine grains (<1 mm) on the bed surface was continuously scoured downstream. The soil and sand material with a particle size of 0.5~1 mm near the end of the sand laying section moved downstream in the form of sliding or rolling under the action of scouring. After moving a distance, they fell back to the riverbed surface and were deposited downstream of the flume. After scouring begins, the flow rate was 2.7~7.2 L/s for 10 min, and the average Fourier number was 3.74, which shows the rapid flow state. The surface particle group (<13 mm) in the sand laying section started to move, in which the movement form of the particle group with a particle size of 8~13 mm was mainly rolling, causing the bed surface to be further coarsened, and the elevation of the sand laying section remained unchanged. At this stage, the gravel with particle size larger than 37.5 mm on the bed surface was gradually exposed. Due to the shielding effect of large-size gravel, the scouring intensity of the upstream was low, and some fine particles from the upstream were deposited here, forming a reverse swirl in the downstream direction of the gravel, which had a strong scouring effect on the soil and sand. The flow rate further increased 15 min later (7.2~28.4 L/s), and the average Fourier number was 3.77 in this period. The large-size gravel (15~20 mm) moved after the downstream fine-grained soil was continuously washed, resulting in the change of the shielding relationship of the soil upstream. The original fine-grained gravel moved immediately and was transported downstream, with the movement form of leaping. After 20 min, the water flow reached the peak of 31.1 L/s, and the average Fourier number was 3.78. In this stage, the sediment on the bed surface was mainly a jump load. After rising away from the bed surface, the sediment met the high-speed water flow and was carried forward. Only some coarse particles (20~37.5 mm) were still moving along the bed surface in the form of sliding or rolling. In this stage, the large-size gravel moved abruptly and stoped after a certain distance, and the movement form is mainly sliding. Twenty-five minutes later, the fine particles at the bed surface were further eroded, and coarse particles with particle sizes larger than 37.5 mm failed to move in this stage. The bed coarsening speed slowed down, and the bedform was obviously affected by the distribution of coarse particles.

3.2. Uniform sand Scouring and Transport Process

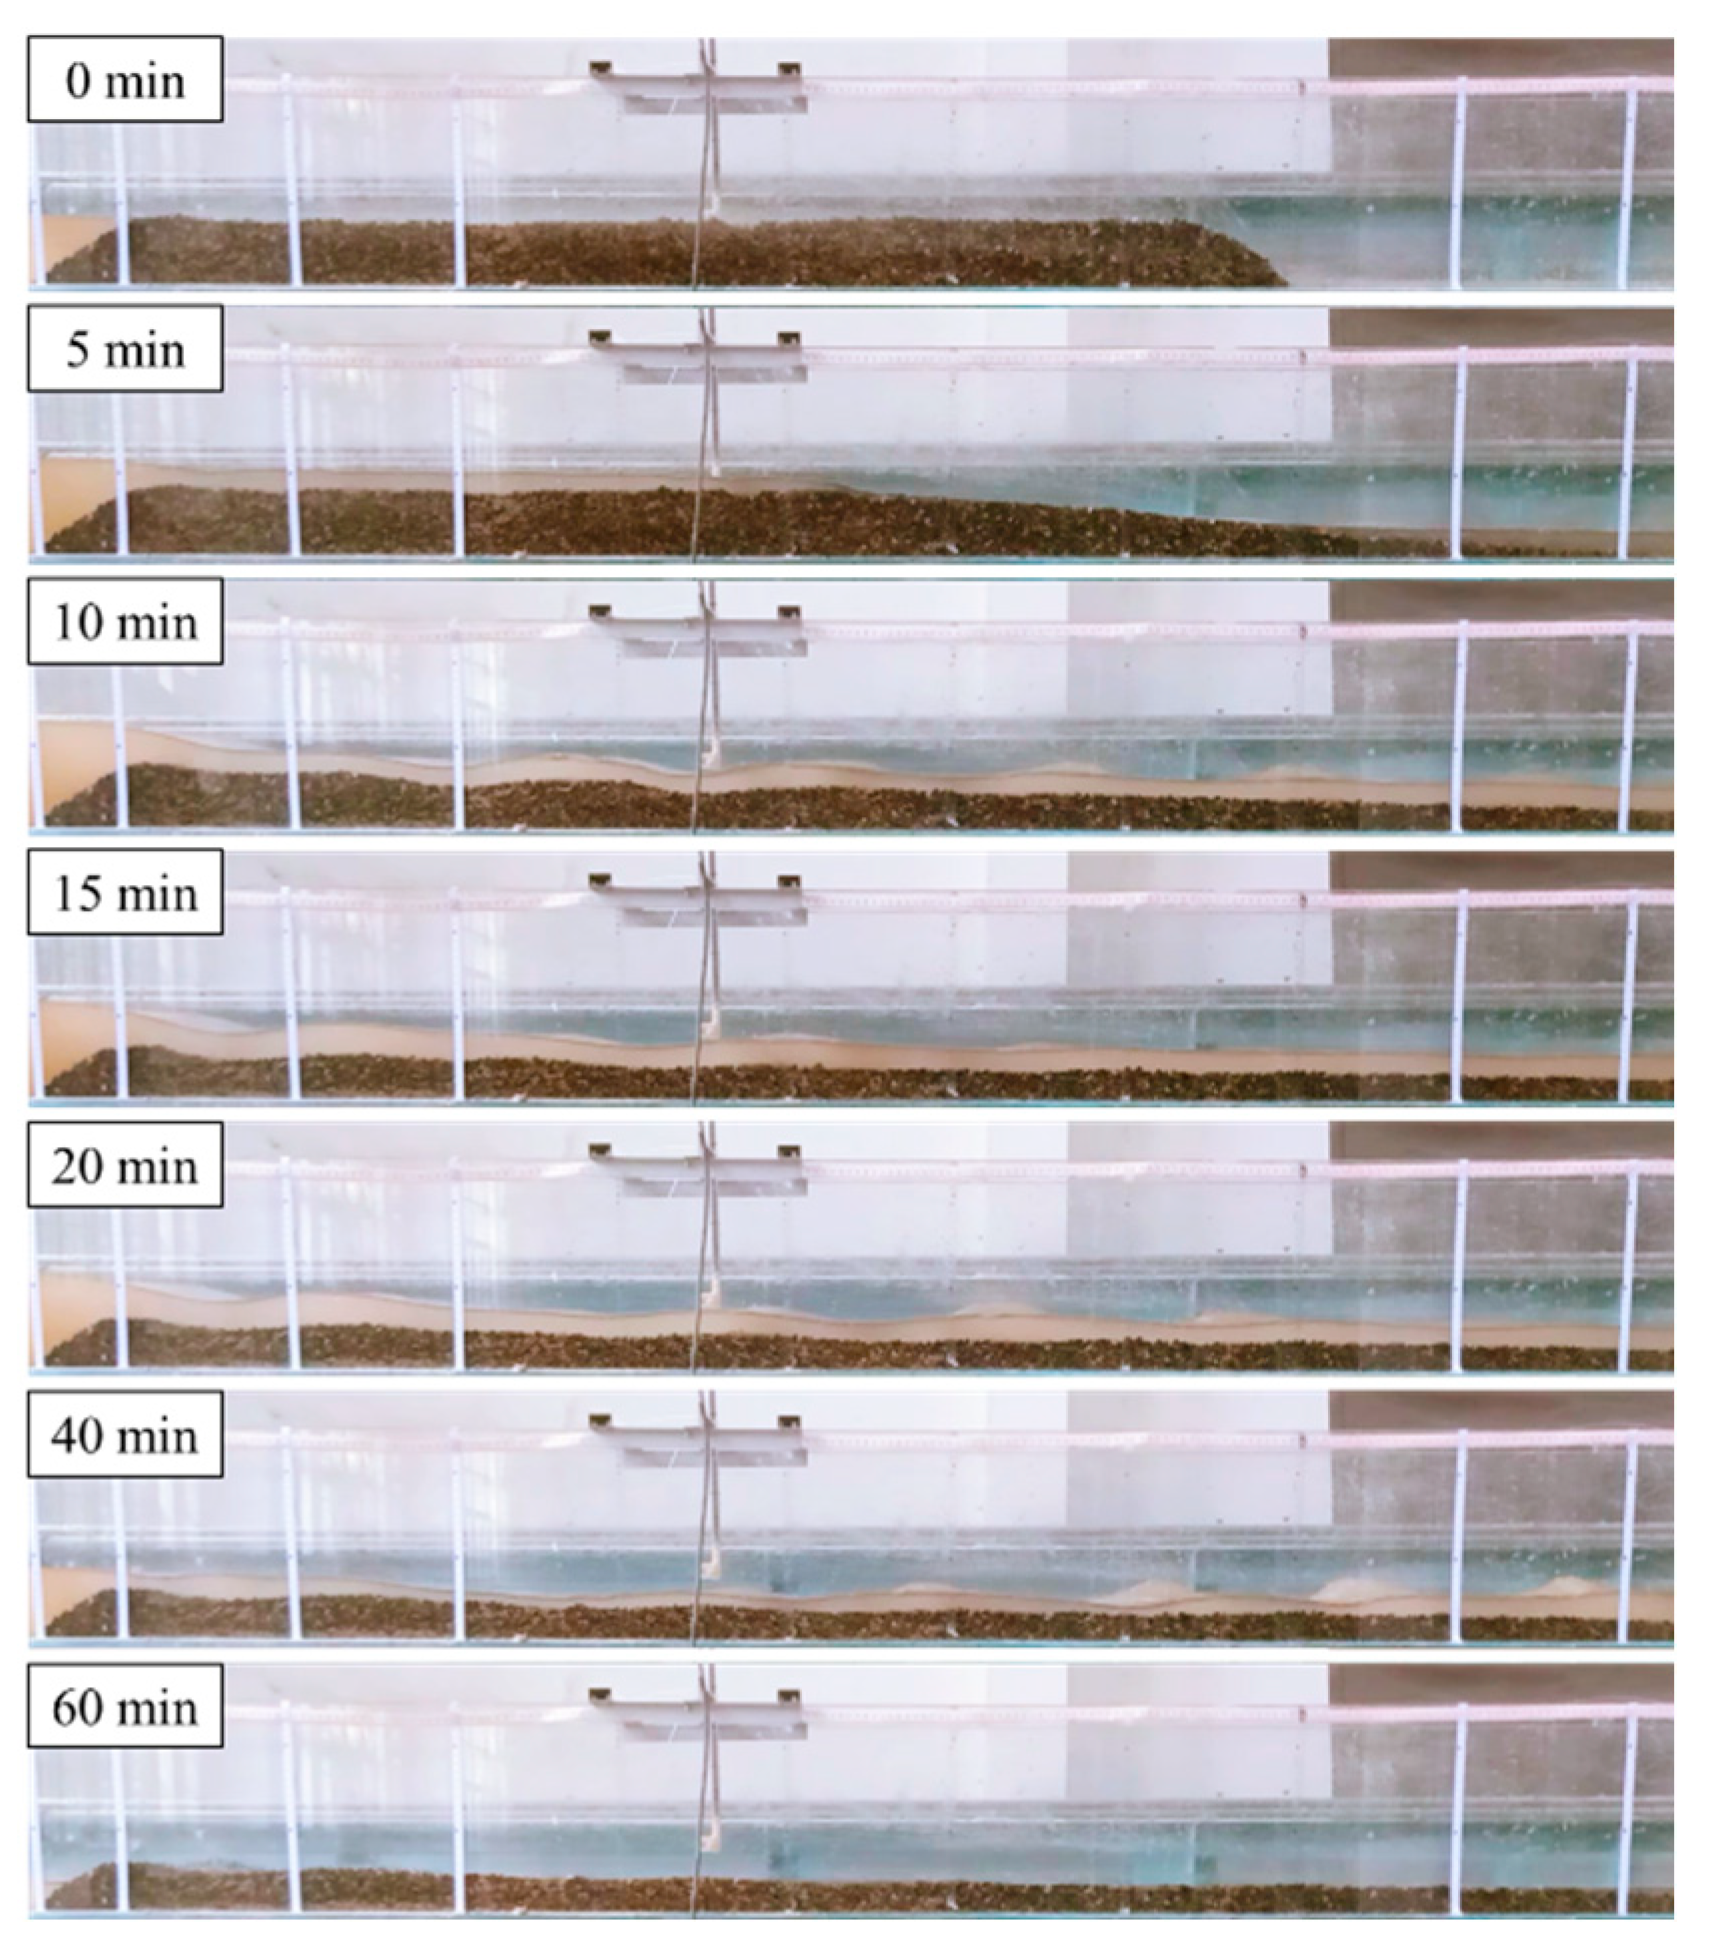
Sample 6# and Flow A were selected to conduct the scouring tests. During the tests, images and videos were continuously collected on the side of the flume in real time. Due to the strong permeability of uniform sand, a phreatic line with a stable dip angle (4.4°) was formed in the sand laying section after the water supply, developing from upstream to downstream. Therefore, the seepage flow in the sand laying section reached the downstream slope before the overtopping flow. We selected the time when the seepage flow reached the downstream slope to start timing, the uniform sand scouring development process could be obtained as shown in Figure 5.
From the scouring process, it was found that there was water falling after the flow brimmed over the sand laying section. At the downstream slope, the soil particles were washed away and stripped from the original position, moving along the bed surface in the form of sliding or rolling. Within 100 s after the start of scouring, due to the loss of the retaining effect of slope angle, the downstream slope collapsed continuously, forming a slope of 23.6°. In this stage, the water flow gradually increased from 0 to 2.0 L/s, and the bed resistance in the sand laying section was large. The soil particles at the bed surface could not start, and the development process was mainly scouring and continuous collapse of the downstream slope. Then, the source tracing scouring occurred in the sand laying section. The scouring process developed upstream along with the surface layer and further reduced the downstream slope angle of the sand laying section. When the slope angle was reduced to 2.8°, a sand ridge began to form on the bed surface. The wavelength of the sand ridge was 19.6 cm. The sand ridge slope angle of the downstream surface was slightly larger than the upstream surface due to the push of the vortex. After 10 min, the peak flow reached 7.2 L/s. At this time, the bed surface formed symmetrical standing waves, which have a wavelength of 23.1 cm. About 15 min later, a retrograde sand wave was formed on the bed surface, and the sand wave moves upstream at a speed of 0.87 cm/s. After 20 min, the water flow reached its peak. The bed surface was further brushed, with a gradual decrease in height. Then, the sand wave disappeared. The movement process of sand waves is shown in Figure 6.

4. Influence of Sediment Grading Width on the Scouring Process

4.1. Scouring Amount

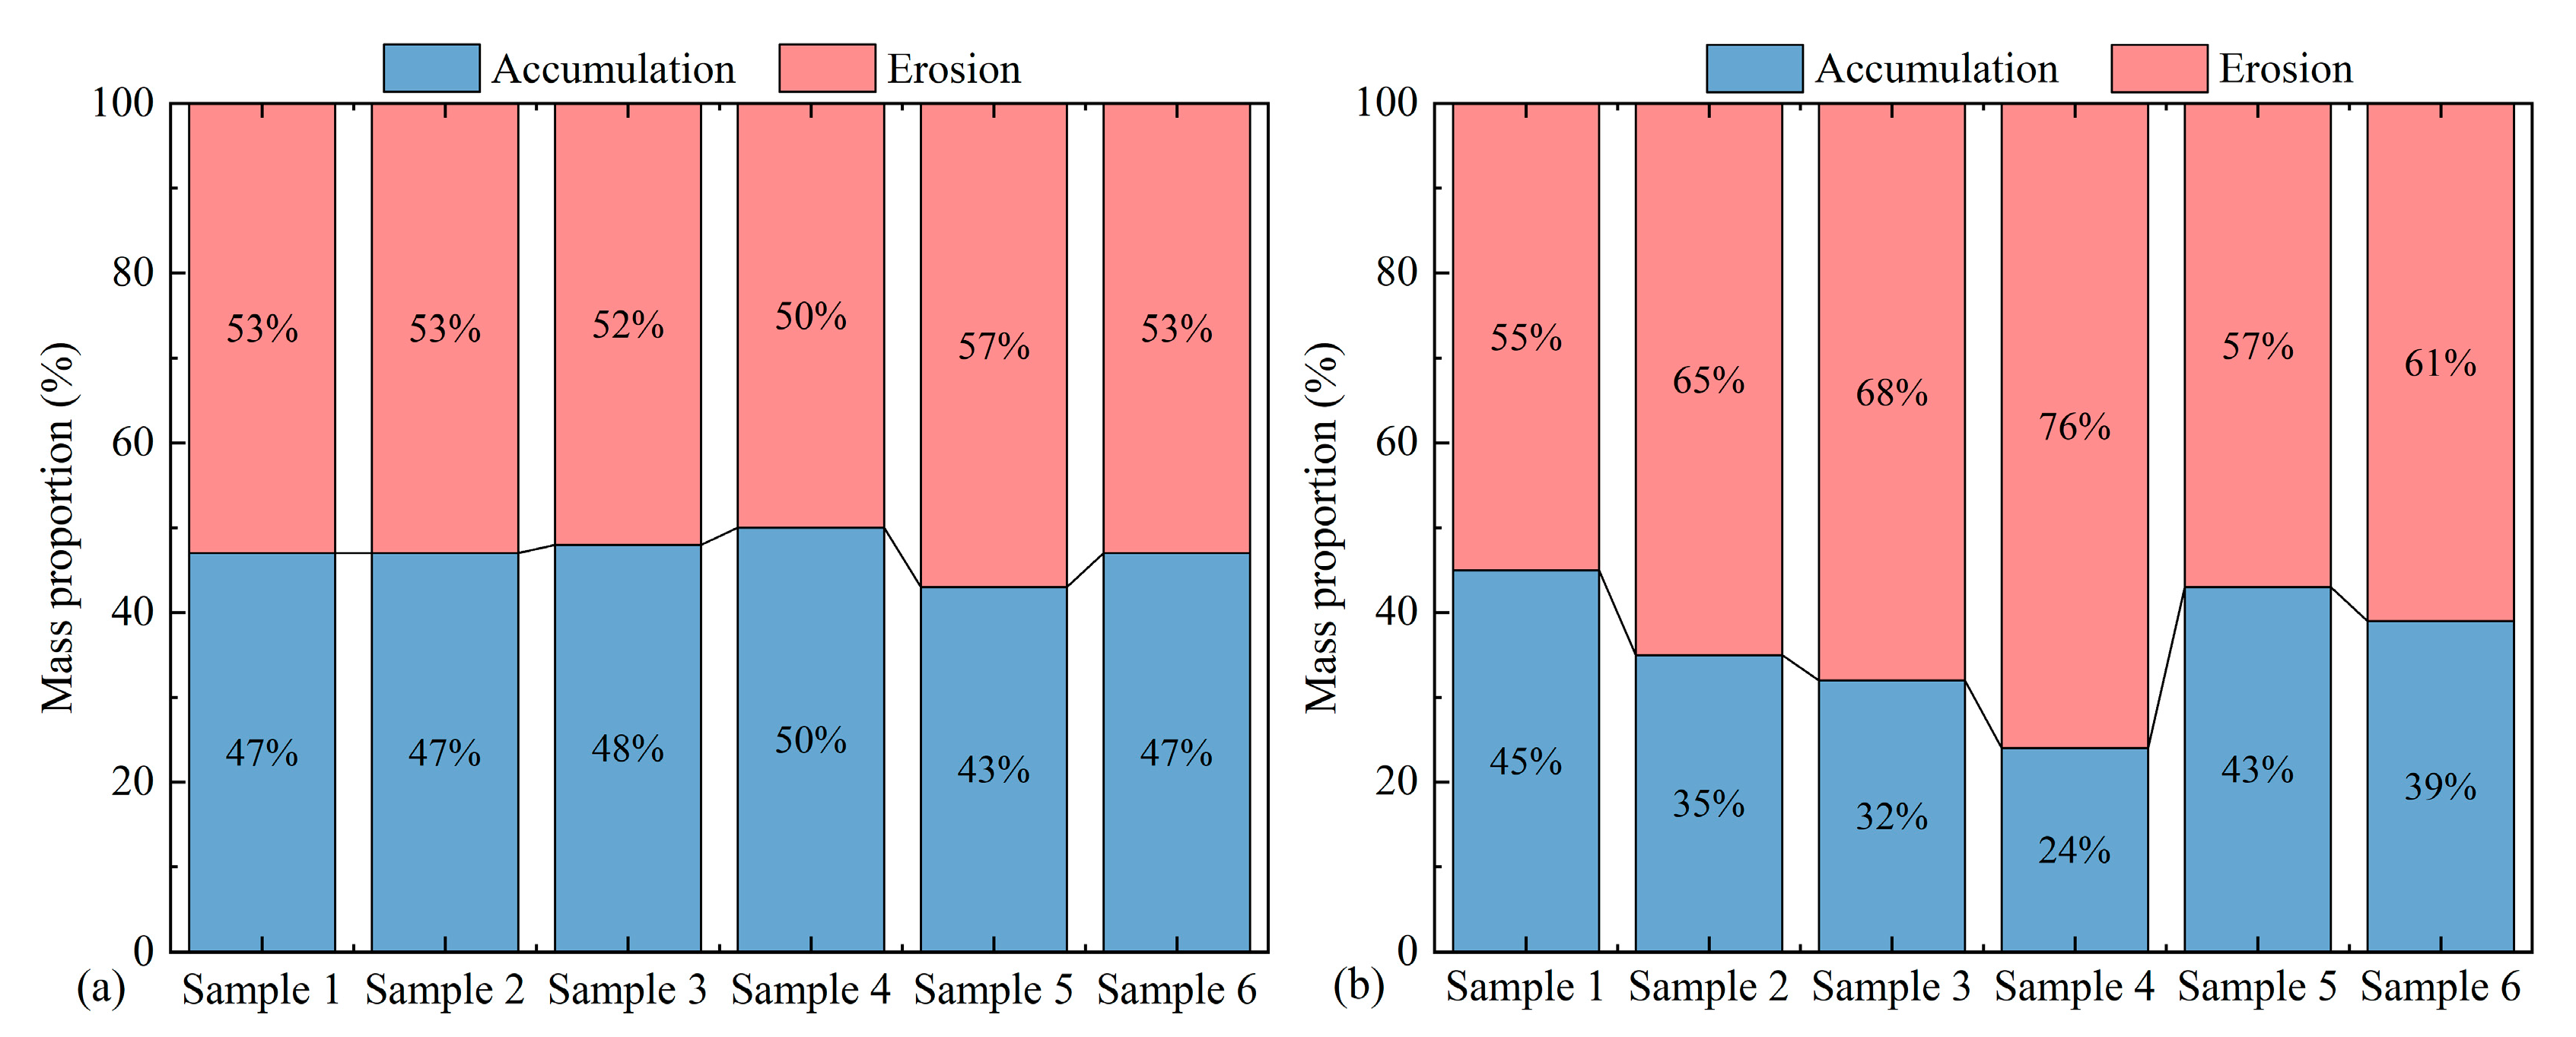
Flows A and E, and Samples 1#~6# were selected to conduct scouring tests, respectively. Three groups of parallel tests were carried out under each working condition. After the tests, the soil and sand in the collection tank were dried and weighed. The scouring amounts of each particle group under two flow conditions were obtained as shown in Figure 7.
For different non-constant strengths of water flow, the scouring strength of soil containing clay particles (Sample 1#) was slightly higher than that of non-cohesive soil (Sample 5#). For the case of weak unsteady flow, the effect of clay particle content of soil on the scouring rate was relatively obvious, while under the condition of strong unsteady flow, the effect is relatively small. In addition, the influence of grading width of soil on the scouring amount is affected by the unsteady strength of water flow. For example, under the condition of weak unsteady flow scouring, the erosion resistance of soil increases with increasing grading width. However, for strong unsteady flow, with the increase in soil grading width, its erosion resistance decreases, and the erosion rate increases. The reason for this is that the movement of bed particles of wide-graded sediment depends on two effects: one is the shielding and surrounding effect of coarse particles on fine particles, which is not conducive to the starting of bed particles. Second, there were many turbulent vortices on the bed surface of wide-graded sediment, and the turbulence of water flow on the bed surface is conducive to the movement and transportation of soil particles on the bed surface. Therefore, whether the wide-graded bed particles move or not depends on which effect is more dominant. Under the condition of weak unsteady flow, the shielding and surrounding effect of coarse particles on fine particles is dominant, and the particle movement is more difficult. Under the condition of strong unsteady flow, the turbulence intensity of near-bottom flow on the bed surface is high, and the probability of soil particles being taken away from the bed surface and transported downstream is higher.
In addition, the gradation width of soil and rock material is influenced by the non-constant strength of water flow, i.e., under weak unsteady flow scouring conditions, the scouring resistance of soil and rock material increases as the gradation width increases, but for strong unsteady flow, the scouring resistance of soil and rock material decreases as the gradation width increases, and the scouring rate increases instead. Analyzing the reason, the wide-grade bed sediment movement depends on two kinds of roles; one is the shading of fine particles with coarse particles, which surround the fine particles. This role is not conducive to the bed particles movement. Second, the wide-grade sediment material cause more bed turbulence vortex bodies; bed water turbulence is conducive to bed soil particle transport. Therefore, whether the wide-grade sediment material bed particles’ move or not depends on which role is more dominant. Under the weak unsteady flow condition, the shading and encircling effect of coarse particles on fine particles in the wide-graded sediment material is dominant, and it is more difficult for the particles to move, while under the strong unsteady flow condition. The water turbulence near the bottom of the bed is high, and there is a high probability that the soil and rock particles are carried away from the bed and transported to the downstream. Therefore, under the condition of strong unsteady flow, the impact resistance of wide-graded sediment materials is relatively weak. Consequently, under the condition of strong unsteady flow, the anti-scour performance of wide-graded sediment is relatively weak.

4.2. Scouring Soil and Stone Material Grading

Flow E and Samples 1#~5# were selected to conduct the scouring tests, respectively. Three groups of parallel tests are carried out under each working condition. After the tests, the soil in the collection tank was collected, and the gradation of scouring materials under Flow E was obtained as shown in Figure 8.
Soil and stone materials with different grading widths reflect different scouring characteristics under the action of unsteady flow scouring. Based on Figure 8, it can be seen that with the increase in grading width, the scouring material grading curve is more flattened towards the fine particle size than the initial grading curve, which indicates that the coarsening of soil keeps increasing with the increase in grading width. In addition, the content of fine particles in the scouring material increases with the increase in the gradation width, which reveals that under the strong unsteady flow scouring conditions, the fine particles are more likely to be carried out of the bed and scoured downstream with the increase in the gradation width. In other words, under the strong unsteady flow condition, the wide-graded sediment has relatively weak erosion resistance. This is also proof of the conclusion drawn in the previous section. The ratios of the erosion mass of each grain group to the original mass of the corresponding grain group are shown in Table 2.
From the table above, it can be seen that under the action of strong unsteady flow scouring, the fine particles (<5 mm) are more easily scoured downstream under the premise that the coarse particles can be moved, and the scouring quality ratio of the fine particle group of the wide-graded sediment is higher than that of the soil with narrower gradation.
In addition, it is worth noting that, according to the principle of the experimental flow conditions setting, soils with particle sizes larger than d70 in Sample 1# will not be started. However, the gradation analysis of the scouring material shows that all particles in Sample 1# start moving and are washed downstream. Thus, it can be revealed that the formula for calculating the sediment starting flow rate under steady flow conditions is not applicable to unsteady flow, and the scouring intensity under unsteady flow conditions is greater than that of steady flow.

5. Influence of Flow Conditions on the Scouring Process

5.1. Scouring Amount

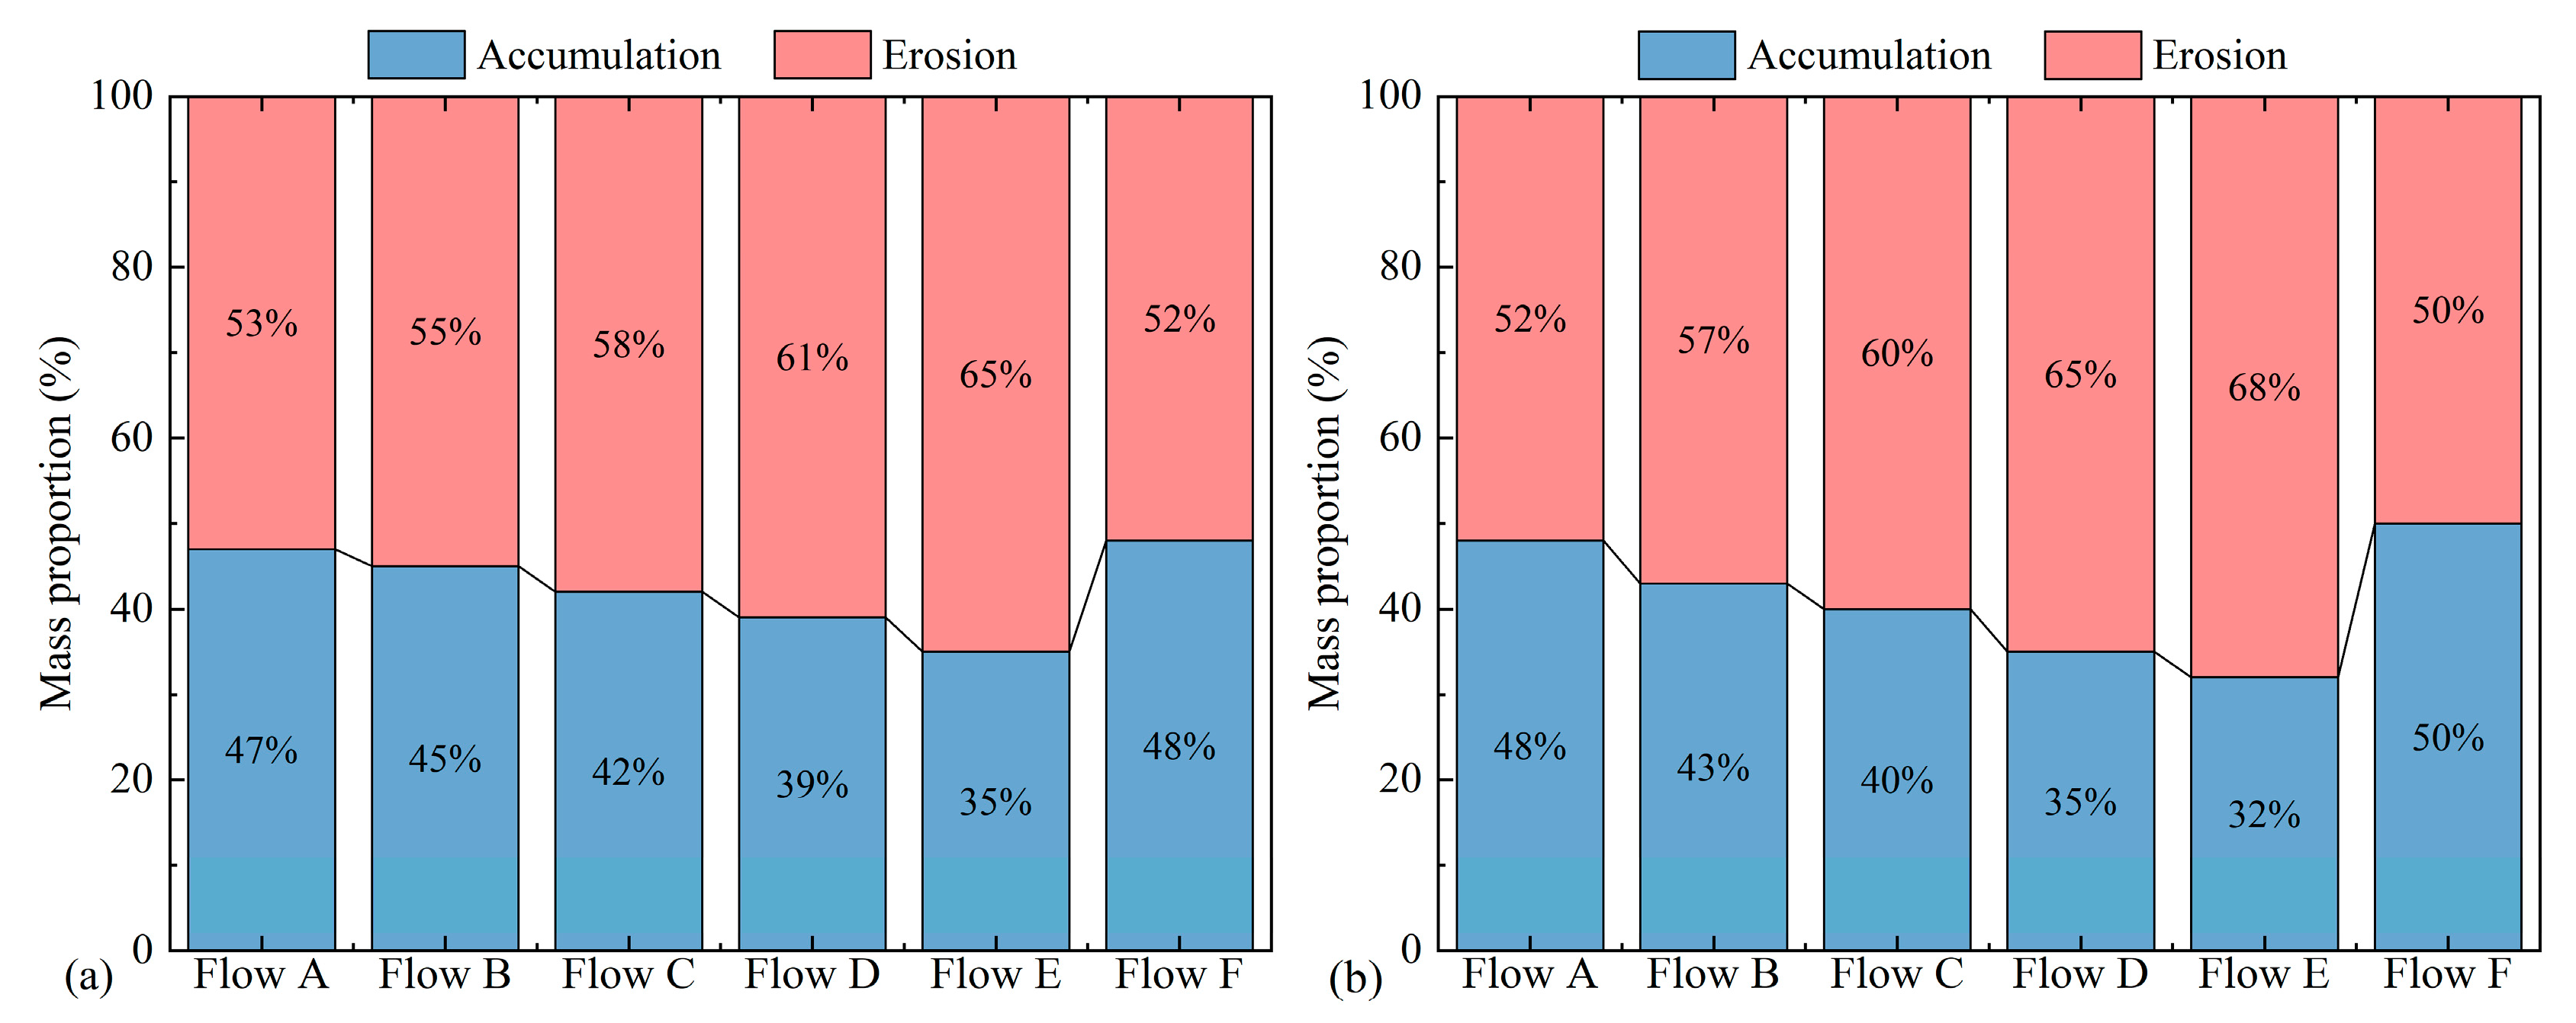
Samples 2# and 3# and different flow conditions were selected to conduct the scouring tests, respectively. Three groups of parallel tests were carried out under each working condition. The scouring amounts of two samples under different flow conditions were obtained as shown in Figure 9.
From the figure above, it is obvious that for the wide-graded sediment, the scouring pattern is consistent under different flow conditions. With the increase in flow unsteady intensity, the scouring strength of the flow shows an increasing trend as a whole, which becomes more obvious with the increase in grading width. In addition, the test results show that the scouring intensity of the wide-graded sediment under unsteady flow is greater than that under steady flow, and the scouring amount of the wide-graded sediment is greater under unsteady flow. This result is consistent with the conclusion that all sediment particles could start to move in “Section 3.2”, which also further confirms the conclusion about the scouring intensity of strong unsteady flow being greater than that of steady flow.

5.2. Erosion and Deposition Characteristics

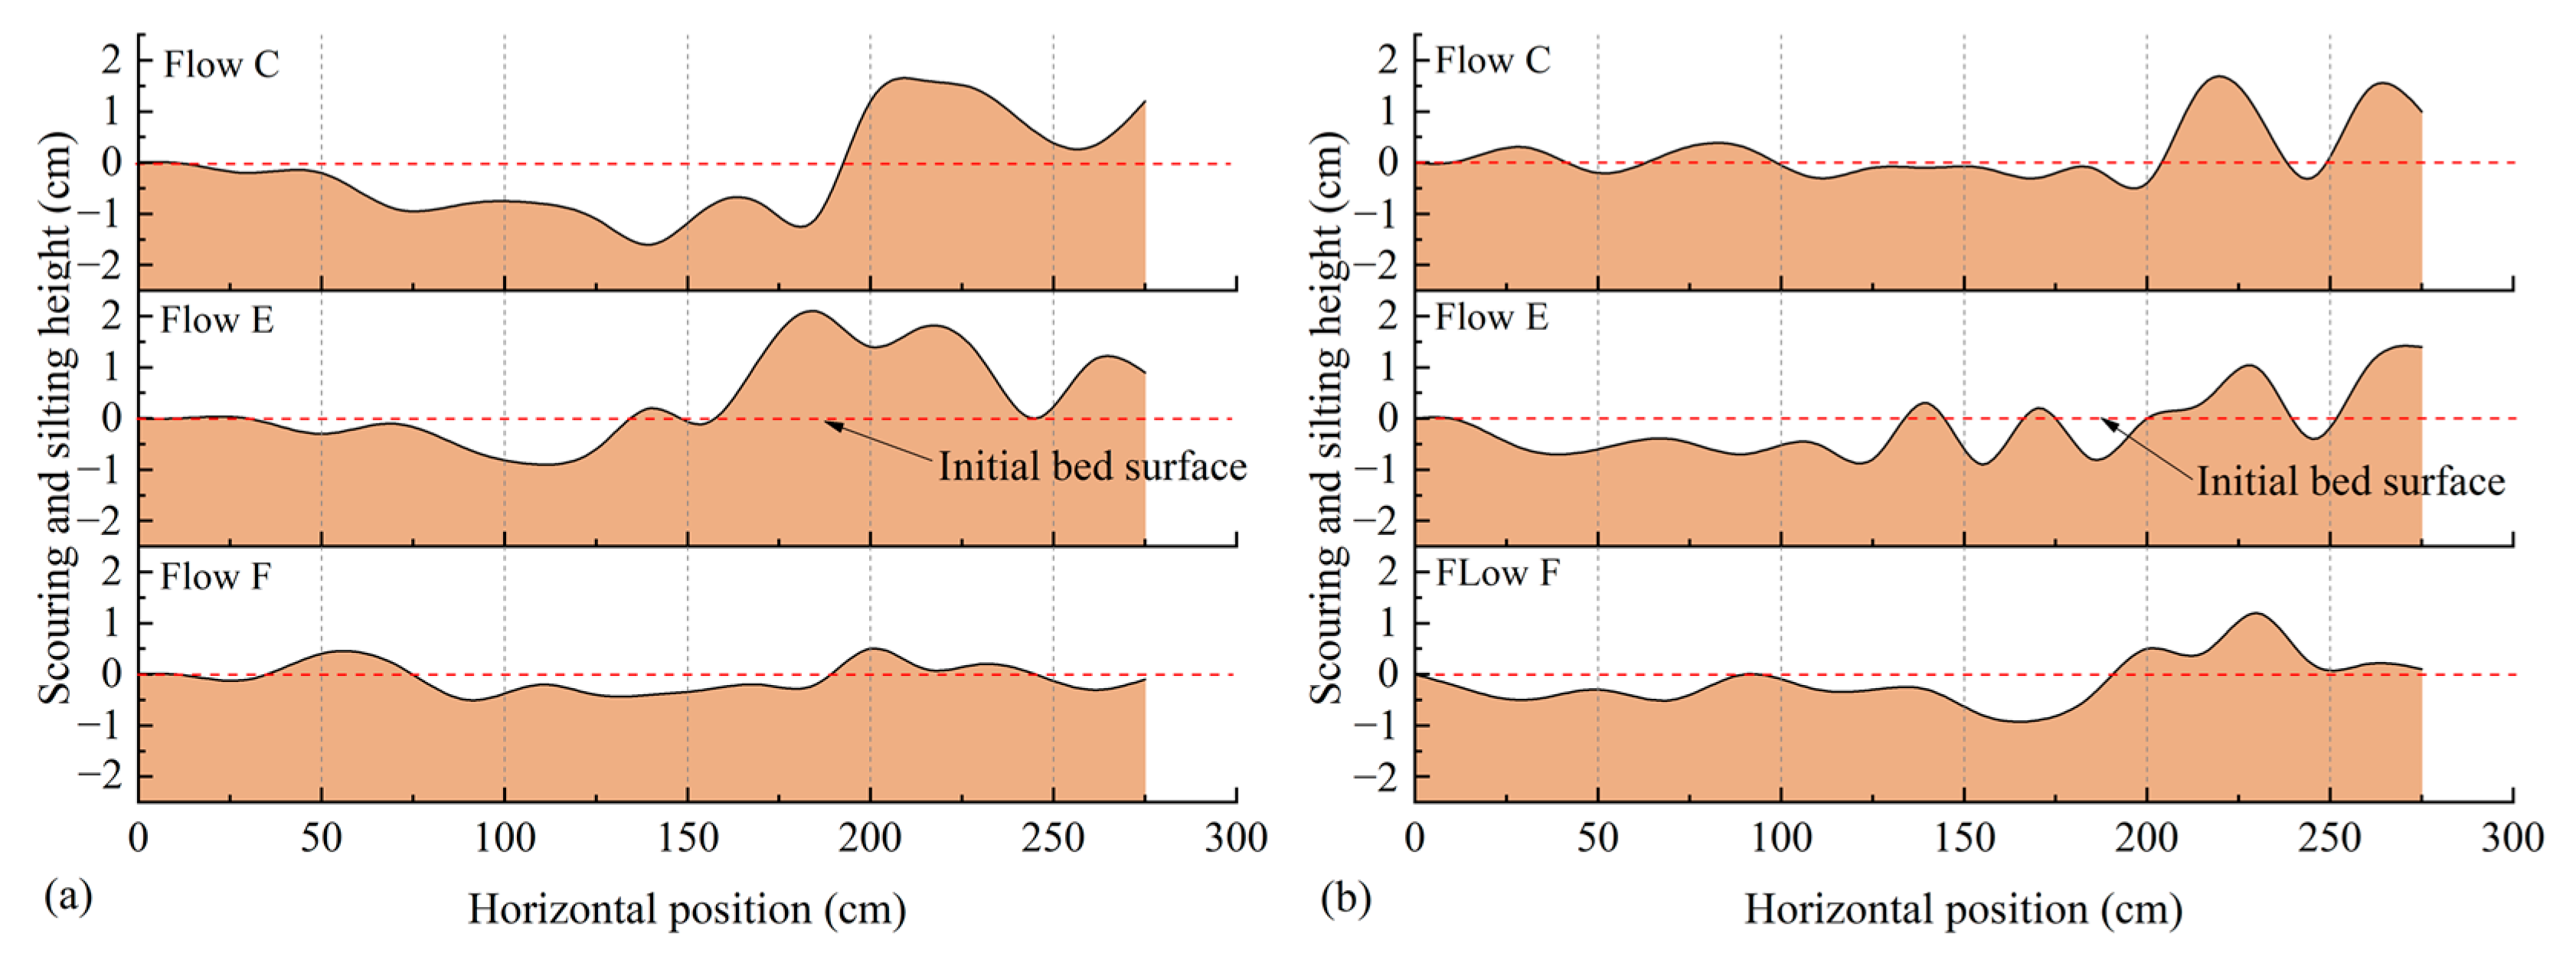
The elevation changes of different profiles after the scouring tests are recorded, and the scouring conditions along the sand laying section are shown in Figure 10.
From the figure above, for Sample 2#, the maximum scour depth is 1.6 cm under the Flow C condition, which occurs at the horizontal position of 140 cm, while the maximum silt thickness is 1.6 cm and the horizontal position is 215 cm. Under the Flow E condition, the maximum scour depth for Sample 2# is 1.5 cm, which occurs at the horizontal position of 110 cm, while the maximum silt thickness is 2.1 cm, which occurs at the horizontal position of 185 cm. For Sample 4#, the maximum scour depth under the unsteady Flow C is 0.4 cm, corresponding to the horizontal position at 200 cm. The maximum siltation thickness is 1.5 cm, occurring at the horizontal position of 215 cm. Under the unsteady Flow E, the maximum scouring depth is 0.9 cm, which occurs at the horizontal position of 155 cm, and the maximum siltation thickness is 1.4 cm, which occurs at the horizontal position of 275 cm. The statistical results of the scouring and silting of wide-grade material are shown in Table 3.
From the scouring and silting results above, it is revealed that there is headward erosion of the wide-graded sediment, and the location of higher scouring depth is roughly distributed in the middle and lower reaches of the sand laying section. However, the siltation of sediment mainly appears downstream of the sand laying section. In addition, the intensity of scouring and silting under unsteady flow conditions is higher than that under steady flow.
The main reason for this phenomenon is that the upstream inflow increases gradually in the initial stage, forming a large head difference, and large flow increment so that the sediment in the sand laying section is easier to be taken away from the bed surface and start to move, which is macroscopically characterized by the strong scouring of unsteady flow.

6. Conclusions and Discussion

In this paper, by physically simulating the scour transport process of wide-graded sediment under different flow conditions, the following conclusions are drawn from this study.
(1)
The scouring intensity downstream in the process of soil and sand scouring is much larger than that of upstream intensity, and large coarse particles mainly accumulate in the upstream area, which is more consistent with the location of the siltation area after the end of the scouring.
(2)
The wide-graded sediment scouring process develops in the form of scouring pit formation, expansion, and movement. The whole scouring process is influenced by the intermittent and paroxysmal start of coarse particles on the bed, and the scouring process is discontinuous. While the uniform sand scouring development process is dominated by continuous collapse damage of the downstream slope at the early stage, and mainly manifests as surface headward erosion at the later stage.
(3)
Under weak unsteady flow conditions, the shading effect of large particles in wide-graded sediment is obvious, and the erosion resistance is strong. However, under strong unsteady flow conditions, the water flow is more violent to the fine particles in wide-graded sediment, which causes the formation of a free surface on the downstream side of coarse particles and its start. The change in the shading relationship causes the fine particles to be further scoured, and the erosion resistance is weaker.
(4)
As the scouring intensity downstream of the sand laying section is higher than that upstream, the bed surface is easily inclined downstream. The accumulation range of barrier dams along the river is generally long and the breach is long and narrow. The change of slope rate at the breach bottom during breaching should be considered in the dam break calculation, otherwise, the calculation result would be conservative.
(5)
The scouring intensity under unsteady flow is greater than that under steady flow, so the bedload transport rate formula proposed based on the steady flow is not suitable for the calculation of the development process of barrier dam break.
(6)
The gradation width of dam material also has a significant influence on the erosion rule. Different types of landslide dams have different gradation widths. For example, in low position landslides, the dam body maintains the original slope stratigraphic sequence relationship and usually has wide gradation characteristics. However, in high position remote landslides, the dam body is mainly accumulated by debris flow due to sufficient vibration and fragmentation of the earth and rock, and the material gradation width is usually narrow. According to the conclusion of this study, the sediment transport equations used in the calculation of these two types of landslide dam failure should be different.
In addition, the scouring mechanism of wide-graded sediment under unsteady flow is very complex. To reveal its scouring law and apply it to the breach sediment transport in the process of barrier dam overtopping, it is still necessary to carry out further research on the following aspects:
(1)
Non-constant water flow is a fluctuating process, and the number of discharge waves has a certain degree of influence on the sand transport rate of wide-graded sediment, while the flood breach process can be understood as just one discharge wave with a large fluctuation in its value. Therefore, it is necessary to explore more general conclusions about the mechanism of breach expansion under the influence of a single water discharge wave.
(2)
The reasonable quantification of the grading width of soil is the premise for the quantitative study of the influence of the grading width on the calculation of sediment transport. At present, there are relatively few methods to quantify the grading width of soil. There is not even a quantitative definition of what wide-graded sediment is, nor a dimensionless representation of the width of the gradation. Only in the early years, some scholars conducted some research work on the mathematical expression method of non-uniform bed sediment grading curves [39,40,41]. The grading width of earth rock materials should not only be the ratio (difference) of particle size. Different grading curve shapes also reflect different properties and laws in different aspects, such as erosion, permeability, compression characteristics, etc. Therefore, it is necessary to conduct further research and explore the quantitative description method of grading the width of soil, the dimensionless representation method for grading width, and its influence mechanism.
(3)
Due to limitations in experimental equipment, the scale used in this article is small; although, some important influencing factors were considered before the tests, such as water flow, soil grading, etc. While, as we know, it is impossible to achieve all parameters that can be strictly scaled to meet geometric similarity, kinematic similarity, and dynamic similarity, such as shear stress, flow rate, Reynolds number, Froude number, etc. However, even if this is achieved, it is still difficult to determine to what extent the measured data in the experiment represents the actual situation on site. Based on this consideration, the transport law of wide-graded soil under the action of unsteady flow, such as the transport mode, and erosion resistance, is qualitatively analyzed. The experimental data obtained in this paper are used cautiously, and the prototype data are not transformed, but the law reflected in it is emphasized.

Author Contributions

Conceptualization, T.Z. and C.F.; investigation, C.Z.; data curation, T.M.; writing—original draft preparation, T.Z.; writing—review and editing, C.F.; project administration, T.Z. and C.F. All authors have read and agreed to the published version of the manuscript.

Funding

This research was funded by National Natural Science Foundation of China grant number 52279095, 52109149, the Chongqing Science and Technology Commission of China grant number cstc2021jcyj-msxm0711, the Science and Technology Research Program of Chongqing Municipal Education Commission grant number KJZD-K202000705, Research Project of Chongqing Water Resources Bureau grant number CQSLK-2022028, respectively.

Data Availability Statement

The data presented in this study are available on request from the corresponding author. The data are not publicly available due to restrictions of privacy.

Conflicts of Interest

The authors declare no conflict of interest.

References

  1. Peng, M.; Zhang, L.M.; Chang, D.S.; Shi, Z.M. Engineering risk mitigation measures for the landslide dams induced by the 2008 Wenchuan earthquake. Eng. Geol. 2014, 180, 68–84. [Google Scholar] [CrossRef]
  2. Zhong, Q.M.; Chen, S.S.; Deng, Z. Simulation of diffuse toppling collapse mechanism and dam failure process of a barrier dam. Sci. Sin. Technol. 2018, 48, 959–968. [Google Scholar] [CrossRef] [Green Version]
  3. Pang, L.C.; Mo, D.Y.; Li, A.H. Analysis of formation conditions and processes of landslide-type barrier dams. People’s Yangtze River 2016, 47, 94–97+102. [Google Scholar] [CrossRef]
  4. Fan, X.; Scaringi, G.; Korup, O.; West, A.J.; Westen, C.J.; Tanyas, H.; Hovius, N.; Hales, T.C.; Jibson, R.W.; Allstadt, K.E.; et al. Earthquake-Induced Chains of Geologic Hazards: Patterns, Mechanisms, and Impacts. Rev. Geophys. 2019, 57, 421–503. [Google Scholar] [CrossRef] [Green Version]
  5. Zhao, T.; Dai, F.; Xu, N. Coupled DEM-CFD investigation on the formation of landslide dams in narrow rivers. Landslides 2017, 14, 189–201. [Google Scholar] [CrossRef] [Green Version]
  6. Jiang, X.G.; Cui, P.; Wang, Z.Y.; Heng, W.H. Experimental study of weir breach undercutting process. J. Sichuan Univ. 2016, 48, 38–44. [Google Scholar] [CrossRef]
  7. Liu, D.Z.; Cui, P.; Jiang, D.W. Experimental study on breach broadening process of landslide dam. Sci. Soil Water Conserv. 2017, 015, 19–26. [Google Scholar] [CrossRef]
  8. Zhao, G.W.; Jiang, Y.J.; Qiao, J.P.; Meng, H.J.; Yang, Z.J. Experimental investigation on overtopping failure of landslide dams with different conditions of compactness. J. Rock Mech. Eng. 2018, 37, 1496–1505. [Google Scholar] [CrossRef]
  9. Zhao, T.; Chen, S.; Fu, C.; Zhong, Q. Influence of diversion channel section type on landslide dam draining effect. Environ. Earth Sci. 2018, 77, 1–9. [Google Scholar] [CrossRef]
  10. Zhong, Q.M.; Shan, Y.B. Comparison of rapid evaluation methods for barrier dam’s stability. Yangtze River 2019, 50, 20–24+64. [Google Scholar] [CrossRef]
  11. Shen, G.Z.; Sheng, J.B.; Xiang, Y.; Zhong, Q.M. Numerical modeling of breach process of landslide dams due to overtopping and its application. Chin. J. Geotech. Eng. 2018, 40, 82–86. [Google Scholar]
  12. Zhong, Q.M.; Chen, S.S.; Mei, S.A.; Cao, W. Numerical simulation of landslide dam breaching due to overtopping. Landslides 2018, 15, 1183–1192. [Google Scholar] [CrossRef]
  13. Zhao, T.; Chen, S.; Fu, C.; Zhong, Q. Centrifugal model tests and numerical simulations for barrier dam break due to overtopping. J. Mt. Sci. 2019, 16, 630–640. [Google Scholar] [CrossRef]
  14. Li, Y.; Hu, W.; Wasowski, J.; Zheng, Y.; McSaveney, M. Rapid episodic erosion of a cohesionless landslide dam: Insights from loss to scour of Yangjia Gully check dams and from flume experiments. Eng. Geol. 2021, 280, 105971. [Google Scholar] [CrossRef]
  15. Gilbert, G.K.; Murphy, E.C. The Transportation of Débris by Running Water; Center for Integrated Data Analytics Wisconsin Science Center: Madison, WI, USA, 1914. [Google Scholar] [CrossRef]
  16. Meyer-Peter, E. Formulas for bed-load transport. Proc. Congr. Iahr. 1948, 3, 39–64. [Google Scholar]
  17. Mason, P.J. Erosion of plunge pools downstream of dams due to the action of free-t-rajectory jets. Proc. Inst. Civ. Eng. 1984, 76, 523–537. [Google Scholar] [CrossRef]
  18. Jing, H.; Chen, G.; Wang, W.; Li, G. Effects of concentration-dependent settling velocity on non-equilibrium transport of suspended sediment. Environ. Earth Sci. 2018, 77, 549. [Google Scholar] [CrossRef]
  19. Khosravi, K.; Chegini, A.H.N.; Cooper, J.; Mao, L.; Habibnejad, M.; Shahedi, K.; Binns, A. A laboratory investigation of bed-load transport of gravel sediments under dam break flow. Int. J. Sediment Res. 2021, 36, 229–234. [Google Scholar] [CrossRef]
  20. Bagnold, R.A. An Approach to the Sediment Transport Problem from General Physics; U.S. Geological Survey Professional Paper; U.S. Government Printing Office: Washington, DC, USA, 1966; p. 37. [CrossRef] [Green Version]
  21. Einstein, H. Formulas for the transportation of bed load. J. Hydraul. Div. ASCE 1942, 107, 561–597. [Google Scholar] [CrossRef]
  22. Han, Q.W.; He, M.M. Statistical theory of sediment movement. Chin. Sci. Bull. 1980, 36–38. [Google Scholar]
  23. Wei, L.; Lu, J.Y.; Xu, H.T. Experimental study on the distribution of vertical flow velocity in a discontinuous wide-graded riverbed. J. Water Resour. Water Transp. Eng. 2012, 26–31. [Google Scholar] [CrossRef]
  24. Jin, M.H. Experimental study on the starting law of bed sand with a wide size distribution. J. Mt. Sci. 2003, 493–497. [Google Scholar] [CrossRef]
  25. Xu, H.T.; Lu, J.Y.; Liu, X.B. Study on the Method of Calculating Transport Rate of Discontinuous Broadly Graded Bedload. J. Yangtze River Sci. Res. Inst. 2011, 28, 26–30+36. [Google Scholar] [CrossRef]
  26. Wang, S.Y.; Duan, W.G.; Li, L. Study on motion characteristics of wide graded non-uniform sand. Yangtze River 2011, 42, 72–75+105. [Google Scholar] [CrossRef]
  27. Wei, L.; Lu, J.Y.; Xu, H.T. Exploration on the characteristics and formation conditions of discontinuous wide-graded bed sand in natural river channels. J. Chang. Acad. Sci. 2012, 29, 6–10+15. [Google Scholar] [CrossRef]
  28. Xu, D.; Bai, Y.; Ji, C.; Williams, J. Experimental study of the density influence on the incipient motion and erosion modes of muds in unidirectional flows: The case of Huangmaohai Estuary. Ocean Dyn. 2015, 65, 187–201. [Google Scholar] [CrossRef]
  29. Mohamed, E.; Jasim, I. Bedload Model for Nonuniform Sediment. J. Hydraul. Eng. 2016, 142, 06016004. [Google Scholar] [CrossRef]
  30. Pilarczyk, K.W. Impact of the Delta Works on the recent developments in coastal engineering. Coast. Ocean. Eng. Pract. 2012, 1–37. [Google Scholar] [CrossRef] [Green Version]
  31. Xu, J.; Wei, W.; Bao, H.; Zhang, K.; Lan, H.; Yan, C.; Sun, W. Failure models of a loess stacked dam: A case study in the Ansai Area (China). Bull. Eng. Geol. Environ. 2020, 79, 1009–1021. [Google Scholar] [CrossRef]
  32. Faraci, C.; Musumeci, R.E.; Marino, M.; Ruggeri, A.; Carlo, L.; Jensen, B.; Foti, E.; Barbaro, G.; Elsaßer, B. Wave-and current-dominated combined orthogonal flows over fixed rough beds. Cont. Shelf Res. 2021, 220, 104403. [Google Scholar] [CrossRef]
  33. Lu, Q.; Deng, A.J.; Guo, Q.C.; Dong, X.Y. Study on the evolution pattern and mechanism of pebble bed flushing and siltation in the downstream of reservoirs. Sediment Res. 2019, 44, 26–32. [Google Scholar] [CrossRef]
  34. Cui, P.; Zhu, Y.Y.; Han, Y.S.; Chen, X.Q.; Zhuang, J.Q. The 12 May Wenchuan earthquake-induced landslide lakes: Distribution and preliminary risk evaluation. Landslides 2009, 6, 209–223. [Google Scholar] [CrossRef]
  35. Wang, G.Q.; Wang, Y.Q.; Liu, L.; Wang, D.Y. Reviewed on Barrier Dam and Simulation on Dam Breach. Yellow River 2015, 37, 1–7. [Google Scholar] [CrossRef]
  36. Liu, N.; Chen, Z.; Zhang, J.; Lin, W.; Chen, W.; Xu, W. Draining the Tangjiashan Barrier Lake. J. Hydraul. Eng. 2010, 136, 914–923. [Google Scholar] [CrossRef]
  37. Zhang, R.J. River Sediment Engineering; China Hydraulic Press: Beijing, China, 1981. [Google Scholar]
  38. Ma, A.X.; Lu, Y.J.; Lu, Y. Experimental study on gravel bed-load transport in unsteady flow. Shuili Xuebao 2013, 44, 800–809. [Google Scholar]
  39. Xie, B.L. Determination of functional relationship of experimental curve. J. Sediment Res. 1983, 64–66. [Google Scholar]
  40. Xiong, Z.P. Function formula of sediment gradation curve and determination of boundary grain size of bed sand and scour material. J. Sediment Res. 1985, 88–94. [Google Scholar]
  41. Wang, X.K.; Fang, D.; Cao, S.Y. Fractal Dimension on Characteristics of Pebble Sediment with Wide Size Distribution and Application. J. Yangtze River Sci. Res. Inst. 1999, 16, 9–12. [Google Scholar] [CrossRef]
Figure 1. Sketch of the experimental apparatus (cm).
Processes 11 01965 g001
Figure 2. Soil samples used for testing. (a) Grading curves of soil samples; (b) sieved grain groups.
Processes 11 01965 g002
Figure 3. Erosion flow process. (a) Measured draining process of Tangjiashan barrier dam; (b) selection of test water flow.
Processes 11 01965 g003
Figure 4. The scouring process of wide-graded sediment (Sample 4#).
Processes 11 01965 g004
Figure 5. The erosion process of uniform sediment (Sample 6#).
Processes 11 01965 g005
Figure 6. The development process of sand waves.
Processes 11 01965 g006
Figure 7. Influence of gradation width on scouring amount. (a) Unsteady flow A; (b) unsteady flow E.
Processes 11 01965 g007
Figure 8. Grading curve of sample and scour material.
Processes 11 01965 g008
Figure 9. Influence of flow condition on scouring amount. (a) Sample 2#; (b) Sample 3#.
Processes 11 01965 g009
Figure 10. Scouring and silting along the scouring section. (a) Sample 2#; (b) Sample 4#.
Processes 11 01965 g010
Table 1. Unsteady strength of the testing water flow.
ConditionsFlow AFlow BFlow CFlow DFlow EFlow F
P0.1130.1250.1370.1500.1620
Table 2. Erosion mass ratios for each particle group.
1# (%)2# (%)3# (%)4# (%)5# (%)
0.5~1 mm37.835.036.675.123.7
1~2 mm41.138.839.966.428.8
2~5 mm28.521.923.755.615.9
5~8 mm51.228.322.039.955.3
8~10 mm36.418.816.523.114.6
10~13 mm30.921.621.664.311.8
13~15 mm27.221.522.230.715.8
15~20 mm56.142.616.420.946.3
20~37.5 mm/10.123.719.9/
37.5~53 mm//18.320.8/
53~75 mm///16.0/
Table 3. Analysis of scouring and silting along the scouring section.
Flow ConditionsSamplesMaximum Flush ConditionMaximum Siltation
Location (cm)Depth (cm)Location (cm)Thickness (cm)
C2#1401.62151.6
4#2000.42151.5
E2#1101.51852.1
4#1550.92751.4
F2#900.52000.5
4#1700.92301.2
Disclaimer/Publisher’s Note: The statements, opinions and data contained in all publications are solely those of the individual author(s) and contributor(s) and not of MDPI and/or the editor(s). MDPI and/or the editor(s) disclaim responsibility for any injury to people or property resulting from any ideas, methods, instructions or products referred to in the content.