Abstract
Change regulation of the physical properties of fluid is key to accurately predicting multiphase fluid flow in the production wellbore of CO2 flooding reservoirs. Given the characteristics of significant changes in pressure, temperature, and CO2 content in the whole wellbore of production wells in CO2 flooding reservoirs, this paper systematically studied the change rules of volume factor, viscosity, density, and solubility of well fluid for pressure 5~30 MPa, temperature 20~120 °C, and CO2 content 10~90% through single degassing PVT experiments. According to the experimental results, the volume factor of crude oil increases first and then decreases with the pressure increase. At the bubble point pressure (20 MPa), the volume factor of crude oil can reach 1.89 at high temperatures. The volume factor can be increased from 1.28 to 1.44 at 8 MPa when the temperature increases from 20 °C to 120 °C. Under the bubble point pressure, the increase in pressure increases the solubility of CO2, and the viscosity of crude oil decreases rapidly. In contrast, above the saturation pressure, the increase in pressure increases the viscosity of crude oil. Under the freezing point temperature (24 °C), the viscosity of crude oil decreases sharply with increase in temperature. In contrast, above the freezing point temperature, the viscosity change of crude oil is not sensitive to temperature. The wellbore temperature has a significant impact on the density of the well fluid. At 5 MPa, the temperature increases from 20 °C to 120 °C, which can reduce the density of high CO2 crude oil from 0.93 g/cm3 to 0.86 g/cm3. The solubility of CO2 in crude oil is sensitive to pressure. When the pressure increases from 5 MPa to 15 MPa at 20 °C, the solubility increases by 36.56 cm3/cm3. The results of this paper support the multiphase fluid flow law prediction of CO2 flooding production wells with a high gas–liquid ratio.
1. Introduction
Problems such as global temperature increase, forest fires, glaciers melting, and sea-level elevation gradually affect human beings’ living environment. More and more attention is focused on carbon capture, storage, and utilization to inhibit the greenhouse effect [1]. As an effective technology to enhance oil recovery, CO2 has a wide range of adaptability to different types of reservoirs [2,3]. With low viscosity, high fluidity, and good compatibility with the reservoir, CO2 does not easily cause damage to the reservoir. It extracts crude oil and is easily miscible, which can significantly improve oil recovery [4]. Klewiah et al. and Berawala et al. found that CO2 can preferentially substitute with methane in shale and improve recovery [5,6]. Because CO2 can be dissolved in crude oil in large quantities, the physical parameters of crude oil will change greatly [7,8], and even the reservoir properties will be improved, which is the key to enhancing oil recovery by CO2 [9].
CO2 flooding is more favorable in most oilfields because CO2 has higher solubility in oil, and it can better expand oil volume and reduce oil viscosity and CO2–oil interfacial tension. When the gas–oil volume ratio increases from 100.4 to 485.8, the oil bubble point pressure increases from 11.6 MPa to 14.8 MPa, increasing only 3.2 MPa. When the CO2 mole fraction in the CO2–oil system reaches 70%, oil volume can expand by 1.5 times, and oil viscosity reduces by 57.1%. Additionally, when the pressure exceeds the minimum miscible pressure (MMP), the CO2–oil interface disappears, and oil and CO2 achieve miscibility. According to some miscibility pressure tests, the MMP of the CO2–oil system is much lower than that of the oil-associated gas system. When 90% CO2 and 10% associated gas are mixed, the MMP of the CO2–oil system increases by 1.08 MPa. Core flooding experiments show that miscible CO2 flooding increases the recovery factor by 42.7% based on water flooding, 19.4% higher than the associated gas flooding.
In recent years, there were more than 200 gas injection projects worldwide, of which 70% were CO2 flooding projects. Approximately 300–600 billion barrels of oil can be recovered by CO2 flooding in the world. Since the United States has many CO2 reservoirs, there is a sufficient supply of CO2 to carry out CO2 flooding in water-flooded oil fields. Oil production increased by CO2 flooding is 1371 tons in the United States, accounting for 93% of the world’s oil production enhanced by CO2 flooding. At present, CO2 huff and puff technology has been applied in many major oil fields, such as the Ritchie oilfield [7], Wilmington oilfield [10], Halfmoon oilfield [11], etc. Considering the satisfactory EOR effect of CO2 flooding, many oilfields in China (e.g., Daqing Oilfield, Jilin Oilfield, Zhongyuan Oilfield, Jiangsu Oilfield, etc.) have also carried out CO2 flooding projects since 1960, which have achieved good oil recovery results and economic benefits through CO2 injection, and have also met the requirements of the carbon peaking and carbon neutrality goals in China.
Pressure-volume-temperature (PVT) analysis is the process of determining the fluid behaviors and properties of oil and gas samples from an existing well. Normally, PVT properties are experimentally measured in the laboratory [12]. The fluid properties of reservoirs are crucial in the computations implemented in the field of petroleum engineering, e.g., the computations of the material balance, numerical simulation of reservoirs, estimates of reserves, and calculations of inflow performance. Therefore, accurate PVT properties data are very important for the success of these applications [13]. Wang et al. designed an experimental apparatus to accurately measure the density of supercritical CO2 in wide temperature and pressure ranges [14]. Ghasemi et al. described a systematic approach to modeling the phase and volumetric behavior of extra-heavy oil and light solvent mixtures for a wide range of temperatures [15].
As fields become mature and more laboratory data are available from specific geographical locations, it is possible to characterize and classify crude oils and develop or modify published correlations to better predict oil PVT properties [16]. The target block is mainly composed of structural and lithologic structural reservoirs with a buried depth of −3200~−3900 m. At abnormally high temperature and pressure, the geothermal gradient is 3.76 °C/100 m and the pressure coefficient 1.40~1.57. It is a low-porosity and ultra-low permeability reservoir with an average porosity of 13.9% and an average permeability of 7.7 mD.
Compared with the wellbore flow of conventional oil wells, in the late production period of CO2 flooding reservoirs, the associated gas produced from production wells has a high CO2 content [17], resulting in changes in the volume factor, viscosity, density, and gas solubility of the three oil–gas–water phases; this further affects the calculation of wellbore pressure, temperature distribution, and gas-lift design [18,19]. Therefore, it is of great importance to study the fluid physical parameters of watered oil under different temperatures, pressures, and CO2 content through laboratory experiments. Compared with previous studies, this paper carries out a well-flow physical property test with a CO2 content of 10–90% at high temperatures and pressures. The results of this paper provide scientific guidance for development scheme formulation, oil well productivity evaluation, and field construction.
2. Experimental Apparatus and Method for Physical Property Parameters of Well Fluid
The purpose of conducting high-temperature and high-pressure physical property parameter testing experiments on CO2–crude oil mixed systems is to explore the influence law of different CO2 contents on the physical property of crude oil under different temperature and pressure conditions. The experiment mainly uses a high-temperature and high-pressure reactor as the equipment to test the solubility, density, volume factor, and viscosity of the mixed fluid in the CO2–crude oil system. The physical property change law of high temperature and high pressure of fluid is compared and analyzed, and the physical property parameter calculation model suitable for the experimental conditions is established based on fitting the experimental results, which lays the basis for calculation of the pressure and temperature distribution along the wellbore, and thus provides the basis for the dynamic prediction of the wellbore.
2.1. Experimental Equipment
The well fluid physical property test system is shown in Figure 1, which mainly includes a high-temperature and high-pressure reactor (effective volume 1000 mL), constant temperature air bath, high-pressure displacement pump, gas flowmeter, electronic balance, oil/gas chromatograph (Agilent 6890), falling ball viscometer (70 MPa, 200 °C), and gas–liquid separation meter. Auxiliary equipment includes a gas booster pump and intermediate vessel.
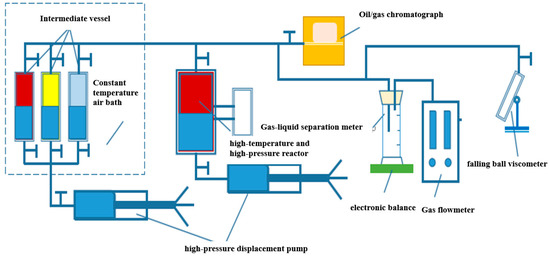
Figure 1.
Experimental setup.
2.2. Experimental Materials
The experimental materials were mainly crude oil samples and formation water in the S well area of an oilfield in China, as well as methane, ethane, propane, butane, CO2, N2 gas (purity 99.99%), C5H12, C6H14, C7H16, and C8H18 reagents. The original formation temperature was 127 °C, the bottom hole pressure of the production well was 30 MPa, the original gas–oil ratio was 89 m3/m3, the formation crude oil viscosity was 1.13 mPa·s, the density was 0.7437 g/m3, and the freezing point was 24 °C. The composition of well fluid and flash vapor is shown in Table 1.

Table 1.
Well fluid and flash vapor composition.
Oil samples in the target block were mixed with CO2-containing natural gas, and physical property parameter test experiments were carried out. The solubility of CO2 in crude oil and the volume factor, viscosity, and density of the mixed fluid under conditions of high CO2-containing content were determined. The change rule of CO2–crude oil physical properties in the whole wellbore section of production Wells in the target block was studied. The physical property parameters of the experiment are shown in Table 2. The experimental temperature was 20–120 °C, the experimental pressure was 5–30 MPa, the content of CO2 in natural gas was set at 10–90%, and the water content was 20%.

Table 2.
Experimental scheme design.
2.3. Experimental Method
The flash separation experiment of an oil–water mixing system was carried out in a high-temperature and high-pressure reactor under saturated CO2. By obtaining the surface oil volume under different conditions and the volume of a single excited gas, the volume change of fluid volume under high temperature and high pressure, and the composition of crude oil and gas after surface separation. The CO2 solubility in watered oil, the volume factor, and the density at different pressures and temperatures were calculated. Then the oil and water systems under the same conditions were transferred to the high-temperature and high-pressure falling ball viscometer to measure the viscosity under different pressures and temperatures. The density, volume factor, and viscosity of the CO2–crude system could be tested simultaneously through a set of experimental devices. The CO2 solubility experiment had to be tested separately, but the steps of liquid mixing and standard gas injection were the same in the two experiments. The specific experimental process is as follows:
- (1)
- Natural gas preparation
According to the composition of well fluid and the dissolved gas/oil ratio, calculate the volume of C1~C4, CO2, and N2 required to prepare a certain amount of formation crude oil at the surface condition. Determine the actual injection amount of each gas component by combining the actual gas cylinder pressure and experimental ambient temperature. In order of cylinder pressure from small to large, transfer the appropriate amount of each gas to the intermediate container in a sequence of 2~3 times. Pressurize to 30 MPa for remixing of formation crude oil.
- (2)
- Oil preparation
Pour 300 mL dead oil into the sample distributor, inject the formation water sample into the sample distributor according to the moisture content, and, finally, inject the mixed natural gas sample into the sample distributor. Shake for 2~3 h to make the gas–liquid mixture in the sample distributed evenly, and then stand. At this point, the formation oil remix is completed.
- (3)
- Parameter test
- The experimental steps for testing volume factor, viscosity, and density are as follows [20,21]:Pour 300 mL crude oil into the reactor and adjust the temperature to the design temperature of the experiment. Inject the formation water sample into the dead oil in a certain proportion according to the water content requirement (20%). According to the molar content of CO2 in natural gas, inject various gases into the intermediate vessel and pressurize to 30 MPa to form standard gas. To prepare live oil, inject the standard gas into the reactor at a constant pressure of 30 MPa to fully dissolve it into crude oil. Discharge the free gas, then connect the capillary to the reactor and the gas–liquid separation meter (test tube and gas flowmeter). Open the valve of the reactor to let the crude oil enter the test tube, and the gas enters the gas flowmeter. Record the values before and after the pressure pump, and test the volume factor. Remove the connection device after the test. Using a capillary connection reactor, use the densitometer and kinematic viscosity tester as follows: Open the valve of the reactor, and the fluid will enter the kinematic viscosity tester for testing the viscosity. Stop the test when the viscosity value shows stability, and measure density with the weighing method. Lower the pressure to the next pressure point, and after it is constant for 1 h repeat the above steps. When measuring the parameters below the bubble point pressure, it is necessary to open the release valve of the reactor to exhaust and reduce the pressure, and the stability time should be extended from 4 h to 5 h.
- Experimental steps for testing solubility are as follows [22,23]:Pour 300 mL crude oil into the reactor and adjust the temperature to the design temperature of the experiment. According to the gas–oil ratio, inject various gases into the intermediate vessel and pressurize to 30 MPa to form standard gas. To prepare live oil, inject the standard gas into the reactor at a constant pressure of 30 MPa to fully dissolve it into crude oil. Inject excess CO2 (recorded amount of CO2 added) into the reactor and allow it to dissolve fully, leaving undissolved CO2 above the reservoir. Connect the capillary to the reactor and the gas flowmeter and discharge the free gas. Collect the gas sample in the gas collection bag and test it using the gas chromatograph (Agilent 7890). Record the total amount of gas discharged until the oil is produced. Lower the pressure to the next pressure point, and after it is constant for 1 h repeat the above steps. Calculate CO2 solubility from the volume of free gas and oil.
3. Experimental Results and Analysis
3.1. Experiment on Volume Factor of Watered oil Containing CO2
As shown in Figure 2, Figure 3 and Figure 4, the experiment tested the volume factor of the mixed fluid with different contents of CO2 and watered oil (water content 20%) under different pressures (5~30 MPa) and temperatures (20 °C, 70 °C, and 120 °C). The coupling formulas for volume factor, temperature, and pressure under different CO2 contents have been listed in Equations (1)–(3).
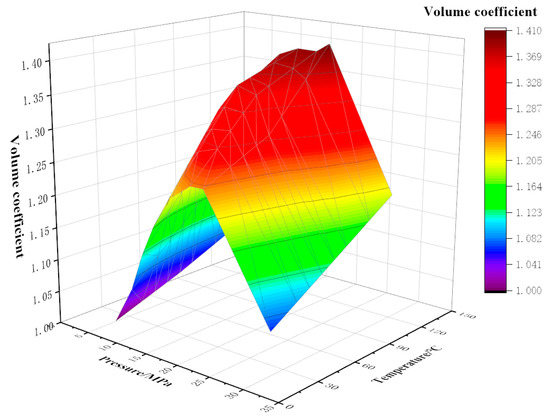
Figure 2.
Variation of volume factor with temperature and pressure at 10% CO2 content.
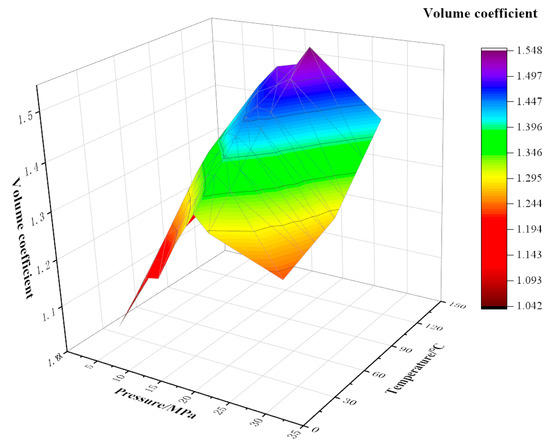
Figure 3.
Variation of volume factor with temperature and pressure at 40% CO2 content.
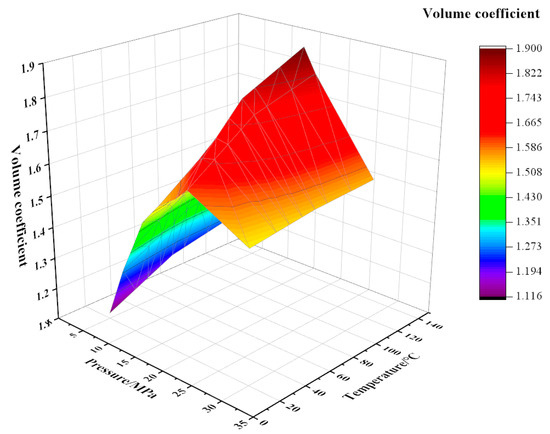
Figure 4.
Variation of volume factor with temperature and pressure at 90% CO2 content.
Under the same CO2 content, the dynamic trend of the volume factor is that with the increase in pressure, the volume factor first increases and then decreases. For example, under the conditions of 90% CO2 content and 120 °C, the pressure increases from 5 MPa to 18 MPa and the volume factor increases from 1.26 to 1.90. The main reason for this is that the increase in pressure improves the compression degree of crude oil and helps to improve its lifting efficiency. An obvious inflection point occurs around 20 MPa; it is analyzed that the pressure around 20 MPa at this moment is the bubble point pressure, and the CO2 dissolving capacity of crude oil reaches its maximum at this moment. When the pressure continues to increase, the gas has been completely integrated into the crude oil, and the volume will be compressed again under continuous pressure, resulting in a decrease in the volume factor. Under the same conditions of 90% CO2 and 120 °C, the pressure increases from 20 MPa to 30 MPa and the volume factor decreases by 15.3%. When the CO2 content is constant, the volume factor increases with the increase in temperature. The main reason for this is that with the increase in temperature, the volume of crude oil expands, which can integrate more CO2 gas, resulting in an increase in the volume factor. Under the same pressure and temperature, the volume factor also showed an increase with the increase in CO2 content. This is because, compared with other components in natural gas, CO2 is more soluble in crude oil. Therefore, the higher the CO2 content, the more gas is dissolved in crude oil, resulting in a higher volume factor of crude oil with high CO2 content. Similarly, when the pressure continues to increase, less CO2 gas can be dissolved, and the volume factor also decreases.
The coupling formula for volume factor, temperature, and pressure under the condition of 10% CO2 content:
R2 = 0.9842
The coupling formula for volume factor, temperature, and pressure under the condition of 40% CO2 content:
R2 = 0.9826
The coupling formula for volume factor, temperature, and pressure under the condition of 90% CO2 content:
R2 = 0.9749
3.2. Experiment on Viscosity of Watered Oil Containing CO2
As shown in Figure 5, Figure 6 and Figure 7, the experiment tested the viscosity of the mixed fluid with different contents of CO2 and watered oil (water content 20%) under different pressures (5–30 MPa) and temperatures (20 °C, 70 °C, and 120 °C). The coupling formulas for viscosity, temperature, and pressure under different CO2 contents have been listed in Equations (4)–(6). By analyzing the experimental results, it can be found that the viscosity of the mixed fluid changes as follows:
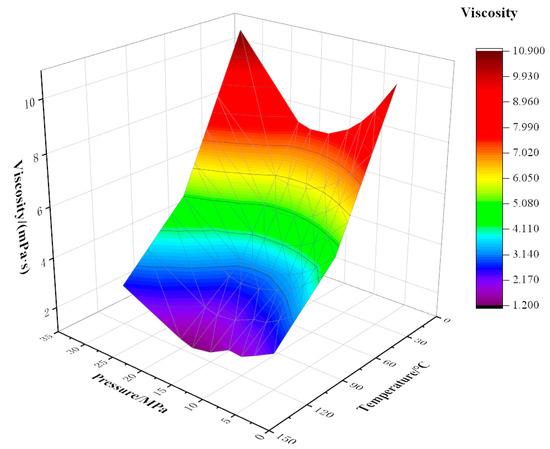
Figure 5.
Variation of viscosity with temperature and pressure at 10% CO2 content.
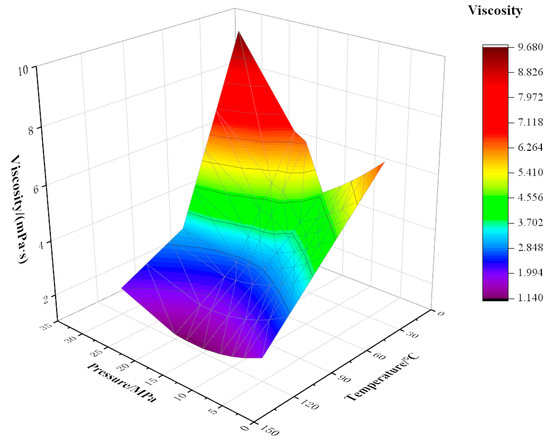
Figure 6.
Variation of viscosity with temperature and pressure at 40% CO2 content.
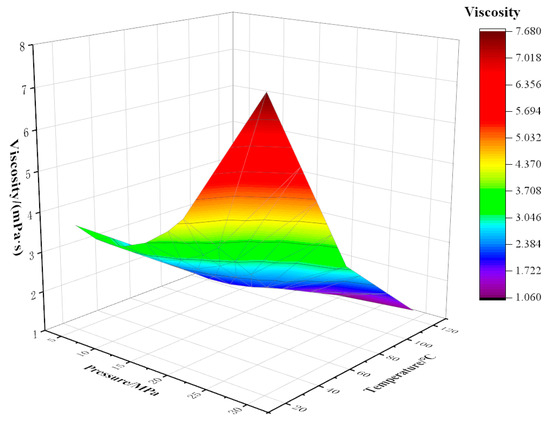
Figure 7.
Variation of viscosity with temperature and pressure at 90% CO2 content.
The viscosity of the mixed fluid decreases with the increase in temperature; the decrease is fastest at 20 °C, then the trend slows down. This is because when the temperature is near the freezing point (24 °C), the increase in temperature has an obvious effect on the viscosity reduction of crude oil. Above the freezing point, the viscosity reduction effect of rising temperature is weakened. At a certain CO2 content, the temperature is more sensitive to viscosity than pressure, and as CO2 content increases, the sensitivity of mixed fluid to temperature decreases. For example, when the temperature rises from 20 °C to 70 °C at a pressure of 5 MPa with 10% CO2 content, the viscosity drops sharply from 10.21 mPa·s to 4.74 mPa·s with an amplitude of 5.46 mPa·s. When the temperature rises from 20 °C to 70 °C, the viscosity decreases from 3.66 mPa·s to 2.15 mPa·s, and the decreased amplitude is 1.51 mPa·s under the conditions of 5 MPa pressure and 90% CO2 content.
Pressure has a certain influence on viscosity, and viscosity changes with an increase in pressure. The curve appears to have the trend of first decreasing and then rising. When the oil is below the saturation pressure, dissolved gas in the crude oil is constantly separated with the decrease in formation pressure. Under the action of pressure, the volume of crude oil shrinks, the density increases, the molecular spacing becomes smaller, the friction inside the liquid layer increases, and the viscosity of crude oil increases. For the crude oil with 40% CO2 content at 120 °C, when the pressure changes within the range of 5–18 MPa, the viscosity varies in the range of 1.83–1.14 mPa·s. When the pressure is higher than the saturated pressure, the viscosity of crude oil rises sharply with the rise in pressure. This is because the increase in pressure causes the extrusion of crude oil, and the distance between molecules decreases, increasing the density and viscosity of crude oil.
Under certain temperature and pressure conditions, the viscosity of the mixed fluid decreases with increasing CO2 injection amount. This is because CO2 changes the original strong liquid–liquid intermolecular force into weak gas–liquid intermolecular force, destroys the layered structure of macromolecular substances in crude oil, and greatly weakens the intermolecular force. When the molar fraction of CO2 gradually increases, as CO2 plays a role in the extraction of light components in crude oil, the molar fraction of light components in crude oil decreases, and the range of viscosity reduction decreases [24].
The coupling formula for viscosity, temperature, and pressure under the condition of 10% CO2 content:
R2 = 0.9959
The coupling formula for viscosity, temperature and pressure under the condition of 40% CO2 content:
R2 = 0.9354
The coupling formula for viscosity, temperature and pressure under the condition of 90% CO2 content:
R2 = 0.9956
3.3. Experiment on Density of Watered Oil Containing CO2
As shown in Figure 8, Figure 9 and Figure 10, the density of CO2 and watered oil under different pressure and temperature conditions was tested experimentally. As can be seen from the figure, under certain CO2 content and temperature conditions, the density shows a trend of first decreasing and then increasing. When the pressure is less than the saturation pressure, the dissolved gas increases with the increase in pressure, so the crude oil density decreases. When the pressure is higher than the saturation pressure, the gas has been completely dissolved, and the oil is compressed with the increase in pressure, so the density of the oil increases. As can be seen from Figure 8, below the saturation pressure, the density decreases linearly with the increase in pressure at 20 °C, which is as low as 0.89 g/cm3 at 20 MPa. At 70 °C and 120 °C, the density decreases slowly at the initial stage with the increase in pressure, and then the drop rate increases with the increase in pressure. When the pressure increases from 5 MPa to 10 MPa, the density increases by 1.36% and 1.44% at 70 °C and 120 °C, respectively. When the pressure increases from 10 MPa to 15 MPa, the density increases by 2.15% and 2.99%, respectively. The coupling formulas for density, temperature, and pressure under different CO2 contents have been listed in Equations (7)–(9).
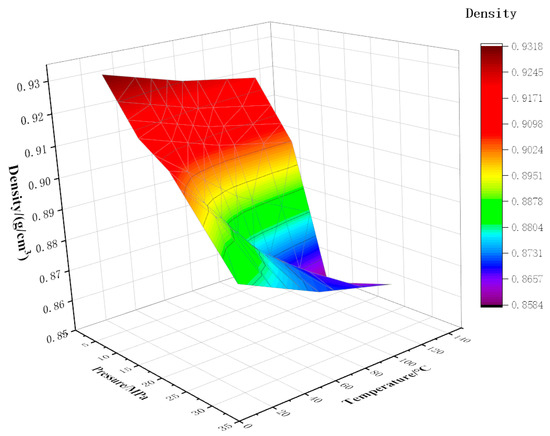
Figure 8.
Variation of density with temperature and pressure at 10% CO2 content.
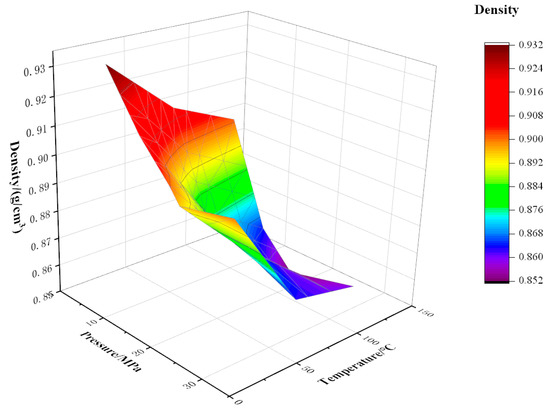
Figure 9.
Variation of density with temperature and pressure at 40% CO2 content.
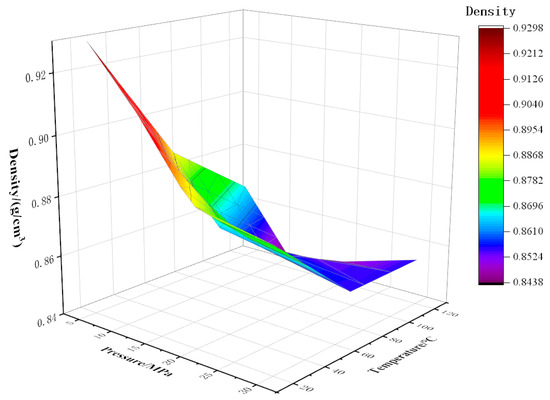
Figure 10.
Variation of density with temperature and pressure at 90% CO2 content.
The coupling formula for density, temperature, and pressure under the condition of 10% CO2 content:
R2 = 0.96232
The coupling formula for density, temperature, and pressure under the condition of 40% CO2 content:
R2 = 0.98049
The coupling formula for density, temperature, and pressure under the condition of 90% CO2 content:
R2 = 0.98911
3.4. Experiment on Solubility of CO2 in Watered Oil
It can be seen from Figure 11 that under the same watered condition, the solubility of CO2 in crude oil increases with decreasing temperature and increasing pressure. Taking the solubility at 20 °C as an example, when the pressure increases from 5 MPa to 15 MPa, the solubility increases by 36.56 cm3/cm3. When the temperature increases from 20 °C to 70 °C, and the pressure is 15 MPa, the variation range of the solution is 16.04 cm3/cm3. It can be seen that during the flow of crude oil in the wellbore of production wells, the solubility of CO2 in crude oil is more sensitive to pressure. As the pressure of the wellbore decreases, the solubility of CO2 will gradually decrease and precipitate from the oil.
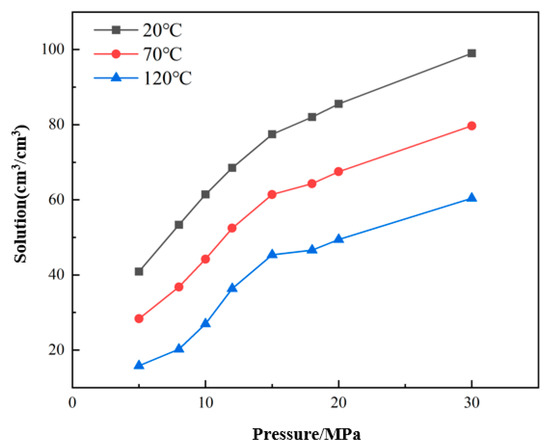
Figure 11.
Solubility of CO2 at different pressures and temperatures.
4. Conclusions
In the middle and late stages of oilfield development, the CO2 gas in the fluid will increase year by year, which makes conventional calculation methods not able to calculate the fluid physical parameters. Therefore, indoor fluid physical property experiments under different pressures, temperatures, and CO2 contents were carried out to study the dissolution characteristics of CO2 in watered oil and the change law of volume factor, viscosity, and density. The main conclusions were as follows:
- (1)
- The solubility of CO2 in watered oil increases with increasing pressure and decreases with increasing temperature. Therefore, in the recovery process, as the pressure decreases, the solubility will gradually decrease, and a large amount of CO2 will be precipitated.
- (2)
- Under different temperature conditions, with the increase in pressure, the volume factor first increases and then decreases, mainly because the increase in pressure improves the compression degree of crude oil, while the increase in temperature causes volume expansion, resulting in an increase in CO2 gas that can be dissolved, resulting in an increase in volume factor. However, above the bubble point pressure, CO2 is already saturated, the fluid is compressed under the influence of pressure, and the volume factor decreases.
- (3)
- The viscosity curve decreases first and then increases with increasing pressure. The main reason is that live crude oil is very sensitive to pressure. When the pressure is lower than the saturation pressure, the gas will dissolve into the oil as the pressure rises, improving the composition of the crude oil and making the viscosity of the crude oil drop sharply. When the pressure is higher than the saturated pressure, the oil will be squeezed with rising pressure, resulting in an increase in the density and viscosity of the oil.
- (4)
- With increasing temperature, the viscosity decreases sharply. When the temperature is above 20 °C, the viscosity changes greatly because the increase in temperature near the freezing point has an obvious effect on the viscosity reduction of crude oil, and the increase in temperature above the freezing point weakens the viscosity reduction effect.
- (5)
- Under certain CO2 content and temperature conditions, the density showed a trend of decreasing first and then increasing. When the pressure is less than the saturation pressure, the dissolved gas increases with increasing pressure, so the density of crude oil decreases. When the pressure is higher than the saturation pressure, the gas has been completely dissolved, and the oil is compressed with increasing pressure, so the density of the oil increases.
Author Contributions
Conceptualization, M.Z. and J.Y.; methodology, H.C. and H.B.; validation, M.L. and G.W.; investigation, H.S., H.B. and X.L.; supervision, L.H. All authors have read and agreed to the published version of the manuscript.
Funding
This research received no external funding.
Data Availability Statement
Data is unavailable due to privacy.
Conflicts of Interest
The authors declare no conflict of interest.
References
- Zhou, W.; Zhou, D.; Fan, K.; Lian, L.; Zhang, L. Eor technology practice of natural gas flooding: A case study on donghe i carboniferous reservoir with the characteristics of ultra-deep, very thick and 3 highs, International Petroleum Technology Conference 2020, IPTC 2020. In Proceedings of the International Petroleum Technology Conference (IPTC), Dhahran, Saudi Arabia, 13–15 January 2020. [Google Scholar]
- Xiong, X.; Liao, T.; Xing, X.; Zhang, Z.; Dong, Z.; Bi, F. Study Progress on Characteristics and Separation of Produced Fluid of CO2 Flooding. XINJANG OIL GAS 2022, 18, 33–39. [Google Scholar]
- Cao, L.; Qian, W.; Gong, P.; Guan, S.; Duan, Y.; He, Y. Application Practices and Evaluation of Gas Injection Technology for CO2 Flooding in Subei Oilfield. XINJANG OIL GAS 2022, 18, 46–50. [Google Scholar]
- Li, Z.; Su, Y.; Li, L.; Hao, Y.; Wang, W.; Meng, Y.; Zhao, A. Evaluation of CO2 storage of water alter nating gas flooding using experimental and numerical simulation methods. Fuel 2022, 311, 122489. [Google Scholar] [CrossRef]
- Klewiah, I.; Berawala, D.S.; Walker, H.C.A.; Andersen, P.Ø.; Nadeau, P.H. Review of experi mental sorption studies of CO2 and CH4 in shales. J. Nat. Gas Sci. Eng. 2020, 73, 103045. [Google Scholar] [CrossRef]
- Berawala, D.S.; Andersen, P.Ø. Evaluation of multicomponent adsorption kinetics for carbon dioxide enhanced gas re covery from tight shales. SPE Reserv. Eval. Eng. 2020, 23, 1060–1076. [Google Scholar] [CrossRef]
- Hossein, D.M.; Hassan, D. Quantification of convective and diffusive transport during CO2 dissolution in oil: A numerical and analytical study. Phys. Fluids 2020, 32, 085110. [Google Scholar]
- Amarasinghe, W.; Fjelde, I.; Guo, Y. CO2 dissolution and convection in oil at realistic reservoir conditions: A visualization study. J. Nat. Gas Sci. Eng. 2021, 95, 104113. [Google Scholar] [CrossRef]
- Li, Z.; Liu, J.; Su, Y.; Fan, L.; Hao, Y.; Huang, L.; Ren, S.; Sun, Y.; Liu, R. Influences of diffusion and advection on dynamic oil-CO2 mixing during CO2 EOR and storage process: Experimental study and numerical modeling at pore-scales. Energy 2023, 267, 126567. [Google Scholar] [CrossRef]
- Kang, S.; Gao, C.; Zhang, S. Scientific Research and Field Application of CO2 immiscible flooding in heavy oil recovery. In Proceedings of the SPE Enhanced Oil Recovery Conference, Kuala Lumpur, Malaysia, 2–4 July 2013. [Google Scholar]
- Saner, W.B.; Patton, J.T. CO2 recovery of heavy oil: Wilmington field test. J. Pet. Technol. 1986, 38, 769–776. [Google Scholar] [CrossRef]
- Zhou, X.; Yuan, Q.; Peng, X.; Zeng, F.; Zhang, L. A critical review of the CO2 huff ‘n’puff process for enhanced heavy oil recovery. Fuel 2018, 215, 813–824. [Google Scholar] [CrossRef]
- Talib, M.Q.A.; Al-Jawad, M.S. Assessment of the Common PVT Correlations in Iraqi Oil Fields. J. Pet. Res. Stud. 2022, 34, 68–87. [Google Scholar]
- Almashan, M.; Narusue, Y.; Morikawa, H. Estimating PVT Properties of Crude Oil Systems Based on a Boosted Decision Tree Regression Modelling Scheme with K-Means Clustering. In Proceedings of the SPE Latin America and Caribbean Petroleum Engineering Conference, Bali, Indonesia, 29–31 October 2019. [Google Scholar]
- Wang, Z.; Sun, B.; Yan, L. Improved Density Correlation for Supercritical CO2. Chem. Eng. Technol. 2015, 38, 75–84. [Google Scholar] [CrossRef]
- Ghasemi, M.; Whitson, C.H. Pvt modeling of complex heavy oil mixtures. J. Pet. Sci. Eng. 2021, 205, 108510. [Google Scholar] [CrossRef]
- Izurieta, A.J.; Iza, A. The PVT Properties of the Ecuadorian Crude Oils. In Proceedings of the SPE Latin America and Caribbean Petroleum Engineering Conference, Buenos Aires, Argentina, 17–19 May 2017. [Google Scholar]
- Middleton, R.S.; Carey, J.W.; Currier, R.P.; Hyman, J.D.; Kang, Q.; Karra, S.; Jiménez-Martínez, J.; Porter, M.L.; Viswanathan, H.S. Shale gas and non-aqueous fracturing fluids: Opportunities and challenges for supercritical CO2. Appl. Energy 2015, 147, 500–509. [Google Scholar] [CrossRef]
- Sanai, K.; Kentaro, N.; Takayuki, S.; Takeo, K.; Kenji, H. Design factors in gas-lift advanced dissolution (GLAD) system for CO2 sequestration into the ocean. Chem. Eng. Sci. 2001, 56, 6205–6210. [Google Scholar]
- Shafaei, M.J.; Abedi, J.; Hassanzadeh, H.; Chen, Z. Reverse gas-lift technology for CO2 storage into deep saline aquifers. Energy 2012, 45, 840–849. [Google Scholar] [CrossRef]
- Li, Y.G.; Park, C.B.; Li, H.B.; Wang, J. Measurement of the PVT property of PP/CO2 solution. Fluid Phase Equilibria 2008, 270, 15–22. [Google Scholar] [CrossRef]
- Hao, Y.; Wu, Z.; Ju, B.; Chen, Y.; Luo, X.; Xinjiang, P. Laboratory investigation of CO2 flooding. In Proceedings of the Nigeria Annual International Conference and Exhibition, Abuja, Nigeria, 2–4 August 2004. [Google Scholar]
- Nguyen, T.A.; Ali, S.F. Effect of nitrogen on the solubility and diffusivity of carbon dioxide into oil and oil recovery by the immiscible WAG process. J. Can. Pet. Technol. 1998, 37, PETSOC-98-02-02. [Google Scholar] [CrossRef]
- Gao, J.; Dan, S.; Yang, T.; Zhang, X.; Yue, H.; Yu, Q. Study on CO2 solubility in heavy oil in Well Ji7, Changji oilfield, Junggar Basin. China Pet. Explor. 2018, 23, 65. [Google Scholar]
Disclaimer/Publisher’s Note: The statements, opinions and data contained in all publications are solely those of the individual author(s) and contributor(s) and not of MDPI and/or the editor(s). MDPI and/or the editor(s) disclaim responsibility for any injury to people or property resulting from any ideas, methods, instructions or products referred to in the content. |
© 2023 by the authors. Licensee MDPI, Basel, Switzerland. This article is an open access article distributed under the terms and conditions of the Creative Commons Attribution (CC BY) license (https://creativecommons.org/licenses/by/4.0/).