Article

Selection of Ideal MSW Incineration and Utilization Technology Routes Using MCDA for Different Waste Utilization Scenarios and Variable Conditions

by
Zakariya Kaneesamkandi
1,*,
Ateekh Ur-Rehman
2 and
Yusuf Siraj Usmani
2
1
Mechanical Engineering Department, King Saud University, Riyadh 11421, Saudi Arabia
2
Industrial Engineering Department, King Saud University, Riyadh 11421, Saudi Arabia
*
Author to whom correspondence should be addressed.
Processes 2023, 11(7), 1921; https://doi.org/10.3390/pr11071921
Submission received: 23 May 2023 / Revised: 19 June 2023 / Accepted: 22 June 2023 / Published: 26 June 2023
(This article belongs to the Section Energy Systems)

Abstract

:
Liability to prevent the consequences of an unhealthy situation due to accumulating toxic and hazardous emissions caused by open dumping of municipal solid waste with increasing urbanization has necessitated a renewed thinking on waste disposal. Grate-fired incineration systems were adopted by urban management in the past and present, but with criticism due to the formation of airborne emissions. Improved combustion methods like fluidized beds are now propagated because of current requirements like efficient energy recovery potential, stricter emission norms, adaptability with urban growth, adaptability to co-firing with other waste like biomass, edible oil wastes or industrial effluent, and integration with conventional energy generation. Such a comprehensive and futuristic approach is more sustainable for the community. A multi-criteria decision-making tool is used to identify the best technology option between grate combustion and fluidized bed combustion for disposing and energy recovery from waste. A total of 10 different collection and disposal options involving two combustion methods, namely, grate combustion and fluidized bed method, are considered. Utilization of the energy is done for three end uses, namely, power generation, water distillation, and district cooling. Two different regions in an arid climate zone are considered for this study under two types of scenarios, namely with recycling and without recycling. The different options are prioritized based on their overall ranking using five major performance factors.

1. Introduction

Waste produced by all levels of human settlements can be the primary cause for air, land, and water pollution, as well as the cause for diseases in man and other living things. Effective disposal is an integral part of urban, semi-urban, and rural management. Currently, the option of simultaneous disposal and energy generation from municipal solid waste (MSW) is being considered as essential by policy makers in order to overcome excessive energy costs resulting from higher generation costs, along with increased demand. Energy demand from different consumption sectors depends on the economic and geographical conditions prevailing in a country.
Waste quantities generated by cities worldwide add up to 1.3 billion tons per year as of 2018, and it is expected to rise to 2.2 billion tons per year by 2025 [1]. Out of the total MSW generated, roughly 70% is landfilled, 19% is recycled, and 11% is used to produce energy [2]. Waste to energy supply chains mitigate both disposal problems and energy demands in economies [3].
Incineration offers an effective means for reducing the volume of MSW generated to much smaller volumes and simultaneous recovery of energy for useful applications. The weight is reduced by up to 60% and volume reduction up to 90% [4]. Since incineration produces certain harmful gaseous products, several combustion and emissions control measures are employed to meet the regulations. Each ton of MSW that is incinerated produces 15–40 kg of hazardous waste [5]. Incineration of MSW is usually achieved by mass burn using grate-firing or fluidized bed firing. Grate-firing is further classified as sloping grate and vibrating grate depending on the method used to move the waste within the furnace. Fluidized bed systems use either the bubbling bed technology or the circulating fluidized bed technology. Developments in reducing emissions like dioxins are encouraging the adoption of incineration as the best waste-to-energy option [6]. Grate-firing requires less fuel preparation before firing and can handle a wide range of fuel quality in terms of its chemical composition as well as its moisture content. Grate firing has seen a long period of development and improvement in terms of the heat transfer aspects and cleaning mechanisms. Grate-firing of some biomass fuels with a high chlorine content (e.g., straw) may suffer from severe deposition and corrosion problems. Biomass fuels have low melting point characteristics because of a high content of potassium, and hence, ash fusion occurs [7]. Fluidized beds (FB) are more adaptable to a wide range of fuel, and they can be simultaneously used for different types of fuel [8]. They are considered to be more environmentally favorable, and emissions can be controlled better due to lower bed temperatures compared to grate-fired systems. The bed material can be used to reduce certain undesirable emissions and agglomerate-forming material by adding suitable chemical agents [7]. FB systems that use MSW as fuel need proper pre-treatment of the waste in order to reduce its size and to remove heavy particles, which can cause difficulties during fluidization. Several pre-treatment methods are adopted to meet required specifications [9].
Desalination processes using thermal energy using Multiple Effect Desalination can be driven by heat produced by the combustion of MSW. The requirement of heat for desalination can be meted out from the heat rejected after generating the required electricity.
District heating or cooling systems’ cooling load depend on the geographical conditions, and this can be provided by the combustion of municipal waste [10,11]. Improvements in the vapor absorption cooling method, which operates using heat from waste incineration, have made it become a viable option.
Multi-criteria decision analysis (MCDA) received a lot of attention from researchers and practitioners in evaluating, assessing, and ranking alternatives across diverse industrial and non-industrial sectors. Multi-criteria decision analysis has been used in the waste management decision-making process in different aspects, which include location of the waste disposal site or plant, technology to be adopted [12], gasification, fermentation, incineration, pyrolysis, and others [13].
Waste-to-energy conversion technology has continuously developed with the following recent improvements like:
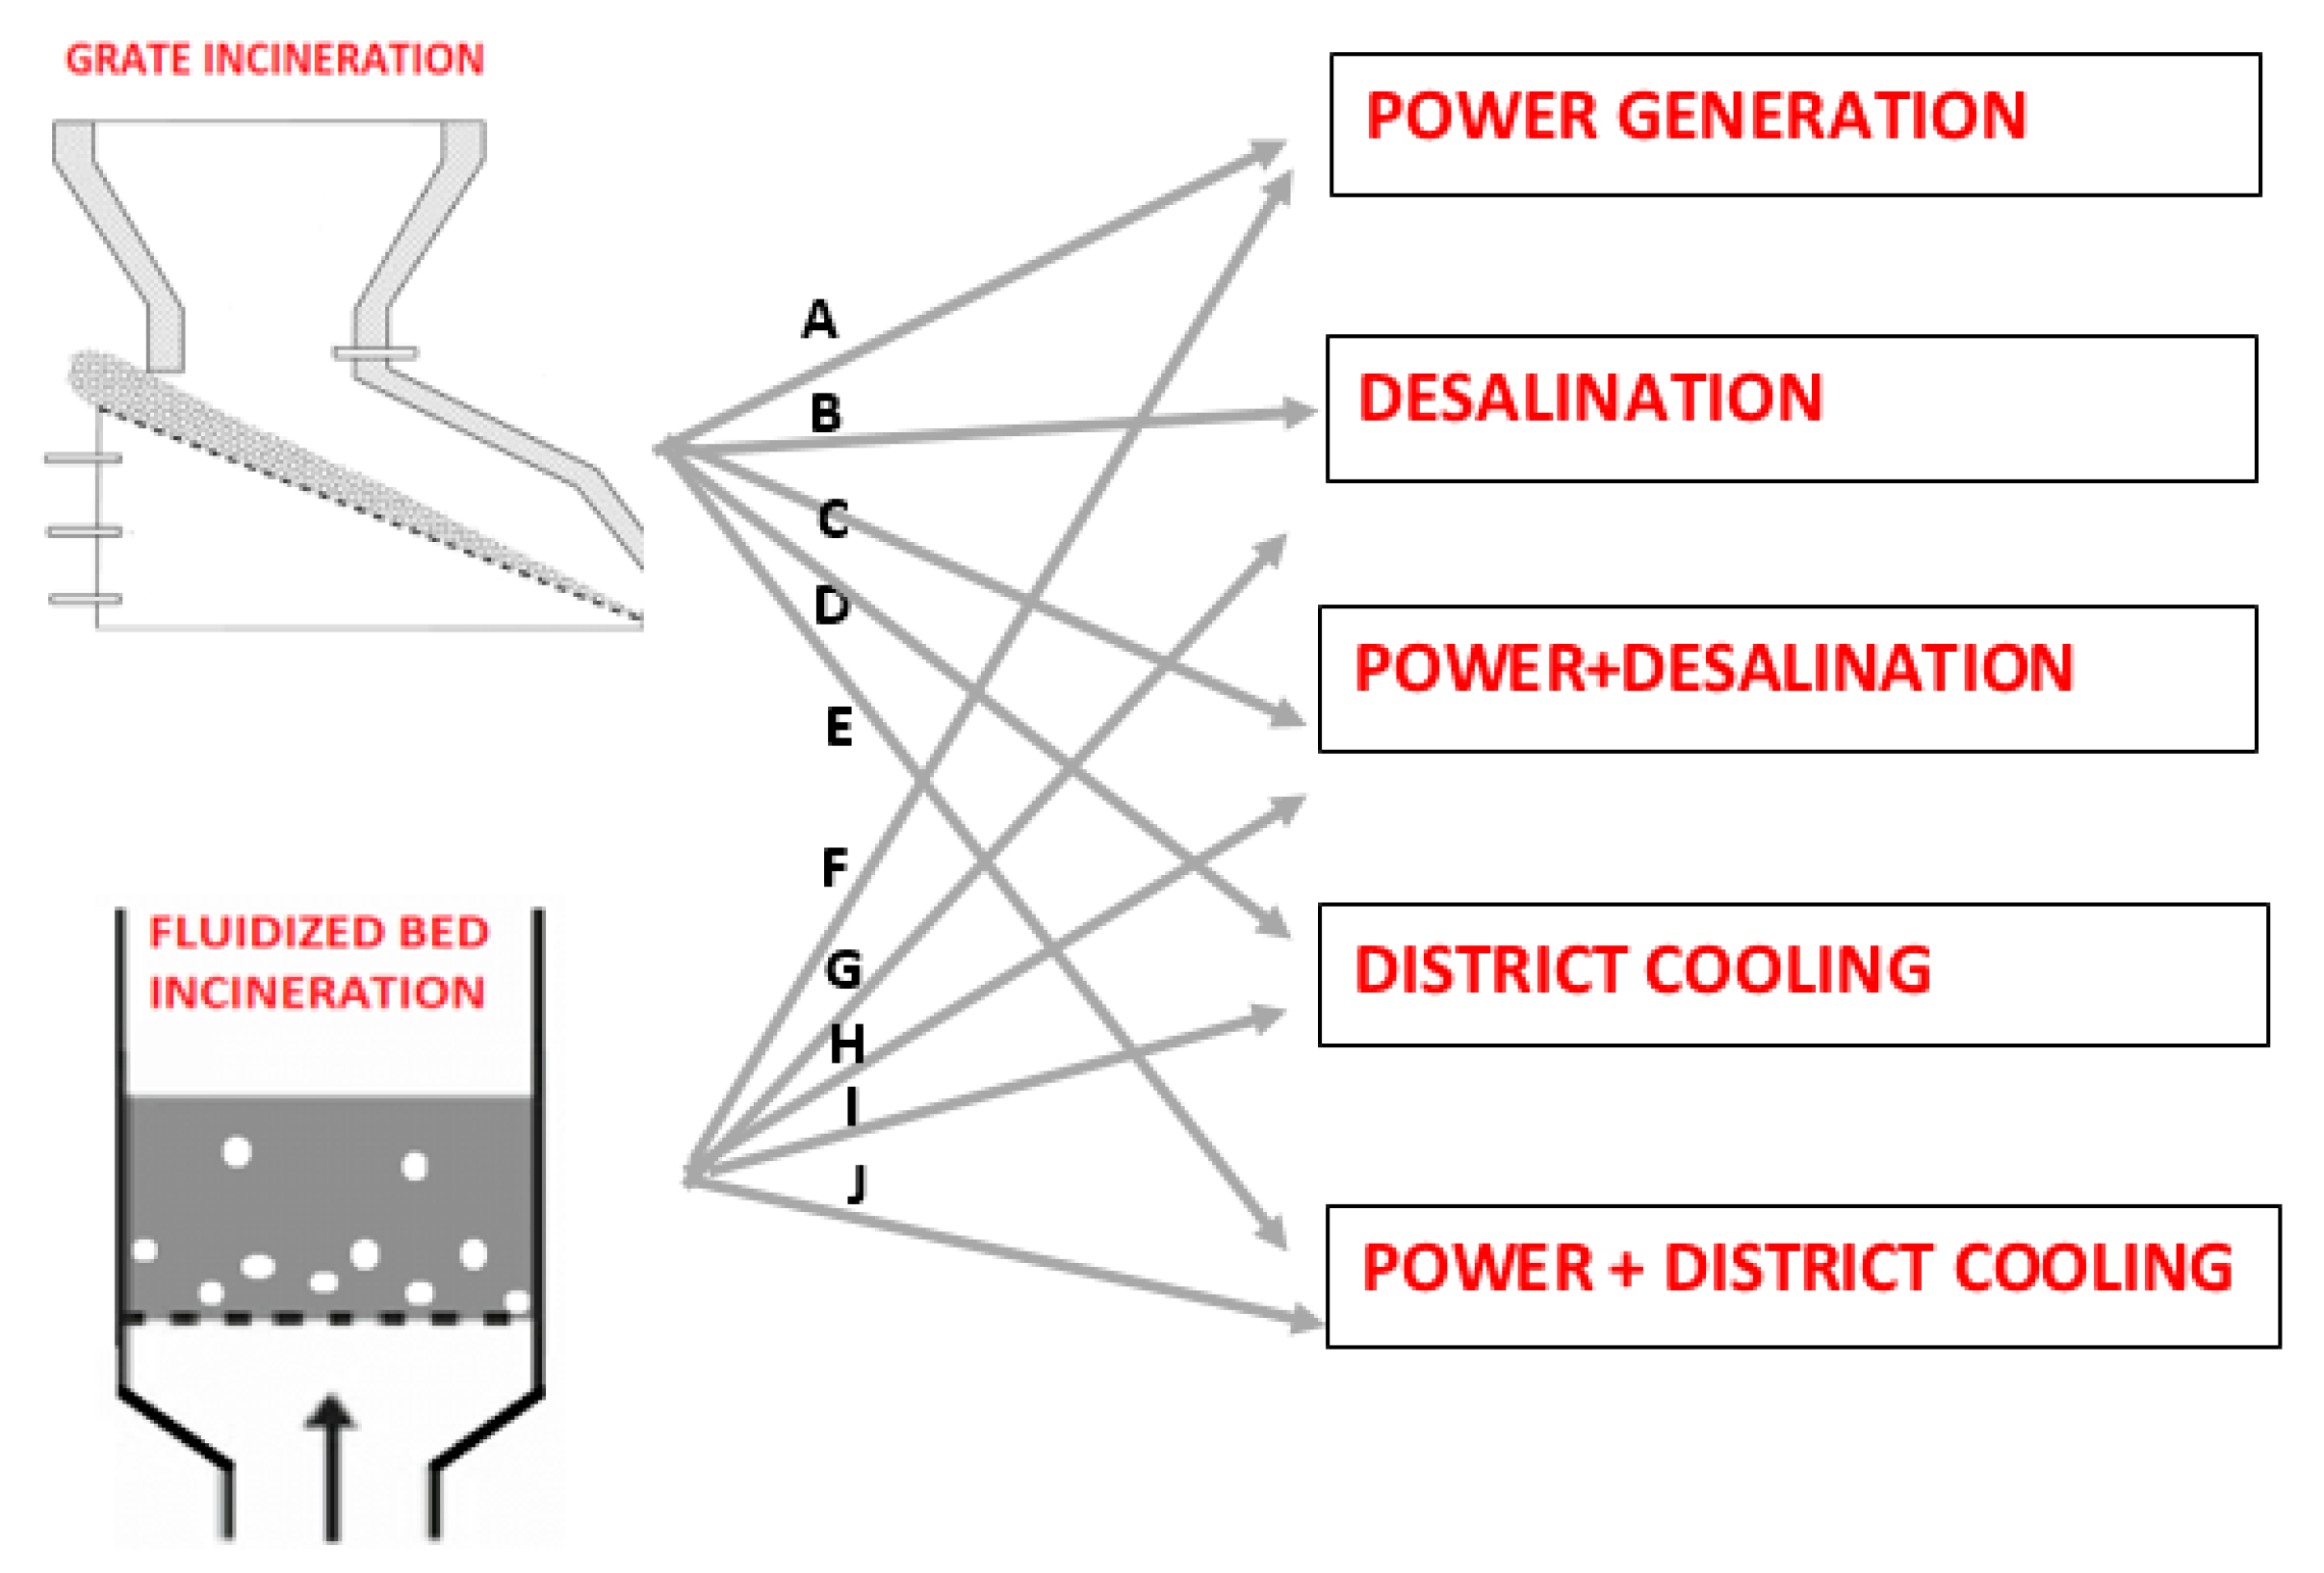
  • Application of fluidized bed incinerator systems with improved emissions cleaning technology
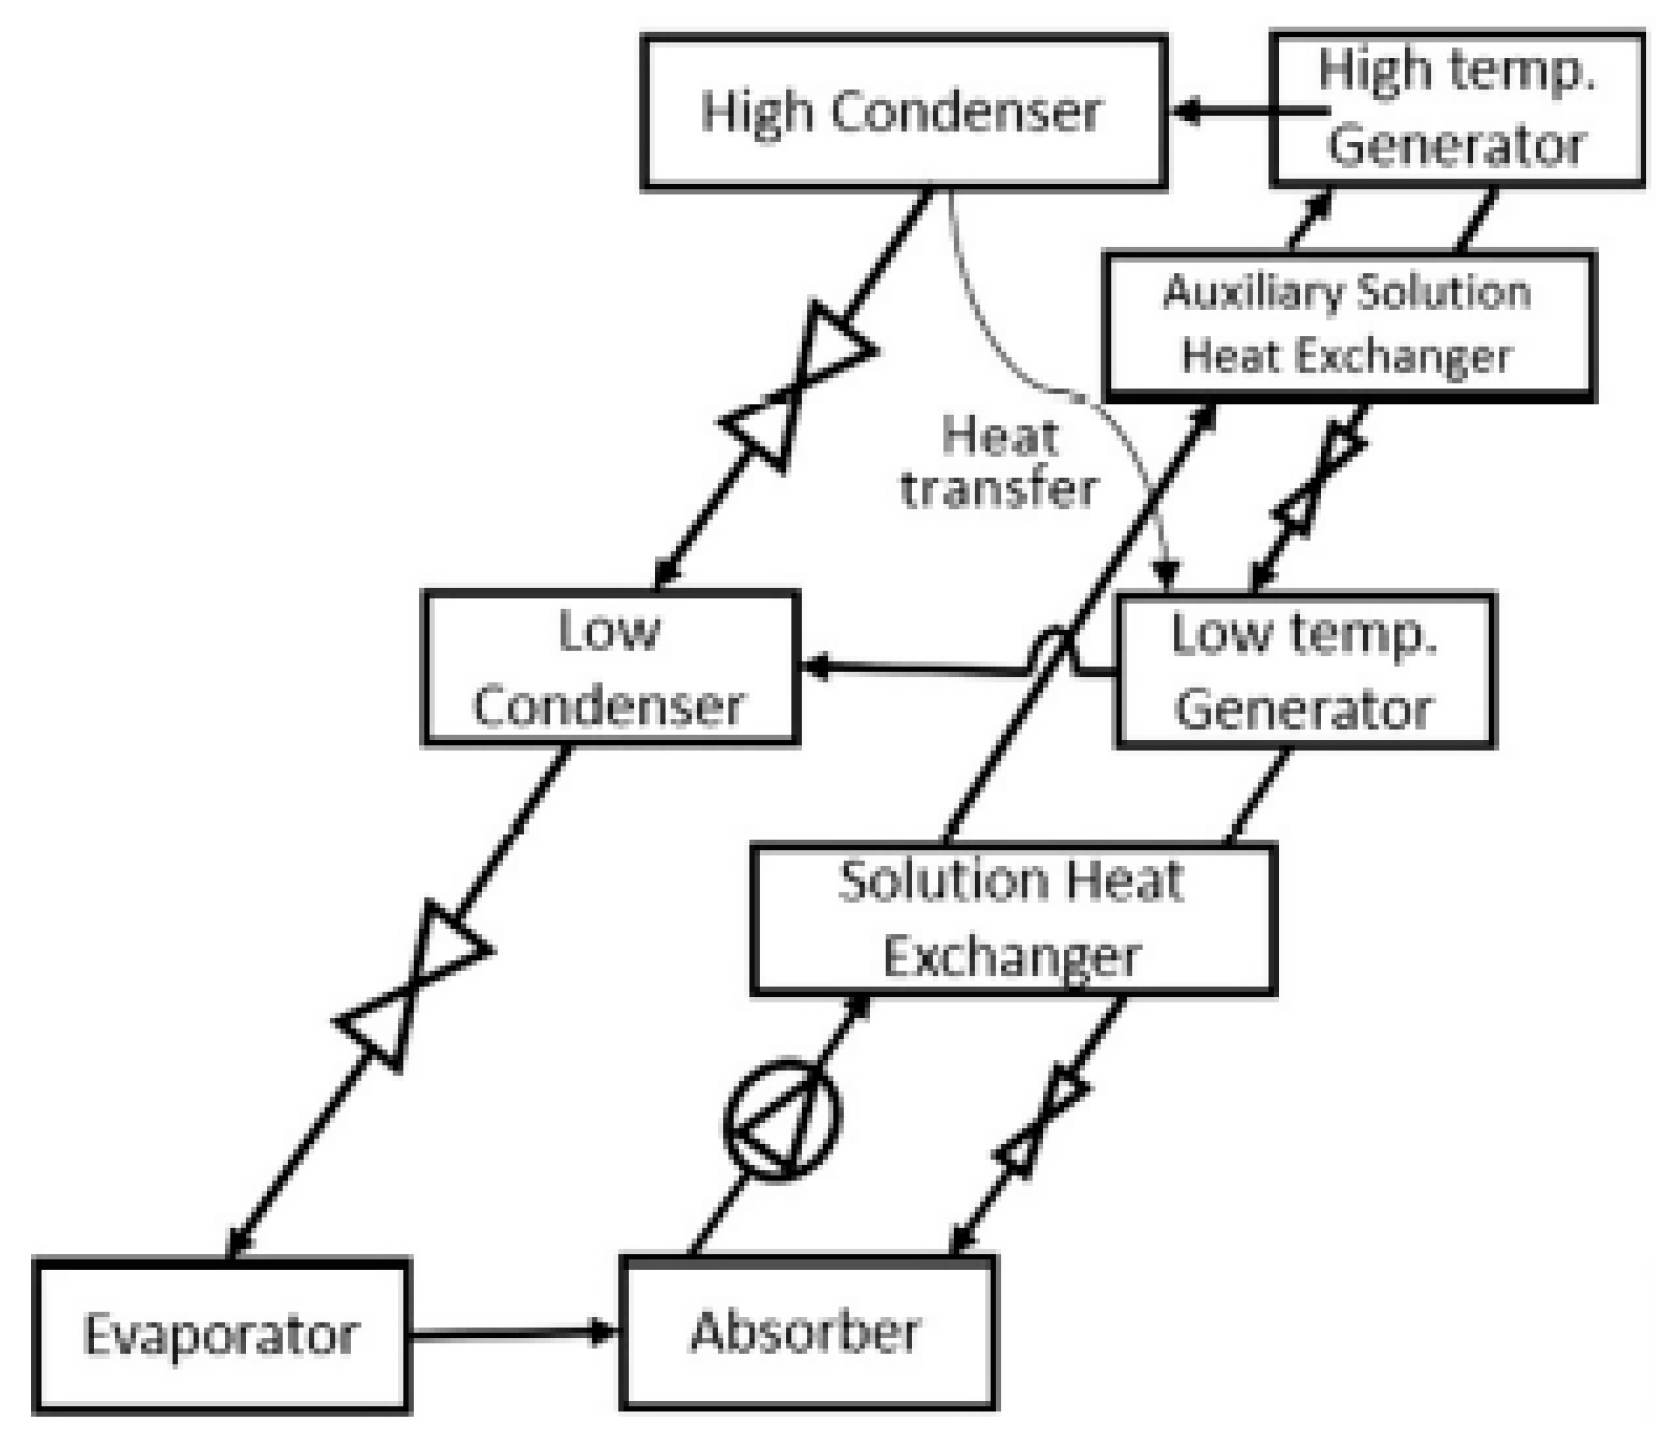
  • Use of the energy from incinerators for operating vapor absorption cooling systems
  • Use of the energy from incinerators for operating water desalination systems
There is a need for an analysis which includes these recent developments, and this study intends to fill this gap. Multi-criteria decision analysis is an ideal tool which has been successfully used in such situations. In order to have an efficient, sustainable, environmentally friendly, and economical method, one should evaluate the trade-offs between the fuel supply requirements, performance opportunities, costs, and environmental risks of alternatives. There is a need to incorporate qualitative and quantitative multiple criteria to compare and assess and do a ranking of the alternative methods. Due to the pressing need for reducing the energy load for growing urban communities, the summer cooling loads, and freshwater requirements, it is necessary to analyze the role of MSW with the help of the above new technologies.
This study does a quantification of the different factors used to assess the performance of two different MSW incineration utilization routes for three specific uses, namely, power generation, desalination, and district cooling system. These factors are calculated from available theoretical methods or taken from published data. Multi-criteria decision analysis (MCDA) is used to analyze the different utilization routes in order to rank them and identify the position of the different methods in terms of their overall performance. The MCDA is applied under two different scenarios, namely, with and without recycling for two different geographical locations in an arid climate zone, designated as Region A and Region B. Region A represents data collected from the Riyadh municipal area and Region B represents data collected from the Dammam municipal area in Saudi Arabia where there is high demand for electrical power, heavy comfort cooling load, and freshwater demand. Similar conditions prevail in certain cities in northern Africa, South America, Australia, and northwest Asia [14].

2. Multiple Criteria and Performance Assessment Factors

Analysis of 10 different utilization options involving 18 factors of performance assessment is done as described in Figure 1. Apart from the six utilization options involving dedicated systems, four other routes involving 50% electricity generation and 50% desalination or cooling are also considered. Utilization options can be further subdivided based on different utilization technologies available, but it is limited to primary options only. End use options are electricity generation, district cooling, and desalination. Multi Effect Desalination (MED) and Vapor Absorption Refrigeration (VAR) cooling methods were considered in this study. Energy generation options are the grate firing and fluidized bed firing. Utilization options are named from A to J. For example, route D indicates a power generation option using a fluidized bed incineration system.

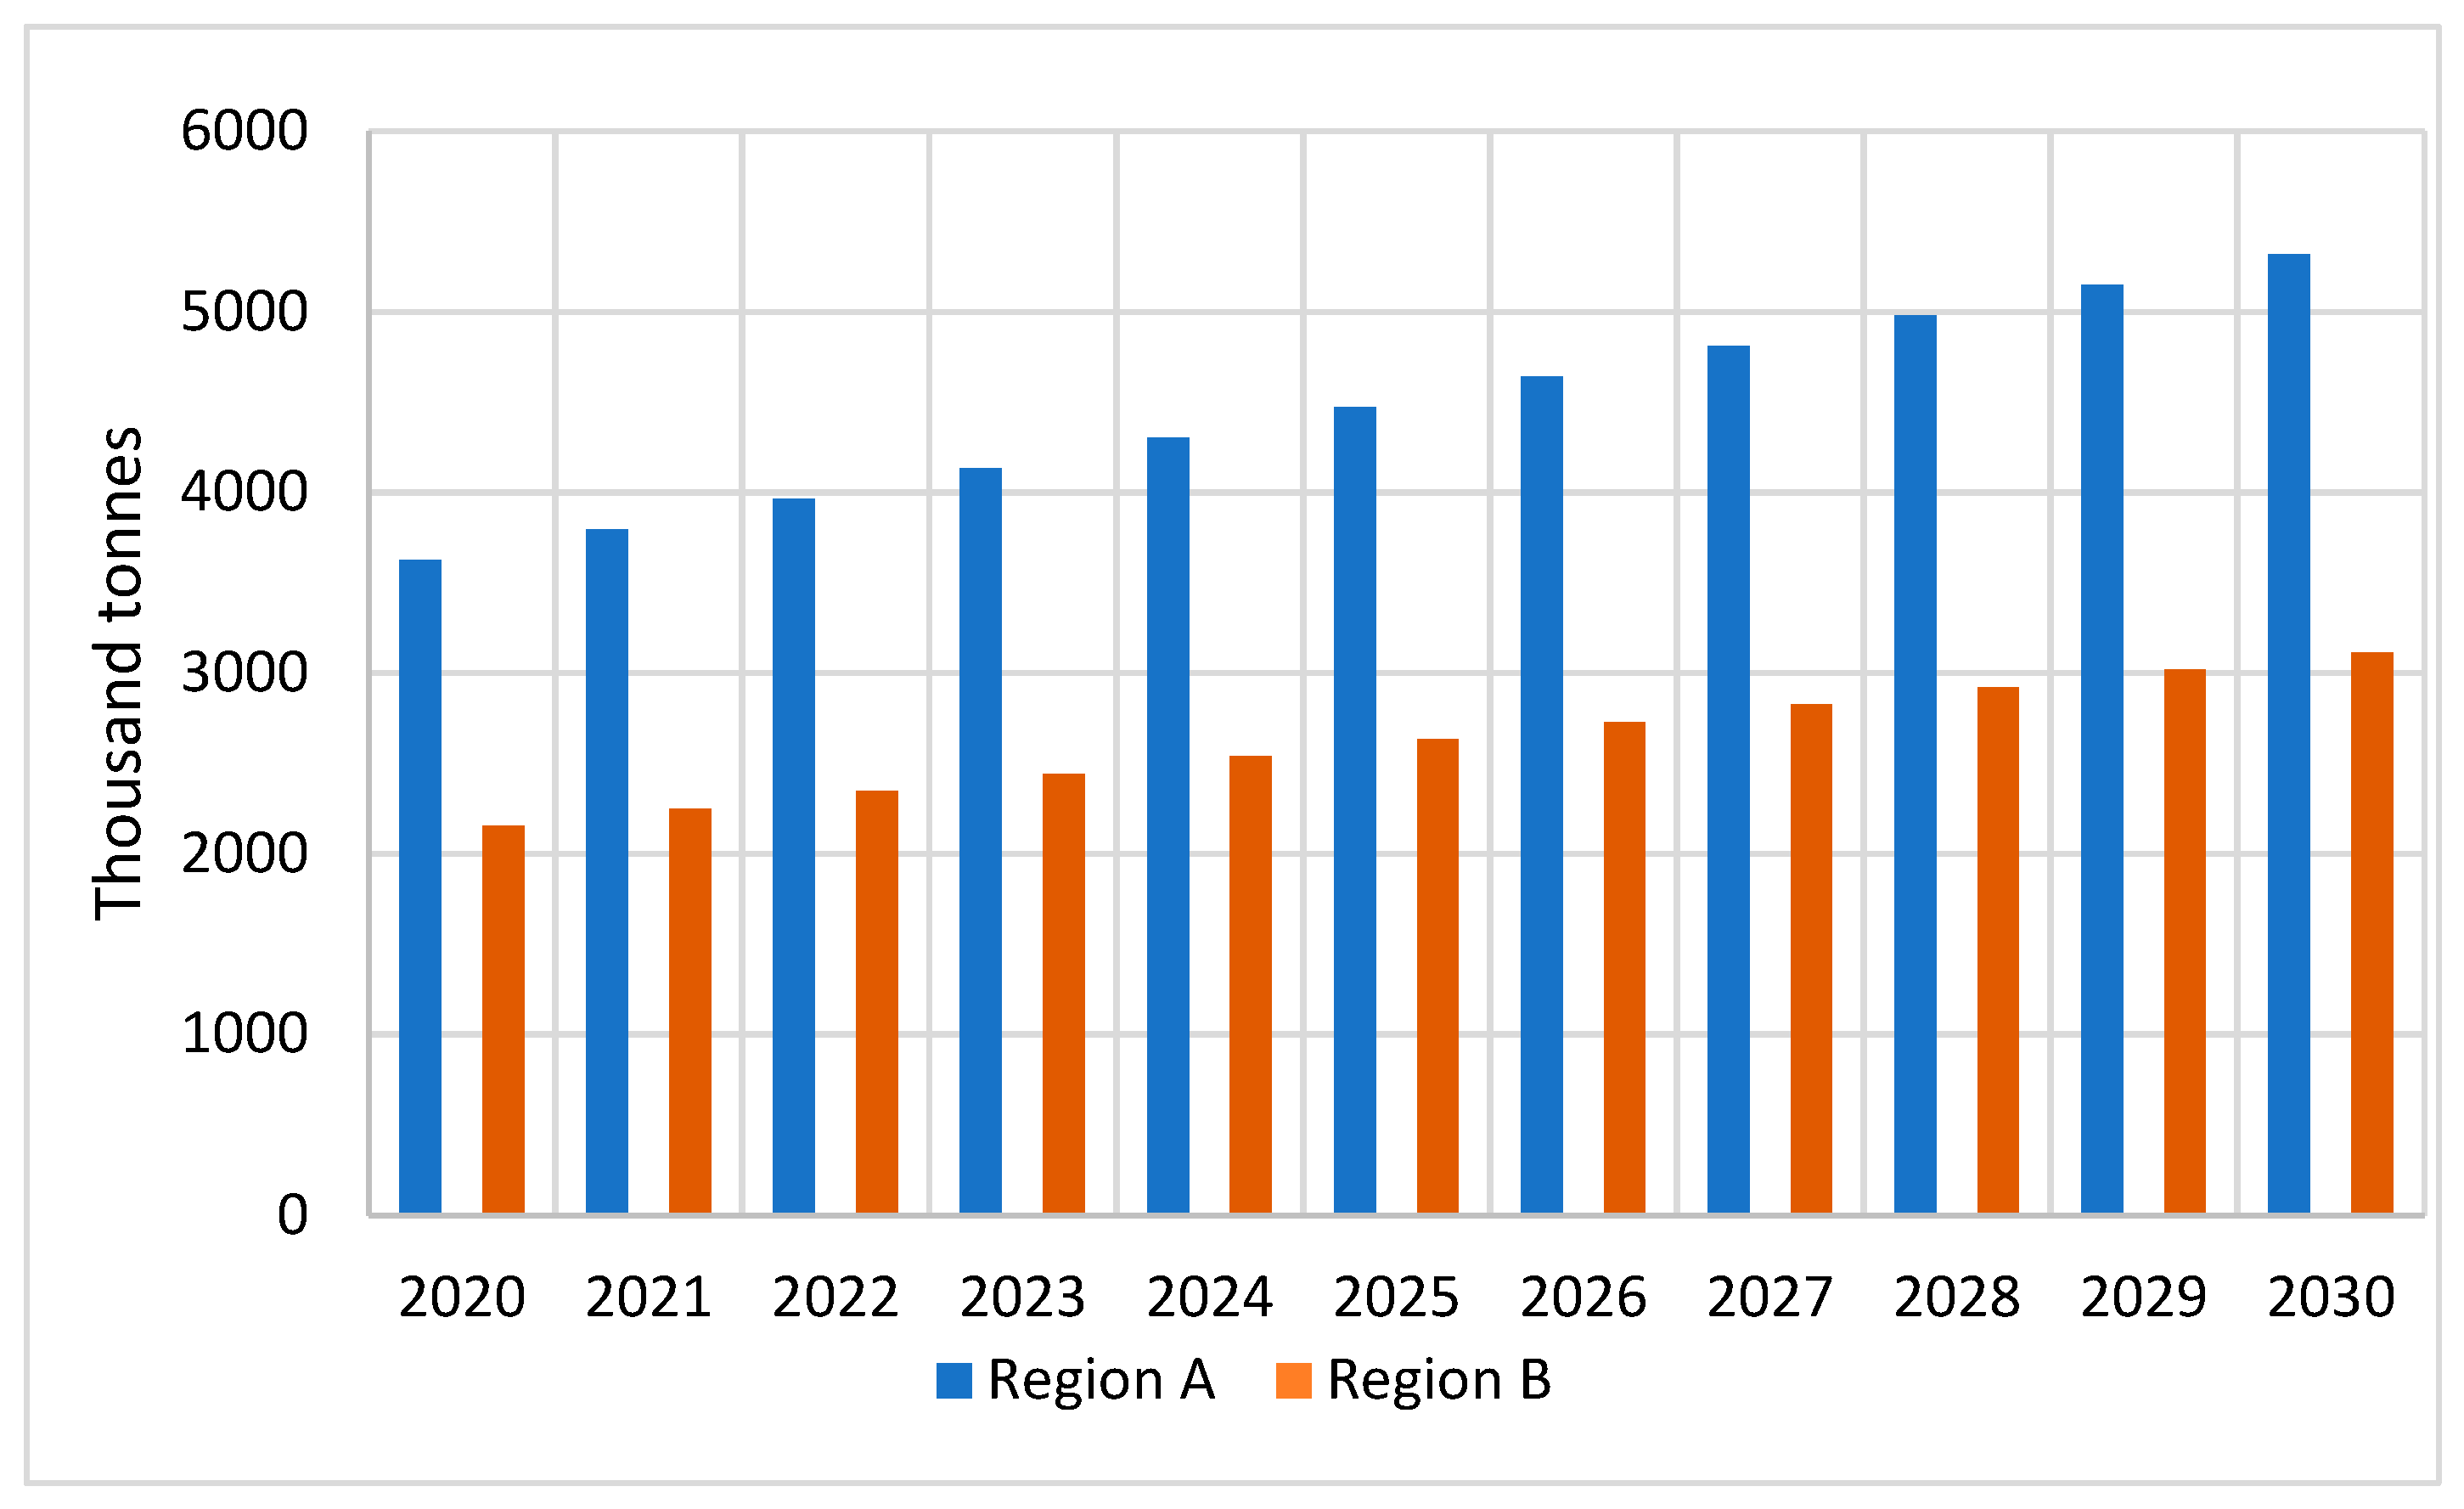
3. Municipal Waste Collection, Disposal and Characteristics

Centralized waste collection and disposal requires extensive infrastructure and associated investment and management requirements. Various techniques of waste disposal have come up based on the differences in the quality and quantity of waste produced, requiring specialized approaches in certain regions necessitating a combined approach for waste handling [15]. A large, centralized incineration-based power plant that caters to electricity needs combined with a series of decentralized waste treatment facilities for gas generation and composting, as well as sanitary and filling in certain areas, is a practical approach adopted by certain urban managements [16]. Selective collection and disposal of MSW involves collection based on the composition of waste required for a particular disposal mechanism from producers of the prescribed quality. This method is ideally suited when recycling is possible to recover secondary raw materials that are present in the waste. About 47 centralized. A total of 7% of the waste is collected selectively in the European union [17,18]. Selective collection reduces the combustibles in MSW, making them more suitable for other methods of disposal rather than incineration. The other technologies include anaerobic digestion or composting. Forecast of the solid waste generation was reported for the period 2020 to 2030 [19] and the data is given in Figure 2. The data is obtained by extrapolating the published data for both Region A and Region B.
Analysis of the different components of the MSW produced in Saudi Arabia was done as per ASTM D5231-92 standards, and the results are given in Table 1. This data was taken from waste samples collected in Region A (representing the Riyadh municipality) and Region B (representing the Dammam municipality).
Energy produced per day by the combustion of MSW is a function of the waste generation rate ( m ˙   i n   k g / d a y ) , the lower heating value of the waste (LHV in kWh/kg), and the efficiency of the turbine, generator, and combustion device ( η T , η g   a n d   η c ), as in Equation (1) [20].
Electrical   energy   produced   per   day   in   kWh ,   Q E = m ˙ × L H V × η T × η g × η c
Energy required for water desalination in the case of the MED method depends on the thermal and electrical energy produced. A total of 1 m3 of freshwater production requires 1.5–2.5 kWh of electrical energy and 5–8.5 kWh equivalent of thermal energy. The total energy produced from waste combustion can be utilized for water production, or a part of it (kw) can be used. Taking a maximum total value of 11 kWh, the water production rate can be determined from Equation (2) [15].
Water   produced   in   m 3   per   day = k w × Q E 11
Vapor absorption cooling machines utilize heat for achieving the cooling with the help of a generator/absorber mechanism. A refrigerant absorbent pair of fluids is used where the absorbent absorbs the vapor refrigerant gas coming out of the evaporator (cooling area) and the strong solution of absorber/refrigerant is pumped to the generator. The external heat is applied to the generator, thereby boiling away the refrigerant at a higher pressure for further condensation and evaporation in the evaporator. In the case of the double effect system, the hot refrigerant vapor produced in the first, called the high-temperature generator, passes through the auxiliary solution heat exchanger to the low-temperature heat exchanger for one more stage of vapor removal using the heat drawn from the high-temperature generator. The low-temperature refrigerant vapor produced in the low-temperature generator travels to the condenser. Double effect can be either in a series type or parallel flow type. In the series method, dilute solution from the absorber is pumped completely to the high-temperature generator. As the refrigerant evaporates and moves to the low-temperature generator, the absorbent solution becomes concentrated. The resulting intermediate solution flows to the low-temperature generator. In the case of the parallel flow method, the dilute solution from the absorber is divided between the low-temperature and high-temperature generators. Both streams of dilute solution are concentrated in the generators and come together again and return to the absorber. The cooling rate produced with the above waste generation capacity of m ˙ kg per day depends on the coefficient of performance (COP) of the VAR cooling system. The total energy produced from waste combustion can be utilized for cooling, or a part of it (kc) can be used. COP of two-stage VAR systems, as given in Figure 3, can reach up to 1.2 for a lithium bromide/water absorbent/refrigerant combination. Figure 3 shows the basic cycle of a lithium bromide-water VAR two-stage cooling system in which ammonia acts as the refrigerant and water acts as the absorbent. The cooling rate of the double effect system is given by Equation (3) [21].
Cooling   rate   produced   ( kW ) = k c × m ˙ × L H V × η E × η c × C O P 24 × 3600
The outputs from the different processes are calculated and presented in Table 2 using Equations (1)–(3) given above.

4. Performance Assessment Factors

The performance assessment factors used for the analysis are classified into the following categories in order to apply the MCDA method (Table 3):

4.1. Fuel Supply Requirements

The MSW heating value (kJ/kg) must meet the requirements for combustion without affecting the furnace temperature and heat output. Recycling of the waste reduces the net lower heating value of the waste. Combustion air preheating is an effective option in this case apart from the fuel drying option. The fuel characteristics in a region are determined by the economic level, weather conditions, collection, and storage conditions. Grate combustion of MSW is adopted in several countries, and it is the most developed in terms of technological advancements. The minimum lower heating value required for grate-fired systems is 4 MJ/kg [22]. In the case of FB, it is possible to go for lower heating value fuel with the help of support fuel. Additionally, higher levels of water in waste lead to a reduction in the heat output [23]. Grate-fired systems are more tolerable for fuel moisture variation compared to FB systems. The end use application also determines the fuel heating value requirement. In the case of dedicated water distillation and district cooling requirements, the heat and temperature requirements are much less compared to steam generation for power generation. Considering these factors, the maximum heating value is required by power generation options using grate firing A, C, and E, followed by power generation options using FBC, namely, F, H, and J. This is followed by the desalination options, namely B and G, and then the district cooling options, D and I. Moisture in the fuel reduces the combustion temperature and efficiency because heat is used to evaporate the moisture in the fuel. Higher moisture content resulted in a decrease in ignition front velocity during combustion and the overall burning rate with a permissible limit between 20 and 40% [24]. Fuel preparation is required extensively in the case of fluidized bed firing due to the fuel size and moisture content limitations. Power generation plants using fluidized bed combustion require maximum fuel preparation through size reduction and drying, followed by grate-fired systems. Dedicated distillation and cooling systems do not require very high combustion temperatures due to their lower operating temperature requirements. Hence, the fuel preparations are relatively less. Storage of MSW is associated with problems of the formation of methane and undesirable odors, as well as leachates. Additional costs are incurred due to the requirement for continuous monitoring of the waste during storage. Storage becomes essential when MSW is used for cooling or desalination processes due to variation in the plant loads during different seasons. The rank for storage problems for power generation is 1 due to minimum storage requirement, 3 for combined power generation and distillation or cooling, and 4 for dedicated distillation or cooling systems.

4.2. Incinerator Performance

The incinerators used for energy generation from MSW as well as the end user equipment will have variations in the supply and demand due to operational and external conditions. Power supply stoppages due to maintenance, temporary increase in demand, increase in freshwater demand, or cooling loads due to climatic conditions are some of the conditions. Hence, the capacity to handle these variations is necessary in order to ensure smooth operation. FBC systems can handle these variations better than grate combustion systems due to their design features [25]. Cooling systems using vapor absorption methods are highly flexible in their operation capacities compared to vapor compression systems [26]. The ranks are provided accordingly for the different options. The efficiency of GF systems is less than that of FBC systems mainly due to the lower level of losses from the flue gas produced [27]. Conversion of this heat produced to directly operate a water distillation system or cooling system has higher exergy efficiency compared to use of electricity for the same, since lower grade energy is used. Power production using the Rankine cycle shows maximum efficiency compared to the utilization of heat for distillation or cooling. FB systems are highly adaptable to co-firing with alternate conventional or non-conventional fuel compared to GF systems. Operation and maintenance costs for FB systems are higher due to gas cleaning systems required due to high-fly ash.

4.3. End Use Performance

Power generation, water desalination, and district cooling systems are the three end uses considered in this study. Combustion in incinerators used for power generation through the Rankine cycle depends on the maximum temperature of the combustion system, due to which the flue gas loss that carries away maximum heat is the primary factor that determines boiler efficiency. This boiler efficiency, η, is given by Equation (4) [7].
η = 1 m f g C p f g T o u t T a / LHV
In the above equation m f g is the mass of flue gas produced per kilogram of combustibles in the MSW, C p f g is the specific heat of the flue gas, T o u t is the outlet temperature of the flue gas, T a is the ambient temperature, and LHV is the lower heating value of the MSW. GF systems operate at higher temperatures, resulting in higher efficiencies compared to FB systems. In the case of exergy efficiency, higher temperatures produce better performance in the case of power generation, but the exergy efficiency of the desalination system is less due to operation at less than the maximum possible temperature range and is still less for cooling systems which require minimum temperature.
The exergy efficiency (ψ) of a steam power plant depends on the net output work produced and is given by Equation (5) [28].
ψ = w ˙ n e t m ˙ f u e l × L H V
In the above equation, m ˙ f u e l is the mass flow rate of the fuel used and LHV is the lower calorific vale of the fuel.
The percentage of the total requirement is the percentage of the energy shared by the different ends used out of the total energy required for the projected 2030 energy requirement.

4.4. Emissions Factors

The ratio of the bottom ash to fly ash quantity in the case of a fluidized bed is 30/70, and for grate-firing it is 90/10 [29]. A fly ash problem is more of an environmental problem compared to bottom ash. Removal of fly ash requires extensive arrangements to remove the particles. Hence, this value is to be maximized. Atmospheric emissions depend on the characteristics of the MSW used as well as the inclusion of other fuels, if any. Nitrogen oxides are produced in oxygen-rich areas of the furnace, and they are increased at higher temperatures. GF systems which have higher operating temperatures result in higher levels of nitrogen oxides. Modifications in furnace design are possible to prevent high temperature zones within the furnace in order to reduce nitrogen oxide formation. Some hydrocarbon emissions are possible when volatile contents in the MSW are high. Hydrocarbon emissions can be reduced by using certain additives along with the bed material in FB incinerators. On average, every 1000 kg of MSW produces 1200 kg of carbon dioxide in the case of grate-firing and 1250 kg in the case of fluidized bed firing. The combustion efficiency improvement in the fluidized bed results in higher emissions. However, the large quantity of bottom ash carries higher levels of unburnt in the case of grate-fired systems. Carbon monoxide is another pollutant which is produced in waste combustion. Recent developments in fluidized bed systems have resulted in negligible carbon monoxide generation [30,31,32]. Methane is another emission which is 23 times more harmful than carbon dioxide in terms of global warming impact. Improvement in the combustion process has resulted in the completed prevention of methane generation during combustion. However, during the storage and handling process of the waste, the possibility of methane generation still exists, and it is necessary to take suitable preventive measures. Formation of nitrous oxide is much less in fluidized bed combustion compared to grate-firing, mainly due to lower bed temperatures. Levels of up to 12 mg/m3 have been noted in the case of a grate-fired incineration plant with a 50% reduction in FB firing [33]. Leachate problems are high during the storage of MSW in the yards. Grate-firing systems require more storage compared to FB systems that can operate with alternate solid, liquid, or gaseous fuel. Usage of the waste for cooling purposes requires storage, especially in winters, and hence the consequent leachate issues are relatively higher. This gives a ranking of 1 for FB systems, 2 for FB systems for district cooling, 3 for grate-firing systems, and 4 for grate-firing district cooling applications.

4.5. Economic Factors

MSW collection cost depends on different factors like the investment and maintenance of the collection bins and collection vehicles, operating, and administrative costs and costs involved in maintaining the legal restrictions during handling and transportation [34,35]. The investment cost of FB systems is normally 10% less than great-fired systems. Pre-treatment of the waste is essential in the case of FB systems in order to meet the fluidization requirements, as well as to maintain the combustion requirements. Fuel sizes are to be in the range of 5–10 cm [36]. Costs reported in the year 2015 have been adjusted to current costs with an appreciation rate of 10% per year. The average fuel preparation costs are claimed to be between 21.24 USD per ton of waste [37]. After converting freshwater production and the cooling requirements to equivalent energy values, the levelized cost of energy (LCOE) is calculated from the investment, operation, and maintenance cost, as well as the energy equivalent of the different end use technologies considered above for a 15-year duration using Equation (6) [38].
L C O E = t = 1 n I t + M t + F t ( 1 + r ) t t = 1 n E t ( 1 + r ) t
It:investment expenditures in the year t
Mt:operations and maintenance expenditures in the year t
Ft:fuel expenditures in the year t
Et:electrical energy generated in the year t
r:discount rate taken as 10%
n:expected lifetime of system or power station taken as 15 years

5. MCDM Approach to Evaluate Ideal MSW Incineration and Utilization Technology

The objective is to determine suitable weights for the evaluation of ideal MSW incineration and utilization technology. The entropy weight method by Shannon is used. The smaller the entropy value is, the smaller the disorder degree of the selection criterion is. Here in the paper, the entropy weight method is adopted to determine the weight of the criterion and sub-criterion related to the evaluation of ideal MSW incineration and utilization of technology for energy recovery from waste. The MCDM approach can be applied when a set of alternative waste treatment methods is to be ranked according to a set of criteria. The adopted MCDM approach is straightforward, the concept permits the pursuit of the best alternatives for each criterion depicted in a simple mathematical form, and the criteria weights are incorporated into the comparison procedures. Select the alternative disposing of MSW and energy recovery from waste method that is the closest to the ideal disposing of MSW and energy recovery from waste and farthest from the negative ideal disposing of MSW and energy recovery from the waste method. For a given set of m alternatives (options) and n attributes/criteria and the score of each available disposing of MSW and energy recovery from waste method with respect to each criterion, refer to Table 3. The details of the evaluation method using the MCDM approach are presented in the following subsections.

5.1. Structure of the Decision Matrix and Its Standardization

Supposing there are m MSW incineration options on hand and n evaluation criteria for their evaluation, Xij is the jth evaluation criterion’s value in the ith MSW incineration option. In order to eliminate the influence of criteria dimension on incommensurability, it is necessary to standardize criteria using the equations of relative optimum membership degree. To the benefit (maximize) criterion, the attribute value of the jth criterion in the ith MSW incineration option can be standardized by using Equation (7) [39,40,41], whereas for a minimization criterion, the attribute value of the jth criterion in the ith MSW incineration option can be standardized by using Equation (8) [39,40,41].
S i j = X ij min j X i j max j X i j min j X i j
S i j = max j X i j X i j max j X i j min j X i j
In Equations (7) and (8), Sij is the standardized criterion value for the jth criterion of the ith alternative MSW incineration option; Xij is the jth criterion’s value for the ith alternative MSW incineration option, and (i = 1, …, m) and (j = 1, …, n). Supposing the evaluation set of multi-attribute decision-making problems has the jth criterion’s value in the ith MSW incineration option Xij, then the decision matrix is X = [Xij]m × n; refer to below Table 3.
Standardization of all evaluation criteria for the given set of MSW incineration options, the structure of the decision matrix is expressed as Equation (9) [39,40,41].
S i j ' = S 11 S 12 S 1 n : : : : : : : : S m 1 S m 2 S m n
After standardization of all evaluation criteria for all given MSW incineration options (refer to Equations (7)–(9)), the decision matrix is expressed for each MSW incineration option type as here below in Table 4.

5.2. Estimation of Criterion Entropy Weights

The entropy weight represents useful information of the criterion-related MSW incineration and utilization technology evaluation. Note that the higher the entropy weight of the evaluation criterion, the more important the criterion, and vice versa, whereas the entropy weight Ej of the jth criterion of the ith alternative MSW incineration and utilization technology is determined by Equation (10). Subsequently, based on Ej of the jth criterion, Wj, the criterion entropy weight, is determined by using Equation (11) [39,40,41].
E j = i = 1 m [ S i j × l n ( S i j ) ] ln ( m )
W j = 1 E j [ 1 j = 1 n E j ]
Using standardization of all evaluation criteria, Wj, an entropy weight of the jth criterion, is determined by Equations (10) and (11). Obtained Ej values for each MSW incineration and utilization technology evaluation criterion (j) are presented here below in Table 5.

5.3. Normalization of the Decision Matrix

In order to eliminate the influence of criteria dimension and its variation range on MSW incineration and utilization technology evaluation results, it is necessary to normalize the original matrix to ensure that all the attributes are equivalent and the same format. Then, the normalized decision matrix Rij is obtained using Equation (12) [39,40,41].
R i j = X i j X i j 2
After normalization of all evaluation criteria for all given MSW incineration and utilization technologies (refer to Equation (11)), the decision matrix is expressed for each operating scenario. Sample results for a scenario are as here below in Table 6.
A-GF combustion with power generation. B-GF combustion with desalination. C-GF combustion with power generation + desalination. D-GF combustion with district cooling. E-GF combustion with power generation + district cooling. F-FB combustion with power generation. G-FB combustion with desalination. H-FB combustion with power generation + desalination. I-FB combustion with district cooling. J-FB combustion with power generation + district cooling.

5.4. Determine Best and Worst MSW Incineration and Utilization Technologies for a Given Criterion

Multiply each element of the above normalized decision matrix by its associated entropy weight Wj. The decision matrix is obtained using below Equation (13) [39,40,41].
V i j = W j × R i j
The outcome of the above Equation (12) results in a set of best and worst solutions and are obtained using Equations (14) and (15), respectively [39,40,41].
V + = B e s t s o u l t i o n = V 1 + , V j + , V n +
In Equation (14)
V j + = m a x i V i j i f   j m a x i m i z a t i o n   c r i t e r i a ; m i n i V i j i f   j m i n i m i z a t i o n   c r i t e r i a
V = W o r s t s o u l t i o n = V 1 , V j , V n
In Equation (15)
V j = m i n i V i j i f   j m i n i m i z a t i o n   c r i t e r i a ; m a x i V i j i f   j m a x i m i z a t i o n   c r i t e r i a

5.5. Determine the Closeness to Ideal Solution for Each Alternative MSW Incineration and Utilization Technologies for a Given Criterion and Ranking the Alternative

For a given alternative MSW incineration and utilization technology for a given criterion, its distance from the best ideal incineration and utilization technology strategy is obtained using Equation (16) [39,40,41].
D i + = j ( V j + V i j )
For a given MSW incineration and utilization technology, its distance from the worst ideal MSW incineration and utilization technology is obtained using Equation (17) [39,40,41].
D i = j ( V j V i j )
For a given MSW incineration and utilization technology, its closeness to ideal MSW incineration and utilization technology is obtained using Equation (18) [39,40,41].
C i = D i D i + D i
In the above Equation (18), Ci value ranges in between one and zero. The alternative MSW incineration and utilization technology i with maximum positive value of Ci is ranked number one. Thus, the decision matrix of four operating scenarios and corresponding 10 MSW incineration and utilization technologies and 20 evaluation criterions are established according to the data in Table 6. The normalized decision matrix is established, and the weighted decision matrix is estimated, and the best solution and the worst solution values are obtained by using Equations (14) and (15), respectively.

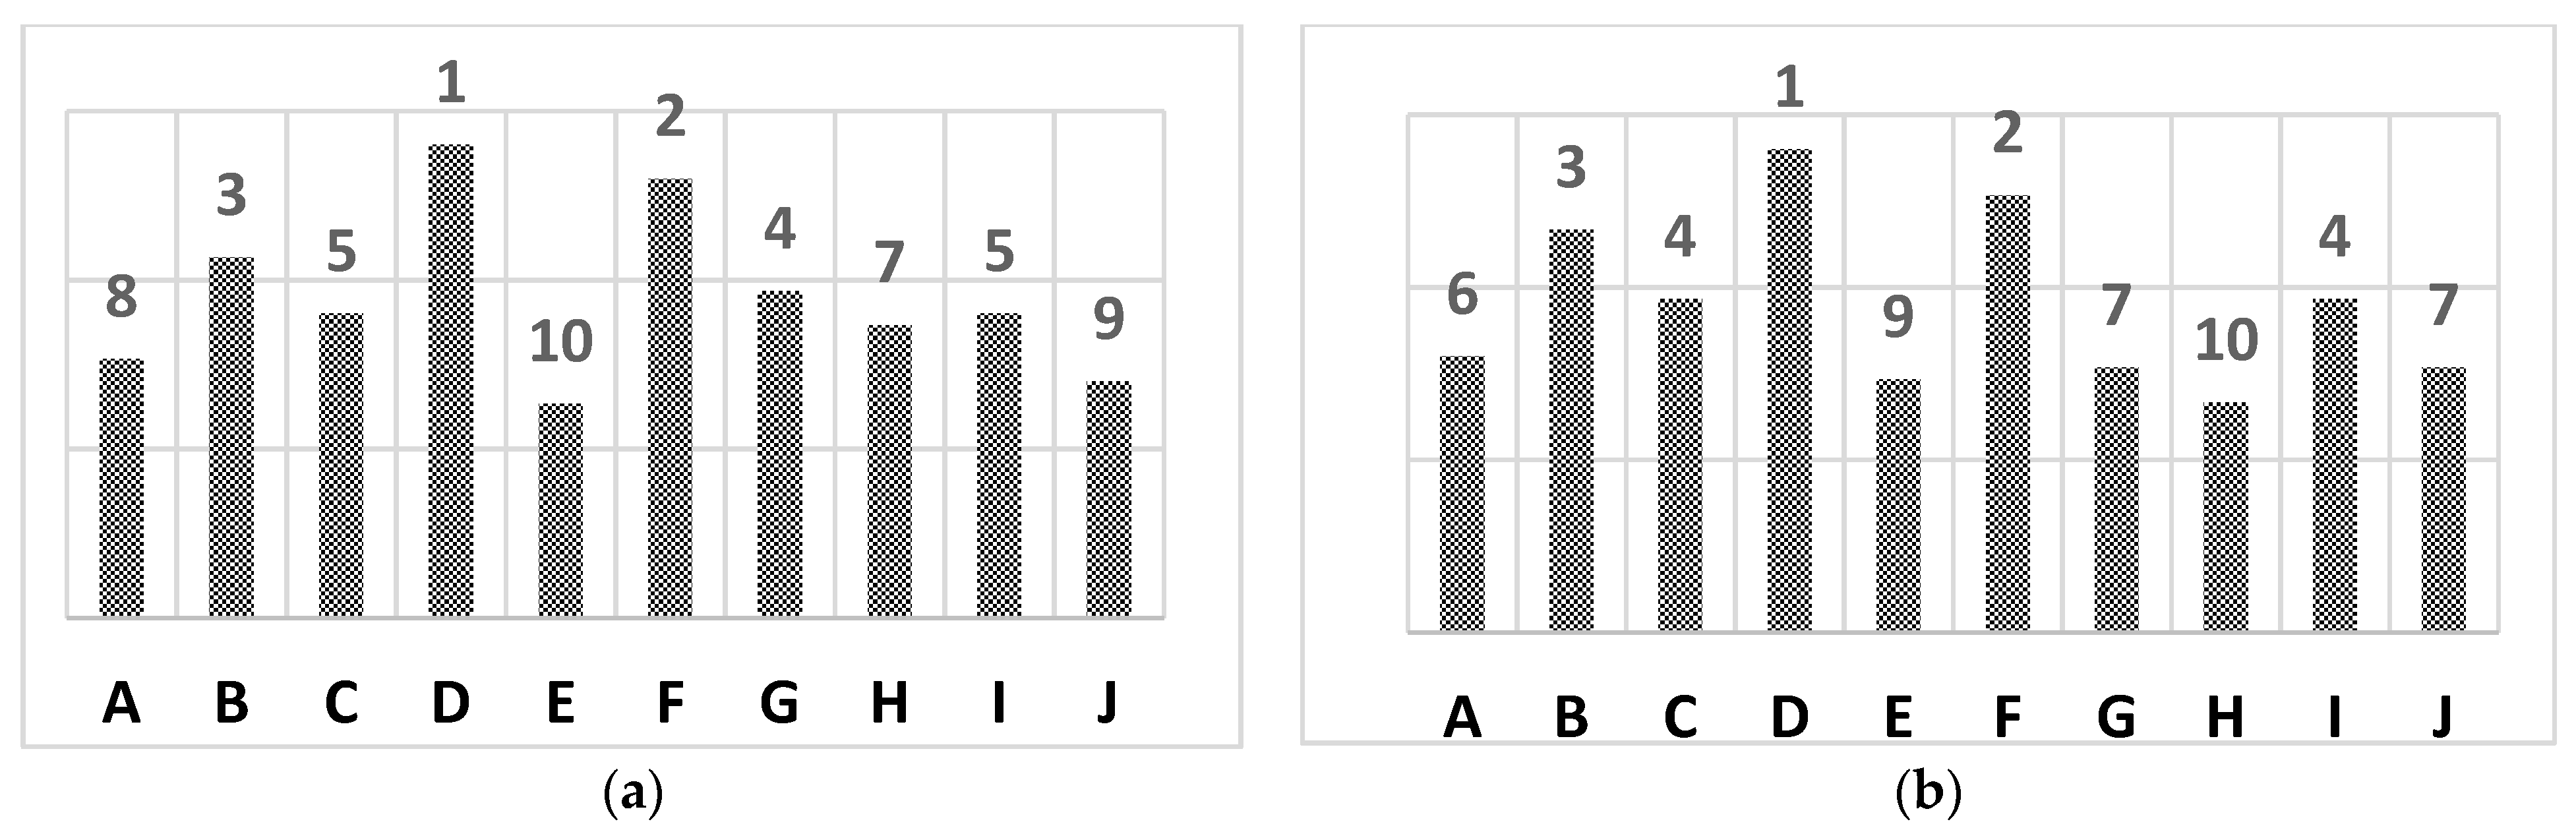
6. Results and Discussion

Table 7 and Table 8 give the values of the relative ranks or the actual values of the different performance assessment factors for the different options of the no-recycling scenario for Region A and Region B of Saudi Arabia. Four types of relative ranks are used, namely low (LOW), average (AVG), high (HIG), and very high (VHIG). The options involving power generation, A, C, E, F, H, and J, require high heating values and hence are given poor ranking, 3 and 4, due to low heating values as determined from Equation (1). The options E and J, which are cooling with power generation, have better rankings for Region B compared to Region A because of lower total cooling loads in Region B as given in Figure 3 and Figure 4. The two areas are different primarily in terms of MSW components, resulting in differences in the heating value of the fuel, as well as the cost of waste collection. Differences in composition result in difference in the heating value. The geographical area of the two regions results in differences in collection cost. Additionally, the difference in the climatic conditions prevailing in the two regions gives differences in the fuel moisture content, resulting in differences in the efficiencies of the combustion systems. The cooling days required for Region B (Cooling degree days = 5953) is higher compared to Region A (Cooling degree days = 5688), resulting in comparatively more energy requirement for cooling application options D, E and I, J.
Table 9 and Table 10 give the values of performance assessment factors for recycling scenarios for Region A and Region B, respectively. The heating value of the fuel is reduced due to the absence of some of the combustible material-like paper and plastics, and hence the ash content in the fuel is increased per kilogram of MSW considerably. The heating value of the fuel and the storage-related issues are the same as in the case of the no-recycling scenario. The fuel preparation cost is reduced since only organics are involved due to which additional cost incurred for fluidized bed firing is not there. Hence, all options carry equal rank for fuel preparation. Additionally, the moisture content in the organic waste component is much higher, causing reduced combustion efficiency in all the options, and are given the poorest rank of 4 for all cases. Incinerator performance factors are equally impacted by the difference in the fuel quality, and hence, the same ranks are retained.
Collection point separation or disposal site separation are two available options for separating the organic content from the waste. In the former case, the transportation cost is reduced considerably, but in the case of disposal site separation, extensive machinery and labor is involved. In the present study, collection point separation is considered, and costs are proportionally altered as per the weight fraction of the organic material. This is taken as 37% as per the data provided in Table 1.
The best and worst MSW incineration and utilization technology methods are given in Table 11 here below. This is a comparison of the different options, A to J, in terms of how close they are to each of the performance criteria. It is seen that the district cooling option using fluidized bed combustion (option I) is the best choice in terms of fuel-drying requirement criteria (C3). Fuel drying increases the heating value of the fuel, thereby producing more heat output from the combustion system. Since vapor absorption systems can operate at lower heat values, drying requirements are lesser. This is because dedicated cooling systems use vapor absorption systems operated efficiently at low combustion temperatures, and therefore, the fuel drying requirement is minimum. The option of power generation with fluidized bed combustion (option F) is the best option for the criteria of the fuel preparation requirement because of the adaptability of variable fuel properties (C3) in the case of fluidized bed combustion. Fluidized bed combustion can be performed with a variety of fuel, and hence, it is close to this criterion. Desalination using heat from fluidized bed combustion (option G) is the best option with reference to the criteria of sharing the share of existing freshwater requirements (C11) in all the scenarios. This is because a considerable percentage of energy used for freshwater production can be obtained by using this method.
From Table 11, it is evident that for various criterion few MSW incineration and utilization technologies are best, whereas another set of MSW incineration and utilization technologies are worst for respective criterions. Now as a decision maker, it is very difficult to reach a unique preference under multiple criteria. Therefore, the closeness to an ideal solution for each alternative MSW incineration and utilization technology for a given criterion and the alternative MSW incineration and utilization technology ranking is must.
Various weighting scenarios are adopted in Table 12 and the rankings are obtained for Region A under a non-recycling scenario. Three types of allotting weights, namely, entropy weights, expert weights, and equal weights, are followed. There are differences in the results for different weights and the decision maker determines the conditions most favorable to the existing situation in order to make the decision.
Table 13 gives the average ranking considering all three weights for Region B for the non-recycling scenario.
Table 14 gives the average ranking considering all three weights for Region A under the recycling scenario.
Table 15 gives the average ranking considering all three weights for Region B under the recycling scenario.
Figure 4 and Figure 5 give the average ranking considering all three weights for the two regions considered in this study. The average ranking of the options is mentioned above each option bar. In the case of the non-recycling scenario, the first three positions are held by options D, F, and B, respectively. Similarity in the waste characteristics and other attributes is the reason for similar trends. In the case of the recycling scenario, option D holds the first position in both regions. The second position is held by option F in Region A and second ranking by options G, H, and I for Region B.

7. Conclusions

This study was made to select the best waste utilization option from among 10 different routes involving two waste incineration methods and five energy conversion methods. The two waste incineration methods considered were GF incineration and FB incineration. The five energy conversion methods considered were power generation, desalination, combined power generation/desalination, district cooling, and combined power generation/district cooling.
Two different locations with different waste generation rate, composition, and climatic factors were considered. The scenarios considered for the analysis were with recycling and without recycling of the waste. Field data collected from the two locations, namely Region A and Region B, showed a waste generation rate of 4200 thousand tons per year and 2400 thousand tons per year, respectively. Composition of the waste was evaluated at the dumping site and the heating values of 3.31 kWh/kg and 3.13 kWh/kg were obtained for the two regions without recycling. After the removal of recyclable material, the heating value reduced to 1.3 kWh/kg and 1.66 kWh/kg for the two regions, respectively.
Initial assessment of five major performance factors, namely, fuel supply requirement, incinerator performance, end use performance, emission factors, and economic factors, was done, and the data was subjected to MCDA. The different options were prioritized based on their overall ranking using the five major performance factors. Evaluation ranks of MSW incineration and utilization technologies are sensitive when various sets of weights are assigned to each criterion.
The performance assessment factors were given either relative ranks or definitive values using both collected data and published values. Four relative rankings, namely low (LOW), average (AVG), high (HIG), and very high (VHIG), are used.
In this analysis, the focus is also on various scenarios that are expected to arise as per demand of MSW management. From the results (Table 13, Table 14 and Table 15), it is evident that ranks/selection of MSW incineration and utilization technologies are sensitive to demand scenarios. A comparison of the different scenarios indicates that option D, which is district cooling with grate-firing incineration, ranks well in most cases. This is same for the non-recycling as well as the recycling scenario. Option F is the second ranking route except for the recycling scenario for Region B, where option G takes second rank.
Thus, the selection of the best option for a particular application is one of the most challenging problems when it comes to overall energy economics and environmental benefit. It is observed that experts have diverse preference weights for the evaluation criterion. Considering expert weights, it is seen that option G performs best. Thus, the decision maker needs to select the most suitable MSW incineration and utilization technological option in order to achieve the desired global energy output with minimum cost and specific application ability. This paper mainly focuses on MSW incineration and utilization technologies for meeting different requirements using MCDM. The entropy weight and MCDM method, which have high resolution and a simple calculation process, could objectively evaluate the MSW incineration and utilization technologies. This approach is different compared to other known approaches.

Author Contributions

Conceptualization, Z.K.; methodology, Z.K. and A.U.-R.; software, A.U.-R.; formal analysis, Z.K. and A.U.-R.; investigation, A.U.-R.; resources, Z.K.; writing—original draft preparation, Z.K., A.U.-R. and Y.S.U.; writing—review and editing, Z.K., A.U.-R. and Y.S.U.; visualization, Z.K.; project administration, Z.K.; funding acquisition, Z.K. All authors have read and agreed to the published version of the manuscript.

Funding

This research was funded by Deputyship for Research and Innovation, “Ministry of Education” in Saudi Arabia, grant number IFKSUDR_E155 and “The APC was funded by Deputyship for Research and Innovation, “Ministry of Education” in Saudi Arabia.

Data Availability Statement

No applicable.

Acknowledgments

The authors extend their appreciation to the Deputyship for Research and Innovation, “Ministry of Education” in Saudi Arabia for funding this research through the project number IFKSUDR_E155.

Conflicts of Interest

The authors declare no conflict of interest.

References

  1. Carlos Escobar Palacio, J.; Joaquim Conceição Soares Santos, J.; Luiza Grillo Renó, M.; Corrêa Furtado Júnior, J.; Carvalho, M.; Martín Martínez Reyes, A.; José Rúa Orozco, D. Municipal Solid Waste Management and Energy Recovery. In Energy Conversion-Current Technologies and Future Trends; IntechOpen: London, UK, 2019; pp. 1–21. [Google Scholar] [CrossRef] [Green Version]
  2. Available online: https://www.powermag.com/waste-energy-opportunity-good-waste-waste-time/ (accessed on 22 May 2023).
  3. Trindade, A.B.; Palacio, J.C.E.; González, A.M.; Rúa Orozco, D.J.; Lora, E.E.S.; Renó, M.L.G.; del Olmo, O.A. Advanced Exergy Analysis and Environmental Assessment of the Steam Cycle of an Incineration System of Municipal Solid Waste with Energy Recovery. Energy Convers. Manag. 2018, 157, 195–214. [Google Scholar] [CrossRef]
  4. Guerrero, L.A.; Maas, G.; Hogland, W. Solid Waste Management Challenges for Cities in Developing Countries. Waste Manag. 2013, 33, 220–232. [Google Scholar] [CrossRef] [PubMed]
  5. Cheng, H.; Hu, Y. Curbing Dioxin Emissions from Municipal Solid Waste Incineration in China: Re-Thinking about Management Policies and Practices. Environ. Pollut. 2010, 158, 2809–2814. [Google Scholar] [CrossRef] [PubMed]
  6. Holmes, T.; Baker, B.; Shoemaker, L. Materials for Service in Municipal Waste- & Biomass-Fired Power Generation … a Review of Recent Experience. In Proceedings of the CORROSION 2016, Vancouver, BC, Canada, 6–10 March 2016. Paper Number NACE-2016-7493. [Google Scholar]
  7. Leckner, B.; Lind, F. Combustion of Municipal Solid Waste in Fluidized Bed or on Grate—A Comparison. Waste Manag. 2020, 109, 94–108. [Google Scholar] [CrossRef]
  8. Shao, Y.; Wang, J.; Preto, F.; Zhu, J.; Xu, C. Ash Deposition in Biomass Combustion or Co-Firing for Power/Heat Generation. Energies 2012, 5, 5171–5189. [Google Scholar] [CrossRef]
  9. Fitzgerald, G.C. Pre-Processing and Treatment of Municipal Solid Waste (MSW) Prior to Incineration. In Waste to Energy Conversion Technology; Elsevier: Amsterdam, The Netherlands, 2013; pp. 55–71. ISBN 978-0-85709-011-9. [Google Scholar]
  10. Tozlu, A.; Abusoglu, A.; Ozahi, E.; Anvari-Moghaddam, A. Municipal Solid Waste-Based District Heating and Electricity Production: A Case Study. J. Clean. Prod. 2021, 297, 126495. [Google Scholar] [CrossRef]
  11. Udomsri, S.; Martin, A.R.; Martin, V. Thermally Driven Cooling Coupled with Municipal Solid Waste-Fired Power Plant: Application of Combined Heat, Cooling and Power in Tropical Urban Areas. Appl. Energy 2011, 88, 1532–1542. [Google Scholar] [CrossRef]
  12. Achillas, C.; Moussiopoulos, N.; Karagiannidis, A.; Georgios, B.; Perkoulidis, G. The use of multi-criteria decision analysis to tackle waste management problems: A literature review. Waste Manag. Res. J. Int. Solid Wastes Public Clean. Assoc. ISWA 2013, 31, 115–129. [Google Scholar] [CrossRef]
  13. Qazi, W.A.; Abushammala, M.F.; Azam, M.-H. Multi-criteria decision analysis of waste-to-energy technologies for municipal solid waste management in Sultanate of Oman. Waste Manag. Res. 2018, 36, 594–605. [Google Scholar] [CrossRef]
  14. McKnight, T.L.; Hess, D. Climate Zones and Types. Physical Geography: A Landscape Appreciation; Prentice Hall: Upper Saddle River, NJ, USA, 2000; ISBN 978-0-13-020263-5. [Google Scholar]
  15. Kuznetsova, E.; Cardin, M.-A.; Diao, M.; Zhang, S. Integrated Decision-Support Methodology for Combined Centralized-Decentralized Waste-to-Energy Management Systems Design. Renew. Sustain. Energy Rev. 2019, 103, 477–500. [Google Scholar] [CrossRef] [Green Version]
  16. Latosińska, J.; Miłek, D.; Komór, A.; Kowalik, R. Selective Collection of Municipal Waste in a Residential District with Multi-Family Buildings—Case Study from Poland. Resources 2021, 10, 83. [Google Scholar] [CrossRef]
  17. Encyclopedia of Desalination and Water Resources: Energy Requirements of Desalination Processes. Available online: https://www.desware.net/Energy-Requirements-Desalination-Processes.aspx (accessed on 17 May 2023).
  18. Rada, E.C. Effects of MSW Selective Collection on Waste-to-Energy Strategies. In Energy and Sustainability IV; WIT Press: Southampton, UK, 2013; pp. 215–223. [Google Scholar]
  19. Al-Waked, R.; Ouda, O.K.M.; Raza, S.A. Potential value of waste-to-energy facility in Riyadh city-Saudi Arabia. In Proceedings of the 8th Jordanian International Mechanical Engineering Conference 2014, Amman, Jordan, 22–23 September 2014. [Google Scholar]
  20. Lee, H.Y.; Kim, K.H. Energy and Exergy Analyses of a Combined Power Cycle Using the Organic Rankine Cycle and the Cold Energy of Liquefied Natural Gas. Entropy 2015, 17, 6412–6432. [Google Scholar] [CrossRef] [Green Version]
  21. Kong, X.; Meng, X.; Li, J.; Shang, Y.; Cui, F. Comparative Study on Two-Stage Absorption Refrigeration Systems with Different Working Pairs. J. Shanghai Jiaotong Univ. (Sci.) 2021, 26, 155–162. [Google Scholar] [CrossRef]
  22. Huang, Q.; Chi, Y.; Themelis, N.J. A Rapidly Emerging WTE Technology: Circulating Fluid Bed Combustion. In Proceedings of the 33rd Conference on International Thermal Treatment Technologies 2013, Air and Waste Management Association, San Antonio, TX, USA, 19–21 October 2013. [Google Scholar]
  23. Dong, J.; Chi, Y.; Tang, Y.; Ni, M.; Nzihou, A.; Weiss-Hortala, E.; Huang, Q. Effect of Operating Parameters and Moisture Content on Municipal Solid Waste Pyrolysis and Gasification. Energy Fuels 2016, 30, 3994–4001. [Google Scholar] [CrossRef] [Green Version]
  24. Liang, L.; Sun, R.; Fei, J.; Wu, S.; Liu, X.; Dai, K.; Yao, N. Experimental Study on Effects of Moisture Content on Combustion Characteristics of Simulated Municipal Solid Wastes in a Fixed Bed. Bioresour. Technol. 2008, 99, 7238–7246. [Google Scholar] [CrossRef] [PubMed]
  25. Sarkar, D.K. Fluidized-Bed Combustion Boilers. In Thermal Power Plant; Elsevier: Amsterdam, The Netherlands, 2015; pp. 159–187. ISBN 978-0-12-801575-9. [Google Scholar]
  26. Khan, M.S.; Kadam, S.T.; Kyriakides, A.-S.; Papadopoulos, A.I.; Hassan, I.; Rahman, M.A.; Seferlis, P. A New Correlation for Performance Prediction of Small and Large Capacity Single-Effect Vapor Absorption Refrigeration Systems. Clean. Energy Syst. 2022, 1, 100002. [Google Scholar] [CrossRef]
  27. Yin, C.; Li, S. Advancing Grate-Firing for Greater Environmental Impacts and Efficiency for Decentralized Biomass/Wastes Combustion. Energy Procedia 2017, 120, 373–379. [Google Scholar] [CrossRef]
  28. Rudiyanto, B.; Wardani, T.A.K.; Anwar, S.; Al Jamali, L.; Prasetyo, T.; Wibowo, K.M.; Saw, L.H. Energy and Exergy Analysis of Steam and Power Plant in Paiton, Indonesia. In Proceedings of the IOP Conferencce Series: Earth and Environmental Science, Kuala Lumpur, Malaysia, 18–23 August 2019. [Google Scholar]
  29. Saqib, N.; Bäckström, M. Distribution and Leaching Characteristics of Trace Elements in Ashes as a Function of Different Waste Fuels and Incineration Technologies. J. Environ. Sci. 2015, 36, 9–21. [Google Scholar] [CrossRef] [PubMed]
  30. Understanding the Carbon Impacts of Waste to Energy Incineration. Available online: https://zerowasteeurope.eu/2020/03/understanding-the-carbon-impacts-of-waste-to-energy/ (accessed on 17 May 2023).
  31. Yao, S.; Yang, L.; Shi, S.; Zhou, Y.; Long, M.; Zhang, W.; Cai, S.; Huang, C.; Liu, T.; Zou, B. A two-in-one annealing enables dopant free block copolymer based organic solar cells with over 16% efficiency. Chin. J. Chem. 2023, 41, 672–678. [Google Scholar] [CrossRef]
  32. Liu, T.; Zhou, K.; Ma, R.; Zhang, L.; Huang, C.; Luo, Z.; Zhu, H.; Yao, S.; Yang, C.; Zou, B.; et al. Multifunctional all-polymer photovoltaic blend with simultaneously improved efficiency (18.04%), Stability and mechanical durability. Aggregate 2022, 3, e308. [Google Scholar] [CrossRef]
  33. Thunman, H.; Lind, F.; Breitholtz, C.; Berguerand, N.; Seemann, M. Using an Oxygen-Carrier as Bed Material for Combustion of Biomass in a 12-MWth Circulating Fluidized-Bed Boiler. Fuel 2013, 113, 300–309. [Google Scholar] [CrossRef]
  34. Campos-Alba, C.M.; Garrido-Rodríguez, J.C.; Plata-Díaz, A.M.; Pérez-López, G. The Selective Collection of Municipal Solid Waste and Other Factors Determining Cost Efficiency. An Analysis of Service Provision by Spanish Municipalities. Waste Manag. 2021, 134, 11–20. [Google Scholar] [CrossRef] [PubMed]
  35. Leckner, B. Fluidized Bed Combustion. In Reference Module in Chemistry, Molecular Sciences and Chemical Engineering; Elsevier: Amsterdam, The Netherlands, 2016; ISBN 978-0-12-409547-2. [Google Scholar]
  36. Boskovic, G.; Jovicic, N.; Jovanovic, S.; Simovic, V. Calculating the Costs of Waste Collection: A Methodological Proposal. Waste Manag. Res. 2016, 34, 775–783. [Google Scholar] [CrossRef] [PubMed]
  37. Arina, D.; Klavenieks, K.; Burlakovs, J. The Cost-Estimation of Mechanical Pre-Treatment Lines of Municipal Solid Waste in Latvia. Proc. Latv. Univ. Agric. 2014, 32, 17–28. [Google Scholar] [CrossRef] [Green Version]
  38. Short, W.; Packey, D.J.; Holt, T. A Manual for the Economic Evaluation of Energy Efficiency and Renewable Energy Technologies; National Renewable Energy Lab. (NREL): Golden, CO, USA, 1995.
  39. Zhou, M.; Liu, X.-B.; Yang, J.-B.; Chen, Y.-W.; Wu, J. Evidential reasoning approach with multiple kinds of attributes and entropy-based weight assignment. Knowl.-Based Syst. 2019, 163, 358–375. [Google Scholar] [CrossRef]
  40. Wang, T.C.; Chang, T.H. Application of TOPSIS in evaluating initial training aircraft under a fuzzy environment. Expert Syst. Appl. 2007, 33, 870–880. [Google Scholar] [CrossRef]
  41. Young-Jou, L.; Ting-Yun, L.; Ching-Lai, H. TOPSIS for MODM. Eur. J. Oper. Res. 1994, 76, 486–500. [Google Scholar] [CrossRef]
Figure 1. The different utilization options available from MSW incineration.
Processes 11 01921 g001
Figure 2. Municipal solid waste generation in Region A and Region B from 2020 to 2030.
Processes 11 01921 g002
Figure 3. Basic cycle of a lithium bromide-water VAR two-stage cooling system [21].
Processes 11 01921 g003
Figure 4. Average ranking of options for non-recycling scenarios in (a) Region A and (b) Region B.
Processes 11 01921 g004
Figure 5. Average ranking of options for recycling scenarios in (a) Region A and (b) Region B.
Processes 11 01921 g005
Table 1. Components of the MSW produced in the two regions of Saudi Arabia.
Region ARegion B
Components LHV
kJ/kg
LHV
kWh/kg
%LHV
per Kg
%LHV
per Kg
Contents of the Components
Paper13,4843.7528.51.0316.030.60Wasted papers, cardboard, box board, bags, magazines, tissue, newspapers, tissues
Plastic35,0009.725.20.605.80.56Disposable glass, spoons, plates, wrapping films, wrapping film, plastic bottles, polythene
Glass00.004.60.006.860.00Bottles, glassware, bulbs, ceramics, etc.
Wood16,979.84.7280.389.630.45Bottles, glassware, bulbs, ceramics, etc.
Textiles18,840.65.236.40.395.770.30Cloths, diapers, etc.
Organics5582.41.55370.56370.57Food stuff, fruits and vegetable refuse, peel, etc.
Others12,095.23.3610.30.3518.910.64Leathers, rubber, fibers, rubber, yard waste, soils, tire, appliances, electronics
Energy content without recycling (kWh/kg) 3.31 3.13
Energy content after recycling(kWh/kg)1.3 1.66
Table 2. The quantity of end products produced by different options for 2030 MSW/year generation.
Options→ABCDEFGHIJ
Output→Energy GWhWater
m3/year
Water m3/yearCooling kWCooling kWEnergy GWhWater m3Water m3Cooling kWCooling kW
Region A161,452,024726,012292146211,936,033968,017389122
Region B9849,557424,77817185121,132,743566,372228114
Table 3. Decision matrix for ith MSW incineration option and jth criterion.
Evaluation Criterion (j)→
Alternative MSW Incineration Option (i)↓
12.n
1X11X12.X1n
2X21X22.X2n
.....
.....
MXm1Xm2.Xmn
Criterion Weight →W1W2.Wn
Table 4. Standardized decision matrix S i j ' for alternative MSW incineration options.
OptionABCDEFGHIJ
Fuel supply requirement
C1Fuel heating value requirement, MJ/kg(min)LOWLOWLOWLOWLOWAVGAVGAVGAVGAVG
C2Fuel drying requirement, % (max)AVGAVGAVGAVGAVGHIGHIGHIGHIGHIG
C3Fuel handling requirement (max)HIGHIGHIGHIGHIGVHIGVHIGVHIGVHIGVHIG
C4Storage (max)VHIGVHIGVHIGVHIGVHIGHIGHIGHIGHIGHIG
Incinerator performance
C5Capacity flexibility
(min)
VHIGVHIGVHIGVHIGVHIGAVGAVGAVGAVGAVG
C6Conversion efficiency (max)40%40%40%40%40%60%60%60%60%60%
C7Co-firing adaptability
(min)
AVGAVGAVGAVGAVGVHIGVHIGVHIGVHIGVHIG
C8Operation and Maintenance requirement
(min)
HIGHIGHIGHIGHIGAVGAVGAVGAVGAVG
End Use Performance
C9Energy efficiency (min)AVGAVGAVGAVGAVGHIGHIGHIGHIGHIG
C10Exergy Efficiency
(min)
HIGHIGHIGHIGHIGAVGAVGAVGAVGAVG
C11% of existing usage8.0728.3414.1720.0010.0010.537.718.8526.413.2
Emission factors
C12Bottom Ash/Fly ash ratio (max)90/1090/1090/1090/1090/1030/7030/7030/7030/7030/70
C13emissions (CO2) kg/kg
(min)
1200120012001200120012501250125012501250
C14emissions (CO) mg/m3
(min)
50505050502020202020
C15NOX formation mg/m3.
(min)
121212121266666
C16Leachates problems
(min)
33344VHIGVHIGVHIGHIGHIG
Economic factors
CVHIG7Investment cost of incinerator
USD per ton
(min)
83.4083.4083.4083.4083.4075.0675.0675.0675.0675.06
C18Waste Collection cost USD per ton
(min)
37.937.937.937.937.937.937.937.937.937.9
C19Fuel preparation cost (USD per ton)
(min)
21.4321.4321.4321.4321.4342.8742.8742.8742.8742.87
C20Levelized cost of Energy (USD)
(min)
2450235024302600250022002150235023002130
Relative ranking indicators: VHIG-Very high, HIG-high. AVG-average, LOW-low. A-GF combustion with power generation. B-GF combustion with desalination. C-GF combustion with power generation + desalination. D-GF combustion with district cooling. E-GF combustion with power generation + district cooling. F-FB combustion with power generation. G-FB combustion with desalination. H-FB combustion with power generation + desalination. I-FB combustion with district cooling. J-FB combustion with power generation + district cooling.
Table 5. Ej entropy weight values for criterion related to various MSW incineration and utilization technology for given operating conditions.
Evaluation Criterion (j) ↓Ej Entropy Weight Values
Scenario1Scenario2Scenario3Scenario4
C10.02150.01750.02100.0211
C20.04320.04400.04220.0423
C30.02000.02040.04640.0465
C40.03890.03970.03800.0381
C50.03650.03720.03570.0357
C60.02000.02040.01960.0196
C70.04750.02040.04640.0465
C80.04750.04840.04640.0465
C90.04750.04840.04640.0465
C100.04750.04840.04640.0465
C110.01100.01120.01070.0108
C120.04750.04840.04640.0465
C130.04750.04840.04640.0465
C140.04750.04840.04640.0465
C150.04750.04840.04640.0465
C160.02150.04840.02100.0211
C170.04750.04840.04640.0465
C180.04750.04840.04640.0465
C190.04750.04840.04640.0465
C200.26480.25710.25530.2535
Table 6. Normalized decision matrix R i j for MSW incineration and utilization technologies.
Evaluation Criterion (j) ↓Alternative MSW Incineration and Utilization Technologies (i)
ABCDEGHIJ
C10.43390.21690.43390.10850.43390.32540.21690.32540.1085
C20.36820.18410.36820.09210.36820.36820.36820.36820.0921
C30.44720.29810.29810.29810.29810.59630.14910.14910.1491
C40.32350.10780.43130.43130.10780.32350.10780.43130.1078
C50.47430.47430.47430.31620.31620.15810.15810.15810.1581
C60.26490.39740.39740.39740.39740.13250.26490.26490.2649
C70.42430.42430.42430.42430.42430.14140.14140.14140.1414
C80.24810.24810.24810.24810.24810.37210.37210.37210.3721
C90.37210.37210.37210.37210.37210.24810.24810.24810.2481
C100.24810.24810.24810.24810.24810.37210.37210.37210.3721
C110.12270.43080.21540.30400.15200.15960.57310.28660.4013
C120.44670.44670.44670.44670.44670.02130.02130.02130.0213
C130.30970.30970.30970.30970.30970.32260.32260.32260.3226
C140.41520.41520.41520.41520.41520.16610.16610.16610.1661
C150.40000.40000.40000.40000.40000.20000.20000.20000.2000
C160.35860.35860.35860.47810.47810.11950.11950.11950.2390
C170.33240.33240.33240.33240.33240.29920.29920.29920.2992
C180.31620.31620.31620.31620.31620.31620.31620.31620.3162
C190.20000.20000.20000.20000.20000.40000.40000.40000.4000
C200.26970.30340.30340.32030.30340.28660.33710.33710.3540
A-GF combustion with power generation. B-GF combustion with desalination. C-GF combustion with power generation + desalination. D-GF combustion with district cooling. E-GF combustion with power generation + district cooling. F-FB combustion with power generation. G-FB combustion with desalination. H-FB combustion with power generation + desalination. I-FB combustion with district cooling. J-FB combustion with power generation + district cooling.
Table 7. Values of performance assessment factors for the no-recycling scenario for Region A.
Option →ABCDEFGHIJ
Meeting Fuel supply requirement
Heating value requirement ranking (min)LOWHIGLOWVHIGLOWAVGHIGAVGVHIGAVG
Fuel drying requirement, % (max)LOWHIGLOWVHIGLOWLOWLOWLOWVHIGLOW
Fuel handling requirement (max)AVGHIGHIGHIGHIGLOWVHIGVHIGVHIGVHIG
Storage problems ranking (max)AVGVHIGLOWLOWVHIGAVGVHIGLOWVHIGLOW
Incinerator performance
Capacity flexibility
ranking (min)
AVGAVGAVGHIGHIGVHIGVHIGVHIGVHIGVHIG
Conversion efficiency ranking (max)HIGAVGAVGAVGAVGVHIGHIGHIGHIGHIG
Co-firing adaptability ranking (min)AVGAVGAVGAVGAVGVHIGVHIGVHIGVHIGVHIG
Operation and Maintenance requirement ranking (min)HIGHIGHIGHIGHIGAVGAVGAVGAVGAVG
End Use Performance
Energy efficiency ranking (min)AVGAVGAVGAVGAVGHIGHIGHIGHIGHIG
Exergy Efficiency ranking
(min)
HIGHIGHIGHIGHIGAVGAVGAVGAVGAVG
% of existing usage (max)8.0728.3414.1720.0010.0010.537.718.8526.413.2
Emission factors
Bottom Ash/Fly ash ratio
(max)
90/1090/1090/1090/1090/1030/7030/7030/7030/7030/70
emissions (CO2) kg/kg
(min)
1200120012001200120012501250125012501250
emissions (CO) mg/m3
(min)
50505050502020202020
NOX formation mg/m3.
(min)
121212121266666
Leachates problems ranking
(min)
AVGAVGAVGLOWLOWVHIGVHIGVHIGHIGHIG
Economic factors
Investment cost of incinerator
USD per ton
(min)
83.4083.4083.4083.4083.4075.0675.0675.0675.0675.06
Waste Collection cost USD per ton(min)37.937.937.937.937.937.937.937.937.937.9
Fuel preparation cost (USD per ton)
(min)
21.4321.4321.4321.4321.4342.8742.8742.8742.8742.87
Levelized cost of Energy (USD)
(min)
0.160.180.180.190.180.170.200.200.210.20
Relative ranking indicators VHIG-Very high, HIG-high, AVG-average, LOW-low. In column 1, (min) indicates minimization and (max) indicates maximization.
Table 8. Values of performance assessment factors for the no-recycling scenario for Region B.
Option →ABCDEFGHIJ
Fuel supply requirement
Heating value requirement ranking (min)LOWHIGLOWVHIGAVGAVGHIGAVGVHIGHIG
Fuel drying requirement, % (max)LOWHIGLOWVHIGLOWLOWLOWLOWVHIGLOW
Fuel handling requirement (max)AVGHIGHIGHIGHIGLOWVHIGVHIGVHIGVHIG
Storage problems ranking (max)AVGVHIGLOWLOWVHIGAVGVHIGLOWVHIGLOW
Incinerator performance
Capacity flexibility ranking (min)AVGAVGAVGHIGHIGVHIGVHIGVHIGVHIGVHIG
Conversion efficiency ranking (max)HIGAVGAVGAVGAVGLOWHIGHIGHIGHIG
Co-firing adaptability ranking
(min)
HIGAVGAVGAVGAVGLOWHIGHIGHIGHIG
Operation and Maintenance requirement ranking
(min)
AVGAVGAVGAVGAVGLOWLOWLOWLOWLOW
End Use Performance
Energy efficiency ranking (min)AVGAVGAVGAVGAVGHIGHIGHIGHIGHIG
Exergy Efficiency ranking
(min)
HIGHIGHIGHIGHIGAVGAVGAVGAVGAVG
% of existing usage (max)7.6326.7813.3918.909.459.9235.6317.8124.9512.47
Emission factors
Bottom Ash/Fly ash ratio
(max)
90/1090/1090/1090/1090/1030/7030/7030/7030/7030/70
emissions (CO2) kg/kg (min)1134113411341134113411811181118111811181
emissions (CO) mg/m3 (min)1134113411341134113411811181118111811181
NOX formation mg/m3 (min)111111111166666
Leachates problems (min)50505050502020202020
Economic factors
Investment cost of incinerator
USD per ton (min)
78.8178.8178.8178.8178.8170.9370.9370.9370.9370.93
Waste Collection cost USD per ton
(min)
36363636363636363636
Fuel preparation cost (USD per ton)
(min)
20202020204141414141
Levelized cost of Energy (USD)
(min)
0.150.170.170.180.170.170.190.190.200.19
Relative ranking indicators VHIG-Very high, HIG-high, AVG-average, LOW-low. A-GF combustion with power generation. B-GF combustion with desalination. C-GF combustion with power generation + desalination. D-GF combustion with district cooling. E-GF combustion with power generation + district cooling. F-FB combustion with power generation. G-FB combustion with desalination. H-FB combustion with power generation + desalination. I-FB combustion with district cooling. J-FB combustion with power generation + district cooling. In column 1, (min) indicates minimization and (max) indicates maximization.
Table 9. Values of performance assessment factors for the recycling scenario for Region B.
Option →ABCDEFGHIJ
Meeting Fuel supply requirement
Heating value requirement ranking (min)LOWHIGLOWVHIGLOWAVGHIGAVGVHIGAVG
Fuel drying requirement, % (max)LOWHIGLOWVHIGLOWLOWLOWLOWVHIGLOW
Fuel handling requirement (max)HIGHIGHIGHIGHIGHIGHIGHIGHIGHIG
Storage problems ranking (max)AVGVHIGLOWLOWVHIGAVGVHIGLOWVHIGLOW
Incinerator performance
Capacity flexibility
ranking (min)
AVGAVGAVGHIGHIGVHIGVHIGVHIGVHIGVHIG
Conversion efficiency ranking (max)HIGAVGAVGAVGAVGVHIGHIGHIGHIGHIG
Co-firing adaptability ranking (min)AVGAVGAVGAVGAVGVHIGVHIGVHIGVHIGVHIG
Operation and Maintenance requirement ranking (min)HIGHIGHIGHIGHIGAVGAVGAVGAVGAVG
End Use Performance
Energy efficiency ranking (min)LOWLOWLOWLOWLOWAVGAVGAVGAVGAVG
Exergy Efficiency ranking (min)AVGAVGAVGAVGAVGLOWLOWLOWLOWLOW
% of existing usage (max)3.2211.335.66844.215.087.5410.565.28
Emission factors
Bottom Ash/Fly ash ratio (max)90/1090/1090/1090/1090/1030/7030/7030/7030/7030/70
emissions (CO2) kg/kg (min)480480480480480500500500500500
emissions (CO) mg/m3 (min)202020202088888
NOX formation mg/m3 (min)4.84.84.84.84.82.42.42.42.42.4
Leachates problems ranking
(min)
AVGAVGAVGLOWLOWVHIGVHIGVHIGHIGHIG
Economic factors
Investment cost of incinerator
USD per ton (min)
83.483.483.483.483.475.0675.0675.0675.0675.06
Waste Collection cost USD per ton
(min)
14.0214.0214.0214.0214.0214.0214.0214.0214.0214.02
Fuel preparation cost (USD per ton)
(min)
7.927.927.927.927.9215.8715.8715.8715.8715.87
Levelized cost of Energy (USD)(min)0.140.150.150.160.150.130.140.140.150.14
Relative ranking indicators VHIG-Very high, HIG-high, AVG-average, LOW-low. In column 1, (min) indicates minimization and (max) indicates maximization.
Table 10. Values of performance assessment factors for the recycling scenario for Region B.
Option →ABCDEFGHIJ
Meeting Fuel supply requirement
Heating value requirement ranking (min)LOWHIGLOWVHIGLOWAVGHIGAVGVHIGAVG
Fuel drying requirement, % (max)LOWHIGLOWVHIGLOWLOWLOWLOWVHIGLOW
Fuel handling requirement (max)HIGHIGHIGHIGHIGHIGHIGHIGHIGHIG
Storage problems ranking (max)AVGVHIGLOWLOWVHIGAVGVHIGLOWVHIGLOW
Incinerator performance
Capacity flexibility
ranking (min)
AVGAVGAVGHIGHIGVHIGVHIGVHIGVHIGVHIG
Conversion efficiency ranking (max)HIGAVGAVGAVGAVGVHIGHIGHIGHIGHIG
Co-firing adaptability ranking (min)AVGAVGAVGAVGAVGVHIGVHIGVHIGVHIGVHIG
Operation and Maintenance requirement ranking (min)HIGHIGHIGHIGHIGAVGAVGAVGAVGAVG
End Use Performance
Energy efficiency ranking (min)LOWLOWLOWLOWLOWAVGAVGAVGAVGAVG
Exergy Efficiency ranking (min)AVGAVGAVGAVGAVGLOWLOWLOWLOWLOW
% of existing usage (max)3.0710.775.387.603.803.9914.337.1610.035.02
Emission factors
Bottom Ash/Fly ash ratio
(max)
90/1090/1090/1090/1090/1030/7030/7030/7030/7030/70
emissions (CO2) kg/kg
(min)
456456456456456475475475475475
emissions (CO) mg/m3 (min)19191919197.67.67.67.67.6
NOX formation mg/m3 (min)4.64.64.64.64.62.32.32.32.32.3
Leachates problems ranking
(min)
AVGAVGAVGLOWLOWVHIGVHIGVHIGHIGHIG
Economic factors
Investment cost of incinerator
USD per ton (min)
79.279.279.279.279.271.371.371.371.371.3
Waste Collection cost USD per ton
(min)
13.3213.3213.3213.3213.3213.3213.3213.3213.3213.32
Fuel preparation cost (USD per ton)
(min)
7.57.57.57.57.515.115.115.115.115.1
Levelized cost of Energy (USD)(min)0.130.140.140.150.140.120.130.130.140.13
Relative ranking indicators VHIG-Very high, HIG-high, AVG-average, LOW-low. A-GF combustion with power generation. B-GF combustion with desalination. C-GF combustion with power generation + desalination. D-GF combustion with district cooling. E-GF combustion with power generation + district cooling. F-FB combustion with power generation. G-FB combustion with desalination. H-FB combustion with power generation + desalination. I-FB combustion with district cooling. J-FB combustion with power generation + district cooling. In column 1, (min) indicates minimization and (max) indicates maximization.
Table 11. Best V+ and worst V− solutions for MSW incineration and utilization technology using corresponding Ej entropy weight values.
Evaluation Criterion (j) ↓V+ MSW Incineration and Utilization TechnologyVMSW Incineration and Utilization Technology
C10.0023D/I0.0093A/C/E
C20.0040I0.0159A/C/E/F/G/H/J
C30.0119F0.0030G/H/I/J
C40.0168C/D/H/J0.0042B/G/I
C50.0058FGHIJ0.0173AB
C60.0080BCD0.0027F
C70.0067FGHIJ0.0202ABCDE
C80.0118ABCDE0.0177FGHIJ
C90.0118FGHIJ0.0177ABCDE
C100.0118ABCDE0.0177FGHIJ
C110.0063G0.0013A
C120.0212ABCDE0.0010FGHIJ
C130.0147ABCDE0.0153FGHIJ
C140.0079FGHIJ0.0197ABCDE
C150.0095FGHIJ0.0190ABCDE
C160.0026FGH0.0103DE
C170.0142FGHIJ0.0158ABCDE
C180.0150ABCDEFGHIJ0.0150ABCDEFGHIJ
C190.0095ABCDE0.0190FGHIJ
C200.0714A0.0938I
Table 12. Region A not-recycled municipal solid waste incineration and utilization technologies’ distance from the best ideal and worst, and their ranks using various weighting: scenario 1.
Entropy WeightsExperts WeightsEqual Weights to All
MSW Incineration and Utilization Technologies (i) i ↓Di+Di−Di−/(Di+ + Di−)Rank CiDi+Di−Di−/(Di+ + Di−)Rank CiDi+ Di− Di−/(Di+ + Di−)Rank Ci
A0.02930.02620.472550.0410.03420.454780.04450.03240.42119
B0.03010.02980.497640.03650.03710.504440.03840.03660.48815
C0.03050.03080.502830.04020.03560.469670.04350.03440.4428
D0.02760.03270.542210.03650.04020.523910.03590.04150.53631
E0.03210.02860.471660.04490.03260.421100.04760.03050.390710
F0.02860.03340.538620.03880.04060.510920.03960.04160.51192
G0.03580.02670.4275100.03980.04050.504730.04080.04170.50523
H0.03390.02890.460370.04010.03820.487960.04120.03830.4826
I0.03640.02860.439990.03930.03750.488350.03950.03980.50164
J0.03410.02830.453480.04190.03410.448890.04330.03520.44857
Note: Di+: distance from the best ideal option. Di−: distance from the worst ideal option.
Table 13. Region B not-recycled municipal solid waste incineration and utilization technologies’ distance from the best ideal and worst, and their ranks using various weighting: scenario 2.
Entropy WeightsExperts WeightsEqual Weights to All
MSW Incineration and Utilization Technologies (i) I ↓Di+ Di− Di−/(Di+ + Di−)Rank CiDi+ Di− Di-/(Di+ + Di−)Rank CiDi+ Di− Di−/(Di+ + Di−)Rank Ci
A0.02890.02620.474860.03880.03360.464160.04360.03200.42309
B0.03030.02960.494240.03500.03640.510020.03870.03600.48214
C0.03060.03080.50230.03920.03470.469250.04410.03340.43138
D0.02720.03270.545610.03110.04040.564910.03350.04170.55421
E0.03130.02870.478250.03950.03280.453680.04440.03060.407710
F0.02960.0310.511520.03880.03570.478930.03950.03950.50022
G0.03610.02570.4159100.04000.03460.463670.04100.03820.48205
H0.03410.02810.45280.04040.03160.4389100.04160.03430.45207
I0.03670.02820.434690.03880.03510.474740.03920.03880.49723
J0.0340.02830.454170.04070.03220.441290.04210.03500.45456
Note: Di+: distance from the best ideal option. Di−: distance from the worst ideal option.
Table 14. Region A recycled municipal solid waste incineration and utilization technologies’ distance from the best ideal and worst, and their ranks using various weighting: scenario 3.
Entropy WeightsExperts WeightsEqual Weights to All
MSW Incineration and Utilization Technologies (i) i ↓Di+ Di− Di−/(Di+ + Di−)Rank CiDi+ Di− Di−/(Di+ + Di−)Rank CiDi+ Di− Di−/(Di+ + Di−)Rank Ci
A0.02870.02460.461890.04040.03160.439290.04370.02840.39419
B0.02930.02610.471080.03410.03630.515650.03520.03560.50255
C0.02970.02730.478270.03810.03480.477180.04060.03330.45028
D0.02800.03040.520030.03430.03950.535720.03250.04060.55581
E0.03130.02480.4425100.04300.03170.4246100.04500.02920.393510
F0.02730.03080.529610.03870.03580.480960.03940.03480.46887
G0.02930.02770.486660.03470.04050.538110.03370.04150.55173
H0.02700.02970.524020.03510.03810.520740.03420.03820.52734
I0.02860.02820.496150.03410.03730.522730.03210.03960.55202
J0.02730.02920.517040.03710.03400.478170.03670.03500.48816
Note: Di+: distance from the best ideal option Di−: distance from the worst ideal option.
Table 15. Region B recycled municipal solid waste incineration and utilization technologies’ distance from the best ideal and worst, and their ranks using various weighting: scenario 4.
Entropy WeightsExperts WeightsEqual Weights to All
MSW Incineration and Utilization Technologies (i) i ↓Di+ Di− Di−/(Di+ + Di−)Rank CiDi+ Di− Di−/(Di+ + Di−)Rank CiDi+ Di− Di−/(Di+ + Di−)Rank Ci
A0.02880.02470.461490.04040.03170.439490.04370.02840.39439
B0.02970.02630.469680.03420.03640.515650.03520.03560.50265
C0.03010.02740.476770.03820.03480.477280.04060.03330.45038
D0.02880.03050.514440.03430.03950.535620.03250.04060.55561
E0.03160.02500.4415100.04300.03180.4247100.04500.02920.393610
F0.02740.03140.534210.03870.03580.480960.03940.03480.46897
G0.02940.02810.488660.03480.04050.537910.03380.04150.55153
H0.02720.03010.525420.03510.03810.520640.03420.03820.52714
I0.02900.02830.494150.03410.03730.522430.03210.03960.55172
J0.02740.02950.518530.03720.03400.478070.03670.03500.48816
Note: Di+: distance from the best ideal option. Di−: distance from the worst ideal option.
Disclaimer/Publisher’s Note: The statements, opinions and data contained in all publications are solely those of the individual author(s) and contributor(s) and not of MDPI and/or the editor(s). MDPI and/or the editor(s) disclaim responsibility for any injury to people or property resulting from any ideas, methods, instructions or products referred to in the content.

