Article

Comparative Analysis of the Performance Characteristics of Butterfly and Pinch Valves

1
Mechanical Power and Refrigeration Department, College of Technological Studies, PAAET, Kuwait City 70654, Kuwait
2
Automotive and Marine Department, College of Technological Studies, PAAET, Kuwait City 70654, Kuwait
*
Author to whom correspondence should be addressed.
Processes 2023, 11(7), 1897; https://doi.org/10.3390/pr11071897
Submission received: 5 May 2023 / Revised: 1 June 2023 / Accepted: 17 June 2023 / Published: 24 June 2023

Abstract

:
Valves are important components in controlling the amount of fluid going to devices. One of these types is the butterfly valve (BFV) that adjusts the amount of flow by rotating the valve disk by means of its shafts which is usually located in the middle of the flow. Despite its common usage in various applications, the BFV is known to cause a high-pressure drop. Conversely, the pinch valve is another type of flow control device that uses a pinching mechanism to open and close the inner tube by pinching at different degrees. The absence of flow-controlling mechanisms in the flow path, such as the valve disk and its shaft, contribute to the minimal pressure drop in pinch valves. The high-pressure drop in BFVs and the minimal pressure drop in pinch valve flow make it worthwhile to investigate and compare their flow at all opening positions of the two valves. Therefore, this work numerically explores the potential of using the pinch valve as an alternative to the BFV in terms of its ability to attain a lower pressure loss, hence better flow rate. The influence of various BFV parameters such as shaft diameter, valve thickness, and valve disk edge were examined. The performance characteristics of both valves were obtained using CFD models formed on the SolidWorks program. This CFD model solves the differential equations using the finite element method. Moreover, a mathematical model to determine the area of the pinch valve at various pinching degrees was developed and compared with the results obtained from other mathematical models and CFD. It was shown that using a flat 1 mm valve disk thickness with round edges resulted in a 7.5% increase in mass flow rate compared to standard BFVs. On the other hand, using the pinch valve resulted in over a 700% mass flow rate compared to the BFV at a 25% opening position and a 49% increase in flow rate at a 75% opening position. Thus, the pinch valve has the potential to replace the BFV due to its better flow characteristics in any application.

1. Introduction

It is well known that a butterfly valve is widely used in the industrial pipeline systems because of its smaller pressure loss and simple structure [1,2]. In the past decades, numerous researchers have focused on the optimization of butterfly valve structure and the analysis of flow characteristics in order to reduce its pressure drop. Kimura et al. [3] established the theoretical prediction equations for the pressure loss coefficients of the butterfly valve and found that the theoretical predictions and experimental values were in good agreement. Kim et al. [4] conducted preliminary numerical simulation to analyze the internal flow field of the butterfly valve but did not quantify the regulating characteristics. Corbera et al. [5,6] used genetic algorithms to optimize the design of butterfly valve plates to improve the regulating characteristics of butterfly valves. The results proved the ability of the techniques to improve the valve disc, thereby improving the control of the flow. Cui et al. [7] improved the butterfly plate structure to reduce the resistance coefficient. The results show that when the valve opening is 100%, the resistance coefficient decreases by 12%. Sun et al. [8] found that an increase in the roughness height significantly increased the frictional pressure drop. Liu et al. [9] changed the tri-eccentric butterfly from a full-axis type to a double-end-axis and reduced the valve pressure drop at a small opening, but this does not work when the valve is fully opened. Banis [10] investigated and evaluated the idle speed parameters of a novel throttle body. The advantages of his novel design include no obstructions or resistances in the flow path at the fully open throttle position. However, his novel throttle body required alteration in fuel injector angle, a different idle air bypass system, and increased leakage at fully closed throttle position. Danbon and Solliec [11] compared the effect of a straight pipe with that of an elbow on the flow through a butterfly valve. The comparison showed that the installation of the elbow ahead of the valve might produce significant fluctuations in flow, especially when the valve is fully open. The influence ceased to be visible on the far side at eight times the pipe diameter when the flow became steady.
The flow coefficients of various types of butterfly valves were also studied by Kim and Yoon [12], and their results showed that the eccentric valve produces a greater flow coefficient than the concentric valve. In the most recent work, Nguyen et al. [13] studied the relationship between the flow coefficient of a globe valve and the Reynolds number. The flow coefficient increases steadily before becoming convergent, and it remains at a constant level when the Reynolds number is 105.
Park et al. [14] evaluated the effects of different flow characteristics of various valves in order to reduce water hammer in seawater treatment piping. They suggested that an equal-percentage butterfly valve be used to mitigate the pressure oscillation of the system during the time the valve was being closed.
Using CFD in analyzing the flow characteristics of BFV and predicting the flow behavior based on valve geometry was also investigated by many scholars. Kapri [15] and Balaji et al. [16] numerically investigated the pressure drop passing through the BFV. They conducted a comparative study of the throttle body with different shaft profiles using CFD analysis. They simulated a steady flow of air passing through the BFV using different shaft profiles. Their conclusion was that the rectangular shaft of the BFV creates less of a pressure drop than the circular shaft, and thus improves the engine performance, fuel economy and emissions. The prediction equations were functions of the valve’s opening angle, thickness, and the diameter of the valve disc. Changchun and Haengmuk [17] and Chang Chun et al. [18] carried out numerous investigations to obtain the best design to reduce pressure drop across the BFV by analyzing the flow based on mathematical models, CFD and experimental results. Leutwyler and Dalton [19,20] performed a CFD study in two and three dimensions for symmetric butterfly valves in compressible fluids at various angles and over a range of pressure ratios. FLUENT software was used with the different turbulence models. They favored the k-ε turbulence model for its well-rounded capabilities and moderate computational costs. In addition, they also validated grid refinement, coefficients for lift, drag and torque against experimental values. Said et al. [21] also investigated, both numerically and experimentally, the flow characteristics of the butterfly valve using Fluent. The simulation succeeded in predicting the flow coefficient; however, at small angles, care must be paid.
Although the above studies have improved the regulating characteristics of the butterfly valve to a certain extent, the structural pressure drop cannot be completely eliminated for the condition of large-valve opening, that is, the valve stem and the valve plate in the butterfly valve assembly are always in the flow field, which obstructs the fluid flow.
On the other hand, pinch valves are a type of flow control device that use a pinching mechanism to open and close the inner tube that is in contact with the fluid [22]. This mechanism can be operated manually, pneumatically, or electrically. The main benefits of pinch valves are that they have no flow control mechanism in the fluid flow path in which dead zones or fluid pockets can be trapped, and they create minimal turbulence in the flow compared to other types of valves. Little work has been carried out in the pinch valve area, experimentally or numerically. In an effort to evaluate the flow characteristics through pinch valves and the profile area while pinching, Chaudhari [23] carried out a numerical simulation to determine the pressure drop, volumetric flow rate, and flow coefficient of a pinch valve at several valve openings. The shape of the cross-section of the pinched area was assumed to be elliptical. Hirtum [24] formulated three quasi-analytical geometrical ring models, namely, ellipse, stadium, and peanut, to serve as a low-cost ring shape estimation as a function of the pinching degree. A circular elastic tube was compressed between two parallel bars for pinching efforts between 40 and 95 percent. The stadium ring model showed a characteristic error of less than 4 percent of the tube diameter when compared to the experimental results.
It is evident that many scholars have extensively investigated BFVs, both experimentally and numerically, and little work has been carried out on pinch valves, especially regarding their flow characteristics. Therefore, based on the literature survey, no previous attempts have been made to assess the flow characteristics of pinch valves at various pinching degrees versus BFVs in steady flow applications. Therefore, this work aims to fill this research gap by investigating the flow characteristics of air through butterfly valves with different design parameters and pinch valves at different pinching degrees using CFD software. Furthermore, a new mathematical model to estimate the profile area of a pinch valve at various pinching degrees is developed and compared with the CFD analysis. Thus, the following items summarize the aim of this work:
  • Numerically investigate air flow characteristics of BFVs at various valve parameters, namely, shaft diameter, valve thickness, and valve disk edge.
  • Numerically investigate the air flow characteristics of pinch valves at various pinching degrees.
  • Develop a simple mathematical model for determining the area of the pinch valve at various pinching degrees.
  • Compare the air flow characteristics of BFVs and pinch valves.

2. Numerical Simulation and Boundary Conditions

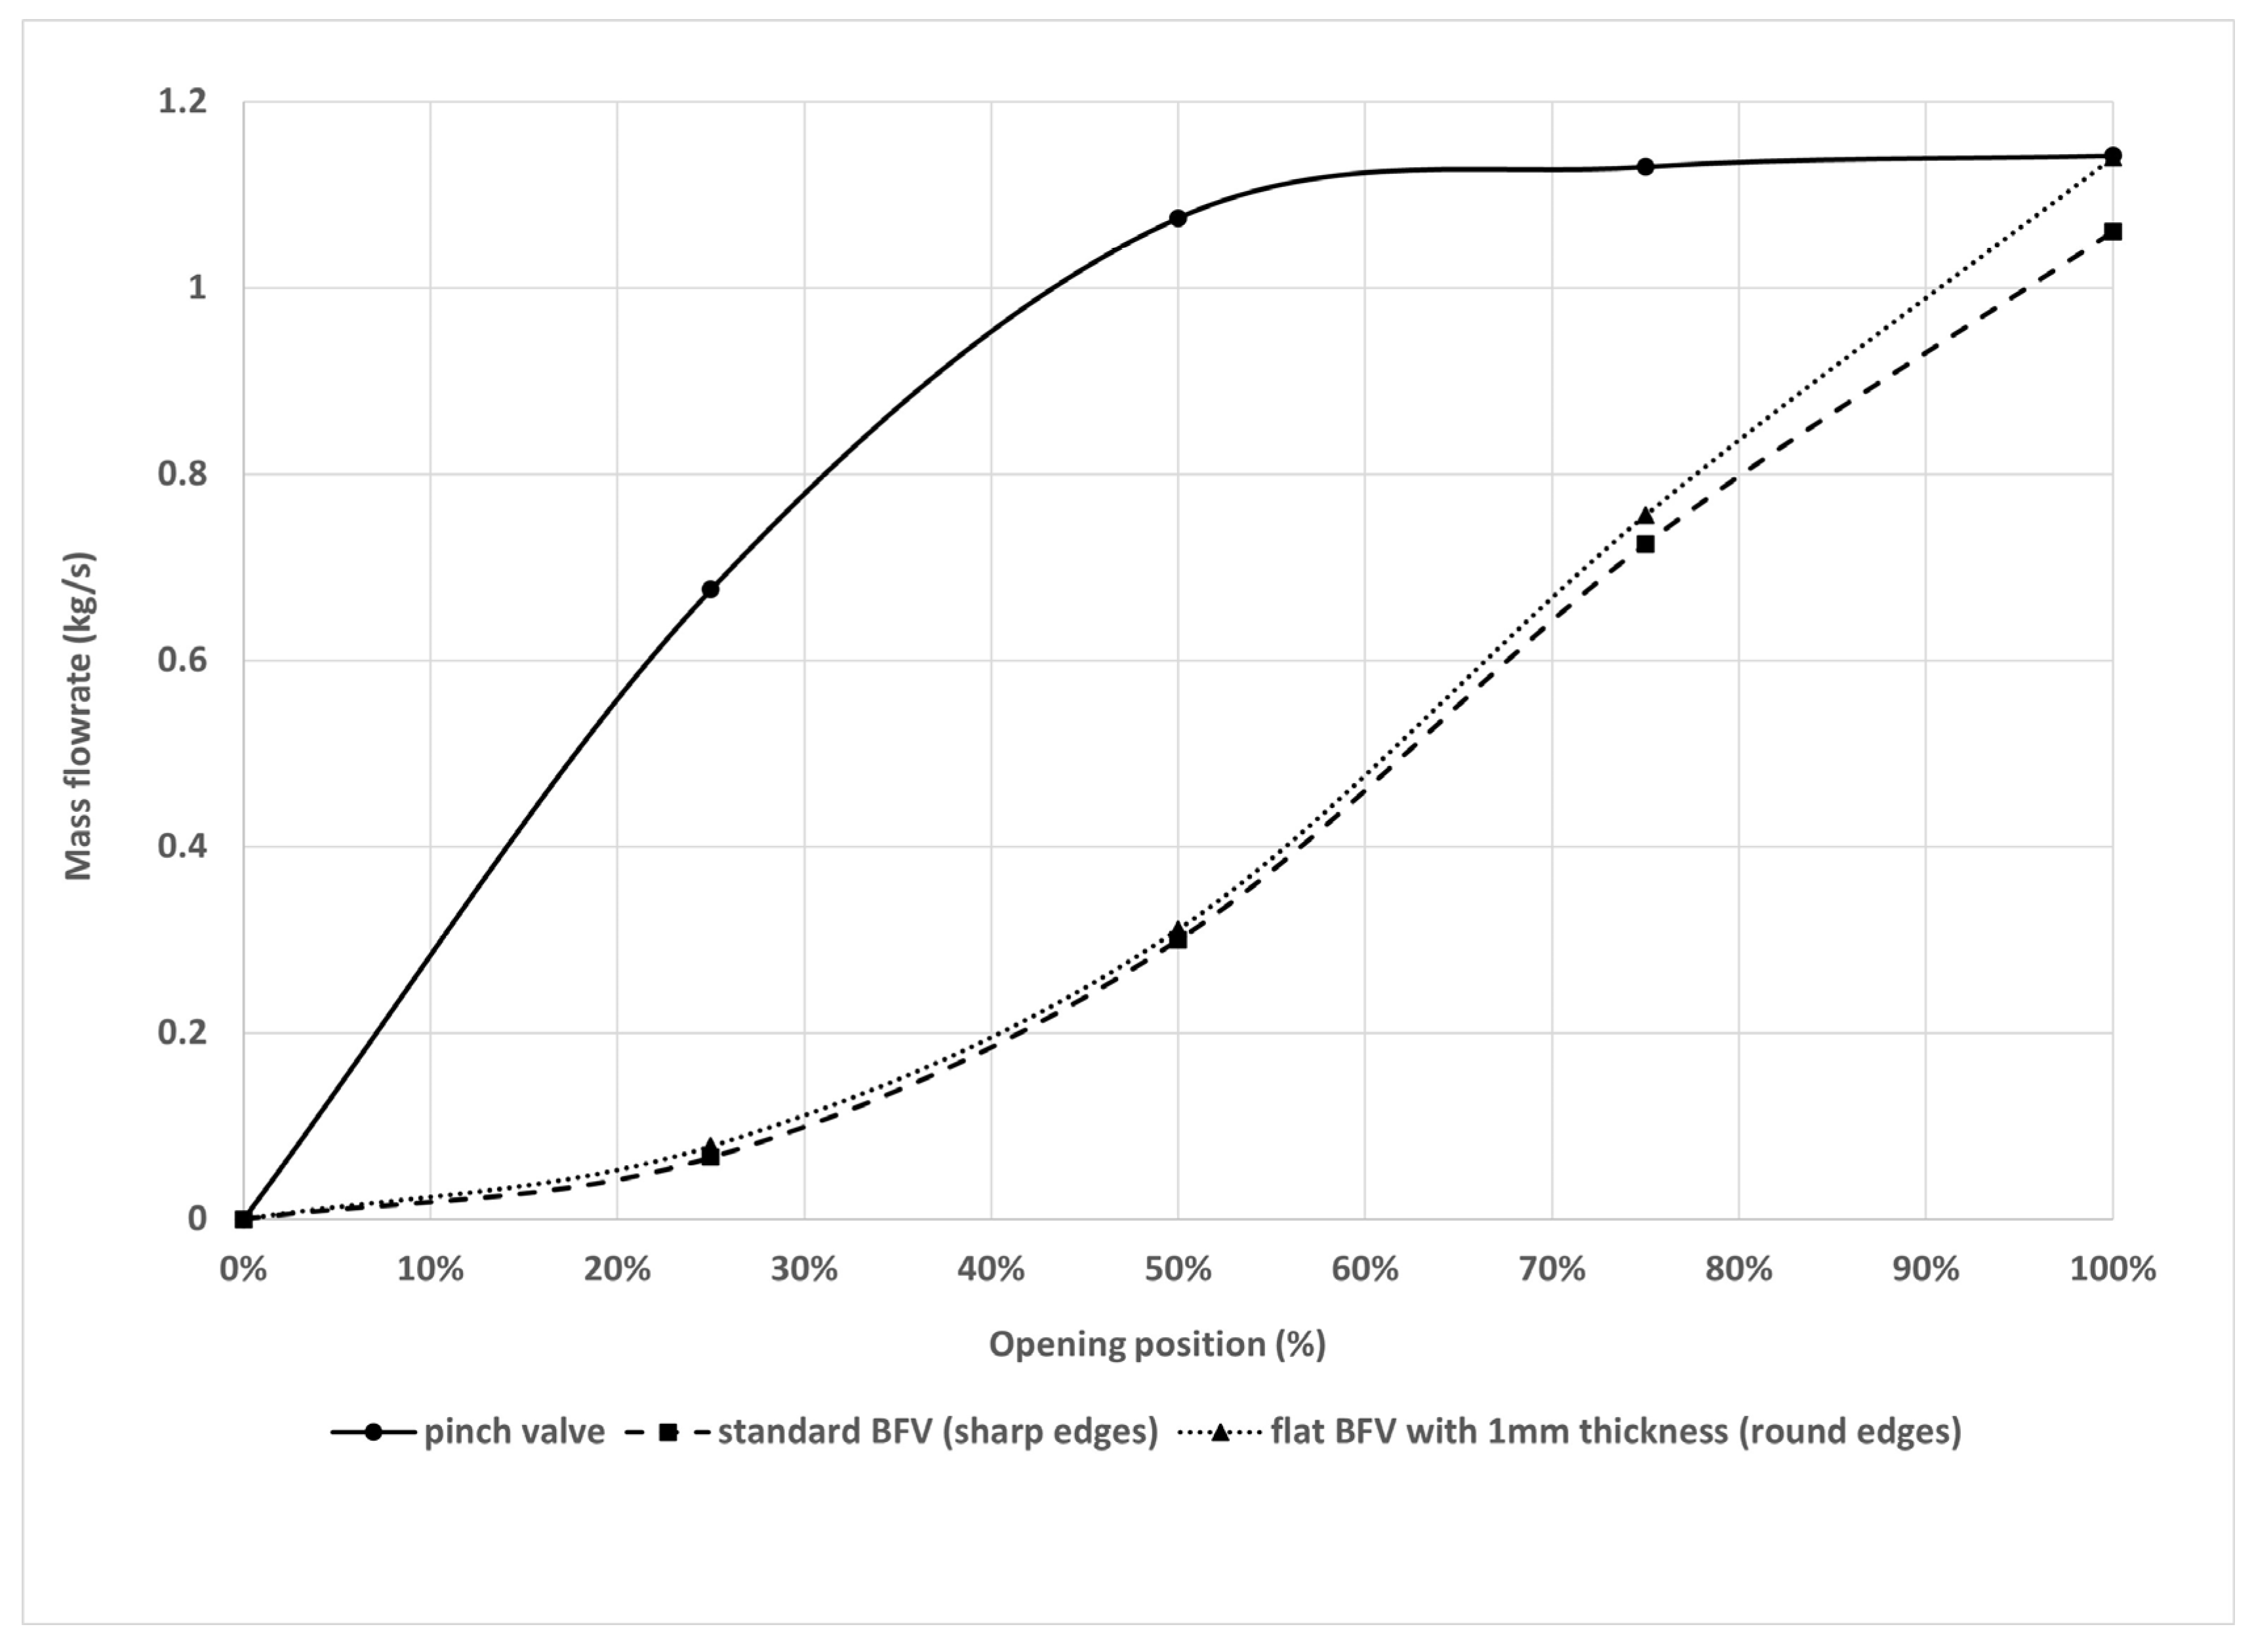
A steady-state fluid dynamics analysis was conducted using air as the fluid. The performed analysis used standard BFV and pinch valves for comparison. The SolidWorks 2020 software was used using its flow simulation module. Three boundaries were involved, namely, inlet, outlet, and wall. The inlet pressure boundary condition was set at 1 bar while outlet pressure was set at 0.9 bar. Walls were assumed to be adiabatic with no-slip condition while the standard k-ε turbulence model was used. The analysis was carried out using air flowing at 20 °C. These boundary conditions were also used for the pinch valve. Hence, the performance analysis was performed to compare the mass flow rate of air through BFV and pinch valve.

2.1. Governing Equations

The standard k-ε model in CFD was used which describes the flow characteristics in a pipe. The steady air flow in the pipe is governed by the momentum and continuity equations as expressed below.
Momentum Conservation equation
( ρ u i u j ) x j = ρ x i + x j μ ( u i x j + u j x i ) ( ρ u i u j ) x j + F i
Continuity equation
ρ u i x i = 0
k equation
( ρ k u i ) x i = x j ( μ t σ k + μ ) k x j + μ t ( u i x j + u j x i ) u i x j ρ ε
ε equation
( ρ ε u i ) x i = x j ( μ t σ ε + μ ) ε x j + C 1 ε μ t k ( u i x j + u j x i ) u i x j C 2 ρ ε 2 k
SolidWorks uses the Finite Volume Method (FVM) to solve the Navier–Stokes equations which is considered to be more accurate especially when having structured mesh such as cartesian mesh which is used in SolidWorks.

2.2. The Butterfly Valve Model

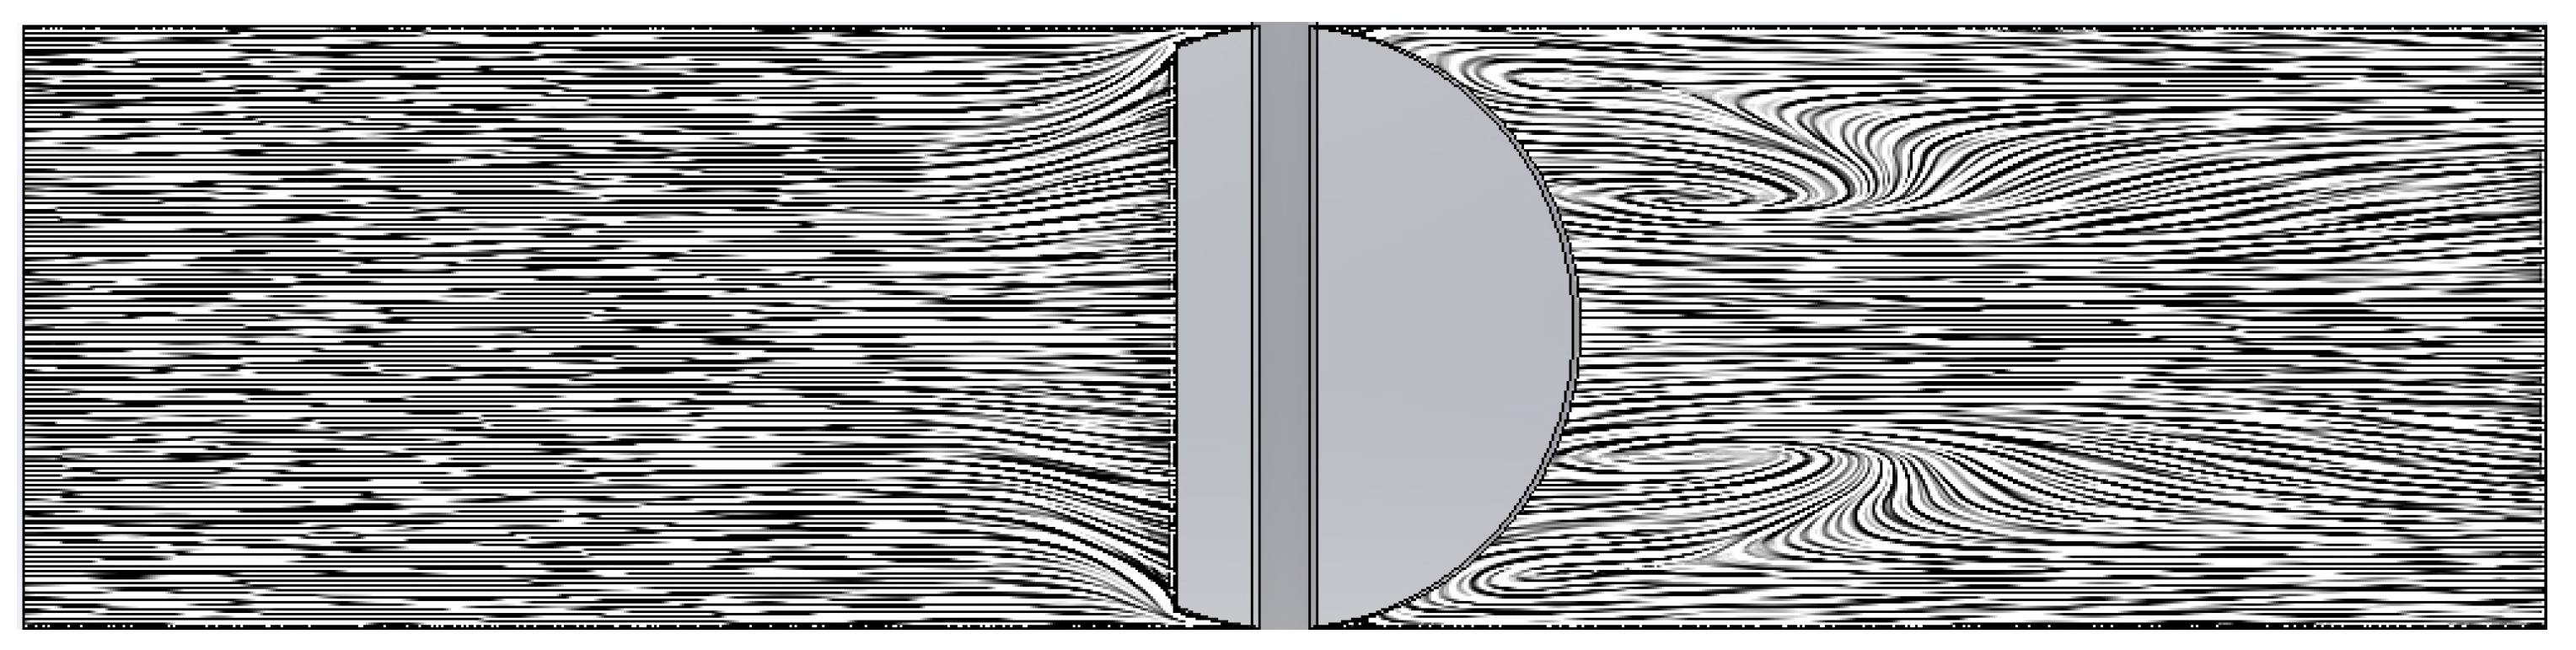
The model is based on the steady flow of air passing through a standard BFV in a 400 mm length pipe with an inner diameter of 100 mm and zero roughness. The butterfly valve has a diameter of 100 mm, valve shaft diameter of 10 mm, and a thickness of 3 mm. The BFV is located in the middle of the pipe with a 200 mm pipe on each side of the throttle valve. The opening angle of the BFV varied from 10 degrees to fully open in increments of 10 degrees while the BFV rest angle was set at 5 degrees. The geometry of the BFV and its meshing (global and local) were carried out with the assumption of gas-tight, meaning that there is zero leakage at the fully closed position. It is important to note that since this is a numerical study, manufacturing inconsistencies and tolerances are not considered.

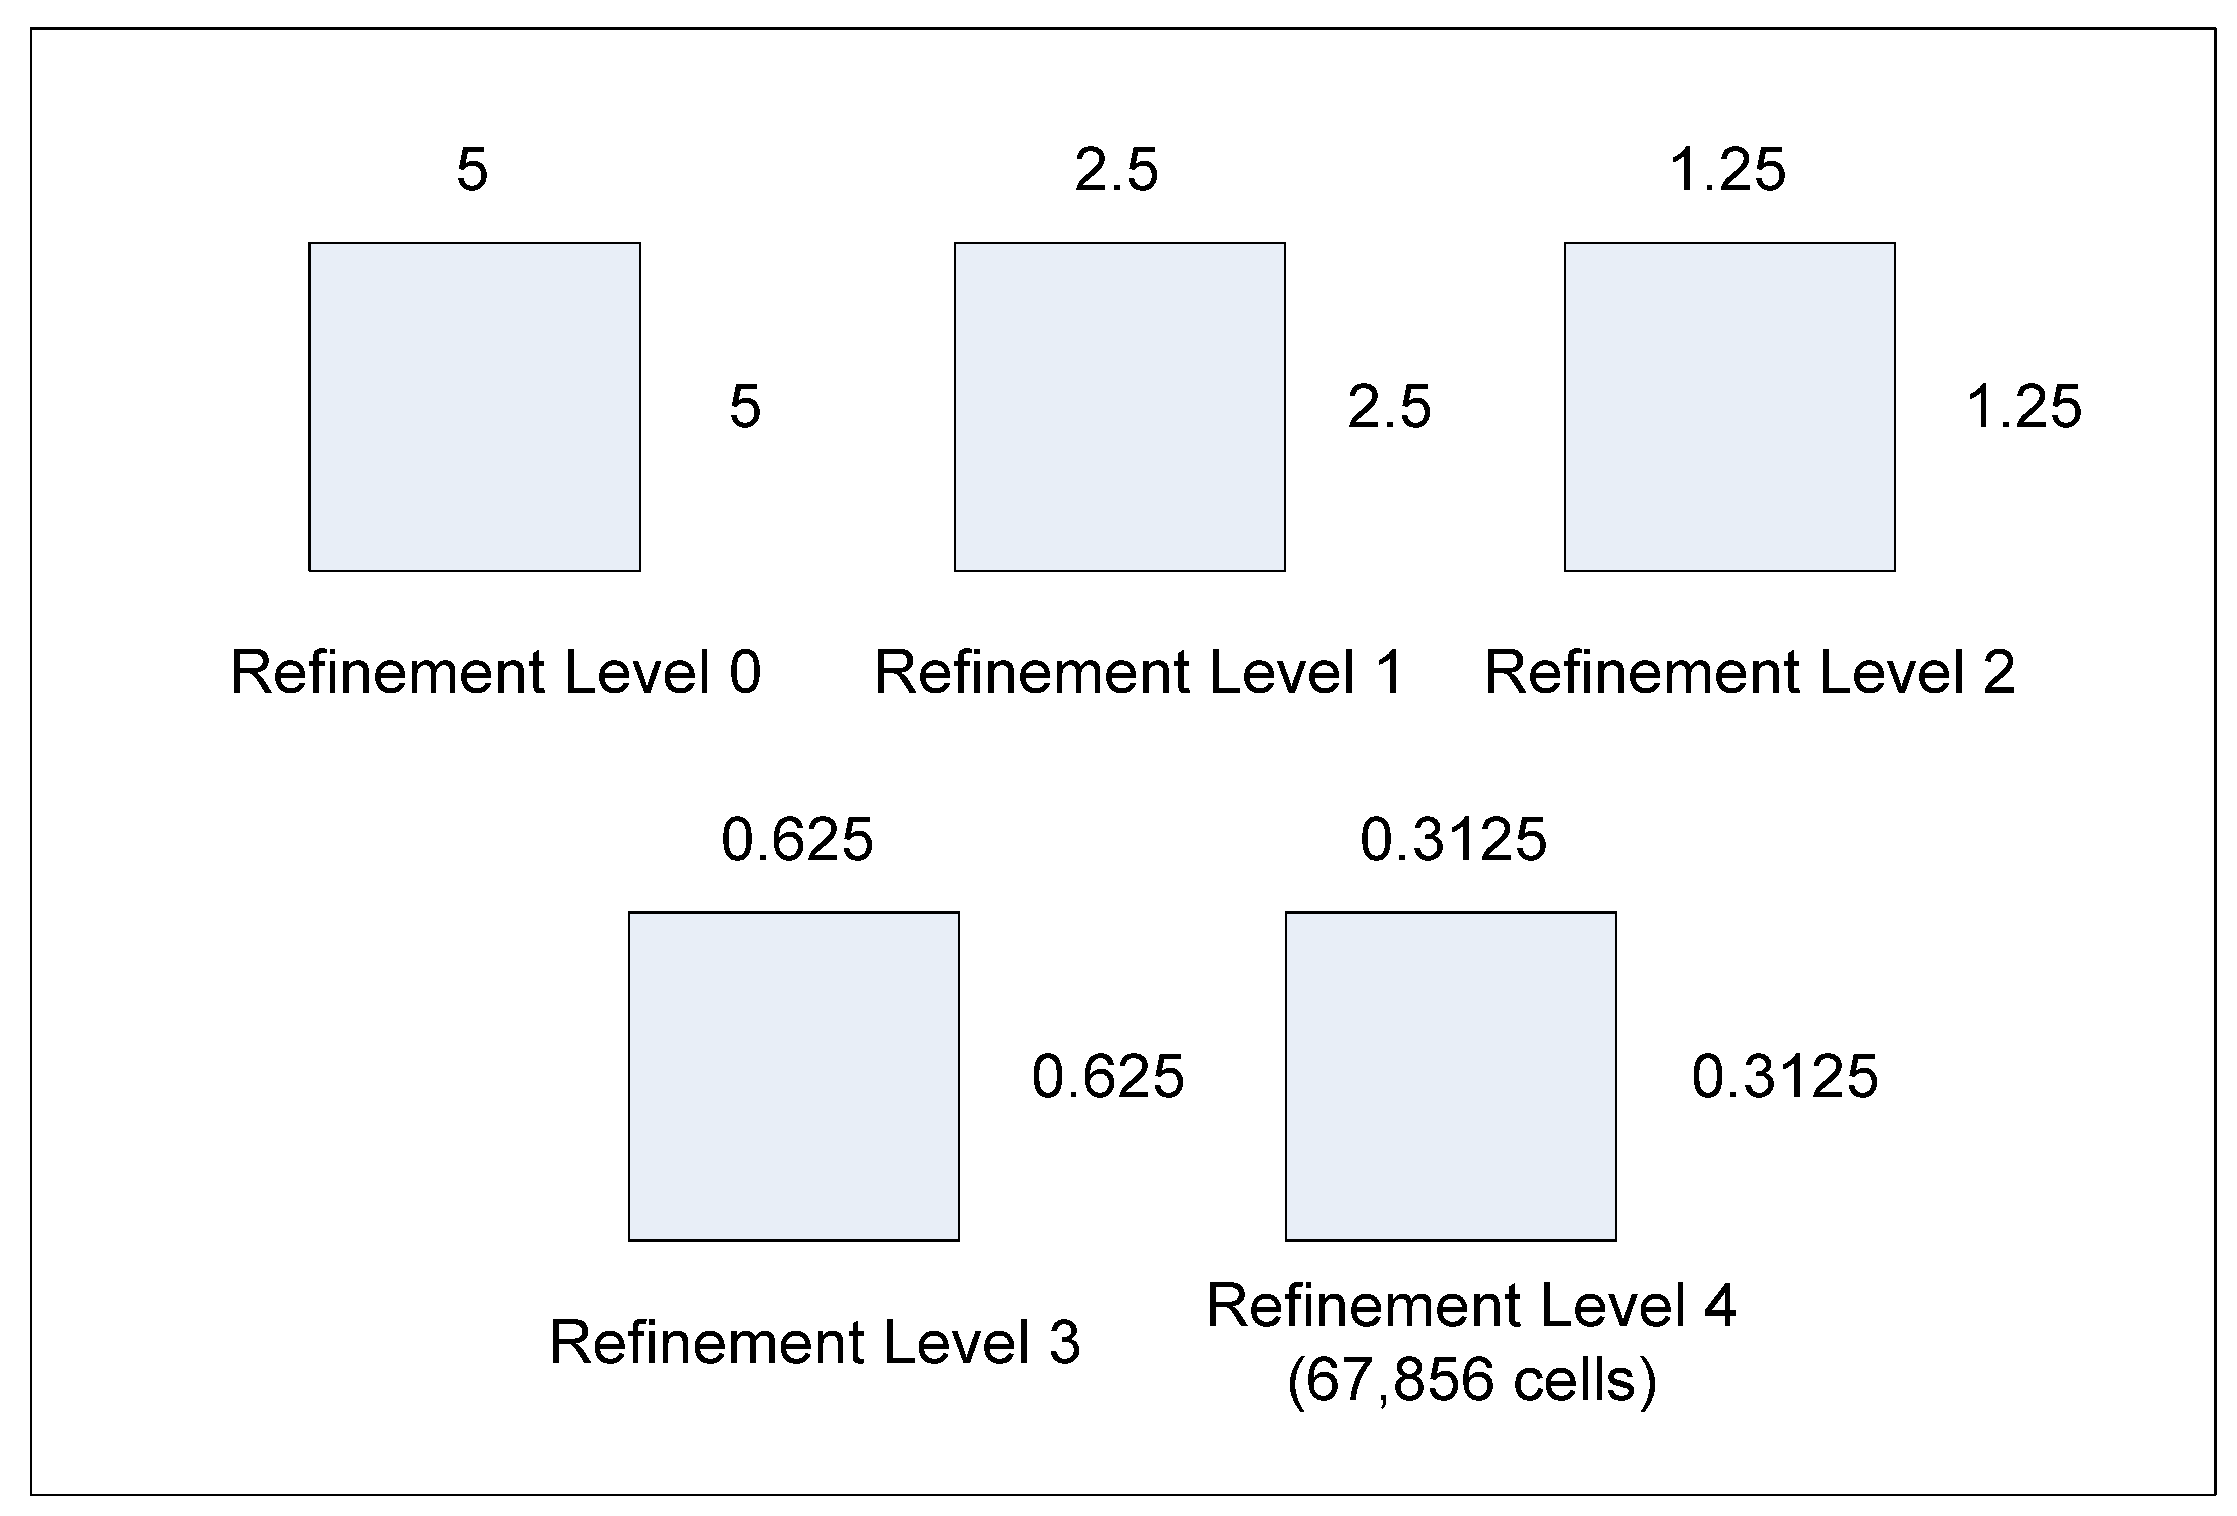
2.2.1. Mesh Independence Test for BFV

The most frequent challenge in simulated engineering cases using CFD is the meshing resolution. It has a strong influence on the quality of the numerical results and computational time required. In this case, the pressure drop across the BFV of a 0.1 bar throughout the 400 mm length pipe was tested numerically versus number of cells while keeping the BFV at 60° opening position. The global meshing was started from a level of 3 for the mesh until a maximum level of 7 which corresponds to 126,354 cells. Using the parametric study option in the SolidWorks 2020 software, the number of mesh elements was increased gradually until the maximum setting of the mesh level of 7 was reached.
As illustrated in Table 1, as the mesh level increases, the error in the numerical solution decreases. Although the error at mesh level 5 is less than 1%, all results obtained in this study were conducted at mesh level 6, as this would result in a more accurate result.
Since air is in direct contact with the BFV as it passes through the valve, it is necessary to provide a local mesh in order to capture the behavior of air through the short distance of the valve. Therefore, a local mesh of 6 cells across the gap with a refinement level 4 was used to carry out this study. This refinement level corresponds to a mesh size of 0.3125 mm which resulted in 67,856 number of cells. Figure 1 shows the cell size based on refinement level:

2.2.2. Model Validation

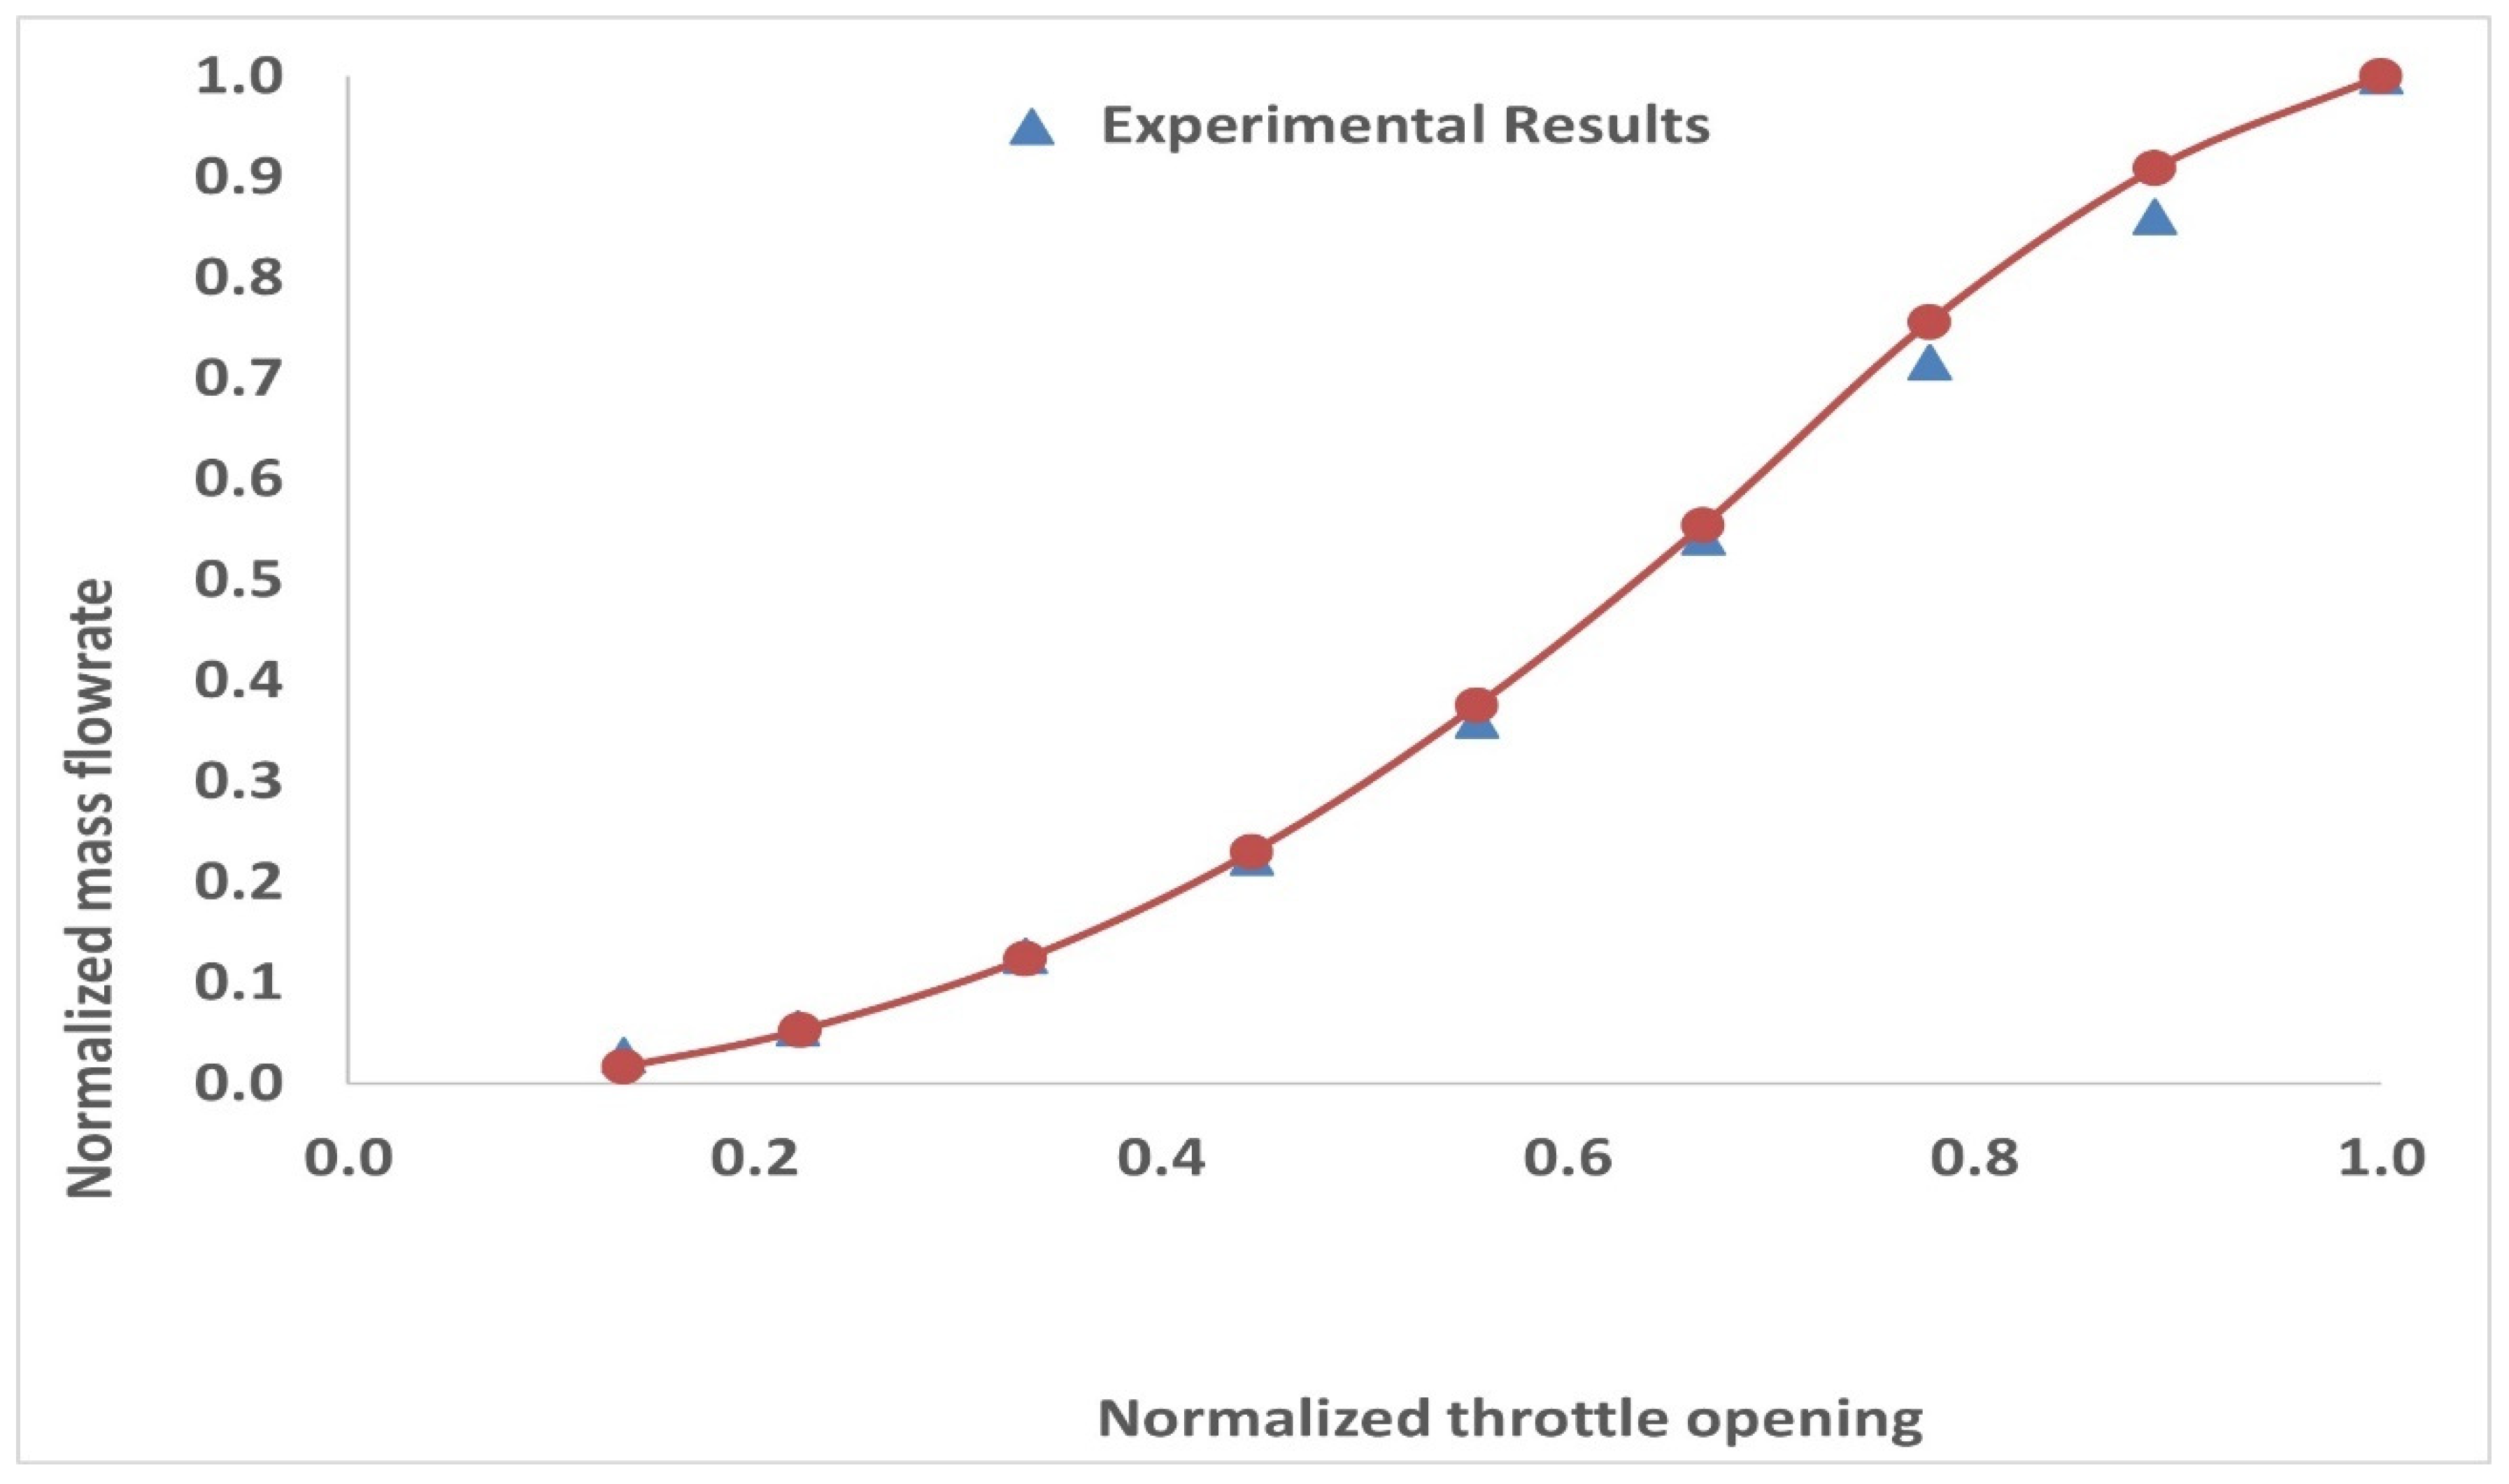
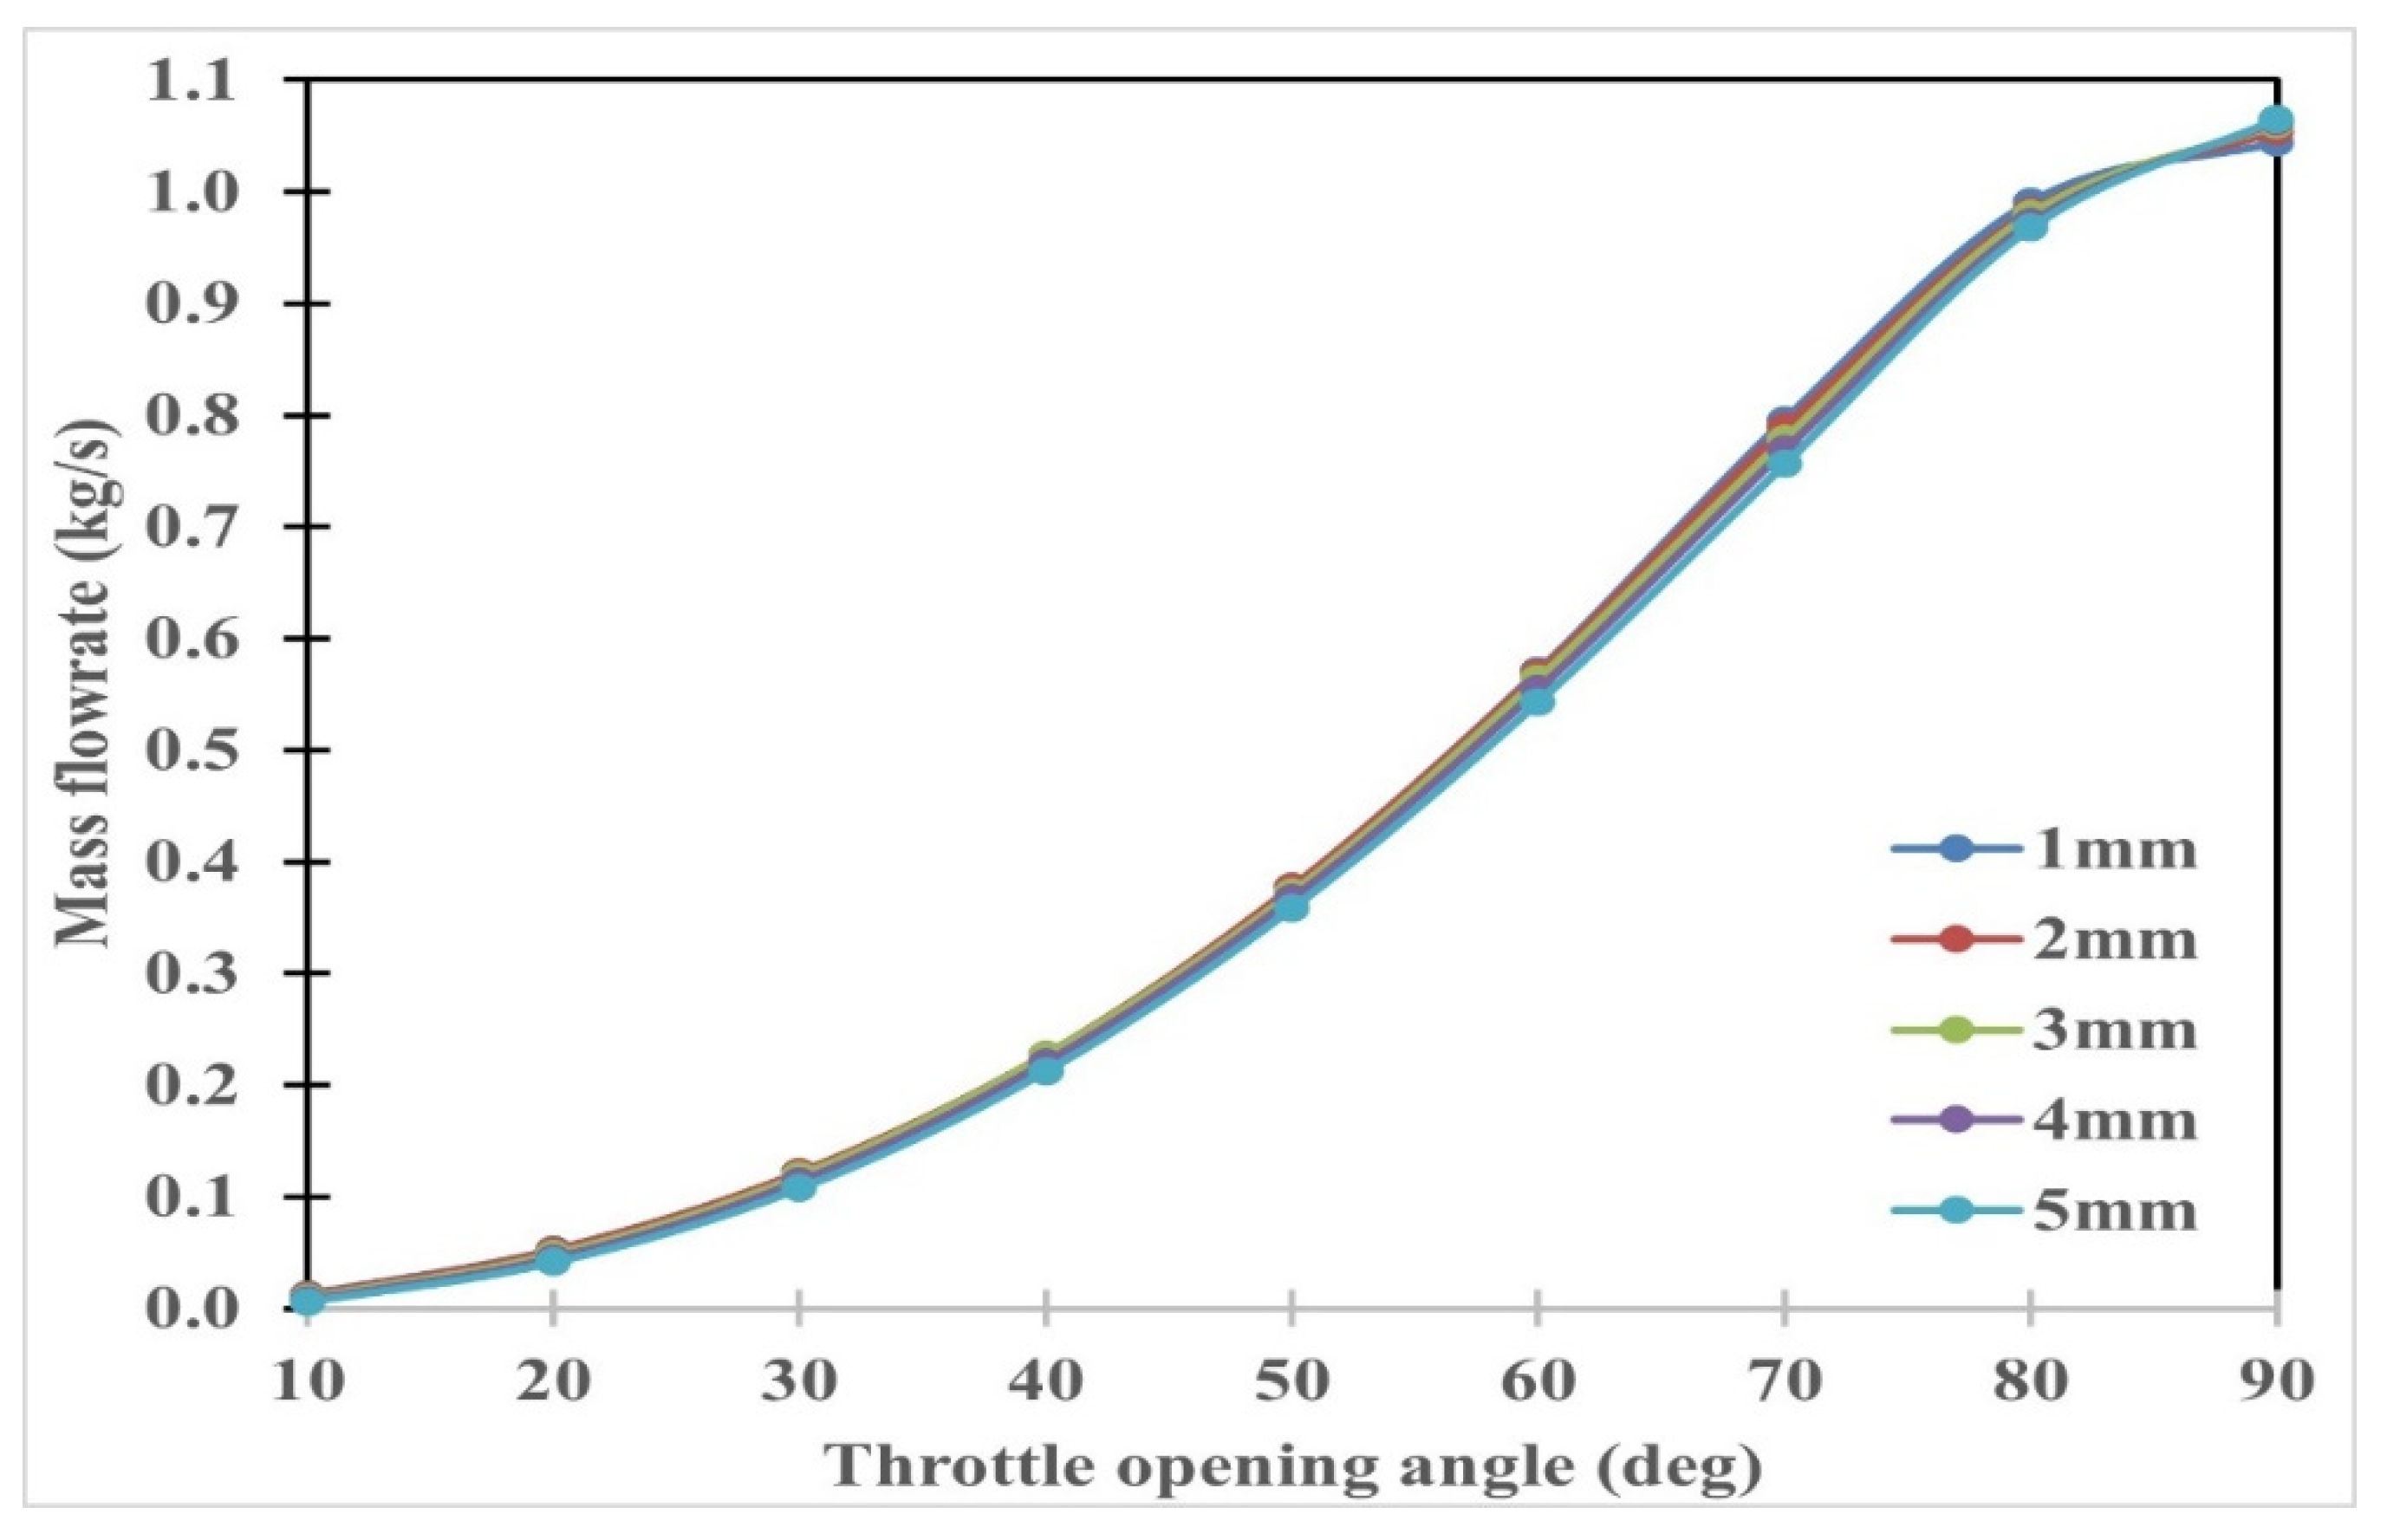
In order to evaluate the accuracy of the CFD results for BFV, model validation was performed with the published experimental data in [25]. The experiment was performed using a steady-state air flow passing through a single cylinder engine bench at different throttle opening positions. This throttle body bore was 30 mm. These data were all used in the SolidWorks flow simulation module to validate the results. Figure 2 shows that the CFD predicted values are in reasonably good agreement with those of experimental results within an error of about 5%.

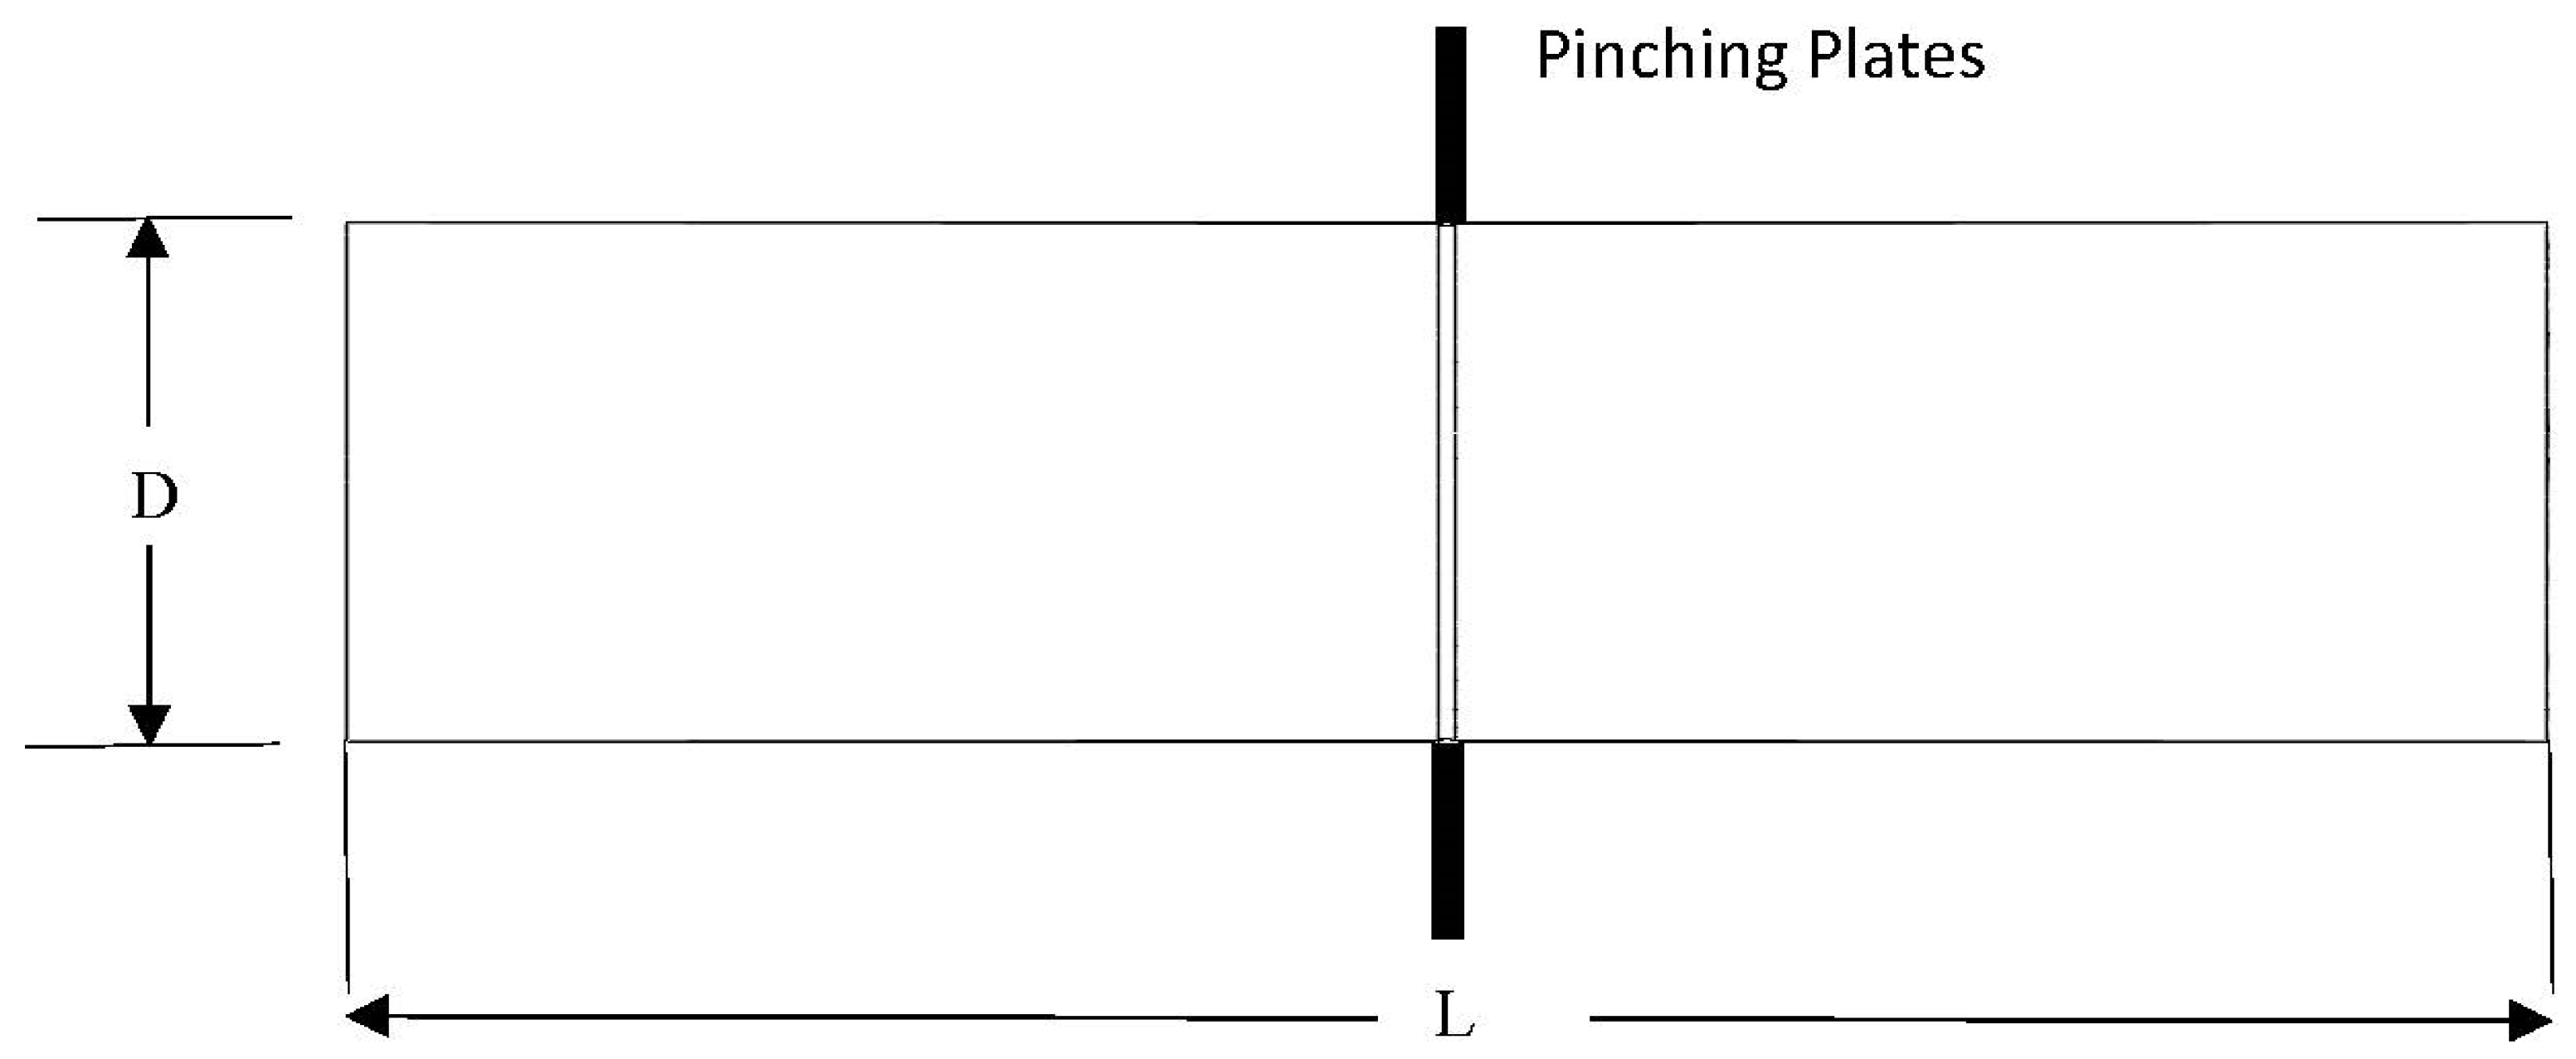
2.3. The Pinch Valve Model

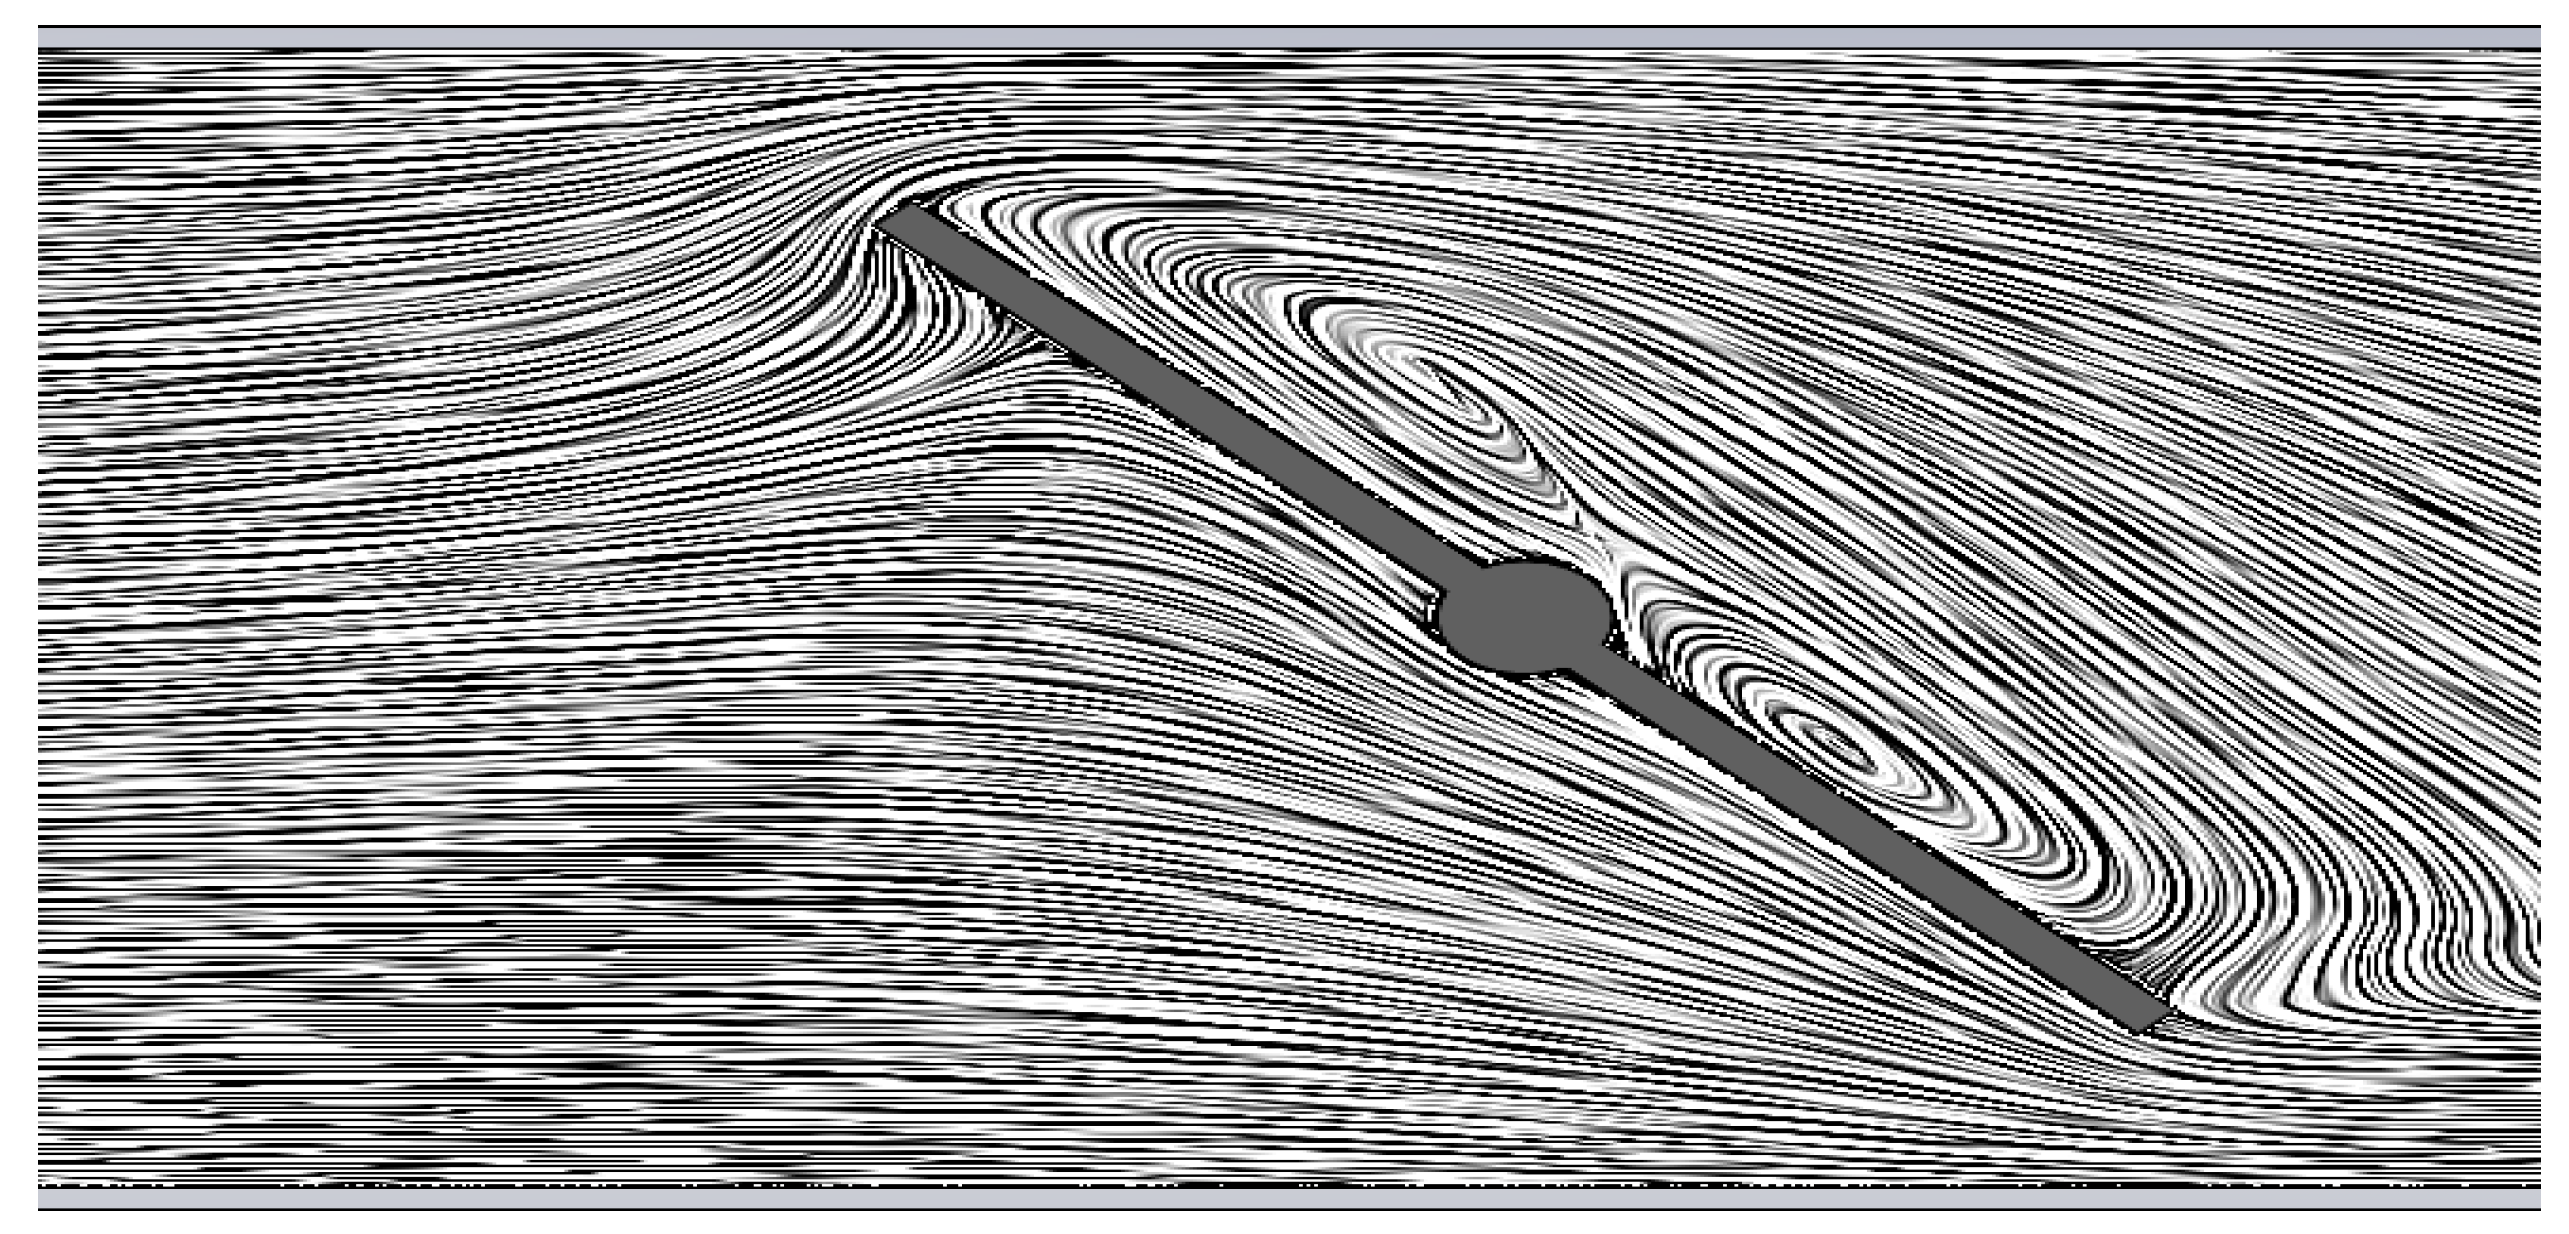
The pinch valve model is based on the steady flow of air passing through a flexible rubber (sleeve). Two parallel plates which are made of aluminum (1060 aluminum alloy) and have a thickness of 5 mm are used to pinch the valve from the middle section of the sleeve as shown in Figure 3. The height of the aluminum plates is assumed to be 155 mm which is higher than the flexible rubber when fully pinched.
The length of the sleeve (L) is 400 mm, its internal diameter (D) is 100 mm, and its thickness is 3 mm. The material of the pinch valve sleeve was assumed to be natural rubber with elastic behavior. Material properties of the sleeve are shown in Table 2.
Nonlinear static analysis of the pinching process was performed with the activation of Large Deformation Formulation. The Newton–Raphson iterative technique and Newmark integration method were selected while the time increment was set to auto-stepping. There was no penetration contact type between the pinching plates and the valve sleeve and a friction value of 0.05 was used. Standard mesh method was applied. The final refined mesh created 49,324 nodes and 25,386 elements. The pinching degree started at zero to 49 mm with 1 mm step increment from both sides. Figure 4 shows the meshed valve sleeve and pinching plates.

2.3.1. Mesh Independence Test for the Pinch Valve

As in the case of BFV in which mesh independence was tested, the pinch valve test was also carried out for mesh independence. A pressure drop across the pinch valve of 0.1 bar throughout the 400 mm length sleeve was tested numerically versus number of cells while keeping the pinching degree at 20 mm from both sides of the sleeve using the type of material mentioned in Table 2. The global meshing started from level 3 with 3148 cells until a maximum level of 7 with 96,294 cells which corresponds to the most accurate result. Using the parametric study option in the SolidWorks 2020 software, the number of mesh elements was increased gradually until the maximum setting of the automatic mesh level 7 was reached. As illustrated in Table 3, as the level of meshing was increased, the error in the numerical solution decreased. Although the error at mesh level 5 is less than 1%, all results obtained in this study were conducted at mesh level 6, which would result in a more accurate result. The mesh level of 6 created 34,749 cells. No local mesh was used in the pinch valve flow simulation since flow goes through a smooth convergence and divergence of the sleeve.

2.3.2. Model Validation

Validating the CFD model is crucial and must be performed in accordance with various characteristics and specifications for the studied valve. Thus, for better accuracy of the CFD results, the flow coefficient (CV) obtained numerically for the pinch valve was validated against available manufacturer data sheets [26]. The pinch pipe modeled in CFD was nine inches in length with a 2D pipe length upstream and 6D downstream. The flow was assumed to be fully developed with a constant flow rate of 0.1 m3/s for all pinching degrees. The surface roughness for the material was assumed to be 10 micron and the material used was ethylene propylene (EDPM) rubber which is in accordance with the material mentioned in the experimental data. Figure 5 shows that the CFD results match well with the available data for the flow coefficients with error of less than 2%.

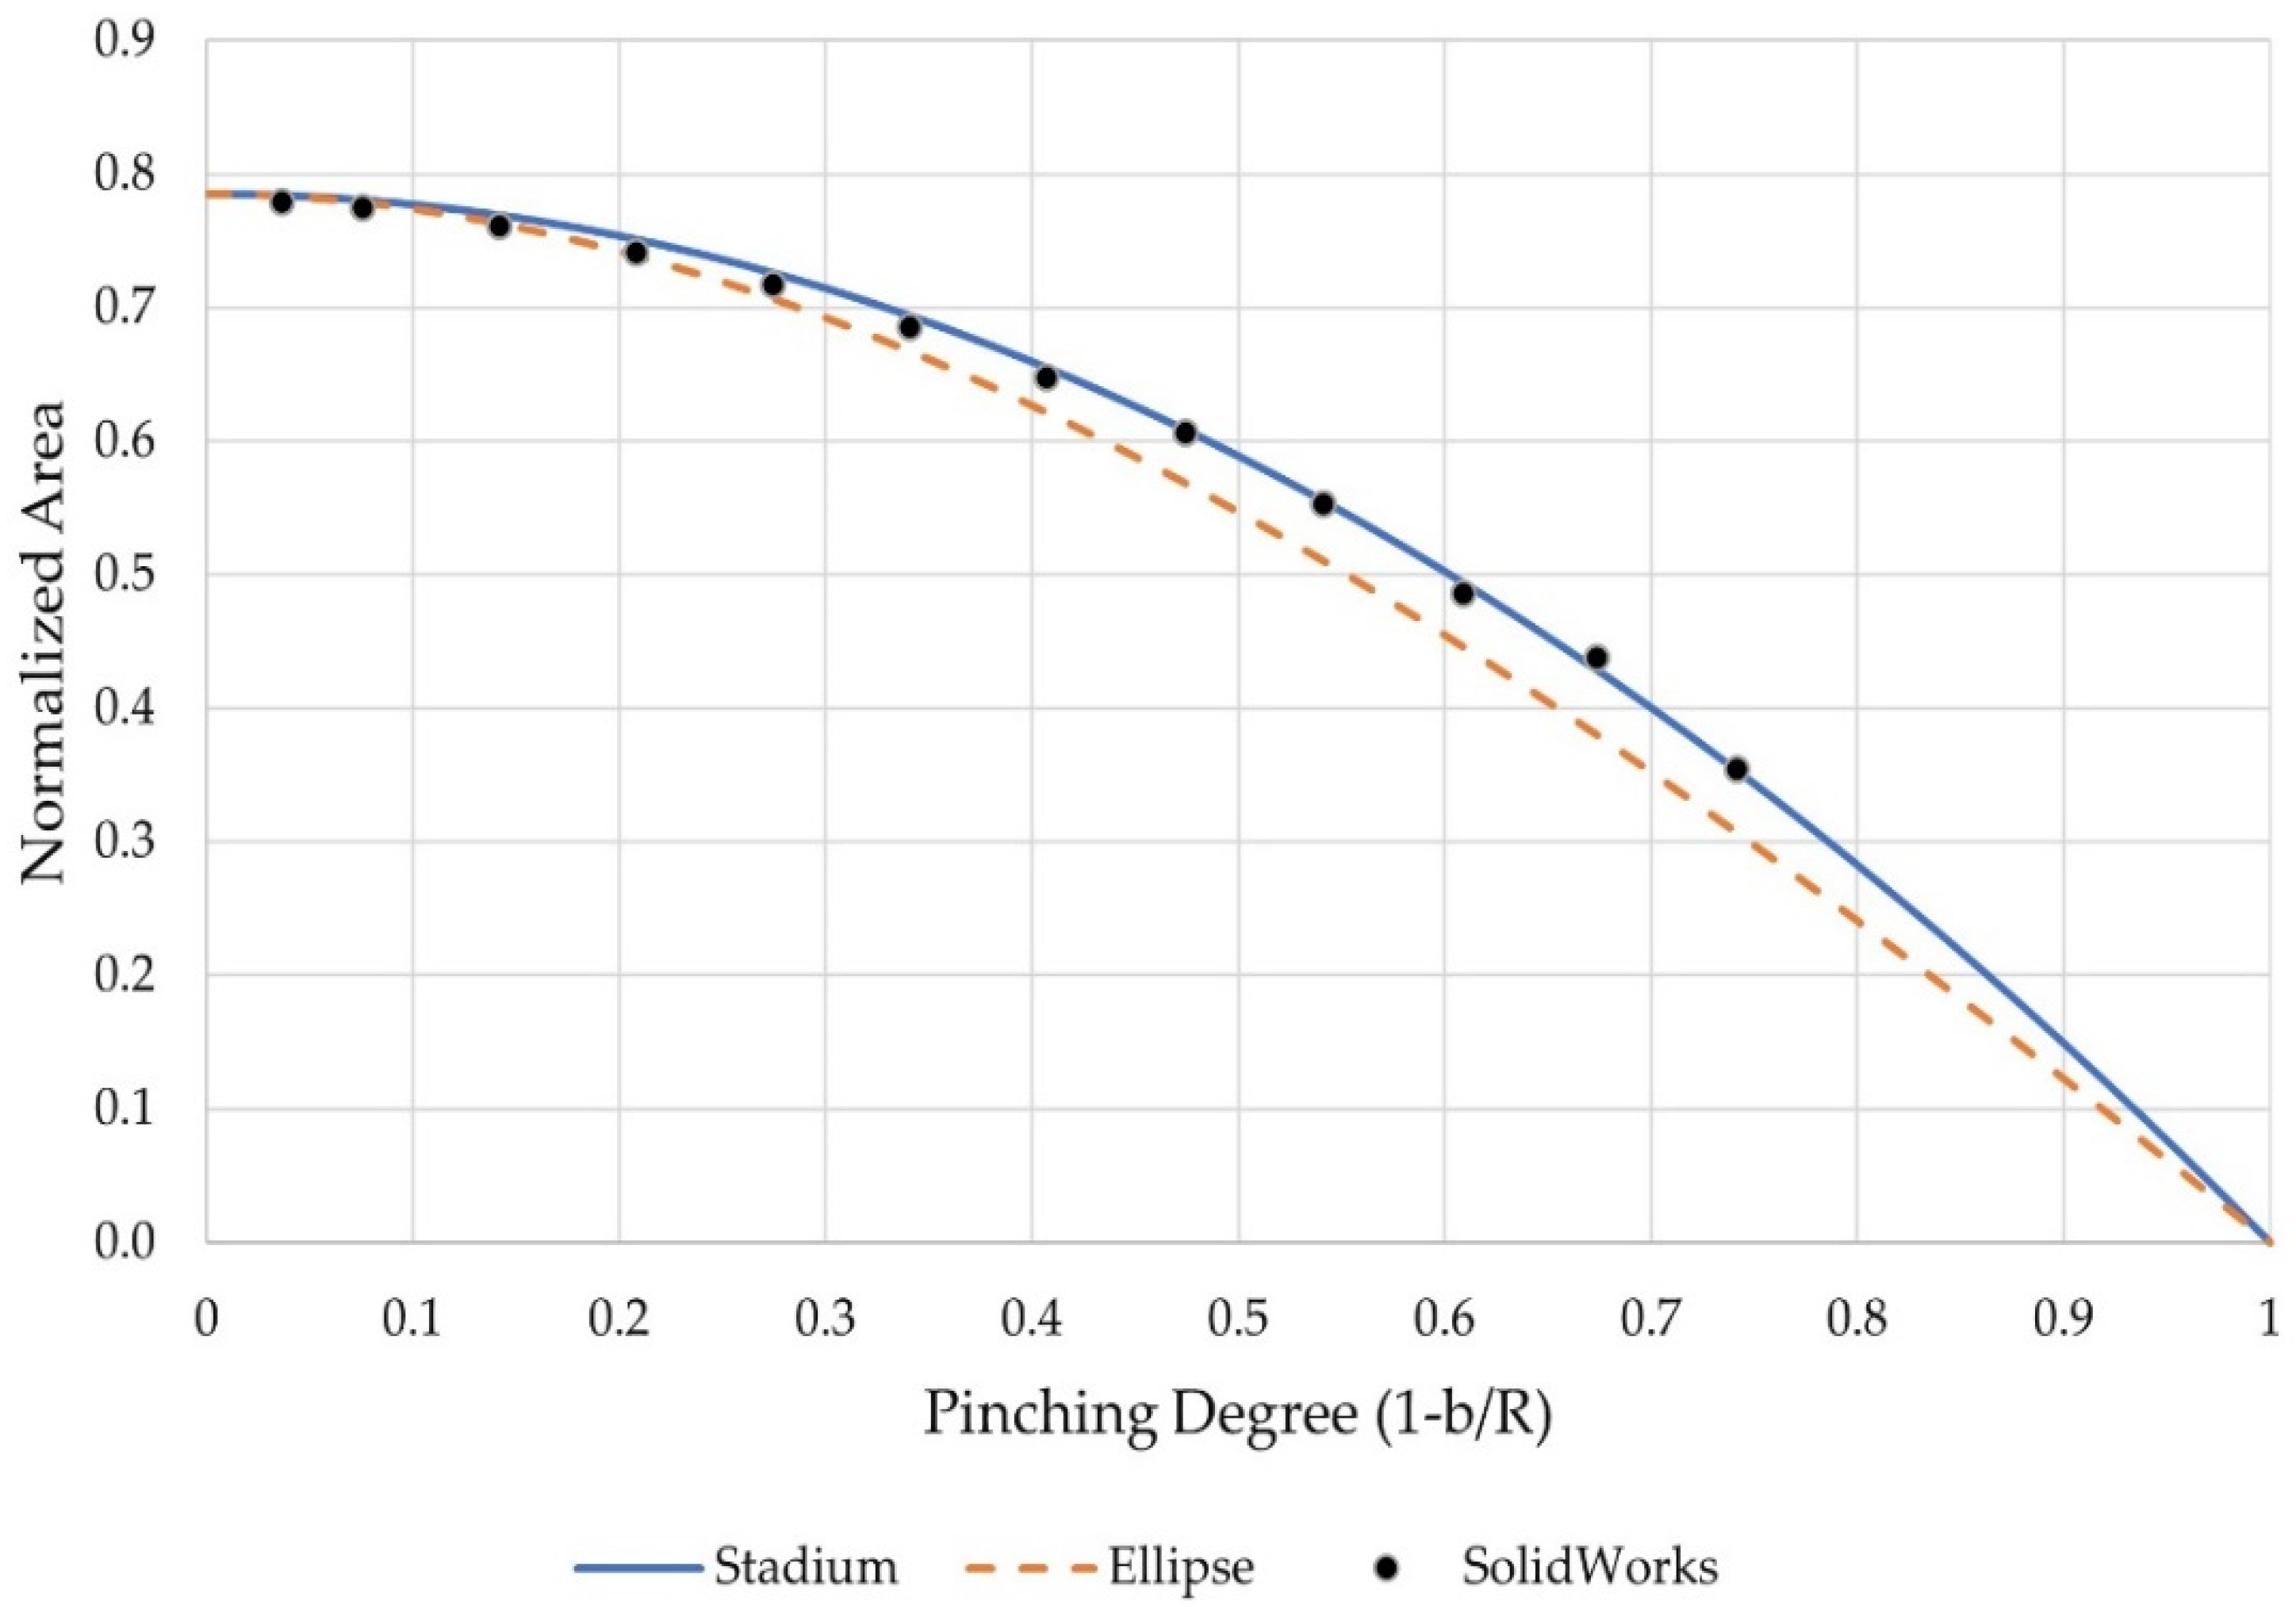
2.3.3. Pinch Valve Area Model

In order to formulate the mathematical model for determining the pinch valve area at various pinching degrees, the main assumption made here is that the pinch valve sleeve is in direct contact with the aluminum squeezing plates and is assumed to follow the shape of these pinching horizontal parallel plates which forms the horizontal lengths while the non-contact rubber forms a semi-circle on each side of the profile as shown in Figure 6. The upper and lower horizontal length ( x ˜ ) sides that are in contact with the pinching plates while the vertical length (r) represents the radius of the semi-circle. Therefore, the final shape of the squeezed profile forms a rectangle and a circle.
The resulting profile is usually referred to as the stadium or disco rectangle [27,28]. The results from the new method will be compared later with the CFD results. At each step of pinching degree, the perimeter of the valve sleeve remains constant throughout. Based on this assumption, the area and perimeter of a stadium shape are given by
A = π r 2 + 2 r x ˜
P = 2 ( π r + x ˜ )
These two equations need to be modified to account for the distance the pinching plates travel from each side (h). The undeformed and deformed pinch valve sleeve of a stadium profile with the new variable h are shown in Figure 7.
The area of the two semi-circles at both ends where the pinching plates are not in contact with the valve is
A s e m i - c i r c l e = π ( R h ) 2
P = 2 π R
and the perimeter of the two semi-circles is
The total deformed area could be expressed in terms of the semi-minor axis b, where
b = Rh
A d e f o r m e d = π b 2 + 2 π h b

3. Research Procedures and Data Analysis

This work used a numerical analysis approach to compare the performance of the BFV and pinch valve in terms of mass flow rate and pressure drop. The methodology involved data collection through simulation, data analysis, and the development of a mathematical model to determine the area of the pinch valve at various pinching degrees. The research procedures used in the study can be described in the following steps:
i
Validating the predictions of CFD models against published data in the literature.
ii
Analyzing the data obtained from the simulation to examine the effect of various valve parameters on the performance of the BFV and pinch valve.
iii
Comparing the performance characteristics of the BFV and pinch valve with respect to the parameters investigated.
The parameters calculated in this work are defined in this section.
  • Flow Coefficient
The flow coefficient Kv is a version of coefficient Cv in mixed SI units. It states the number of cubic meters per hour of water at a temperature between 5 °C and 40 °C that will flow through the valve with a pressure loss of one bar at a specific opening position, as defined by the equation [29]:
K v = Q ˙ S G Δ P
where
  • Q ˙ : is volume flow rate in m3/h.
  • SG: is specific gravity (1).
  • Δ P : is the pressure difference between upstream and downstream in BAR.
Cv = 0.865 Kv
Reynolds number
R e = ρ   · D · V μ
where
  • ρ : density of air at 20 °C (kg/m3).
  • D: pipe diameter which is equal to 100 mm.
  • V: air velocity (m/s).
  • μ : dynamics viscosity (Pa·S).

4. Results and Discussion

4.1. Butterfly Valve Analysis

The geometrical opening area of BFV has been calculated in SolidWorks by projecting the throttle valve opening on a plane perpendicular to the direction of air flow. The opening area at all throttle valve positions was calculated numerically as shown in Table 4.
A numerical study of air flow passing through a straight pipe with no restriction (no throttle valve in the middle) with an inner diameter of 100 mm and 400 mm long was studied. This will provide the flow characteristics such as mass flow rate and air velocity which will be used as a reference for comparison. The mass flow rate and average velocity in the straight pipe are 1.142 kg/s and 135.2 m/s, respectively, while total opening area of the straight pipe with no restrictions is 7854 mm2. At the full opening position of a BFV, the valve shaft and valve disk areas reduce the total area of the pipe compared with a pipe of no restriction by 12.7%.
This results in a maximum mass flow rate of 1.06 kg/s and 125.8 m/s for the air velocity. Table 5 summarizes the calculated flow characteristics of air through standard BFV at all opening positions.
Figure 8 shows numerical results for the air velocity streamlines passing through a standard BFV at four opening positions: 25%, 50%, 75%, and 100% with a pressure difference of 0.1 bar between the two ends of the pipe.
From the above figures, the air distortion downstream of the valve at 25% and 50% is clear due to turbulence. This distortion not only causes a high reduction in the incoming mass flow rate of air, but it is also expected to create noise in the air flow. However, with an opening angle above 75% and full opening, its drawback seems to disappear. These streamlines are plotted at the middle section of the pipe. However, looking at the streamlines closer to the pipe wall at the 75% position, the air turbulence due to the effect of the valve edge is obvious as shown in Figure 9.
Moreover, even at the 100% opening position of the BFV, some air turbulence can still be seen at the upper and lower edges of the valve due to flow separation once the air passes the valve disk as shown in Figure 10.
At the 50% opening positions, as the air flow passes the valve disk, it creates a vena contracta phenomenon especially at the leading tip of the BFV as well as some vortices behind the valve disk as shown in Figure 11.
This vena contracta was also found at 75% opening position of the BFV; however, its location was caused by the trailing edges and away from the valve disk as shown in Figure 12.
At the 100% opening position of the throttle and at the leading edge of the valve disk, a stagnation region is formed, which can be seen clearly in Figure 13. Moreover, the valve shaft creates a pressure drop due to its thickness, which will be discussed in detail later. This was also found in Kumar’s [25] CFD results. In general, the presence of a throttle valve in the air flow path is responsible for a pressure drop which results in a reduced flow rate.
The effect of valve shaft diameter has been studied and Figure 14 shows its effect on mass flow rate. Valve shaft diameter has a significant effect on mass flow rate starting from a 78% opening position and onward. This is because the valve disk diameter becomes more parallel to the incoming flow, where the area of the valve shaft becomes more dominant in obstructing the incoming air flow and its obstruction greatly grows at the full opening position of the throttle.
Therefore, reducing the valve shaft diameter or even removing its extrusion (using flat valve surface) can increase the incoming flow rate by 4.3% at full throttle while a valve shaft with a diameter that is 20% bigger (i.e., 12 mm) can reduce the mass flow rate by 2.3%. Valve disk thickness also has a small effect on mass flow rate. Figure 15 shows the mass flow rate at all throttle opening positions for different thicknesses of the BFV disk.
From Figure 15, the mass flow rate increases as the valve disk thickness is reduced. This is expected to be seen due to the smaller area obstructing the air flow rate. However, at around 95% of the BFV opening position, the 5 mm valve thickness results in a higher flow rate than the 1 mm thickness. This is because the extruded area of the valve shaft obstructing air flow is small compared to the extruded area when using 1 mm valve thickness. In the case of the 5 mm thickness and full throttle, there is less distortion of air as it passes the valve shaft which would eventually result in a higher mass flow rate. Table 6 shows the mass flow rate for different valve disk thicknesses compared to the standard BFV valve disk thickness (3 mm). In general, a thicker valve disk will create more obstruction to the flow, which can result in a larger pressure drop across the valve and reduced flow rate.
Another important BFV geometry which needs to be looked at is the effect of the throttle valve edge on mass flow rate. A comparison between the standard and flat BFVs was performed to understand the effect of the valve’s edge on the flow as shown in Figure 16.
Using round edges in the standard BFV showed an increase in mass flow rate by 15% more than the standard BFV with sharp edges at the 55% opening position. At the full throttle position, the increase in mass flow rate was less than 1%. On the other hand, at full throttle, the flat BFV with round edges shows a 6.2% increase in mass flow rate compared to the standard BFV with round edges. This increase in mass flow rate using round edges is a result of less turbulence in the downstream flow. From the previous results, in the standard BFV, air distortion occurs in up to 50 degrees of the throttle opening positions which results in a lower mass flow rate. The edge of the BFV has a significant impact on the flow through than any other valve geometry. In general, the round edges of the BFVs at all angles result in an increase in flow rate compared to the sharp edges due to less flow turbulence which causes less pressure drop and less noise levels compared to sharp edges for the same type of BFV. Moreover, sharp edges on the BFV can cause damage to the valve body and disc due to its sharp contact area, which can lead to leakage and reduced valve performance over time while the rounded edges BFVs can reduce wear and tear on the valve and increase its overall lifespan. Therefore, using a flat BFV with a valve disk thickness of 1 mm would give the maximum mass flow rate compared to all other configurations. Table 7 shows the mass flow rate of air passing through different configurations of BFVs at all throttle opening positions.
It is evident that using the minimum thickness of BFV with round edges would give the maximum flow rate for any application using this type of BFV. However, a valve disk thickness of 1 mm would raise questions of whether this thickness could withstand the heat and torsion during operation.

4.2. Pinch Valve Analysis

Figure 17 shows the velocity streamlines of the pinch valve at four opening positions with a pressure difference of 0.1 bar between the two ends of the valve.
The vortex that can be seen in a 25% opening position is due to a low-pressure region at the exit side of the pinch valve which causes the outside air to enter the pinch valve at that location. This vortex can be eliminated by changing the pinch valve diameter (D) or its total length (L). The CFD analysis was performed with gradual increase in pinching degree. The results for area, semi-major axis, and shape of the deformed pipe were obtained between a minimum and maximum pinching degree (PD) of 0.0366 and 0.7416, respectively. The new model and ellipse model were applied to the pinch valve sleeve, pinching at a 1 mm increment from both sides. Calculations of area, semi-major axis, and shape of the deformed pipe were obtained and compared with the numerical results. It is clear from Figure 18 that the new stadium model has a high agreement with the CFD results.
The difference in area between numerical results and the new stadium model results ranged between 0.35% and 1.9%. Furthermore, it was found that the maximum difference in the semi-major axis between the numerical and new stadium model results was about 4% while the difference between the ellipse model and numerical results reached almost 9%.

4.3. Pinch Valve Flow Characteristics

It is worthwhile to investigate the flow characteristics in the pinch valve while varying the valve diameter-to-length ratio. Figure 19 shows flow coefficient values (Cv) against the valve diameter-to-length ratio (D/L) for three valve opening positions: 25, 50, and 75%. In general, the flow coefficient increases as the opening position increases. Furthermore, the flow coefficient increases as the D/L increases up to a certain point, then it depends on the opening position of the valve after which the flow coefficient decreases as the D/L increases. As the D/L increases, the length of divergence becomes shorter which results in a sudden expansion of area, hence lower flow velocity and a higher pressure drop. On the other hand, as the D/L decreases, this results in a longer pipe and higher friction and as a result, lower flow coefficient.

4.4. Comparison between BFVs and Pinch Valves

Although standard BFVs are still widely used in many applications, it has been shown numerically that it causes a reduction in mass flow rate by 7% at full throttle due to the valve mechanism which obstructs the flow path. The velocity contours of both valves can be seen in Figure 20. It is clear that a pinch valve would cause less disturbance in downstream air than a BFV since no obstruction is in the air path. As a result, it would require less energy for pumping fluids in pipes, and hence better performance for the equipment and less energy consumption. Moreover, the pinch valve has a better shutoff capability than the BFV as the sleeve can completely close off the flow path. In contrast, butterfly valves typically have some residual leakage even when fully closed.
At the 25% opening positions, the flow area available for the air to pass through in both valves is restricted. This causes an acceleration in the airflow to maintain the mass flow rate. Consequently, the air velocity increases near the valve’s narrow region to maximum values. In the case of the BFV, as the air flows downstream away from the valve, the sudden expansion of the area causes a high reduction in velocity, especially behind the valve disk which results in a pressure drop. In the case of the pinch valve at a 25% opening position, the sharp edge between the convergence and divergence causes the air velocity to reach its maximum near the wall while a smooth velocity gradient occurs away from the valve wall. At the 50% opening position, the flow area is larger compared to the 25% position and as a result, the air velocity near the valve’s leading edge is lower compared to the previous opening position. The velocity gradient as the air passes the valve disk is due to air distortion due to turbulence. This distortion not only causes a high reduction in the incoming mass flow rate of air, but it is also expected to create noise in the air flow. At these partial openings of the throttle, the valve’s ability to regulate flow is expected to be reduced due to nonlinear flow behavior. However, at the 50% opening position, the pinch valve shows a uniform velocity gradient throughout the restriction with a smaller high velocity zone than BFV. This is also true at the 75% opening position. Finally, at the 100% opening position, the high velocity contours in both valves are relatively uniform across the entire flow passage. However, in BFV, the presence of the throttle valve and its shaft cause a low velocity region behind the valve which is expected to cause a pressure drop of the incoming air resulting in a low flow rate. On the other hand, the velocity in the pinch valve is more uniform throughout the pipe while the effect of the no-slip condition can be seen near the wall. Moreover, the velocity distribution in the pinch valve can be seen clearly with the thickness of each layer of air. These results of velocity contours at the four opening positions of the BFV are in accordance with the numerical results obtained by Kumar et al. [25] for circular throttle valve shafts.
Based on previous results, pinch valves can be a better choice in replacing BFVs due to their low-pressure loss with uniform velocity distribution which results in a higher mass flow rate. Figure 21 shows the mass flow rate for two types of BFVs and the pinch valve over the full range of normalized opening area.
The pinch valve shows a linear relation of almost 50% of its opening position which would give a better throttling response. This linear relation would offer accurate flow control by means of adjusting the valve pinching degree to achieve and maintain the desired flow rate. At the 25% opening position, the pinch valve allows a 700% greater flow rate than the BFV for the same opening position and a 49% greater flow rate than the BFV at the 75% opening position. This mean that the pipe diameter of a pinch valve can be reduced and still deliver the same flow rate as a BFV with a bigger pipe diameter. The high flow rate that a pinch valve offers is due to the low-pressure drop compared to BFV which can be seen in Figure 22.

5. Conclusions

The present study investigated the flow characteristics of BFVs and pinch valves using CFD analysis at all opening positions. The flow characteristics of BFVs was investigated with different valve shaft diameters, valve thicknesses, and sharp and round edges at different throttle positions. The standard BFV results showed a significant air distortion downstream from 25% up to 75% of the throttle position which caused a high reduction in the incoming mass flow rate of air and was expected to create noise. The results also showed that the edge of the BFV disk and its shaft diameter have a considerable effect on the flow rate. It was shown that use of the flat valve disk with a thickness of 1 mm and round edges resulted in a 7.5% increase in mass flow rate compared to the standard BFV. On the other hand, the pinch valve showed a great result in terms of low-pressure drop across the valve and higher flow rate with an almost linear relation up to 50% of its opening position. At a 25% opening position of both valves, the pinch valve attains a 700% greater mass flow rate than that of the BFV and a 49% greater flow rate than the BFV at a 75% opening position. In addition, the effect of the diameter to length ratio in the pinch valve was investigated. The flow coefficient increased as the D/L increased up to a certain point and then started to decrease. Furthermore, a new simple mathematical model was proposed to determine the opening area of the pinch valve at all pinching degrees. The new mathematical model resulted in high agreement with CFD results (2% difference) and in acceptable agreement with the ellipse model. The uniform velocity of flow in the pinch valve and its low-pressure drop makes it a potential choice to be used in controlling the incoming fluid flow in various applications. Moreover, the linear relation in the pinch valve means a better throttle response and accurate flow control.

Author Contributions

Conceptualization, formal analysis K.A. and A.A.; software, validation M.A. and J.A.; methodology, review and editing: H.H.A. All authors have read and agreed to the published version of the manuscript.

Funding

This research received no external funding.

Institutional Review Board Statement

Not applicable.

Informed Consent Statement

Not applicable.

Data Availability Statement

The study did not report any data.

Conflicts of Interest

The authors declare no conflict of interest.

References

  1. Song, X.G.; Wang, L.; Baek, S.H.; Park, Y.C. Multidisciplinary Optimization of a Butterfly Valve. ISA Trans. 2009, 48, 370–377. [Google Scholar] [CrossRef] [PubMed]
  2. Yang, B.S.; Hwang, W.W.; Ko, M.H.; Lee, S.J. Cavitation Detection of Butterfly Valve Using Support Vector Machines. J. Sound Vib. 2005, 287, 25–43. [Google Scholar] [CrossRef]
  3. Kimura, T.; Tanaka, T.; Fujimoto, K.; Ogawa, K. Hydrodynamic Characteristics of a Butterfly Valve-Prediction of Pressure Loss Characteristics. ISA Trans. 1995, 34, 319–326. [Google Scholar] [CrossRef]
  4. Kim, S.; Kim, J.; Choi, J.; Sung, J. Topological Flow Characteristics in a Butterfly Valve Used for a Spark Ignition Engine. J. Vis.-Jpn. 2006, 9, 291–299. [Google Scholar] [CrossRef]
  5. Corbera, S.; Olazagoitia, J.L.; Lozano, J.A. Multi-Objective Global Optimization of a Butterfly Valve Using Genetic Algorithms. ISA Trans. 2016, 63, 401–412. [Google Scholar] [CrossRef]
  6. Corbera, S.; Olazagoitia, J.L.; Lozano, J.A.; A’lvarez, R. Optimization of a Butterfly Valve Disc Using 3D Topology and Genetic Algorithms. Struct. Multidiscip. Optim. 2017, 56, 1–17. [Google Scholar] [CrossRef]
  7. Cui, B.L.; Shang, Z.H.; Shi, K.; Chen, D.S.; Lin, Z. Butterfly Disc Structure Improved Design and Numerical Analysis Based on CFD. J. Mech. Eng. 2013, 31, 524–527. [Google Scholar]
  8. Sun, X.; Kim, H.S.; Yang, S.D.; Kim, C.K.; Yoon, J.Y. Numerical Investigation of the Effect of Surface Roughness on the Flow Coefficient of an Eccentric Butterfly Valve. J. Mech. Sci. Technol. 2017, 31, 2839–2848. [Google Scholar] [CrossRef]
  9. Liu, F.S.; Wang, H.; Zhang, Q.Z. Experimental Research on the Flow Resistance Characteristics of the Tri-eccentric Butterfly. Fluid Mach. 2020, 48, 12–16. [Google Scholar]
  10. Banis, K. Numerical evaluation of idle parameters of novel throttle body for internal combustion engines. Eng. Rural. Dev. 2020, 19, 1926–1933. [Google Scholar]
  11. Danbon, F.; Solliec, C. Aerodynamic Torque of a Butterfly Valve-influence of an Elbow on the Time-mean and Instantaneous Aerodynamic Torque. J. Fluids Eng. 2000, 122, 337–344. [Google Scholar] [CrossRef]
  12. Kim, C.K.; Yoon, J.Y. Experimental Study for Flow Characteristics of Eccentric Butterfly Valves. Proc. Inst. Mech. Eng. Part E J. Process Mech. Eng. 2014, 229, 309–314. [Google Scholar] [CrossRef]
  13. Nguyen, Q.K.; Jung, K.H.; Lee, G.N.; Suh, S.B.; To, P. Experimental Study on Pressure Distribution and Flow Coefficient of Globe Valve. Processes 2020, 8, 875. [Google Scholar] [CrossRef]
  14. Park, J.S.; Nguyen, Q.K.; Lee, G.N.; Jung, K.H.; Park, H.; Suh, S.B. Evaluation of Water Hammer for Seawater Treatment System in Offshore Floating Production Unit. Processes 2020, 8, 1041. [Google Scholar] [CrossRef]
  15. Kapre, A.V.; Dodia, Y. Flow Analysis of Butterfly Valve Using CFD. Int. J. Res. Eng. Technol. 2015, 4, 95–99. [Google Scholar]
  16. Balaji, M.; Satheesh, K.A.; Sanjay, G.; Job, H.K. Design of Throttle Body: A Comparative Study of Different Shaft Profiles Using CFD Analysis. Int. J. Chem. Sci. 2016, 14, 681–686. [Google Scholar]
  17. Xu, C.; Haengmuk, C. The Analysis of Influence of Throttle Body on Engine Intake System. Int. J. Eng. Technol. 2017, 9, 3481–3486. [Google Scholar] [CrossRef] [Green Version]
  18. Chang, C.; Yang, B.M.; Xu, H.C. The Optimization Analysis of the Throttle Valve Shaft Shape in the Intake System of Engine. Int. J. Mech. Prod. Eng. 2017, 5, 46–49. [Google Scholar]
  19. Leutwyler, Z.; Dalton, C. A Computational Study of Torque and Forces Due to Compressible Flow on a Butterfly Valve Disk in Mid-Stroke Position. J. Fluids Eng. 2006, 128, 1074–1082. [Google Scholar] [CrossRef]
  20. Leutwyler, Z.; Dalton, C. A CFD Study of the Flow Field, Resultant Force, and Aerodynamic Torque on a Symmetric Disk Butterfly Valve in a Compressible Fluid. J. Press. Vessel Technol. 2008, 130, 021302. [Google Scholar] [CrossRef]
  21. Said, M.M.; AbdelMeguid, H.; Hassan Rabie Sakr, L. A Comparison Study between 3-D CFD and Experimental Data of Butterfly Valve Coefficients. MEJ Mansoura Eng. J. 2020, 39, 10–22. [Google Scholar] [CrossRef]
  22. Dickenson, T.C. Valves, Piping, and Pipelines Handbook, 3rd ed.; Elsevier Advanced Technology: Oxford, UK, 1999; pp. 110–111. [Google Scholar]
  23. Chaudhari, A.M. Simulating Fluid Flow in a Compressed Valve. Master’s Thesis, Lappeenranta University of Technology, Lappeenranta, Finland, 24 August 2010. [Google Scholar]
  24. Hirtum, A.V. Deformation of a Circular Elastic Tube between Two Parallel Bars: Quasi-Analytical Geometrical Ring Models. Math. Probl. Eng. 2015, 2015, 547492. [Google Scholar] [CrossRef] [Green Version]
  25. Kumar, J.S.; Ganesan, V.; Mallikarjuna, J.M.; Govindarajan, S. Design and Optimization of A throttle Body Assembly by CFD Analysis. Indian J. Eng. Mater. Sci. 2013, 20, 350–360. [Google Scholar]
  26. Available online: https://www.swagelok.com/en/toolbox/cv-calculator (accessed on 26 May 2023).
  27. Trott, M. The Mathematica GuideBook for Symbolics; Springer: New York, NY, USA, 2006; pp. 1030–1031. [Google Scholar]
  28. Talbot, J.; Tildesley, D.J. The Planar Dumbbell Fluid. J. Chem. Phys. 1985, 83, 6419–6424. [Google Scholar] [CrossRef]
  29. Koyunbaba, E. Computational Fluid Dynamics Application for Determining Flow Characteristics of Valves. Master’s Thesis, Dokuz Eylul University, Konak, Turkey, 2008. [Google Scholar]
Figure 1. Cell size in mm at different refinement levels.
Processes 11 01897 g001
Figure 2. CFD validation versus experimental data published in [25].
Processes 11 01897 g002
Figure 3. Undeformed sleeve.
Processes 11 01897 g003
Figure 4. Meshed valve sleeve and pinching plates.
Processes 11 01897 g004
Figure 5. Comparison between CFD results and available online manufacturer’s Cv [26].
Processes 11 01897 g005
Figure 6. Illustration of a stadium shape.
Processes 11 01897 g006
Figure 7. Illustration of undeformed and deformed pinch valve sleeve following a stadium shape.
Processes 11 01897 g007
Figure 8. The air velocity streamlines across the throttle valve at 4 opening positions: (a) 25%; (b) 50%; (c) 75%; (d) 100%.
Processes 11 01897 g008
Figure 9. Air turbulence downstream of BFV at 75% opening position.
Processes 11 01897 g009
Figure 10. Air turbulence at the edge of the BFV at 100% opening position.
Processes 11 01897 g010
Figure 11. Vena contracta at 50% opening position of BFV.
Processes 11 01897 g011
Figure 12. Vena contracta at 75% opening position of BFV.
Processes 11 01897 g012
Figure 13. Pressure contour at 100% opening position.
Processes 11 01897 g013
Figure 14. Effect of valve shaft diameter on mass flow rate for standard BFV.
Processes 11 01897 g014
Figure 15. Mass flow rate for different thickness of BFV disk at all throttle positions.
Processes 11 01897 g015
Figure 16. Mass flow rate for standard BFV-sharp edges, standard BFV-round edges, and flat BFV-round edges at all throttle opening positions.
Processes 11 01897 g016
Figure 17. All pinch valve opening positions: (a) 25%; (b) 50%; (c) 75%; (d) 100%.
Processes 11 01897 g017
Figure 18. Valve area versus pinching degree.
Processes 11 01897 g018
Figure 19. Flow characteristics of pinch valves at different D/L ratios and different opening positions.
Processes 11 01897 g019
Figure 20. Velocity contours at all opening positions for both valves.
Processes 11 01897 g020
Figure 21. Mass flow rate of two types of BFVs and pinch valves.
Processes 11 01897 g021
Figure 22. Pressure drop of two types of BFVs and a pinch valve.
Processes 11 01897 g022
Table 1. Mesh independence test for standard BFV at 60 degrees.
Mesh Level34567
Mass flow rate (kg/s)0.57210.56800.56480.56410.5639
Error in mass flow rate (%)1.45%0.73%0.16%0.04%0.00%
No. of cells2800602716,69846,193126,354
Table 2. Material properties of natural rubber.
Elastic Modulus10 kPa
Poisson’s ratio0.45
Mass density960 kg/m3
Tensile strength20 MPa
Table 3. Mesh independence test for pinch valve at 20 mm pinching degree.
Mesh Level34567
Mass flow rate (kg/s)1.09361.10621.12091.12041.1200
Error in mass flow rate (%)2.35%1.23%0.08%0.035%0%
No. of cells3148729315,80734,74996,294
Table 4. Opening area of butterfly valve at all opening positions.
Valve Opening Angle (deg)102030405060708090
Opening area for standard BFV (mm2)69.7371.7903.61642.82574.83665.04881.76176.36855.7
Table 5. Calculated flow characteristics of air through standard BFV.
Ɵ (deg)Vavg (m/s)Re∆P (kPa)Mass Flow Rate (kg/s)
104.125,55110.980.01
2011.672,77910.920.05
3020.4127,60210.730.12
4032.8205,33210.290.23
5049.3306,4479.390.38
6070.7436,1617.720.56
7094.0574,2745.430.78
80116.4701,8263.070.98
90125.8753,4452.011.06
Table 6. Mass flow rate of air for different valve disk thickness using 10 mm valve shaft diameter.
Throttle Angle (deg)102030405060708090
1 mm32.35%8.60%2.28%−0.76%1.26%1.25%2.22%1.09%−1.52%
2 mm18.88%6.59%2.52%0.21%1.29%0.90%1.36%0.28%−0.58%
3 mm (reference)0.00%0.00%0.00%0.00%0.00%0.00%0.00%0.00%0.00%
4 mm−21.76%−7.49%−4.15%−2.82%−1.45%−1.64%−1.24%−0.74%0.30%
5 mm−42.41%−15.55%−9.59%−6.41%−3.82%−3.69%−2.90%−1.30%0.44%
Table 7. Increase/decrease in mass flow rate passing through different BFV configurations with respect to standard BFV-sharp edges.
Throttle Opening Angle (deg)102030405060708090
Flat BFV-round edges (3 mm thickness)118.8%52.6%29.1%15.4%10.4%7.9%6.2%5.7%6.2%
Flat BFV-sharp edges (1 mm thickness)32.3%8.5%2.4%−0.8%1.0%1.3%2.7%4.6%6.6%
Flat BFV-round edges (1 mm thickness)78.9%25.2%9.4%3.6%3.8%3.5%4.4%5.8%7.5%
Disclaimer/Publisher’s Note: The statements, opinions and data contained in all publications are solely those of the individual author(s) and contributor(s) and not of MDPI and/or the editor(s). MDPI and/or the editor(s) disclaim responsibility for any injury to people or property resulting from any ideas, methods, instructions or products referred to in the content.

