Abstract
Twelve crude oil blends prepared from seven individual crude oils and an imported atmospheric residue were characterized through a true boiling point (TBP) distillation analysis and their density. When comparing the measured TBP fraction yields with those estimated through the application of the additive blending rule, it was found that, for four crude oil blends, the additive blending rule was valid, while for the remaining eight crude oil blends, deviations of the measured TBP yields from the estimated ones were bigger than the TBP analysis’s repeatability limits. By the use of intercriteria analysis evaluation of the data for the deviation of the TBP yields from the additive blending rule and the molar excess volume of the crude oil blends, statistically meaningful relations between the delta TBP yields of light and heavy naphtha, as well as vacuum residue with the molar excess volume, were found. The higher the magnitude of the crude oil blend’s molar excess volume, the bigger the deviations of the TBP yields of naphtha and vacuum residue are. The bigger the deviation of the crude oil blend’s behavior from that of the regular solution, as quantified by the molar excess volume, the bigger the deviations of the TBP yields of naphtha and vacuum residue are.
1. Introduction
It is typical for petroleum refineries to process blends of crude oils instead of an individual crude oil [1]. This practice aims at enhancing refinery margins by including in the crude diet cheaper so-called “opportunity” crudes, as crude-oil costs can account for around 80% of a refinery’s turnover [2,3]. Refineries usually blend premium crudes with low-quality crudes to gain from the higher profit margins of low-quality crudes. The crude oils coming from different fields have diverse quality properties described by the true boiling point (TBP) curves, and, generally, these crude oils, which have higher content of distillate fractions (naphtha, kerosene, diesel, and vacuum gas oil), are more valuable and have higher prices [4]. The crude selection process usually involves the use of a linear programming tool that models the performance of the refinery searching for the economical optimum [5,6,7,8]. The complexity of refinery operations makes it difficult to formulate the suitable planning optimization models [9]. One of the challenges in the linear programming models is how to properly represent the operation of crude distillation units (CDUs) [8,10]. They are among the most important process units in the refinery because they separate the crude oil in fractions (naphtha, kerosene, diesel oil, atmospheric residue, vacuum gas oils, etc.), which are processed in the downstream units (upgrading and conversion units). An inaccurate CDU operation representation will give inaccurate yields of the intermediate streams, and the entire downstream processing modelling will be erroneous. Thus, the overall economic performance evaluation of the refinery is directly influenced by the proper simulation of CDU operation [8,10]. Different models of CDU operation simulation have been reported in the literature [7,11,12,13]. However, our search of the literature has shown that the CDU operation simulation has not considered the deviation of distillation yields from crude oil blends from the additive blending rule, as reported in the research of Li et al. [14,15], when crude oil blends are processed. Unfortunately, the reports of Li et al. [14,15] employed equilibrium/flash vaporization equipment, and no data about the accuracy of this equipment have been announced. Moreover, Wang [16] mentioned that the error of Chinese domestic distillation experimental results is large, and the reliability of the results is questionable. All of this was a reason for us to perform TBP distillation of different individual crude oils and their blends in a standardized equipment operating under requirements of the standards ASTM D 2892 [17] and ASTM D 5236 [18]. Before the performance of the TBP distillation experiments with the individual crude oils and their blends, several runs with four crude oils were carried out to demonstrate the repeatability of the equipment used.
The aim of this research was to test the validity of the additive blending rule for twelve different crude oil blends from seven individual crude oils and an imported atmospheric residue and search for a possible explanation in cases of observed deviations from the additive blending rule.
2. Materials and Methods
2.1. Samples and Settings
Seven crude oils, namely Iranian-1 (IHCO-1), Iranian-2 (IHCO-2), Sirtica, Urals, Arab Medium, Siberian Light, Basrah Heavy, and imported atmospheric residue, were investigated in this research. Their densities and the TBP yields of the fractions light naphtha (IBP-100 °C), where IBP is the initial boiling point of crude oil; heavy naphtha (100–180 °C); kerosene (180–240 °C); diesel (240–360 °C); vacuum gas oil (360–540 °C; VGO); and vacuum residue (>540 °C; VR) are presented in Table 1.

Table 1.
Densities and TBP yields of the fractions of the studied crude oils and imported AR.
2.2. Density Analysis
The densities of the crude oils their blends were measured in accordance with the ASTM D4052 method, using an Anton Paar DMA 4100 digital analyzer (Anton Paar GmbH, Graz, Austria) consisting of a U-shaped, oscillating sample tube; electronic excitation system; and frequency counting. The density measurement has a repeatability of 0.00001 g/cm3 and reproducibility of 0.00005 g/cm3 according to the technical specification of the Anton Paar DMA 4100 digital analyzer.
2.3. TBP Analysis
The crude oils were analyzed for their true boiling point (TBP) distribution in Euro Dist System from ROFA Deutschland GmbH (Lohmar, Germany) designed to perform according to ASTM D 2892 [17] requirements at a pressure drop from 760 to 2 mmHg. Its fractionation column is equipped inside with packing (structured packing Pro-pack supplied by ROFA) equivalent to 15 theoretical plates, and the condenser provides the standard’s mandatory reflux ratio of 5:1. The atmospheric residue from the TBP column was fractionated under vacuum, from 1 to 0.2 mmHg, in a Potstill Euro Dist System from ROFA Deutschland GmbH, according to ASTM D 5236 [18] requirements.
2.4. Statistical Analysis of TBP Test Results
According to the standard ASTM D 2892, the repeatability of the TBP yields for the fractions obtained at atmospheric pressure is 0.6 wt.%, while those obtained under vacuum pressure have repeatability of 0.9 wt.%. The apparatus Euro Dist System from ROFA Deutschland GmbH operates at atmospheric pressure for the fractions boiling up to 220 °C, and the higher boiling point fractions are separated under vacuum pressure. In order to verify the repeatability of the TBP analysis of the apparatus Euro Dist System employed in this research, several consecutive tests were performed with extra-light (Table 2), light (Table 3), and medium (Table 4) crude oils. The data in these tables confirm the good repeatability achieved by the apparatus Euro Dist System.
Table 2.
Standard deviation (σ) and repeatability (2σ) of TBP yields of extra-light crude oil, CPC (SG stands for specific gravity = 0.795), determined in the apparatus Euro Dist System.
Table 3.
Standard deviation (σ) and repeatability (2σ) of TBP yields of light crude oil, Sib. Light (SG = 0.850), determined in the apparatus Euro Dist System.
Table 4.
Standard deviation (σ) and repeatability (2σ) of TBP yields of medium crude oil, Kirkuk (SG = 0.877), determined in the apparatus Euro Dist System.
The assessment of repeatability of the TBP tests in this work was based on determination of the standard deviation that is estimated using Equation (1).
where xi is the number of TBP tests; xmean = arithmetic mean of TBP yield, wt.%; and n = number of performed consecutive TBP tests.
As an indicator of the repeatability, we used the standard deviation (2σ) twice, as explained in [19].
3. Results
Table 5, Table 6, Table 7, Table 8 and Table 9 present the results of the TBP measured and estimated yields of the crude oil blends from applying the additive blending rule shown in Equation (2).
where BlendTBPyield is the yield of the TBP fraction of the crude oil blend, wt.%; wt.frac.Crude1 is the weight fraction of crude oil 1 in the crude oil blend; Crude1TBPyield is the yield of the TBP fraction in the crude oil 1, wt.%; wt.frac.Crude2 is the weight fraction of crude oil 2 in the crude oil blend; and Crude2TBPyield is the yield of the TBP fraction in the crude oil 2, wt.%.
Table 5.
Measured and estimated yields and densities of the Sirtica–Iranian-1 crude oil blends and the difference between them.
Table 6.
Measured and estimated yields and densities of the Urals–Arab-Medium crude oil blends and the difference between them.
Table 7.
Measured and estimated yields and densities of the Urals–Iranian-2 crude oil blends and the difference between them.
Table 8.
Measured and estimated yields and densities of the 80%Urals/20%Iranian-2/AR blends and the difference between them.
Table 9.
Measured and estimated yields and densities of the 80%Urals/20%Iranian-2)/AR blends and the difference between them.
Table 5, Table 6, Table 7, Table 8 and Table 9 also present the results of the measured and estimated density of the crude oil blends, assuming regular solution behavior of the crude oil blend, that is, no excess volume of mixing. The estimated density was calculated using Equation (3).
where ρregular(estimated) is the estimated density of the crude oil blend, assuming regular solution behavior, g/cm3; ρCrude1 is the measured density of the first crude oil participating in the crude oil blend, g/cm3; and ρCrude2 is the measured density of the second crude oil participating in the crude oil blend, g/cm3.
The data in Table 5 show that the differences between measured and estimated TBP yields of the fractions of light naphtha (IBP-100 °C), heavy naphtha (100–180 °C), VGO (360–540 °C), and VR (>540 °C) are much bigger than the repeatability limits of the maximum 0.9 wt.% for the TBP analysis. The same is valid for the differences between measured and estimated crude-oil-blend densities, reporting differences much bigger than the repeatability limit of 0.00001 g/cm3.
The data in Figure 1 indicate the presence of clear relation of the difference between measured and estimated density, and the TBP yields of light naphtha, VGO, and VR to the content of Iranian-1 (IHCO-1) in the crude oil blends Sirtica–Iranian-1. This suggests that the existence of excess volume of mixing a result from the difference between the molecular interactions between the crude oils Sirtica and Iranian-1 may be the reason for the observed difference between measured and estimated TBP yields. The higher the density difference, the bigger the ∆TBP yields of naphtha, VGO, and VR are. It is interesting to note here that lower yields of naphtha are at the expense of higher yields of the heavy oils VGO and VR. It is also evident from the data in Figure 1 that the magnitude of the differences between densities and TBP yields decreases with the reduction of the share of Sirtica crude oil in the blend (increasing the share of Iranian-1).
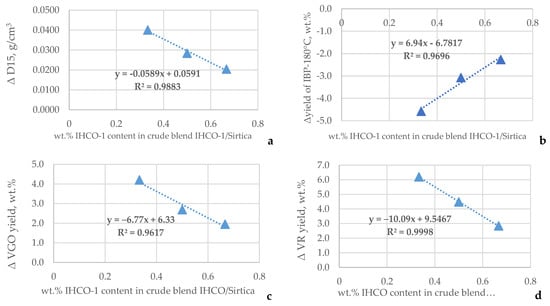
Figure 1.
Relation of difference between measured and estimated density (a) and TBP yields of naphtha (b), VGO (c), and VR (d) to the content of Iranian-1 (IHCO-1) in the Sirtica–Iranian-1 crude oil blends.
The data in Table 6 indicate that, for all the studied Urals–Arab-Medium crude oil blends, the differences between measured and estimated TBP yields of light naphtha (IBP-110 °C) are much bigger than the repeatability limit of the TBP analysis. If one compares the data for the TBP light naphtha yields of both individual Urals and Arab Medium crude oils shown in Table 1 (8.2 and 9.1 wt.%, respectively) with the measured yields of the blends of these crudes shown in Table 6 (5.5, 6.3, and 6.5 wt.%), one can understand that some kind of suppression to extract the light naphtha from the blends Urals and Arab Medium occurred.
The data in Figure 2 display that the difference in density correlates with the difference (∆) in the light naphtha yield (Figure 2a) and that the ∆ density increases with the enhancement of the share of Urals in the crude oil blend Urals–Arab Medium.
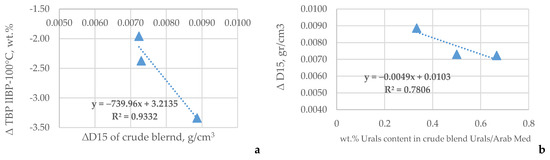
Figure 2.
Relation of ∆ density to ∆TBP yield of light naphtha (a) and dependence of ∆ density on the share of Urals in the crude oil blend Urals–Arab Medium (b).
The data in Table 7 indicate that only the blend 33%Urals/67%Iranian-2 demonstrates that the ∆TBP yields of light naphtha and diesel are bigger than the repeatability limits of the TBP analysis. All other ∆TBP yields are within or very close to the repeatability limits.
The data in Table 8 show that the ∆TBP yields of light and heavy naphtha and VGO are bigger than the repeatability limits of the TBP analysis of the blend 50%(80%Urals/20%Iranian-2)/50%AR. For the blend 75%(80%Urals/20%Iranian-2)/25%AR, only the ∆TBP yield of VGO is bigger than the repeatability limit of the TBP analysis.
The data in Table 9 indicate that all ∆TBP yields are within the repeatability limits of the TBP analysis.
4. Discussion
For all twelve of the investigated crude oil blends from the seven individual crude oils, the blend densities deviate from the value of the density of the regular solution. This implies that the excess molar volume of the studied crude oils is not zero. In order to calculate the values of the excess molar volume (VE) for the 12 crude oil blends, Equation (4) was employed, as reported in [20].
where M1 and M2 are the molar masses of the crude oils participating in the blend, ρ1 and ρ2 are the densities of the individual crude oils, and ρ denotes the density of the mixture.
Besides the excess molar volume, the relative changes in volume, ∆V, were also calculated by the use of Equation (5), as reported in [21].
where xi, mi, and are the mole fraction, molar mass, and molar volume of the individual component i, respectively; and ρm is the density of the mixture. The molecular weights of the studied crude oils and their blends were estimated by the new empirical correlation reported in our recent research [22].
Table 10 and Table 11 summarize the values of the excess molar volume and ∆V of the 12 investigated crude oil blends, as estimated using Equations (3) and (4).
Table 10.
Values of molar excess volume, VE, of the 12 studied crude oil blends estimated using Equation (4).
Table 11.
Values of relative changes in volume, ∆V, of the 12 studied crude oil blends estimated using Equation (5).
One can see from the data in Table 10 and Table 11 that there are negative and positive values for the molar excess volume and the relative changes in volume, ∆V. The positive excess molar volume indicates volume expansion upon mixing and, thus, a repulsive interaction of mixing crude oils or weaker interactions than the interactions of the individual crude oils. The negative excess volume shows stronger interactions of mixed molecules than individual molecules before mixing.
In order to assess the relations between the ∆TBP yields and the molar excess volume and the relative changes in volume, ∆V, an intercriteria analysis (ICrA) evaluation was performed. As input data, the ICrA method requires an m × n table with the measurements or evaluations of m objects against n criteria. As a result, it returns an n × n table with intuitionistic fuzzy pairs, defining the degrees of relation between each pair of criteria—hence the name “intercriteria”—and allows us to make informed decisions that take into account the inherent uncertainty that complex real-life problems exhibit. For the sake of terminological precision, in ICrA, the use of the term “correlation” when discussing the relationship between the criteria is avoided; the terms “positive consonance”, “negative consonance”, and “dissonance” are used instead. For laboratory experiments where the conditions are controlled to a higher extent than those in the industrial experiments, the meaning of μ = 0.75 ÷ 1.00; υ = 0÷0.25 denotes a statistically meaningful significant positive relation, where the strong positive consonance exhibits values of μ = 0.95 ÷ 1.00; υ = 0 ÷ 0.05, and the weak positive consonance exhibits values of μ = 0.75 ÷ 0.85; υ = 0.15 ÷ 0.25. Respectively, the values of negative consonance with μ = 0 ÷ 0.25; υ = 0.75 ÷ 1.00 mean a statistically meaningful negative relation, where the strong negative consonance exhibits values of μ = 0 ÷ 0.05; υ = 0.95 ÷ 1.00, and the weak negative consonance exhibits values of μ = 0.15 ÷ 0.25; υ = 0.75 ÷ 0.85. All other cases are considered to be dissonance. For a more detailed explanation of the essence of ICrA, the reader can refer to our previous study [23].
Table 12 and Table 13 summarize the values of μ and υ obtained from the ICrA evaluation for the 12 studied crude oil blends.
Table 12.
The μ-values of the intercriteria analysis evaluation of relations between ∆TBP yields and molar excess volume VE and the relative changes in volume, ∆V, of the 12 studied crude oil blends.
Table 13.
The υ-values of the intercriteria analysis evaluation of relations between ∆TBP yields and molar excess volume, VE, and the relative changes in volume, ∆V, of the 12 studied crude oil blends.
It is evident from the data in Table 12 and Table 13 that statistically meaningful negative relations exist between the ∆TBP yields light naphtha, kerosene, and VGO and between the ∆TBP yields of heavy naphtha and vacuum residue. This means that when the ∆TBP yields of light naphtha and kerosene go up, the ∆TBP yield of VGO decreases. When the ∆TBP yield of heavy naphtha increases, that of the vacuum residue diminishes. From these data, one may conclude that a deviation from the additive blending rule will be mainly a result from changes in the yields of the light crude oil fractions light and heavy naphtha and kerosene; and in the heavy oil fractions VGO, and VR.
It is also evident from the data in Table 12 and Table 13 that the molar excess volume and the relative changes in volume, ∆V, have a positive statistically meaningful consonance with the ∆TBP yields of light and heavy naphtha and a negative statistically meaningful consonance with the ∆TBP VR yield. This implies that an increase in the values of the VE and ∆V will be associated with an increase in the values of ∆TBP yields of light and heavy naphtha, whereas an enhancement of the values of the VE and ∆V will be accompanied by a reduction in the ∆TBP yield of the VR.
Figure 3 presents an illustration of the relation of the molar excess volume (Figure 3a) and the relative changes in volume, ∆V (Figure 3b), to the ∆TBP yields of heavy naphtha (100–180 °C) and vacuum residue (>540 °C).
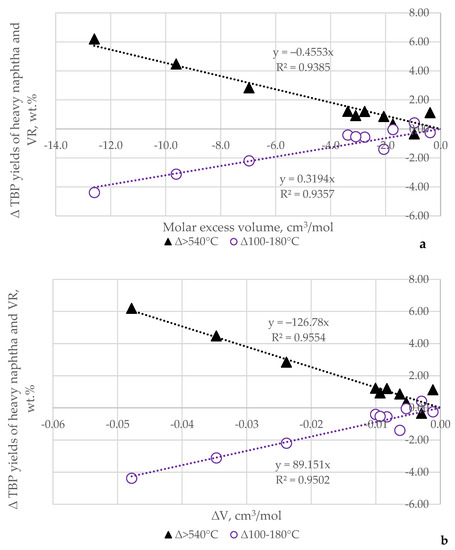
Figure 3.
Relation of the molar excess volume (a) and the relative changes in volume, ∆V, (b) to the ∆TBP yields of heavy naphtha (100–180 °C) and vacuum residue (>540 °C).
It is evident from the data in Figure 3a,b that at zero molar excess volume and with the relative changes in volume, ∆V, the ∆TBP yields of heavy naphtha and VR are also zero; that is, the yields of these crude oil fractions coincide with those estimated by the additive blending rule. Therefore, the lack of different intermolecular interactions between the individual crude oils to blend is a prerequisite for fulfillment of the additive blending rule. The presence of different intermolecular interactions between the individual crude oils to blend suggests the appearance of deviation from the additive blending rule. The data in Figure 3 suggest that a reduction in the yield of heavy naphtha relative to that estimated by the additive blending rule is associated with an enhancement of the ∆TBP VR yield. Obviously, a redistribution between crude oil components occurs, resulting in a reduction in heavy naphtha recovery at the expense of a higher VR recovery rate. It is clear that this case is not favorable from an economic point of view because a lower production of high-value heavy naphtha and higher production of the lower-value vacuum residue will be registered when the molar excess volume of the blended crude oils is negative. The higher the magnitude of the negative value of the excess molar volume, the lower the yield of the high-value heavy naphtha and the higher the yield of the low-value vacuum residue are.
Out of the twelve studied crude oil blends, eight exhibited a deviation from the additive blending rule that was bigger than the repeatability limits of the TBP analysis, and four displayed deviations within the repeatability limits, thus confirming the validity of the additive blending rule for these four crude oil blends. A good correlation between the ∆TBP yields and the ∆ density for the cases where the ∆TBP yields were bigger than the TBP repeatability limits was observed (Figure 1 and Figure 2). This suggests that the deviation from the regular solution behavior may be the reason for the deviation from the additive blending rule. The observed relations of the ∆TBP yields of heavy naphtha and VR to the molar excess volume, VE, and the relative changes in the molar volume, ∆V (Figure 3), could be considered as evidence for the relation of the deviation from the regular solution behavior to the deviation from the additive blending rule. Thus, calculating VE and ∆V by using Equations (3) and (4) may be deemed an indicator for expected observations of appearance or lack of deviations from the additive blending rule.
5. Conclusions
Seven individual crude oils were characterized via a TBP distillation analysis and their density. The repeatability limits reported for the standards ASTM D 2892 and D 5236 employed to be followed during the TBP analysis of extra light, light, and medium crude oils were confirmed. Twelve crude oil blends prepared from the seven individual crude oils were characterized by the TBP distillation analysis and their density. It was found that, for eight of the studied crude oil blends, the additive blending rule predicted that the TBP fraction yields were bigger than the TBP analysis repeatability limits. For four of the studied blends, the additive blending rule predicted TBP fraction yields within the TBP analysis repeatability limits. It was established that the assumption of regular solution behavior of the crude oil blends with zero molar excess volume of mixing was not confirmed. Through the use of intercriteria analysis evaluation of the data for the difference of the TBP yields from the additive blending rule and the molar excess volume, statistically meaningful relations between the yields of light and heavy naphtha and vacuum residue were found. The increase in the magnitude of the molar excess volume when it is negative leads to a high suppression of naphtha extraction at the expense of a higher rate of vacuum residue recovery. At zero molar excess volume, the TBP yields seem to coincide with those predicted by the application of the additive blending rule. The results generated in this research suggest that the presence of attractive intermolecular interactions between the molecules of the different crude oils which were blended, quantified by a negative value of the molar excess volume, may lead to a decreased rate of light oil fraction extraction and increased rate of heavy oil fraction extraction. The calculation of the molar excess volume may be used as an indicator for a possible deviation of the TBP yields from those predicted by the additive blending rule.
Author Contributions
Conceptualization, D.S. and I.S.; methodology, R.D.; software, S.R. and D.D.S.; validation, S.S. and E.S.; formal analysis, R.N.; investigation, A.V. and G.P.; resources, K.A.; data curation, I.S.; writing—original draft preparation, D.S. and I.S.; writing—review and editing, D.S. and I.S.; supervision, K.A.; project administration, S.S.; funding acquisition, S.S. All authors have read and agreed to the published version of the manuscript.
Funding
This research was funded by Asen Zlatarov University, Burgas, under the project Center of Excellence UNITE BG05M2OP001-1.001-0004/28 February 2018 (2018–2023).
Data Availability Statement
Not applicable.
Conflicts of Interest
The authors declare no conflict of interest.
Nomenclature
| AR | atmospheric residue; |
| Arab. M | Arabian medium crude oil; |
| Basrah H | Basrah heavy crude oil; |
| BlendTBPyield | yield of the TBP fraction of the crude oil blend, wt.%; |
| CDUs | crude oil distillation units; |
| Crude1TBPyield | yield of the TBP fraction in the crude oil 1, wt.%; |
| Crude2TBPyield | yield of the TBP fraction in the crude oil 2, wt.%; |
| Est. | estimated; |
| IBP | initial boiling point, °C; |
| IHCO | Iranian heavy crude oil; |
| ICrA | intercriteria analysis; |
| Mi | molar mass of the individual component i, g/mol; |
| Meas. | measured; |
| mi | mass fraction of the individual component i; |
| Sib. Light | Siberian light crude oil; |
| SG | specific gravity; |
| TBP | true boiling point, °C; |
| Ur. | Urals; |
| VGO | vacuum gas oil; |
| VE | excess volume, cm3; |
| Voi | molar volume of the individual component i, cm3/mol; |
| VR | vacuum residue; |
| ∆TBP yields | differences between measured and estimated TBP yields of the crude oil fraction, wt.%; |
| ∆V | relative changes in volume, cm3/mol; |
| wt.frac.Crude1 | weight fraction of crude oil 1 in the crude oil blend; |
| wt.frac.Crude2 | weight fraction of crude oil 2 in the crude oil blend; |
| wt.% i | percent by weight of individual component i in the crude oil blend; |
| xi | mol fraction of the individual component i, mol/mol; |
| ρi | density of the individual component i at 15 °C, g/m3; |
| μ | positive consonance; |
| υ | negative consonance. |
References
- Kumar, R.; Voolapalli, R.K.; Upadhyayula, S. Prediction of crude oil blends compatibility and blend optimization for increasing heavy oil processing. Fuel Process. Technol. 2018, 177, 309–327. [Google Scholar] [CrossRef]
- Ramirez-Corredores, M.M. The Science and Technology of Unconventional Oils, Finding Refining Opportunities, 1st ed.; Elsevier: Amsterdam, The Netherlands, 2017. [Google Scholar]
- Li, J.; Misener, R.; Floudas, C.A. Scheduling of crude oil operations under demand uncertainty: A robust optimization framework coupled with global optimization. AIChE J. 2012, 58, 2373–2396. [Google Scholar] [CrossRef]
- Li, F.; Qian, F.; Du, W.; Yang, M.; Long, J.; Mahalec, V. Refinery production planning optimization under crude oil quality uncertainty. Comput. Chem. Eng. 2021, 151, 107361. [Google Scholar] [CrossRef]
- An, Y.; Wu, N.Q.; Hon, C.T.; Li, Z.W. Scheduling of crude oil operations in refinery without sufficient charging tanks using petri nets. Appl. Sci. 2017, 7, 564. [Google Scholar] [CrossRef]
- Wu, N.Q.; Li, Z.W.; Qu, T. Energy efficiency optimization in scheduling crude oil operations of refinery based on linear programming. J. Clean. Prod. 2017, 166, 49–57. [Google Scholar] [CrossRef]
- Guerra, O.J.; Le Roux, G.A.C. Improvements in petroleum refinery planning: 1. Formulation of process models. Ind. Eng. Chem. Res. 2011, 50, 13403–13418. [Google Scholar] [CrossRef]
- Dai, X.; Wang, X.; He, R.; Du, W.; Zhong, W.; Zhao, L.; Qian, F. Data-driven robust optimization for crude oil blending under uncertainty. Comput. Chem. Eng. 2020, 136, 106595. [Google Scholar] [CrossRef]
- Khor, C.S.; Varvarezos, D. Petroleum refinery optimization. Optim. Eng. 2017, 18, 943–989. [Google Scholar] [CrossRef]
- Rana, Z.A.; Khor, C.S.; Zabiri, H. Computational experience with piecewise linear relaxations for petroleum refinery planning. Processes 2021, 9, 1624. [Google Scholar] [CrossRef]
- Ibrahim, D.; Jobson, M.; Guillén-Gosálbez, G. Optimization-based design of crude oil distillation units using rigorous simulation models. Ind. Eng. Chem. Res. 2017, 56, 6728–6740. [Google Scholar] [CrossRef]
- Franzoi, R.E.; Menezes, B.C.; Kelly, J.D.; Gut, J.A.W.; Grossmann, I.E. Cutpoint temperature surrogate modeling for distillation yields and properties. Ind. Eng. Chem. Res. 2020, 59, 18616–18628. [Google Scholar] [CrossRef]
- Li, F.; Qian, F.; Yang, M.; Du, W.; Mahalec, V. Product tri-section based crude distillation unit model for refinery production planning and refinery optimization. AIChE J. 2021, 67, e17115. [Google Scholar] [CrossRef]
- Li, S.; Liu, J.; Shen, B.; Xu, X.; Fan, Q.; Chen, J.; Zhao, G. Distillation yields from blending Cabinda crude oil and Oman crude oil. Pet. Sci. Technol. 2006, 24, 737–747. [Google Scholar] [CrossRef]
- Li, S.; Zhang, Q.; Yao, Y.; Sun, X.; Fan, Q.; Chen, J. Distillation yields and properties from blending crude oils: Maxila and Cabinda crude oils. Energy Fuels 2007, 21, 1145–1150. [Google Scholar] [CrossRef]
- Wang, P. Research Progress of Intensified Vacuum Distillation for Crude Oil. Adv. Eng. Res. 2019, 181, 158–160. [Google Scholar] [CrossRef]
- ASTM D2892–20; Standard Test Method for Distillation of Crude Petroleum (15-Theoretical Plate Column). ASTM International: West Conshohocken, PA, USA, 2020.
- ASTM D5236–18a; Standard Test Method for Distillation of Heavy Hydrocarbon Mixtures (Vacuum Potstill Method). ASTM International: West Conshohocken, PA, USA, 2018.
- Espinosa-Pena, M.; Figueroa-Gomez, Y.; Jimenez-Cruz, F. Simulated distillation yield curves in heavy crude oils: A comparison of precision between ASTM D-5307 and ASTM D-2892 physical distillation. Energy Fuels 2004, 18, 1832–1840. [Google Scholar] [CrossRef]
- Coquelet, C.; Auger, E.; Valtz, A. Density and excess volume for four systems involving eugenol and furan. J. Solut. Chem. 2019, 48, 455–488. [Google Scholar] [CrossRef]
- Qin, A.; Hoffman, D.E.; Munk, P. Excess volumes of mixtures of alkanes with carbonyl compounds. J. Chem. Eng. Data 1992, 37, 55–61. [Google Scholar] [CrossRef]
- Stratiev, D.; Sotirov, S.; Sotirova, E.; Nenov, S.; Dinkov, R.; Shishkova, I.; Kolev, I.V.; Yordanov, D.; Vasilev, S.; Atanassov, K.; et al. Prediction of molecular weight of petroleum fluids by empirical correlations and artificial neuron networks. Processes 2023, 11, 426. [Google Scholar] [CrossRef]
- Stratiev, D.; Shishkova, I.; Dinkov, R.; Kolev, I.; Argirov, G.; Ivanov, V.; Ribagin, S.; Atanassova, V.; Atanassov, K.; Stratiev, D.; et al. Intercriteria analysis to diagnose the reasons for increased fouling in a commercial ebullated bed vacuum residue hydrocracker. ACS Omega 2022, 7, 30462–30476. [Google Scholar] [CrossRef] [PubMed]
Disclaimer/Publisher’s Note: The statements, opinions and data contained in all publications are solely those of the individual author(s) and contributor(s) and not of MDPI and/or the editor(s). MDPI and/or the editor(s) disclaim responsibility for any injury to people or property resulting from any ideas, methods, instructions or products referred to in the content. |
© 2023 by the authors. Licensee MDPI, Basel, Switzerland. This article is an open access article distributed under the terms and conditions of the Creative Commons Attribution (CC BY) license (https://creativecommons.org/licenses/by/4.0/).