Article

Design and Optimization of the Insulation Performance of a 4000 m3 Liquid Hydrogen Spherical Tank

1
Institute of Refrigeration and Cryogenic Engineering, Xi’an Jiaotong University, Xi’an 710049, China
2
China Special Equipment Inspection and Research Institute, Beijing 100029, China
3
Shanghai Marine Diesel Engine Research Institute, No. 3111 Huaning Road, Shanghai 201108, China
*
Authors to whom correspondence should be addressed.
Processes 2023, 11(6), 1778; https://doi.org/10.3390/pr11061778
Submission received: 6 May 2023 / Revised: 1 June 2023 / Accepted: 7 June 2023 / Published: 11 June 2023
(This article belongs to the Section Energy Systems)

Abstract

:
Efficient insulation technology is one of the key technologies for the development of large LH2 storage tanks. This paper aimed at a 4000 m3 LH2 spherical tank, many insulation schemes were designed, including multilayer insulation systems integrated with a vapor-cooled shield (VCS) and liquid-nitrogen-cooled shield (LN2CS). The heat transfer model was developed to predict the insulation performance of a LH2 spherical tank. The effect of the VCS position on insulation performance was studied, and the different configurations of double VCSs were compared and discussed. The results showed that the daily evaporation rate of MLI, hollow glass microspheres (HGMs) and vacuum was only 2.05 × 10⁻³%, 3.62 × 10⁻³% and 7.94 × 10⁻²% at 1.34 Pa, respectively. MLI was still the optimal insulation scheme for a 4000 m3 LH2 spherical tank. Meanwhile, it was found that when the single VCS was placed at the 10th layer, the heat leakage was reduced by approximately 40.5% compared with MLI. The heat leakage of parallel VCS(P-VCS) was 76.6% lower than that of MLI. The minimum heat leakage of series VCS(S-VCS) was 83.79%, 72.75% and 37.36% lower than that of MLI, single VCS and P-VCS, respectively. Additionally, the heat leakage of the LH2 tank could be reduced to less than 10 W when LN2CS was installed. These results provide a design reference for the highly efficient storage of large LH2 tanks.

1. Introduction

Hydrogen (H2), is the most abundant element in the universe. It also has a high calorific value, is non-toxic and non-polluting, and will play an important role in the new energy pattern [1,2]. Safe, reliable and highly efficient hydrogen storage is the key to realizing H2 energy utilization. Liquid hydrogen (LH2) is an extremely ideal way to store H2 in terms of mass density, bulk density and the cost of H2 storage. LH2 is stored in spherical tanks that can effectively reduce the boil-off of LH2 due to their small specific surface area [3]. Therefore, the development of large LH2 spherical tanks is of great significance for the large-scale utilization of H2 energy.
The daily evaporation rates of PIIB-63 (66.3 m3), PIIT-250 (246 m3), PCB-1400 (1437 m3), IITB-25 (25 m3) and IITB-45 (45 m3) are 0.52%, 0.3%, 0.13%, 1.2% and 1.0%, respectively, manufactured by JSC “Cryogenmash” in Russia [4]. Two 3218 m3 LH2 spherical tanks were designed by NASA at the launch pad. Perlite was chosen to fill a vacuum jacket under the cold vacuum level of 10–15 millitorr. The daily evaporation loss of two LH2 spherical tanks was found to be 0.034% and 0.081% in the mid-1970s, and by 2008, this was up to 0.12% [5]. A 300 m3 LH2 tank was designed by Chen [6]. The insulation mode of this tank was composed of MLI and a vacuum jacket with 1 millitorr pressure, and the daily evaporation loss was 0.23%. A 100 m3 LH2 storage tank with high-vacuum multilayer insulation (HV-MLI) was investigated by Wang, and the daily evaporation rate was 0.48% [7].
To achieve the long-term storage of LH2, cryogenic insulation technology is increasingly attracting scholars’ attention [8]. Generally, cryogenic insulation is divided into passive insulation and active thermal protection. Passive insulation can be divided into four types: high-vacuum insulation, vacuum powder insulation, HV-MLI and high-vacuum multi-shield insulation. Among them, the function of the high vacuum reduces residual gas conduction between the external environment and the cryogenic liquids [9]. In terms of active refrigeration, a cryocooler is used to move the heat leakage form the cryogenic tanks. Nevertheless, the technical requirements of cryocooler performance in the LH2 temperature zone are very high, and the cooling capacity of the cryocooler is limited, making it difficult to promote their application in large LH2 storage tanks. Therefore, passive thermal insulation is still the optimal thermal insulation scheme in large LH2 storage tanks.
HV-MLI is the most common of the four passive insulations [10,11], which has been widely used for the storage of cryogenic liquids, such as LH2 and liquid oxygen (LO2) [12]. The MLI mode was first proposed by Swedish scholar, P. Peterson, in 1951 [13]. The MLI effectively exerts a function in the high vacuum. The vacuum jacket is installed between the warm and cold boundaries. The MLI consists of multilayer aluminized Mylars with high reflectivity, and spacer material with minimal thermal conductivity (placed between the two adjacent reflectors). The pressure of the vacuum jacket is evacuated to less than 10−2 Pa [14]. Currently, many investigations of HV-MLI have been conducted by scholars. Experimental studies of “zero boil-off” storage technology for LH2 spherical tanks were conducted at NASA’s Glenn Research Center. The MLI and two-stage G-M cryocooler were utilized to reduce heat leakage during the experiment [15]. Bapat et al. [16] performed the experimental and numerical study on different combinations of reflectors and spacers. The results showed that the combination of 12 μm-thick aluminized Mylars and 76.2 μm-thick glass fiber fabric spacers had the greatest insulation performance. The numerical model of solid conduction, radiation and gas conduction was also developed. The results demonstrated that the residual gas thermal conductivity increased with the increase in layer density of the MLI. A steady-state experimental study on the effect of interlayer residual gas pressure on the insulation performance of cryogenic vessels was conducted by Sun et al. [17]. Argon, air, nitrogen and carbon dioxide were used to flush the interlayer of the MLI in the experiments, which were conducted under a gas pressure of 10−3 to 10−5 Pa and a temperature of 77–300 K. The experimental results indicated that the thermal conductivity of the warm boundary is higher than that of the cold boundary with the increase in vacuum level. Li [18] established a cylindrical measurement platform for MLI materials based on the LN2 temperature. The effects of vacuum degree, number layers of MLI and preload force on the insulation performance were studied. Three different spacer materials were tested. However, previous studies have focused on the effect of reflector or spacer types and the various residual gas flushing insulation jacket on the insulation. Ratnakar [19] reviewed the effective thermal conductivity of various insulation methods for LH2. The relationship between residual gas types, pressure, temperature and insulation materials of the insulation jacket and heat transfer was evaluated based on first principles. A numerical model that can be extrapolated from LN2 to the LH2 temperature for insulation calculation was proposed. However, the literature did not mention the insulation performance optimization of large LH2 storage tanks. Wang et al. [20] studied the heat leakage in MLI tanks at different vacuum levels and proposed a new method that could inversely identify the pressure in the vacuum interlayer by obtaining the temperature on the surface of the reflectors. The results showed that the apparent thermal conductivity was almost constant when the vacuum of the insulation jacket was <0.1 Pa, and the heat leakage heat flux increased rapidly when the vacuum was >1 Pa. This study only considered the effect of the vacuum of MLI on the heat leakage of cryogenic tanks, and did not investigate the contribution of solid thermal conductivity and radiation heat transfer of MLI to the total heat leakage.
Coupling of VCS and the MLI were proposed by some researchers to improve the insulation performance of the MLI. Cryogenic vapor was introduced into the VCS, which absorbs the heat leakage in the vacuum jacket [21,22]. Jiang et al. [23,24] investigated the effect of the single VCS and the MLI on the storage of different cryogenic liquids (LN2, LH2, LO2 and LCH4) compared to that without VCS in cryogenic tanks. The results revealed that the heat leakage of LN2, LH2, LO2 and liquid methane was decreased by 59.6%, 26.8%, 22.7% and 20.3% when VCS was installed, respectively. The heat leakage and temperature profile of the coupled insulation model for MLI/variable-density multilayer insulation (VDMLI) and VCS was studied by Zheng et al. [25]. The results showed that the heat leakage of VDMLI and VCS was decreased by 83.12% compared with that of uniform MLI. Yang experimentally studied the transient heat transfer in the cryogenic tank at different filling rates and pressure ranges. The result showed that the daily evaporation rate of the tank was reduced by 10.07% when the H2 vapor was introduced into the VCS at 457–467 kPa and a 51.8% filling rate [26]. However, there have been few studies on the effect of multiple VCSs with different connections and positions at the MLI on heat leakage.
As previously stated, there have also been few studies regarding the large LH2 insulation scheme design. Taking a 4000 m3 LH2 spherical tank, the heat transfer model of large LH2 spherical tanks was developed, and a non-constant value of heat flux of MLI was considered during the calculation. Simultaneously, the different connection methods of double VCSs for large LH2 spherical tanks were compared and analyzed. The heat leakage effect of the installation position scheme of the VCS and LN2CS at the MLI was investigated. This study not only provides theoretical and technical support for the highly efficient storage and transportation of LH2, but also provides a basis for the subsequent optimization design of the insulation performance of large LH2 spherical tanks.

2. The 4000 m3 LH2 Tank Structure and Insulation Schemes

2.1. Physical Model of a 4000 m3 LH2 Tank

Figure 1 shows a 4000 m3 LH2 storage tank, which primarily consists of an inner tank, outer tank and vacuum jacket. The diameter of the inner tank and the outer tank are 19.7 and 21.4 m, respectively. The volume of vacuum annular space is 1128.34 m3, which is evacuated to reduce the gas conduction. The inner and outer upper struts are used to support the inner and outer tank, respectively.

2.2. Design of Insulation Schemes

To investigate the insulation performance of a 4000 m3 LH2 spherical tank, seven insulation schemes were designed. The specific insulation schemes were as follows:
Vacuum insulation scheme: Vacuum insulation is one of the most common modes of industrial insulation. The vacuum jacket of a spherical double-wall tank was evacuated to reduce convective heat transfer and residual gas conduction between LH2 and the external environment. The vacuum level of the insulation jacket was usually maintained at greater than 10−2 Pa.
MLI scheme: The MLI material was composed of multi-reflectors and low thermal conductivity spacers in a ratio of 1:1, stacked on the outer surface of the inner container of the LH2 storage tank, as shown in Figure 2. The purpose of multi-reflectors minimizes radiation heat transfer between LH2 and the outer tank. The spacers weaken solid conduction between two adjacent reflectors. The MLI is usually combined with a high vacuum to achieve the best insulation effect.
HGMs insulation scheme: The HGMs insulation was composed of many hollow glass microspheres and a low vacuum. The diameter of HGM was usually 0.002–0.1 mm. The HGMs insulation was suitable for large LH2 tanks because it did not require a higher vacuum (usually less than 1 Pa) than that of the MLI. The HGMs were stacked into the vacuum jacket to minimize solid conduction, as shown in Figure 3. The vacuum jacket was used to suppresses residual gas conduction. HGMs have good porosity and hardness, and they are not easy distorted when HGMs are installed, making it easier to evacuate residual gas than with MLI.
MLI + single VCS scheme: The self-vapor with lager cool capacity of a LH2 spherical tank was fully utilized to absorb the heat leakage. The MLI in the vacuum jacket was divided into inside and outside parts by the VCS. The outside heat loads reached the position of VCS through the external part of the MLI. A proportion of the heat was absorbed by VCS, and a little residual heat invaded the inner tank, as shown in Figure 4. Additional heat leaked into the inner tank through the support structure, heat bridge, MLI, etc.
MLI + double series VCS scheme: The two VCSs were connected in series, installed at the inner and outer MLI. The cryogenic vapor flowed through into both VCSs. The inner VCS absorbed heat leakage through the external VCS and part of the MLI. The outer VCS acted as a first shield to absorb heat leakage through part of the MLI between the inner VCS and outer tank (see Figure 5).
MLI + double parallel VCS scheme: The two VCSs were connected in parallel inside the MLI. Compared with the series VCSs, the cooled vapor was evaporated from the LH2 tank, which flowed into both the inner and outer VCSs to absorb the leaked heat. Herein, it is assumed that the flow quantity of cryogenic vapor was equalized, which simultaneously flowed through the inner and the outer VCS.
MLI + LN2CS scheme: Figure 6 shows that the MLI was divided into inside and outside parts by the LN2CS. The outside heat loads reached the position of the LN2CS through the external part of MLI, which was absorbed by the LN2CS. The residual heat between LN2CS and LH2 invaded the inner tank. The LN2 was introduced into the LN2CS as a cold boundary, which realized the utilization of LN2. This is inexpensive and has a high cooling capacity as LH2 tank insulation (see Figure 6).

3. Development of Heat Transfer Model

3.1. Heat Transfer Model of MLI

The following assumptions were made in the calculation process [27]:
  • The spacer between two adjacent radiators has no effect on the radiation heat leakage;
  • The spacer between two adjacent reflection shields is a finite space;
  • The longitudinal conduction of the MLI is neglected, and overall conduction is assumed to be radial.
According to the above assumptions, high-vacuum MLI can be simplified as a one-dimensional conduction. The total heat flux leaking into the LH2 spherical tank is given as follows (Equation (1)):
q = q r + q c + q g
where q is the total heat leakage flux, W/m2; qs is the radiation heat transfer, W/m2; qg is the residual gas conduction, W/m2; and qr is the solid conduction, W/m2.
The calculating equations of radiation heat transfer between the two adjacent reflection shields are given based on the Stefan–Boltzmann law, as shown in Equation (2):
q r = K r , i ( T H T C ) K r , i = σ ( T i + 1 2 + T i 2 ) ( T i + 1 + T i ) / ( 1 / ε H + ( A i + 1 / A i ) ( 1 / ε C 1 ) )
where Kr,i is the radiation heat transfer coefficient, W/(m2·K); σ is the Stefan–Boltzmann constant, usually 5.67 × 10⁻⁸ W/m2·K4 [23]; TH and TC represent the warm and cold boundary temperatures of each layer, K, respectively; εH and εC is the emissivity of the warm and cold boundaries, respectively; and the emissivity of double aluminized Mylars is 0.04 [24]. Ai is the average area of the ith layers, m2; Ai+1 is the average area of the I + 1th layers, m2; Ti is the temperature of the ith layer, K; and Ti+1 is the temperature of the i+1th layer, K.
The law of residual gas conduction between narrow spaces is described by the ratio of the average free path (l) of the gas to the physical characteristic size (L), i.e., Knudsen number (Kn). Herein, L is the size of the interlayer. The value of Kn is mainly used to define the different motion states of gas molecules. The residual gas conduction is mainly through the collision of gas molecules with walls in the free molecular zone. At this time, the residual gas conduction can be expressed as Equation (3):
q g = K g , i ( T H T C ) K g , i = p 8 T G v ¯ a ( γ + 1 γ 1 ) v ¯ = 8 R T G π M
where Kg,i is the residual gas heat transfer coefficient, W/(m2 K); v ¯ is the average velocity of the gas, m/s; TG is the average temperature of the gas, K; M is the molecular mass of gas, g/mol; R is the universal gas constant, 8.314 kJ/mol·K; T is the average temperature of the two adjacent reflectors, K; p is the residual gas pressure, Pa, usually 0.001 Pa; and α is the accommodation coefficient, α = (1/a1 + (ri × ri/ri−1/ri−1) × (1/a2 − 1)), air is usually 0.9 [23].
In the MLI, the spacer chosen was made of the Dacron net material. The solid conduction and thermal conductivity equation were obtained as Equation (4).
q s = K s , i ( T H T C ) K s , i = 2 π C 2 f λ / ( r i + 1 r i )
where Ks,i is the solid heat transfer coefficient, W/(m2 K); C2 is the empirical constant; Dacron net is usually 0.008 [25]; f is the relative density of the spacer, usually 0.03 [25]; and ri is the radius of each layer of the spherical tank, m.
The thermal conductivity of the spacer was considered to be a function of temperature, which was an empirical formula as Equation (5).
λ = 0.017 + 7 × 10 6 ( 800 T ) + 0.0228 ln ( T )
where T is the average temperature digital value of the two adjacent reflective shields.

3.2. Heat Transfer Model of Single VCS

The present computational model was assumed as follows:
(a)
Between the VCS and MLI, there is no contact thermal resistance;
(b)
The cooling capacity of the VCS is totally used to absorb the heat;
(c)
The temperatures of both sides of the VCS are equivalent;
(d)
The heat leak into the inner tank through the support structure, pipeline, etc., is a constant value.
Therefore, the heat flux absorbed by the boil-off gas in the VCS can be obtained based on the equation of gas transformation [28] (Equations (6) and (7)):
q V C S = m ˙ Δ h = m ˙ ( h 2 ( T 2 , P 2 ) h 1 ( T 1 , P 1 ) )
m ˙ = Q TANK h LH 2
where m ˙ the mass flow rate of the boil-off gas in the LH2 tank, kg/s; h1(T1, P2) and h2(T2, P2) are the inlet and outlet enthalpies of the H2 of the VCS, respectively, kJ/kg, both values were obtained using NIST code REFPROP 9.1; hLH2 is the latent heat of the LH2, kJ/kg; and QTANK is the total heat leakage of the LH2 tank, W.
According to Figure 4, the energy conservation equation of the single VCS can be obtained as follows (Equation (8)):
Q 1 = ( T w T x ) / R 1 Q 3 = ( T x T c ) / R 2 m = ( Q 3 + Q support ) / γ Q 1 Q 3 = Q 2 = m C p ( T x T c )
where Tw is the ambient temperature, K; Tx is the temperature of the VCS, K; Tc is the temperature of the inner tank, K; R1 and R2 are the thermal resistances of both sides of the VCS, K/W; γ is the latent heat of LH2, kJ/kg; and Cp is the specific heat capacity of H2, kJ/(kg·K). According to our previous calculation, the heat leakage of the support structure (Qsupport) is ~90W; Q1 is the heat leakage that leaks into the VCS from the outer tank, W; Q2 is the heat leakage that is absorbed by VCS, W; and Q3 is the heat leakage that leaks into the inner tank from the VCS, W.
The insulation efficiency of the VCS is shown in Equation (9):
η i = Q 2 Q M L I × 100 %
where η i is the insulation efficiency of VCS, %; and Q M L I is the heat leakage into the LH2 tank using the MLI, W.

3.3. Heat Transfer Model of Double VCSs

To further reduce the heat leakage of MLI and fully utilize the cooling capacity of cryogenic H2, the parallel and series connection schemes of double VCSs were analyzed, as shown in Figure 5. The parallel VCSs were assumed to distribute 50% of the gas flow. Thus, the energy conservation relationship of the double VCSs was obtained as follows (see Equation (10)):
Q d 1 = ( T 1 T 2 ) / R d 1 Q d 2 = ( T 2 T 3 ) / R d 2 Q d 3 = ( T 3 T 4 ) / R d 3 m = ( Q d 3 + Q support ) / γ Q d 1 Q d 2 = Q d 5 = m 2 C p ( T 2 T 4 ) Q d 2 Q d 3 = Q d 4 = m 1 C p ( T 3 T 4 )
where T1 is the ambient temperature, K; T2, T3 are the temperatures of the outer and inner VCSs, K; T4 is the temperature of LH2, K; Rd1, Rd2, Rd3 are the thermal resistances between the outer VCS and the outer tank, the outer VCS and the inner VCS, and the inner VCS and the inner tank, K/W; m 1 and m 2 are the flow quantities of cryogenic H2 through the inner and outer VCSs, respectively, kg/s; Qd1 is the heat leakage that leaks VCS1 from the outer tank, W; Qd2 is the heat leakage that is absorbed by the VCS, W; Qd3 is the heat leakage that leaks into the inner tank from the VCS2, W; Qd4 is the heat leakage that is absorbed by VCS2, W; and Qd5 is the heat leakage that is absorbed by VCS1, W.

3.4. Heat Transfer Model of LN2CS

To improve the insulation performance of MLI, the LN2CS was designed at the MLI stage because LN2 is cheaper and has a higher cooling capacity, as shown in Figure 6. The calculation process and model were similar to the previous state, where the MLI was divided into internal and external parts by the LN2CS. The heat transfer equation of the LN2CS is given as Equation (11). The density was 810 kg/m3.
Q N 1 = ( T w T LN 2 ) / R LN 2 1 Q N 2 = ( T LN 2 T c ) / R LN 2 2 m LN 2 = Q N 2 / γ LN 2
where TLN2 is the temperature of LN2CS, K; m LN 2 is LN2 consumption, kg/s; Q NL is the heat absorbed by LN2CS, W; QN1 is the heat leakage that leaks into the VCS from the outer tank, W; QN2 is the heat leakage that is absorbed by the VCS, W. RLN2-1 and RLN2-2 are the thermal resistances of both sides of the LN2CS, K/W; and γ LN 2 is the evaporation heat of LN2 (199.485 kJ/kg).

3.5. Calculation of Daily Evaporation Rate

Equation (12) displays the daily evaporation rate of LH2 spherical tank [29]:
η = M V b × 100 %
where η is the daily evaporation rate, %; M is the 24-hour LH2 evaporation, m3; and Vb is the full capacity of the LH2 spherical tank, m3.

3.6. Solving Strategy of Heat Transfer Model

The thermal resistance of radiation heat transfer, residual gas and solid conduction was taken as Rr,i, Rg,i and Rs,i, respectively [30,31]. The computational equation of thermal resistance in MLI is shown in Figure 7. Equations (13) and (14) show the total and thermal resistance of each layer (Rt, i):
R t , i = 1 / A ( K r , i + K g , i + K s , i )
R r , i = 1 / A K r , i R g , i = 1 / A K g , i R s , i = 1 / A K s , i
where A is the area of MLI layers, m2.
The program calculation was implemented based on the Equation (15):
T n = T c + i = 1 n R t , i i = 1 N R t , i ( T w T c ) ( n = 2 , 3 , 4 . . . . . . 50 , N = 50 )
where Tn is the value of new iterative temperature, K.
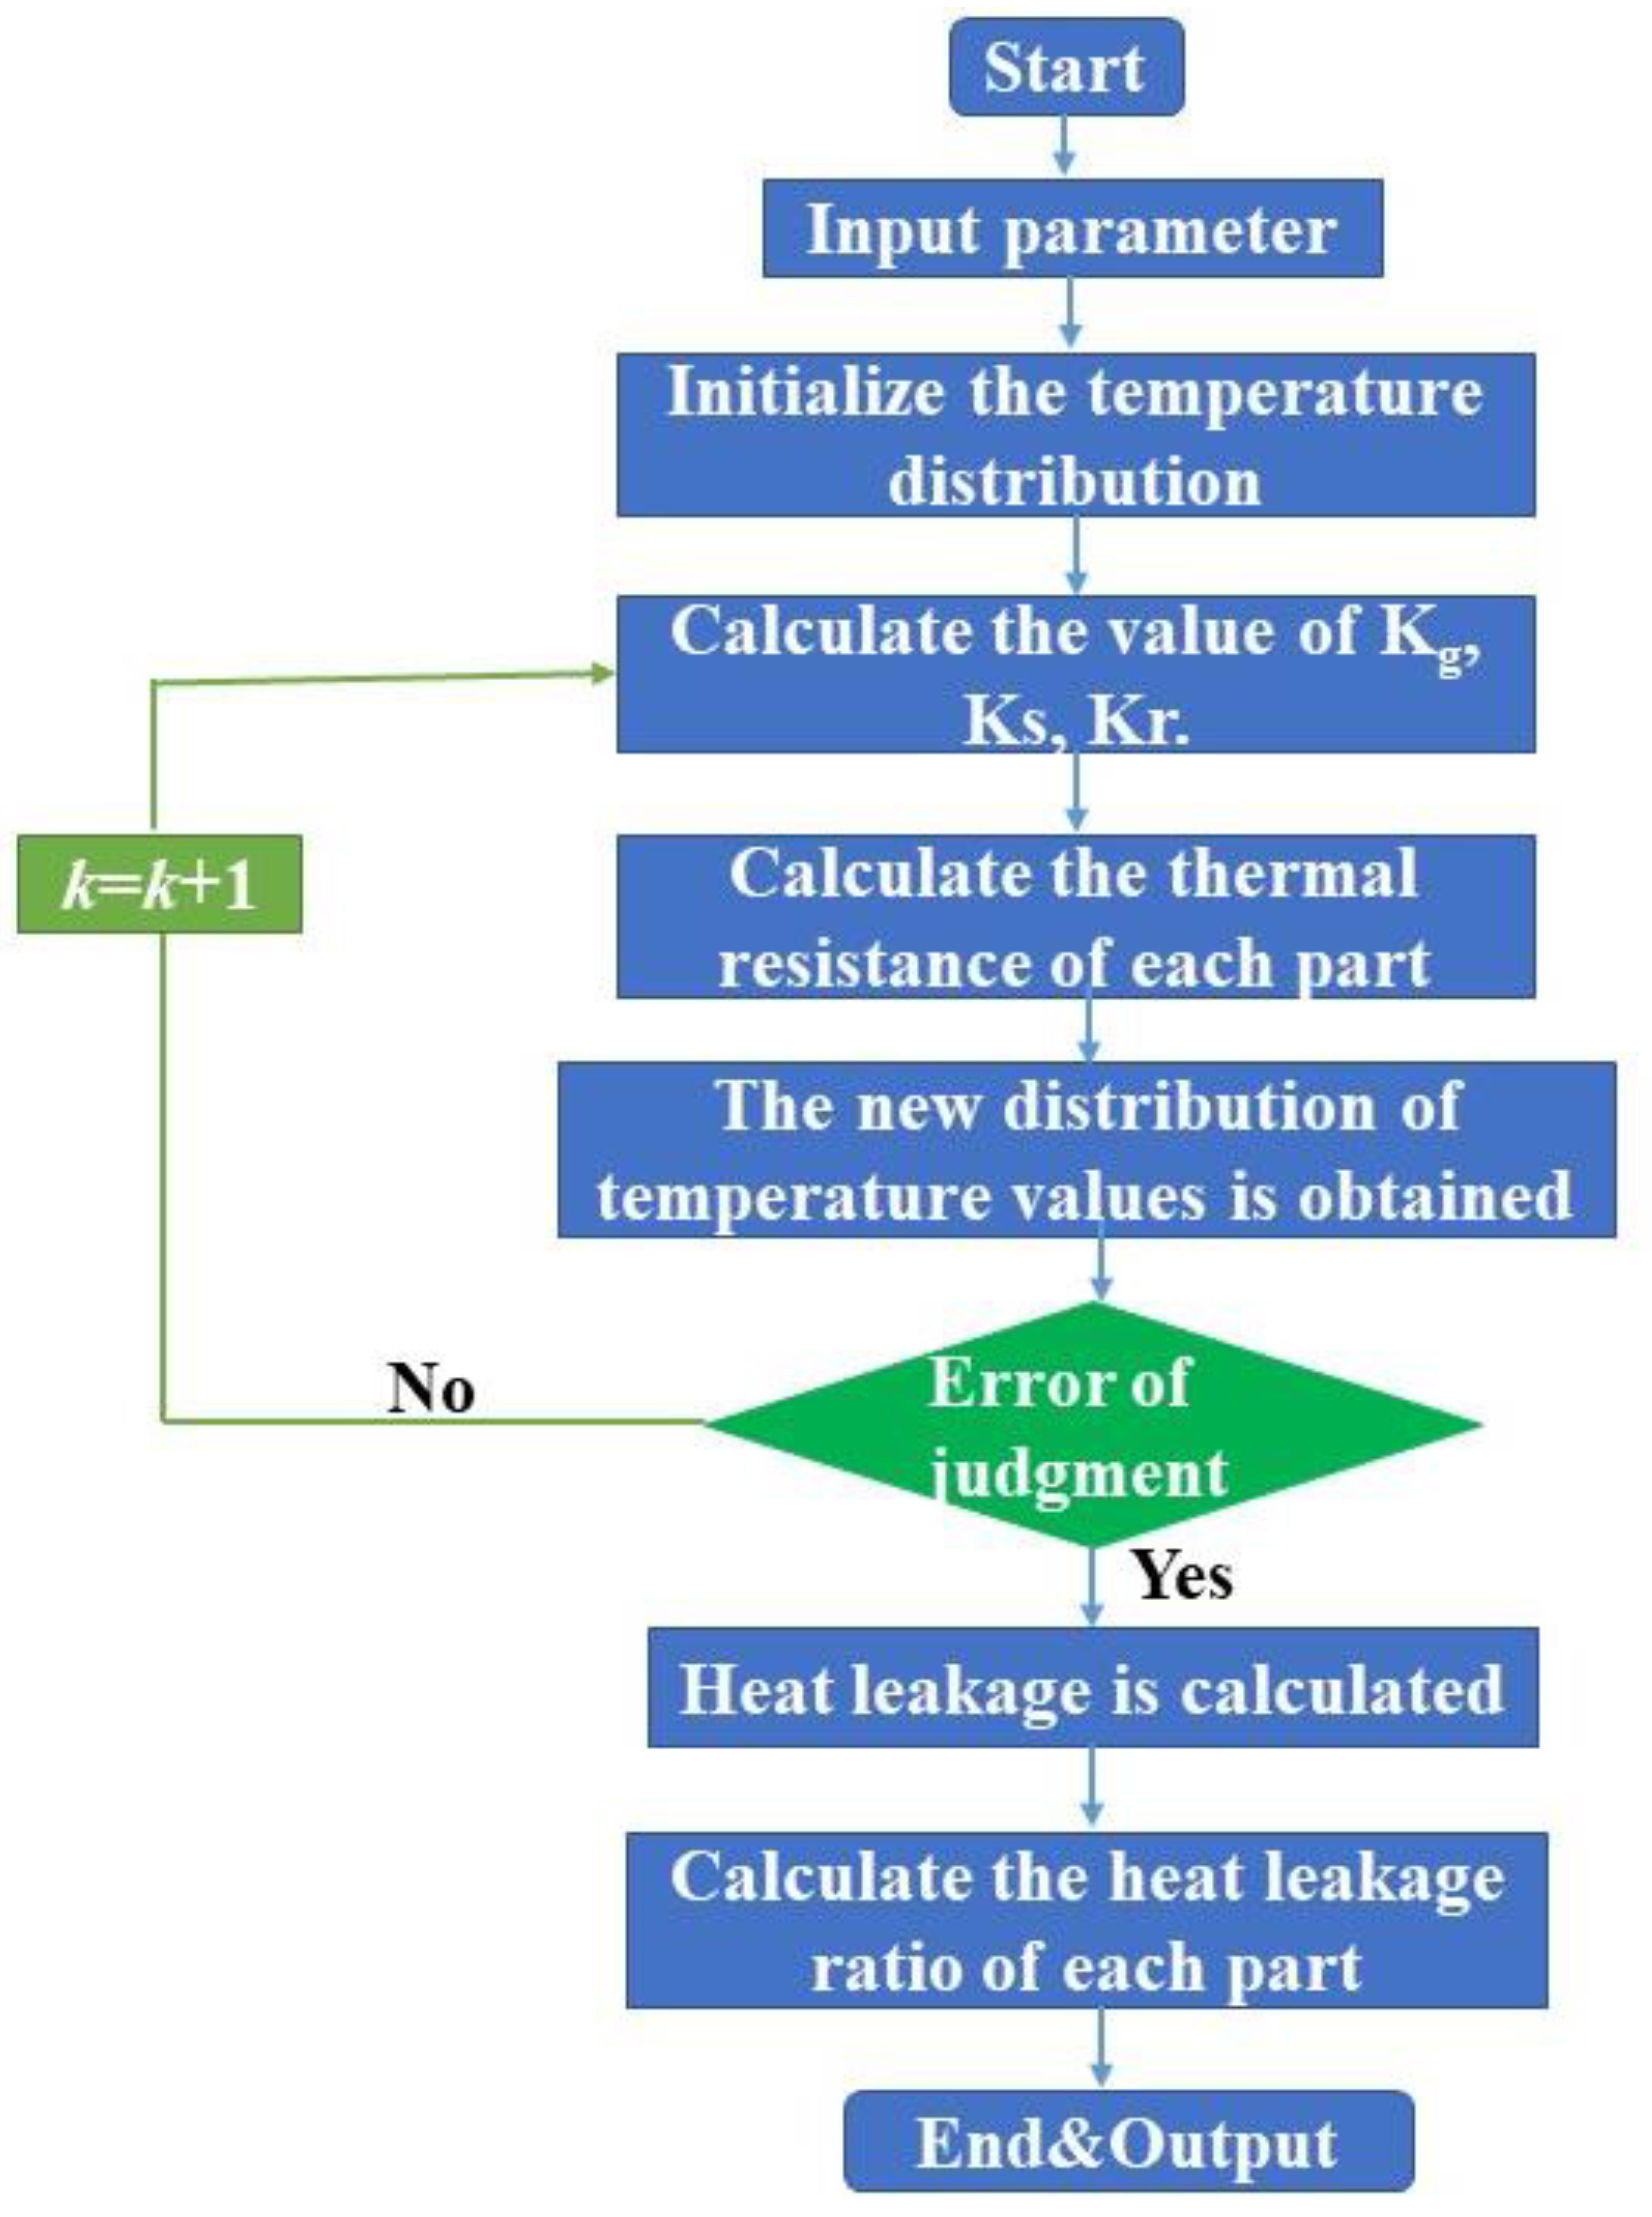
The mathematical model of heat leakage of the MLI was calculated iteratively using C++ programming. The flowchart of the program is shown in Figure 8.
The heat transfer model of VCS was implanted into the layer by layer model. Figure 9 shows that the numerical calculation was mainly divided into seven steps: (1) Prior to the calculation, the temperature profile of each interlayer of the MLI was assumed; (2) The thermal resistance between two adjacent radiators was calculated according to the temperature profile; (3) According to the position of the VCS, the cumulative thermal resistance of both sides of the VCS (the value of R1 and R2) was obtained; (4) Each part of the MLI of the heat flux was calculated according to the value of thermal resistance; (5) The temperature of the VCS was calculated based on the energy conservation; (6) The value of temperature of each layer of MLI was calculated (Equation (15)); (7) The new obtained value of the temperature profile was compared with the previous value of the temperature profile. If it was less than the errors, the calculation was completed. Otherwise, the second step was returned to, and the iterative calculation was continued.
The boundary conditions: (a) the ambient temperature (hot wall) was taken as 295 K; (b) the temperature of the cold wall was taken as 20.3 K.
In terms of the initial conditions, (a) The MLI temperature per layer was given linearly; (b) The inlet temperature of the VCS was assumed to be 20.3 K; and (c) The outlet temperature of the VCS was assumed to be equal to the temperature of the MLI layer where it was located.

3.7. Verification of the Heat Transfer Model

To verify the numerical model, the numerical calculation results and the experimental data were compared. The MLI was a double-sided aluminized Mylars with the spacer made of Dacron net, as was used in the literature [32]. The 50 layers of MLI were chosen to be stacked on the outer surface of the inner cryogenic vessel. The three temperature sensors were placed at the upper, middle and lower layers inside the 1st, 10th, 20th, 30th, 40th and 50th layers, respectively. The average value of the temperature between the layers of the experimental MLI was chosen to verify the numerical results. Figure 10 reveals that the numerical calculation results are in good agreement with the experimental data of Zheng. The maximum error values of the present results and referred experimental data were less than 10%. Therefore, the numerical model of heat transfer could be used for heat transfer calculations of a 4000 m3 LH2 spherical tank.

4. Results and Discussion

4.1. Comparison of Insulation Scheme

To compare the insulation performance of the 4000 m3 spherical tank, the daily evaporation rate of the spherical tank was calculated. The effective thermal conductivity of HGMs and HV-MLI at the LN2 temperature was obtained from Refs [33,34,35]. Figure 11 shows that the daily evaporation rate of MLI was 1.24 × 10⁻⁴%, 3.31×10⁻⁴%, and 2.05 × 10⁻³% at 10−3, 10−1 and 1 Pa, respectively. The daily evaporation rate of MLI was 95.9%, 95.55% and 90.04% lower than that of HGMs, and 99.73, 99.71% and 99.44 % lower than that of the vacuum only, at 10−3, 10−1 and 1 Pa, respectively. The daily evaporation rate of HGMs was 7.45 × 10⁻³% at 13.3 Pa. The daily evaporation rate of HGMs was 48.49% and 92.41% lower than that of MLI and the vacuum only, respectively. For the higher insulation requirement of LH2 tanks, MLI was more suitable. MLI had a better insulation performance than HGMs when the pressure of the vacuum jacket was less than 3.34 Pa or higher than 133.69 Pa. HGMs had better insulation performance than MLI when the jacket pressure was between 3.34 Pa and 133.69 Pa. When the vacuum degree was low (less than 3.34 Pa), radiation dominated the heat leakage. Radiation shields limited the radiation heat transfer, and MLI exhibited the best insulation performance in this pressure range. The solid conduction increased with jacket pressure in the range of 3.34 Pa to 133.69 Pa, yet the solid conductivity of HGMs was lower than that of spacers. The radiation and residual gas conduction became more dominant as the vacuum degree increased (greater than 133.69 Pa), and the reflection shields lessened the radiation heat transfer. Consequently, the insulation performance of the LH2 tank was improved.

4.2. Percentage of Heat Leakage in MLI

Figure 12 shows the proportion of the three heat transfer types versus the position in the MLI. The percentages of radiation heat transfer, residual gas conduction and solid conduction were 7.70%, 77.81% and 14.50% in the innermost layer and 95.83%, 3.31% and 0.87% in the outermost layer, respectively. The proportion of radiation heat transfer of the total heat leakage gradually increased from the inner to the outer layer. The radiation heat leakage in the outermost layer was 12.45 times greater than that in the innermost layer. The heat leakage of the innermost layer was dominated by gas conduction, which was approximately 10.11 and 5.37 times than that of the radiation heat leakage and solid conduction, respectively. The residual gas conduction in the innermost layer was 23.5 times that in the outermost layer. The closer to the inner tank, the larger the temperature difference between the two adjacent layers, which increased the heat conduction of the residual gas. The percentage solid conduction of the total heat leakage from the inner layers to the outer layers kept decreasing. The solid conduction in the innermost layer was 16.75 times that in the outermost layer.

4.3. Effect of Layer Number on MLI Performance

Insulation performance and manufacturing costs of large LH2 tanks should both be considered. Figure 13 shows that the heat leakage significantly decreased and then became stable as the number of MLI layers increased. However, its cost kept increasing linearly. There is a suitable value for the layer number of the MLI. If the layer number is greater than this value, adding MLI layers has no significant effect on the insulation performance, but the manufacturing cost is significantly increased. Based on this fact that the layer number of the MLI was chosen as 50.

4.4. Effect of Ambient Temperature on MLI

The daily evaporation rate of LH2 increased from 8.95 × 10⁻⁴% to 2.52 × 10⁻³%; this increased by 1.82 times when the ambient temperature increased from 230 K to 310 K, as shown in Figure 14. The boil-off of LH2 increased linearly when the temperature difference between the inner and outer tank of LH2 increased. Therefore, the ambient temperature had a significant effect on the heat leakage of the LH2 tank. The temperature difference between day and night and the regional temperature difference need to be carefully considered in the design.

4.5. Effect of Single VCS on the MLI

Figure 15a shows that when the VCS moved outward, the heat leakage into the LH2 first decreased and then increased. The findings demonstrated that when the VCS was installed at the 10th layer, the minimum heat leakage was 159.44 W. The heat leakage was 2.40%, 2.2% and 35.1% lower than that when the VCS was installed at the 5th, 15th and 45th layers, respectively. The heat leakage was 40.5% lower than that of the MLI. Additionally, the closer the VCS was to the warm wall, the more heat leakage was absorbed by the VCS. There was less MLI wrapped around the VCS when the VCS was closer to the warm wall, which caused greater radiation heat leakage into the VCS. It can be concluded that the performance insulation of MLI was significantly affected by the position of the VCS.
Figure 15b shows the effect of the VCS position on the temperature profile of MLI. The temperature profile of MLI was lower than that without VCS. The presence of the VCS significantly reduced the temperature profile from the VCS to the cold boundary and weakened the heat leakage.

4.6. Effect of Double VCSs on MLI

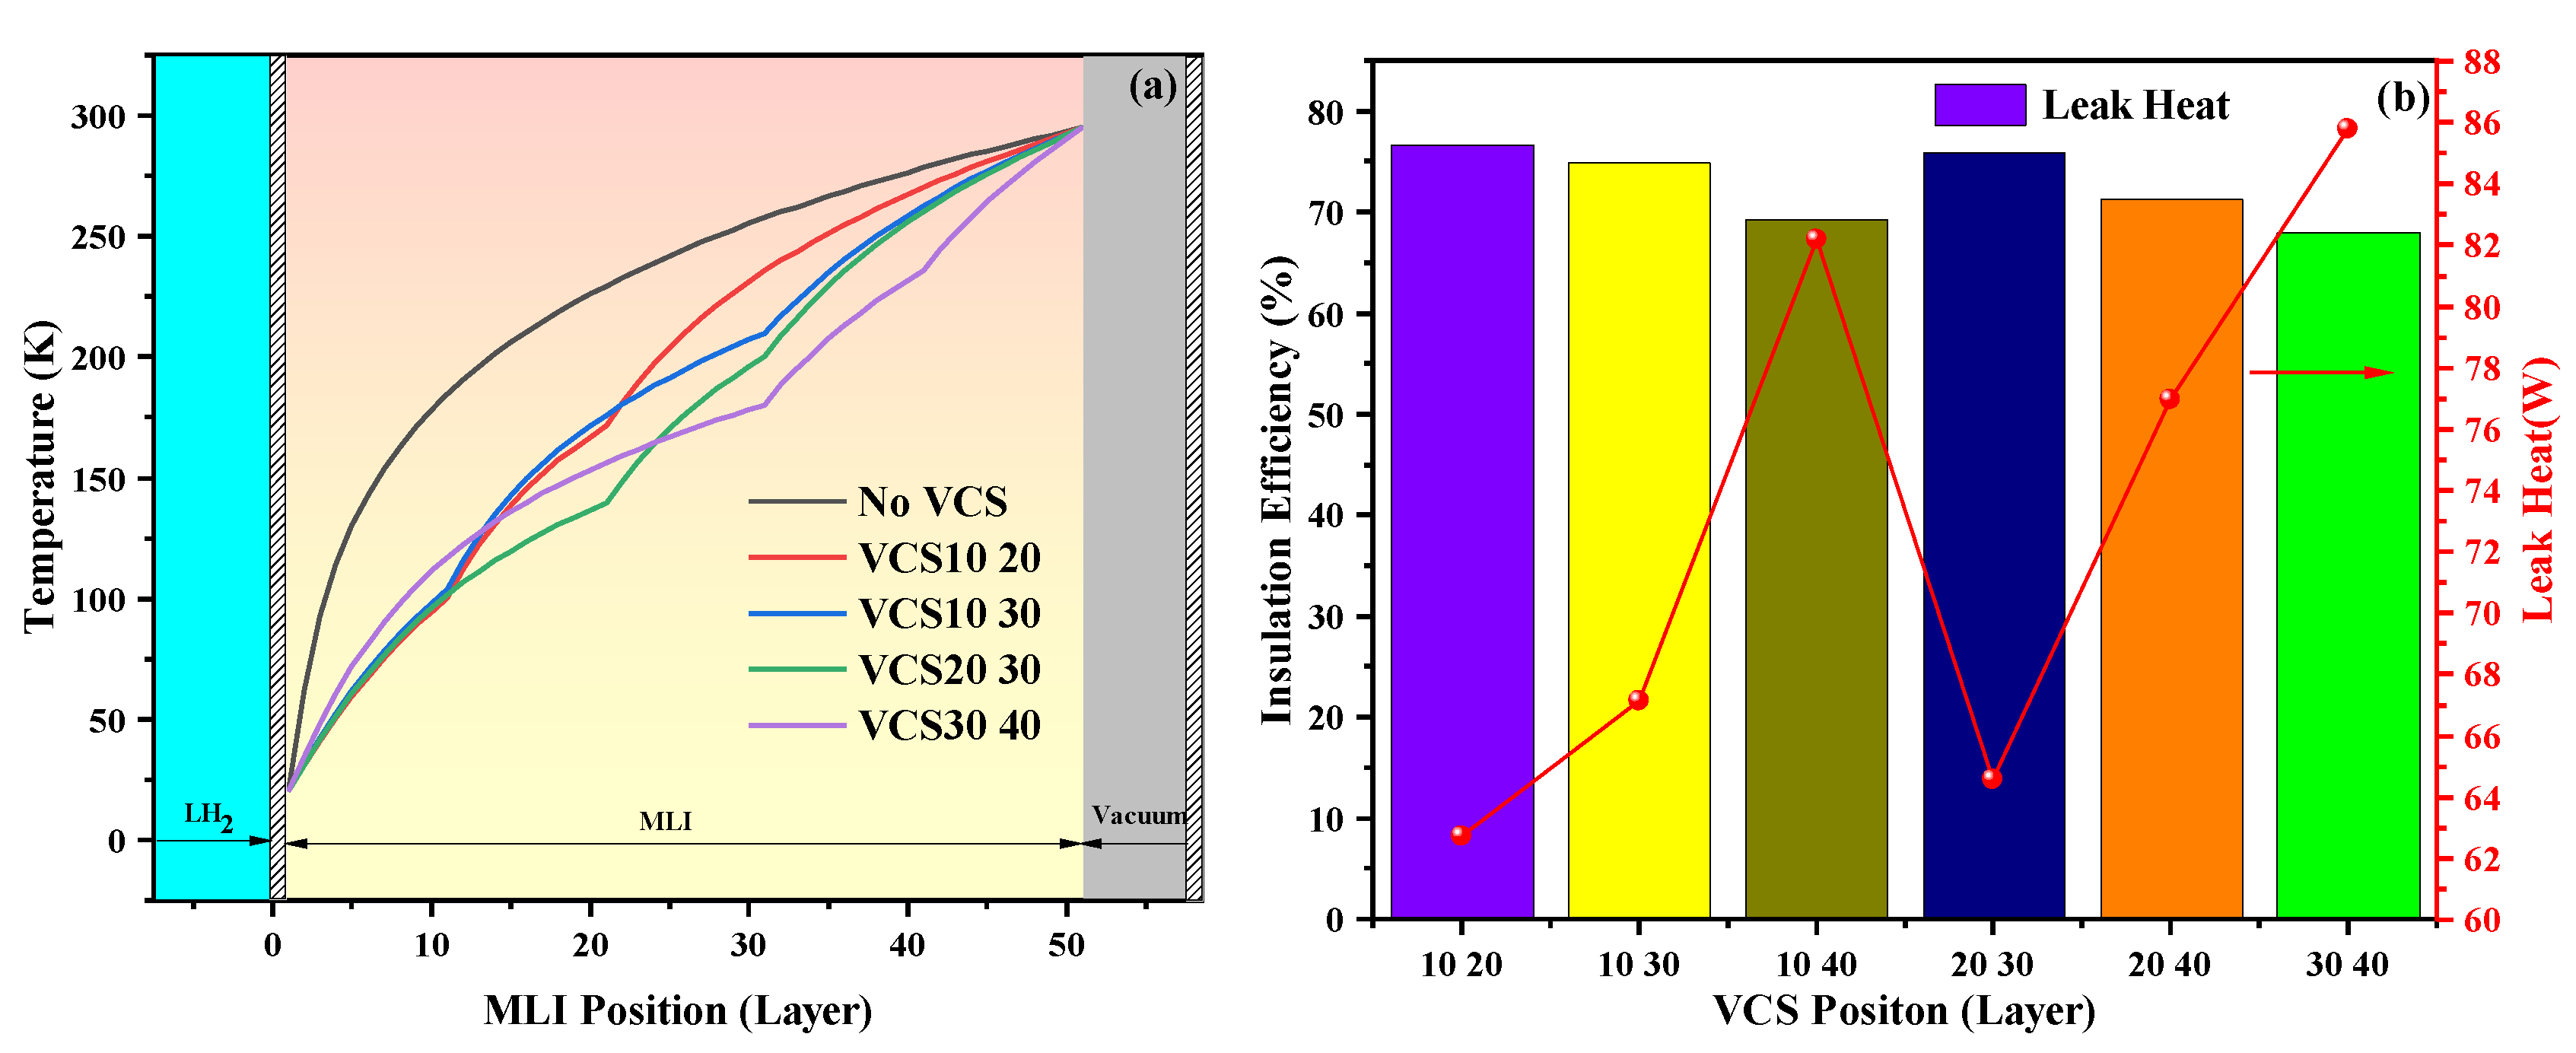
A MLI system integrated with two VCSs was designed to improve the insulation performance of the LH2 spherical tank. The temperature profile versus the VCS position is shown in Figure 16a, when two VCSs were linked in parallel. The minimum heat leakage through the MLI was 62.73 W. The heat leakage was 60.66%,18.11%, 16.31%, 9.55%, 17.37%and 12.02% lower than that of VCS 10, P-VCS 10 20, P-VCS 10 30, P-VCS 10 40, P-VCS 20 30 and P-VCS 20 40, respectively, when the inner and outer VCSs were installed at the 10th and 20th layers (P-VCS 10 20). Compared with MLI, the P-VCSs improved the insulation performance by 76.6%.
Figure 16b shows that the temperature profile of P-VCSs was significantly lower than that of No VCS. The average temperature of VCS10 20, VCS10 30, VCS20 30 and VCS30 40 was 16.22%, 18.44%, 22.16% and 23.83% lower than that of No VCS, respectively. It can be seen that the presence of double P-VCSs significantly lowered the temperature profile of MLI, which decreased the heat leakage of the LH2 tank. Additionally, the red curve shows that the heat leakage showed a trend of increasing, decreasing and increasing with the outward movement of the first VCS, while the heat leakage showed a trend of increasing with the outward movement of the second VCS.
Figure 17 shows that series-connected double VCSs (S-VCS) significantly reduced heat leakage through the MLI. The heat leakage of S-VCS 30 40 was 83.79%, 25.67% and 0.75% lower than that of No VCS, VCS10 and P-VCS 10 20, respectively. Compared with VCS10 and P-VCS 10 20, the insulation performance was improved by 7.16% and 43.26%, respectively. Figure 17a shows that when the first VCS moved outward, the heat leakage initially reduced, then increased. The average temperature of S-VCS 10 20, S-VCS 10 30, S-VCS 20 40 and S-VCS 30 40 was 18.15%, 20.32%, 25.55% and 28.05% lower than that of No VCS, respectively, as shown in Figure 17b. The average MLI temperature of S-VCS 10 20, S-VCS 10 30 and S-VCS 30 40 was 2.31%, 2.31% and 6.62% lower than that of P-VCS 10 20, P-VCS 10 30 and P-VCS 30 40, respectively. It is concluded that the average temperature of S-VCS was minimum, and a greater insulation performance was obtained.

4.7. Effect of LN2CS on MLI

Table 1 shows that the lower the amount of heat leaking into the LH2 tank through the MLI, the closer the LN2CS is to the warm wall. This is because the heat leakage is directly absorbed by the LN2CS in the vacuum jacket, which reduces the amount of residual heat that passes through the MLI inner section. However, the LN2CS cannot be installed close to the cold wall. If there are few MLI layers between the LN2CS and LH2, this will allow heat to leak from the LN2 to the LH2, causing unnecessary evaporation of LH2. Figure 18 illustrates that the daily evaporation of LH2 rapidly decreased, then tended to be stable when the LN2CS was moved from the inside to the outside of the MLI. However, the LN2 consumption increased rapidly when the LN2CS was placed closer to the warm wall. According to cost analysis, the LN2CS should be placed at the 40th layer of the MLI. The LN2 consumption was only 9.92% of that when LN2CS was placed at the 49th layer.
Figure 19 demonstrates that adding LN2CS significantly reduced the heat leakage of MLI. Figure 19a reveals that the LN2CS was more cost-effective when it was placed at the 40th layer. By comparison with No VCS, the insulation efficiency was enhanced by 96.05%. The temperature profile of the MLI when the LN2CS was mounted at different positions is depicted in Figure 19b. From the LN2CS at the cold wall, the temperature profile of the MLI was much lower than that of No VCS. The temperature profile of MLI between the LN2CS and the cold wall was significantly lower than that of No VCS. When the LN2CS was installed near the warm wall, the temperature profile of MLI significantly increased. The MLI average temperature between the LN2CS and the cold wall was 60.80% lower than that of No VCS when the LN2CS was added between the 10th and 11th layer; in contrast, the average temperature of the MLI between the LN2CS and the warm wall was 6.98% lower than that without VCS. The LN2CS was installed between the 20th and 21st layers. The average temperature of the first 20 layers of MLI was 71.32% and 51.99% lower than that of No VCS and VCS 10, respectively, while the average temperature of the last 30 layers was 6.83% and 8.09% lower than that of No VCS and VCS 10, respectively. When the LN2CS was placed between the 30th and 31st layers, the average temperature of the MLI between the LN2CS and the cold wall was 74.30%, 64.71%, and 44.30% lower than that of No VCS, VCS 10, and VCS 20, respectively. This was 1.82%, 13.39% and 10.32% lower than that of the average temperature of the MLI between the LN2CS and the warm wall, respectively. When the LN2CS was placed between the 40th and 41st layers, the average temperature of the first 40 layers of the MLI was 65.72%, 70.44%, 60.43% and 41.31% lower than that of No VCS, VCS 10, VCS 20 and VCS 30, respectively, which was 15.99%, 15.48%, 14.43%, and 12.07% lower than that of the last 30 layers, respectively. It can be concluded that the LN2CS can effectively lower the temperature profile and improve the insulation efficiency of a LH2 tank.

5. Conclusions

In conclusion, there have been few studies on the insulation scheme of large LH2 tanks. This paper mainly focused on the insulation performance of a 4000 m3 LH2 spherical tank. The insulation performance of seven insulation methods were analyzed and compared using non-constant heat flux. This paper designed two VCSs and proposed two connection schemes, and the maximum insulation efficiency improved by 72.75% compared with the common single VCS. Additionally, the installation position optimization of VCS and LN2CS was performed accurately and in detail. The main conclusions drawn are as follows:
  • The insulation properties of HGMs and MLI is better than that of only vacuum insulation. When the pressure of the vacuum interlayer is less than 3.34 Pa, the insulation performance of MLI is better than that of HGMs. When the vacuum degree is in the range of 3.34 to 133.69 Pa, the insulation performance of HGMs is better than MLI.
  • The daily evaporation rate of LH2 is increased by 1.82 times when the external environment temperature increases from 230K to 310K. Considering the cost, there is an optimal layer number of the MLI. As the number layer of MLI increases, the heat leakage first drops, then gradually slows. The optimal value is 50 layers for a 4000 m3 LH2 spherical tank.
  • The minimum heat leakage of P-VCSs can be improved by 76.6% compared with that of No VCS. The heat leakage through the MLI will further decrease when S-VCSs is used. The minimum heat leakage of S-VCSs is 83.79%, 25.67% and 30.75% that of No VCS, VCS10 and P-VCS, respectively. The maximum insulation efficiency can be improved by 7.16% and 43.26% compared with that of VCS10 and P-VCS, respectively;
  • Considering the comprehensive cost analysis, the optimal installation scheme is obtained when the LN2CS is installed at the 40th layer; consumption is decreased to less than 10W. The insulation efficiency is 96.05% higher than that of No VCS.
The results of this study provide comprehensive solutions for the efficient operation of future large-scale hydrogen storage systems, thus promoting the competitive advantage of hydrogen energy in the future by achieving the goals of the large-scale use and efficient insulation of LH2 storage tanks.

Author Contributions

Conceptualization, methodology, software, validation, formal analysis, investigation, data curation and writing—original draft preparation, Y.Y.; writing—review and editing and funding acquisition, F.X.; project administration, M.Z.; visualization, S.Y.; supervision, Y.L. All authors have read and agreed to the published version of the manuscript.

Funding

This work was supported by the National Natural Science Foundation of China (No. 52276018), the China Postdoctoral Science Foundation (Nos. 2021T140538, 2020M673391), the National Key R&D (No. 2020YFB1506205), and the Beijing Municipal Science and Technology Commission (No. Z221100000222029).

Data Availability Statement

Data is contained within the article. The data presented in this study are available in Design and Optimization of the Insulation Performance of a 4000 m3 Liquid Hydrogen Spherical Tank.

Conflicts of Interest

The authors declare no conflict of interest.

Nomenclature

LH2Liquid hydrogen
VCSVapor-cooled shield
LN2CSLiquid-nitrogen-cooled shield
CSCooled shield
HV-MLIHigh-vacuum multilayer insulation
VDMLIVariable density multilayer insulation
HGMsHollow glass microspheres
H2Hydrogen
LO2Liquid oxygen
LN2Liquid nitrogen
No VCSWithout VCS
P-VCSParallel VCS
S-VCSSeries VCS
MLIMultilayer insulation

References

  1. Wu, Q.L.; Li, C.X. Economy-environment-energy benefit analysis for green hydrogen based integrated energy system operation under carbon trading with a robust optimization model. J. Energy Storage 2022, 55, 105560. [Google Scholar] [CrossRef]
  2. Buffi, M.; Prussi, M.; Scarlat, N. Energy and environmental assessment of hydrogen from biomass sources: Challenges and perspectives. Biomass Bioenergy 2022, 165, 106556. [Google Scholar] [CrossRef]
  3. Yang, W. Structural Statics and Dynamics Analysis of Large Vacuum Powder Insulation Cryogenic Spherical Tank; Lanzhou University of Technology: Lanzhou, China, 2021. [Google Scholar]
  4. Domashenko, A.; Golovchenko, A.; Gorbatsky, Y. Production, storage and transportation of liquid hydrogen. Experience of infrastructure development and operation. Int. J. Hydrogen Energy 2002, 27, 753–755. [Google Scholar] [CrossRef]
  5. Krenn, A.G. Diagnosis of a poorly performing liquid hydrogen bulk storage sphere. In Proceedings of the Transactions of the Cryogenic Engineering Conference (CEC), American Institute of Physics, Spokane, WA, USA, 13–17 June 2011; Volume 57. [Google Scholar]
  6. Chen, C.K. Development of LH2 Storage Tank for Liquid Hydrogen Transport Tank Wagon; Harbin Institute of Technology: Harbin, China, 2014; pp. 26–34. [Google Scholar]
  7. Wang, F. Structural Design of Large Liquid Hydrogen Storage Tank; Southeast University: Nan Jing, China, 2006; pp. 21–28. [Google Scholar]
  8. Liu, Z.; Li, Y.Z.; Zhou, G. Study on thermal stratification in liquid hydrogen tank under different gravity levels. Int. J. Hydrogen Energy 2018, 43, 9369–9378. [Google Scholar] [CrossRef]
  9. Rong, Y. Application of new thermal insulation materials in thick oil injection steam pipeline insulation. Mater Rep. 2020, 34, 5. [Google Scholar]
  10. Deng, B.C.; Yang, S.Q.; Xie, X.J.; Wang, Y.; Pan, W.; Li, Q.; Gong, L. Thermal performance assessment of cryogenic transfer line with support and multilayer insulation for cryogenic fluid. Appl. Energy 2019, 250, 895–903. [Google Scholar] [CrossRef]
  11. Monkam, L.K.; von Schweinitz, A.G.; Friedrichs, J.; Gao, X. Feasibility analysis of a new thermal insulation concept of cryogenic fuel tanks for hydrogen fuel cell powered commercial aircraft. Int. J. Hydrogen Energy 2022, 47, 31395–31408. [Google Scholar] [CrossRef]
  12. Joseph, J.; Agrawal, G.; Agarwal, D.K.; Pisharady, J.C.; Kumar, S.S. Effect of insulation thickness on pressure evolution and thermal stratification in a cryogenic tank. Appl. Therm. Eng. 2017, 111, 1629–1639. [Google Scholar] [CrossRef]
  13. Peterson, P. The Heat-Tight Vessel; University of Lund, Office of Naval Intelligence Translation: Lund, Sweden, 1953. [Google Scholar]
  14. Yu, Y.; Zhu, M.; Chen, S.P.; Gu, C.L.; Zhang, B.; Huang, Y.W. Study on the behavior of hydrogen removal materials to maintain high vacuum in high vacuum multilayer insulation equipment. Mater Rep. 2021, 35, 5. [Google Scholar]
  15. Martin, J.J.; Hastings, L. Large-Scale Liquid Hydrogen Testing of a Variable Density Multilayer Insulation with a Foam Substrate; Marshall Space Flight Center: Huntsville, AL, USA, 2001. [Google Scholar]
  16. Bapat, S.L.; Narayankhedkar, K.G.; Lukose, T.P. Experimental Investigation of Multilayer Insulation. Cryogenics 1990, 30, 711–719. [Google Scholar] [CrossRef]
  17. Sun, P.J.; Wu, J.Y.; Zhang, P.; Jiang, M.L.; Xu, L. Experimental study of the effect of gas heat transfer on the thermal performance of multilayer insulation. Cryog. Supercond. 2008, 11, 6–12. [Google Scholar]
  18. Li, F.J. Research on the Thermal Insulation Performance of Composite Multilayer Materials; Zhejiang University: Hangzhou, China, 2017. [Google Scholar]
  19. Ratnakar, R.R.; Sun, Z.; Balakotaiah, V. Effective Thermal Conductivity of Insulation Materials for Cryogenic LH2 Storage Tanks: A review. Int. J. Hydrogen Energy 2023, 48, 7770–7793. [Google Scholar] [CrossRef]
  20. Wang, B.; Luo, R.Y.; Chen, H.; Zheng, C.; Gao, Y.; Wang, H.; Hashmi, A.R.; Zhao, Q.; Gan, Z. Characterization and Monitoring of Vacuum Pressure of Tank Containers with Multilayer Insulation for Cryogenic Clean Fuels Storage and Transportation. Appl. Therm. Eng. 2021, 187, 116569. [Google Scholar] [CrossRef]
  21. Zheng, J.P.; Chen, L.B.; Wang, J.J.; Zhou, Y.; Wang, J. Thermodynamic modelling and optimization of self-evaporation vapor cooled shield for liquid hydrogen storage tank. Energy Convers. Manag. 2019, 184, 74–82. [Google Scholar] [CrossRef]
  22. Jiang, W.B.; Zuo, Z.Q.; Sun, P.J.; Li, P.; Huang, Y. Thermal analysis of coupled vapor-cooling-shield insulation for liquid hydrogen-oxygen pair storage. Int. J. Hydrogen Energy 2022, 12, 47. [Google Scholar] [CrossRef]
  23. Jiang, W.B.; Sun, P.J.; Li, P.; Zuo, Z.; Huang, Y. Transient thermal behavior of multi-layer insulation coupled with vapor cooled shield used for liquid hydrogen storage tank. Energy 2021, 231, 120859. [Google Scholar] [CrossRef]
  24. Jiang, W.B.; Zuo, Z.Q.; Huang, Y.H.; Wang, B.; Sun, P.; Li, P. Coupling optimization of composite insulation and vapor-cooled shield for on-orbit cryogenic storage tank. Cryogenics 2018, 96, 90–98. [Google Scholar] [CrossRef]
  25. Zheng, J.P.; Chen, L.B.; Xu, X.F.; Guo, L.; Zhou, Y.; Wang, J. A novel insulation system based on active cooling without power input for liquid hydrogen storage. Energy 2019, 182, 1–10. [Google Scholar] [CrossRef]
  26. Yang, Y.L.; Jiang, W.B.; Huang, Y.H. Experiment on transient thermodynamic behavior of a cryogenic storage tank protected by a composite insulation structure. Energy 2023, 270, 126929. [Google Scholar] [CrossRef]
  27. Zheng, J.P.; Chen, L.B.; Wang, J.J.; Xi, X.; Zhu, H.; Zhou, Y.; Wang, J. Thermodynamic analysis and comparison of four insulation schemes for liquid hydrogen storage tank. Energy Convers. Manag. 2019, 186, 526–534. [Google Scholar] [CrossRef]
  28. De Blasio, C. Preliminary Concepts. In Fundamentals of Biofuels Engineering and Technology; Green Energy and Technology; Springer: Cham, Switzerland, 2019; pp. 337–340. [Google Scholar]
  29. Niu, W.C.; Lin, Y.L.; Ju, Y.A. The daily evaporation rate test and conversion method for a new independent type B LNG mock-up tank. Cryogenics 2020, 111, 103168. [Google Scholar] [CrossRef]
  30. McIntosh, G.E. Layer by Layer MLI Calculation Using a Separated Mode Equation. Adv. Cryog. Eng. 1994, 39, 1683–1690. [Google Scholar]
  31. Tao, W.Q. Numerical Heat Transfer, 2nd ed.; Xi’an Jiaotong University Press: Xi’an, China, 2005. [Google Scholar]
  32. Zheng, J.P. Experimental Study on Ground Simulation of Composite Adiabatic System for Liquid Oxygen Storage; University of Chinese Academy of Sciences: Beijing, China, 2016. [Google Scholar]
  33. Fesmire, J.E. Standardization in Cryogenic Insulation Systems Testing and Performance Data. Phys. Procedia 2015, 67, 1089–1097. [Google Scholar] [CrossRef] [Green Version]
  34. Allen, M.S.; Baumgartner, R.G.; Fesmire, J.E.; Augustynowicz, S.D. Advances in microsphere insulation systems. Conf. Proc. 2004, 710, 619. [Google Scholar]
  35. Wang, P.; Liao, B.; An, Z.G.; Yan, K.; Zhang, J. Measurement and calculation of cryogenic thermal conductivity of HGMs. Int. J. Heat Mass Transf. 2018, 129, 591–598. [Google Scholar] [CrossRef]
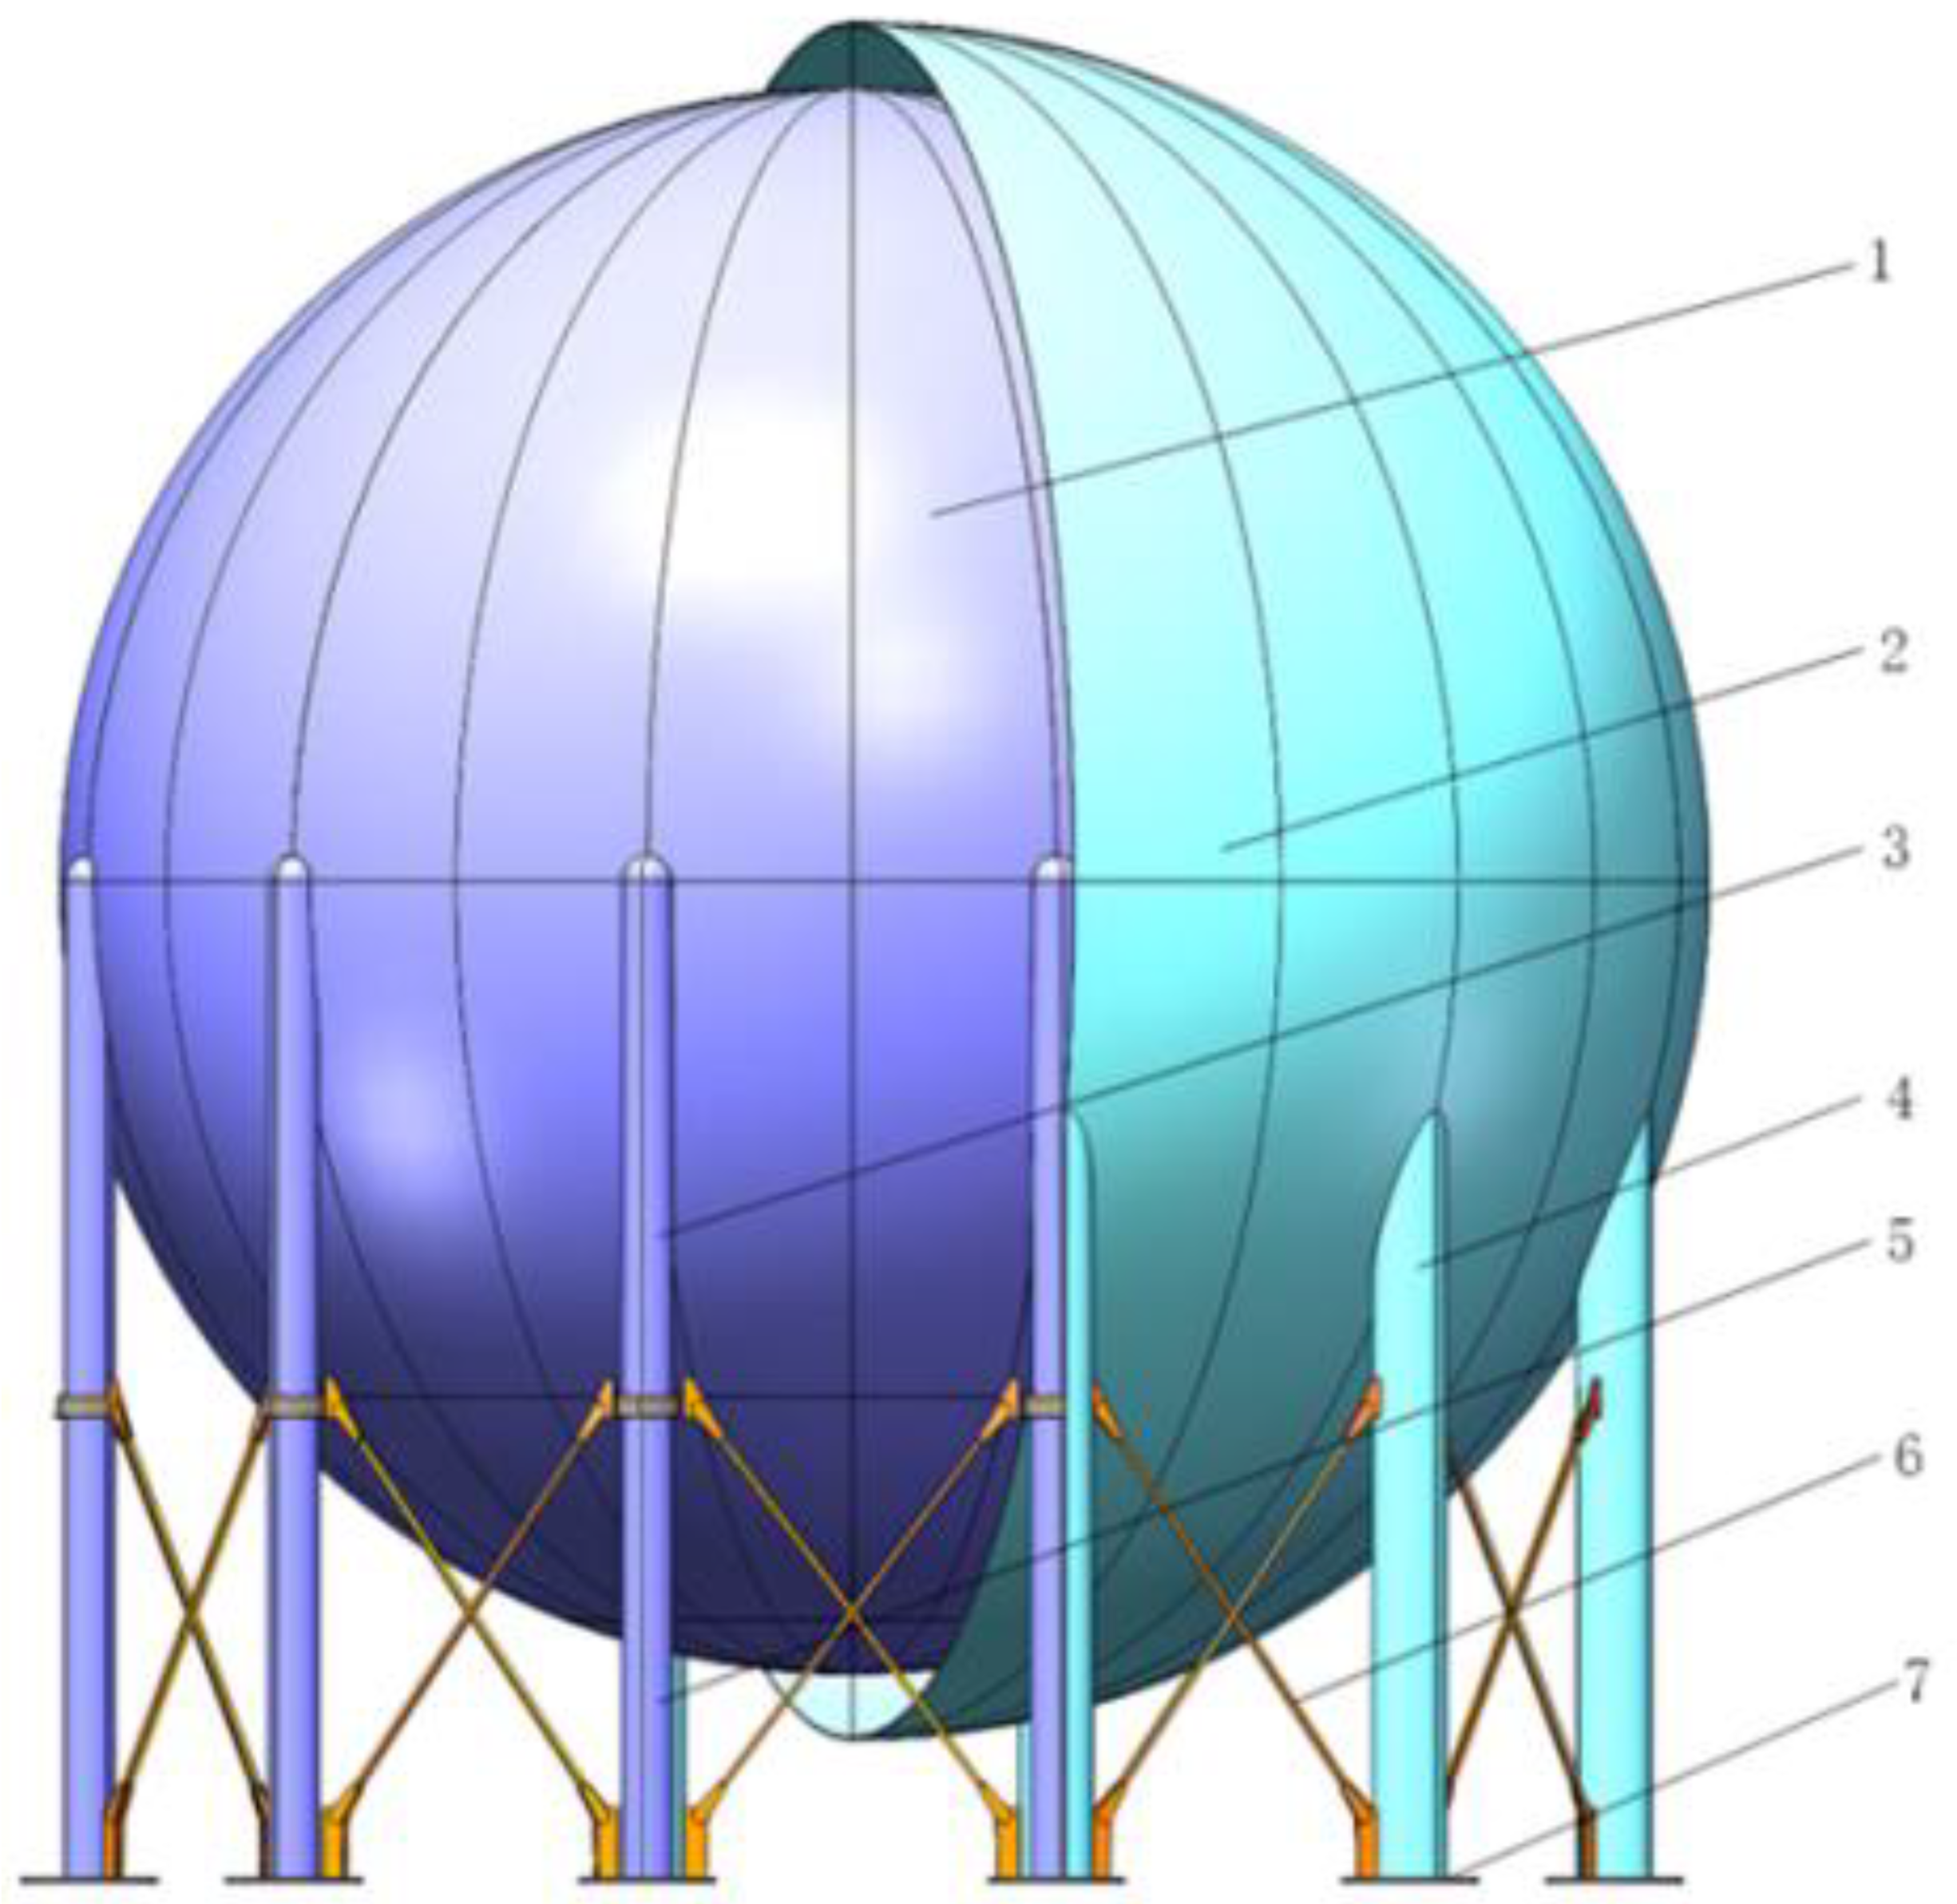
Figure 1. Physical model of a 4000 m3 LH2 spherical tank. 1. Inner tank; 2. Outer tank; 3. Inner upper strut; 4. Outer upper strut; 5. Inner lower strut; 6. Pull rod; 7. Pedestal.
Processes 11 01778 g001
Figure 2. Schematic of MLI scheme.
Processes 11 01778 g002
Figure 3. Schematic of HGMs insulation scheme.
Processes 11 01778 g003
Figure 4. Schematic of single VCS insulation scheme.
Processes 11 01778 g004
Figure 5. Schematic of double VCSs insulation scheme.
Processes 11 01778 g005
Figure 6. Schematic of LN2CS insulation scheme.
Processes 11 01778 g006
Figure 7. Schematic of MLI interlayer thermal resistance.
Processes 11 01778 g007
Figure 8. Flowchart of program calculation.
Processes 11 01778 g008
Figure 9. Procedure flowchart of calculation of VCS.
Processes 11 01778 g009
Figure 10. Comparison between present numerical results and previous experimental data.
Processes 11 01778 g010
Figure 11. Daily evaporation rate vs. vacuum degree.
Processes 11 01778 g011
Figure 12. Heat transfer ratio vs. layer position of MLI.
Processes 11 01778 g012
Figure 13. Heat leakage and cost vs. number of layers of MLI.
Processes 11 01778 g013
Figure 14. Effect of ambient temperature on heat leakage and evaporation rate of LH2.
Processes 11 01778 g014
Figure 15. Schematic of MLI performance vs. VCS position: (a) change trend in heat leakage vs. VCS position; (b) temperature variation vs. VCS position.
Processes 11 01778 g015
Figure 16. Comparison of the P-VCSs of heat leakage and interlayer temperature profile: (a) MLI interlayer temperature profile; (b) Heat leakage vs. VCSs position.
Processes 11 01778 g016
Figure 17. Heat leakage and MLI interlayer temperature distribution of S-VCSs: (a) Heat leakage vs. S-VCSs position; (b) MLI interlayer temperature profile vs. S-VCSs position.
Processes 11 01778 g017
Figure 18. Liquid nitrogen consumption and liquid hydrogen daily evaporation rate vs. LN2 CS position.
Processes 11 01778 g018
Figure 19. Heat absorption of LN2CS l and temperature profile vs. LN2CS position: (a) heat leakage vs. n LN2 CS position; (b) temperature profile of MLI vs. LN2CS position.
Processes 11 01778 g019
Table 1. The installation position effect of LN2CS on heat leakage.
LN2CS Position (Layer)Heat Leakage (W)Daily Evaporation Rate (%)Absorbed Heat /WLN2 Consumption (m3/day)
1368.732.79 × 10−3−105.70
574.215.62 × 10−4212.280.114
846.643.53 × 10−4260.370.140
1037.452.84 × 10−4284.950.154
1525.201.91 × 10−4343.350.185
2019.071.44 × 10−4410.00.221
2515.401.17 × 10−4500.780.270
3013.311.01 × 10−4168.420.091
3511.778.91 × 10−5848.770.457
4010.578.01 × 10−51280.350.690
459.617.28 × 10−52572.421.39
498.976.79 × 10−512,902.916.95
Disclaimer/Publisher’s Note: The statements, opinions and data contained in all publications are solely those of the individual author(s) and contributor(s) and not of MDPI and/or the editor(s). MDPI and/or the editor(s) disclaim responsibility for any injury to people or property resulting from any ideas, methods, instructions or products referred to in the content.