Article

The Influence of Interlayer on the Development of Steam Chamber in Steam Stimulation during Heavy Oil Recovery

1
CNOOC Research Institute Co., Ltd., Beijing 100028, China
2
School of Petroleum Engineering, Yangtze University, Wuhan 430100, China
*
Author to whom correspondence should be addressed.
Processes 2023, 11(6), 1742; https://doi.org/10.3390/pr11061742
Submission received: 6 May 2023 / Revised: 1 June 2023 / Accepted: 2 June 2023 / Published: 7 June 2023

Abstract

:
Cyclic steam stimulation is an effective thermal recovery method for heavy oil recovery. The key potential mechanism is the growth of the steam chamber after steam injection. Taking the LD5X heavy oil reservoir as an example, besides the interlayer developed in this area, the top water and bottom water distribute above and below the interlayer. These factors may have adverse effects on the development of the steam chamber, thus affecting the final heavy oil exploitation. In this work, our goal is to study the effects of interlayer permeability and well–interlayer distance on CSS performance (in the presence of top and bottom water). We developed a high-temperature-resistant interlayer. Based on the simulated interlayer, the field scale model was converted into a laboratory element model through the similarity criterion. In order to quantitatively evaluate the performance of steam stimulation, a thermal detector was used to measure the dynamic growth of the steam chamber and record the production data. The experimental results show that the self-made interlayer has high-temperature resistance, adjustable permeability, and little difference between the physical parameters and the target interlayer. During the cyclic steam stimulation process, the steam chamber presents two different stages in the presence of the top water area, namely the normal production stage and the top water discharge stage. The bottom water has little effect on the growth of the steam chamber. The small interlayer permeability, the increase in horizontal well–interlayer distance, and the existence of the interlayer will delay the top water leakage during steam stimulation. This study has reference significance for us to develop heavy oil resources with a top water barrier when implementing steam stimulation technology.

1. Introduction

In recent years, with the reduction in conventional oil and the continuous expansion of oil demand, heavy oil reservoirs have gradually become the focus of research [1,2,3]. Because of its high viscosity, conventional nonthermal technology cannot produce the oil efficiently and economically [4,5]. At present, the most effective mining method is steam injection [6,7,8,9,10]. Steam injection technology can be divided into three categories: steam flooding, cyclic steam stimulation (CSS), and steam-assisted gravity drainage (SAGD).
As an effective means of thermal recovery, CSS has been widely concerned. In the construction, a certain amount of steam is injected into the oil well first, and the well is shut down for a period of time. After the thermal energy of the steam diffuses to the oil layer, the well is opened for production to exploit heavy oil [11]. Compared with other displacement methods, CSS can be operated directly in production wells. CSS operation technology is low in difficulty and controllable and can achieve rapid production increase and high return on investment.
During the past decades, several scholars have carried out a series of studies on various aspects of the interlayer for the heavy oil thermal recovery process, mainly including the study of the physical properties of the interlayer, the location of the interlayer, and the interaction between the interlayer and steam movement. As early as 1992, Yang et al. [12] used a phenolic resin partition to simulate the interlayer and used a visual two-dimensional physical model to study the effect of interlayer length (short horizontal interlayer and long horizontal interlayer) on the development effect under two conditions of steam injection at the top and bottom of the reservoir. In 2001, based on the actual production test data in the UTF project in Canada, Y. Ito et al. [13] studied the influence of interlayers on the development of steam chambers by numerical simulation. Pooladi-Darvish and Matta (2002) [14] used two-dimensional numerical simulation to study the influence of interlayer continuity on SAGD production in top gas and top water reservoirs in the Alberta area. The effects of four distribution modes of the closed interlayer, partially closed interlayer, homogeneous interlayer, and connected interlayer were investigated, respectively. IPEK et al. (2008) and Chen et al. (2008) [15,16] used the sequential indicator simulation method (SISIM) to establish a reservoir model of sporadic interlayers, and on this basis, the influence of interlayers on SAGD recovery was analyzed. In addition, there are many scholars [17,18,19,20,21] who studied the effects of interlayer length, volume, continuity, and distribution on SAGD development by numerical simulation.
In recent years, Xia et al. [22] established a numerical model based on the reservoir parameters of the Long Lake oilfield, studied the influence mechanism of interlayer on heat and mass transfer, and summarized the influence of interlayer location, size, porosity, permeability, and thermal conductivity on development effect. Based on the field parameters of the Long Lake reservoir, Huang et al. [23] studied the development of a steam chamber and the distribution of remaining oil under different interlayer numbers and different interlayer distribution modes by combining physical simulation and numerical simulation. Zhang et al. [24] analyzed the influence mechanism of the interlayer on heavy oil recovery from two aspects of steam migration velocity and thermal conductivity through mechanical theory and concluded that the interlayer is beneficial to heavy oil recovery. The results were verified by numerical simulation. Wei et al. [25] used a 3D physical model to study the effect of different interlayer areas (quarter-length coverage and half-length coverage) on the expansion of the steam chamber. Zhang et al. [26] used cement to simulate a breccia interlayer and studied the influence of the breccia interlayer on steam chamber expansion and development effect in the SAGD production process by using a three-dimensional physical model. On this basis, an indoor numerical model was established to analyze the influence of the thickness and permeability of the breccia interlayer on the development effect.
Although many scholars have studied the influence of the barrier layer, most of them focus on the development of SAGD and steam flooding. At the same time, the simulation of the interlayer mostly uses a phenolic resin separator, cement, organic glass, etc. [23], which cannot accurately simulate an interlayer. With the development of the LD5X oilfield, logging analysis and core experiments show that interlayers are widely distributed in oil sand reservoirs. In addition, top water and bottom water are distributed above and below the reservoir. Once water invasion occurs, recovery will be seriously affected [27,28,29,30]. However, the research on CSS production performance and steam chamber characteristics considering the interlayer in top water heavy oil reservoirs is still limited. Therefore, an understanding of the influence mechanism of the interlayer on CSS performance and a quantitative analysis of its influence is urgently needed.
In order to study the role of the interlayer in the process of steam stimulation, this paper takes the LDX oilfield as the research object, develops a high-temperature-resistant resin to simulate the interlayer, and investigates the temperature resistance of resin and the influencing factors of simulated interlayer performance. Then, five groups of three-dimensional physical simulation experiments were designed to evaluate the effects of different interlayer types and horizontal well positions on the development of the steam chamber.

2. Materials and Methods

2.1. Interlayer Preparation

2.1.1. Experimental Purpose

In order to accurately simulate the physical properties of the actual interlayer, the author draws on the idea of resin sand fixation, hoping to prepare a simulated interlayer with high-temperature resistance, adjustable permeability, and certain strength. The difference between the steam sealing ability of the interlayer and the actual interlayer was determined by a one-dimensional breakthrough experiment.

2.1.2. Experimental Drugs and Instruments

The reagents and materials used to prepare simulated interlayers are as follows: modified epoxy resin (laboratory-made), quartz sand (20~2000 mesh), 1-cyanoethyl-2-phenyl-4,5-bis (cyanoethoxymethylene) imidazole (analytical purity), 2-phenyl-4-methyl-5-hydroxymethyl imidazole (analytical purity), n-butyl glycidyl ether (industrial grade), toluene glycidyl ether (industrial grade), styrene oxide (industrial grade), modified nano-core silicone rubber (industrial grade), acrylic rubber (industrial grade), polypropylene glycol (analytical purity), and Methyl-5-norbornene-2,3-dicarboxylic anhydride (industrial grade).
The one-dimensional high-temperature steam breakthrough physical simulation experiment device is shown in Figure 1. It mainly consists of four parts: sand-packing model, injection unit, data acquisition unit, and production unit. The sand-packing model is 30 cm in inner length and 2.5 cm in inner diameter. The injection unit includes ISCO pump, steam generator, etc. The data acquisition unit can record temperature and pressure differences. The production unit includes volumetric cylinders and back pressure device, which can measure the production rate of oil and water from the outlet of core holder.

2.1.3. Experimental Method

(1) Curing time test of resin
The viscosity of high-temperature resistant resin in the curing process was measured by Bolfe DV2 T viscometer. The time corresponding to the viscosity mutation point was the curing time of the resin.
(2) Compressive strength test
The base liquid of the prepared heat-resistant resin is put into a pressure flask and placed in a 50 °C water bath. After the thermostable resin was cured, the standard sample of φ25 × 30 mm was prepared. The compressive strength of the resin was measured by universal mechanical pressure test machine.
(3) Preparation of simulated interlayer
① The mass ratio and particle size of quartz sand, gravel, and clay-simulating interlayer were determined according to the physical parameters, lithologic parameters, and particle size distribution of reservoir interlayer, and the quartz sand mixture was obtained by mixing them. ② The quartz sand mixture was wetted with ethanol, and then the resin was added to the surface, and the mixture was stirred evenly to obtain the resin quartz sand mixture system. ③ The resin quartz sand mixture was added to the physical model, and the hydraulic press was used to impose pressure on the axial direction for compaction. The pressure was removed after the resin was solidified, and the simulated interlayer was obtained.
(4) Displacement experiment
① The sand-filling model was made with quartz sand and resin. ② The device was connected, the leak detection test was carried out, and then the experimental system was heated to the initial temperature. ③ Formation water was injected into the core to measure porosity and permeability. ④ Heavy oil was injected into the core to displace formation water until no water production. ⑤ Steam was injected into the core to displace heavy oil. When the steam broke through and reached steady displacement, the experiment was stopped, and the breakthrough pressure was recorded.

2.2. D High-Pressure Physical Simulation Experiment of Top Water Breaking through Sandy Conglomerate Interlayer

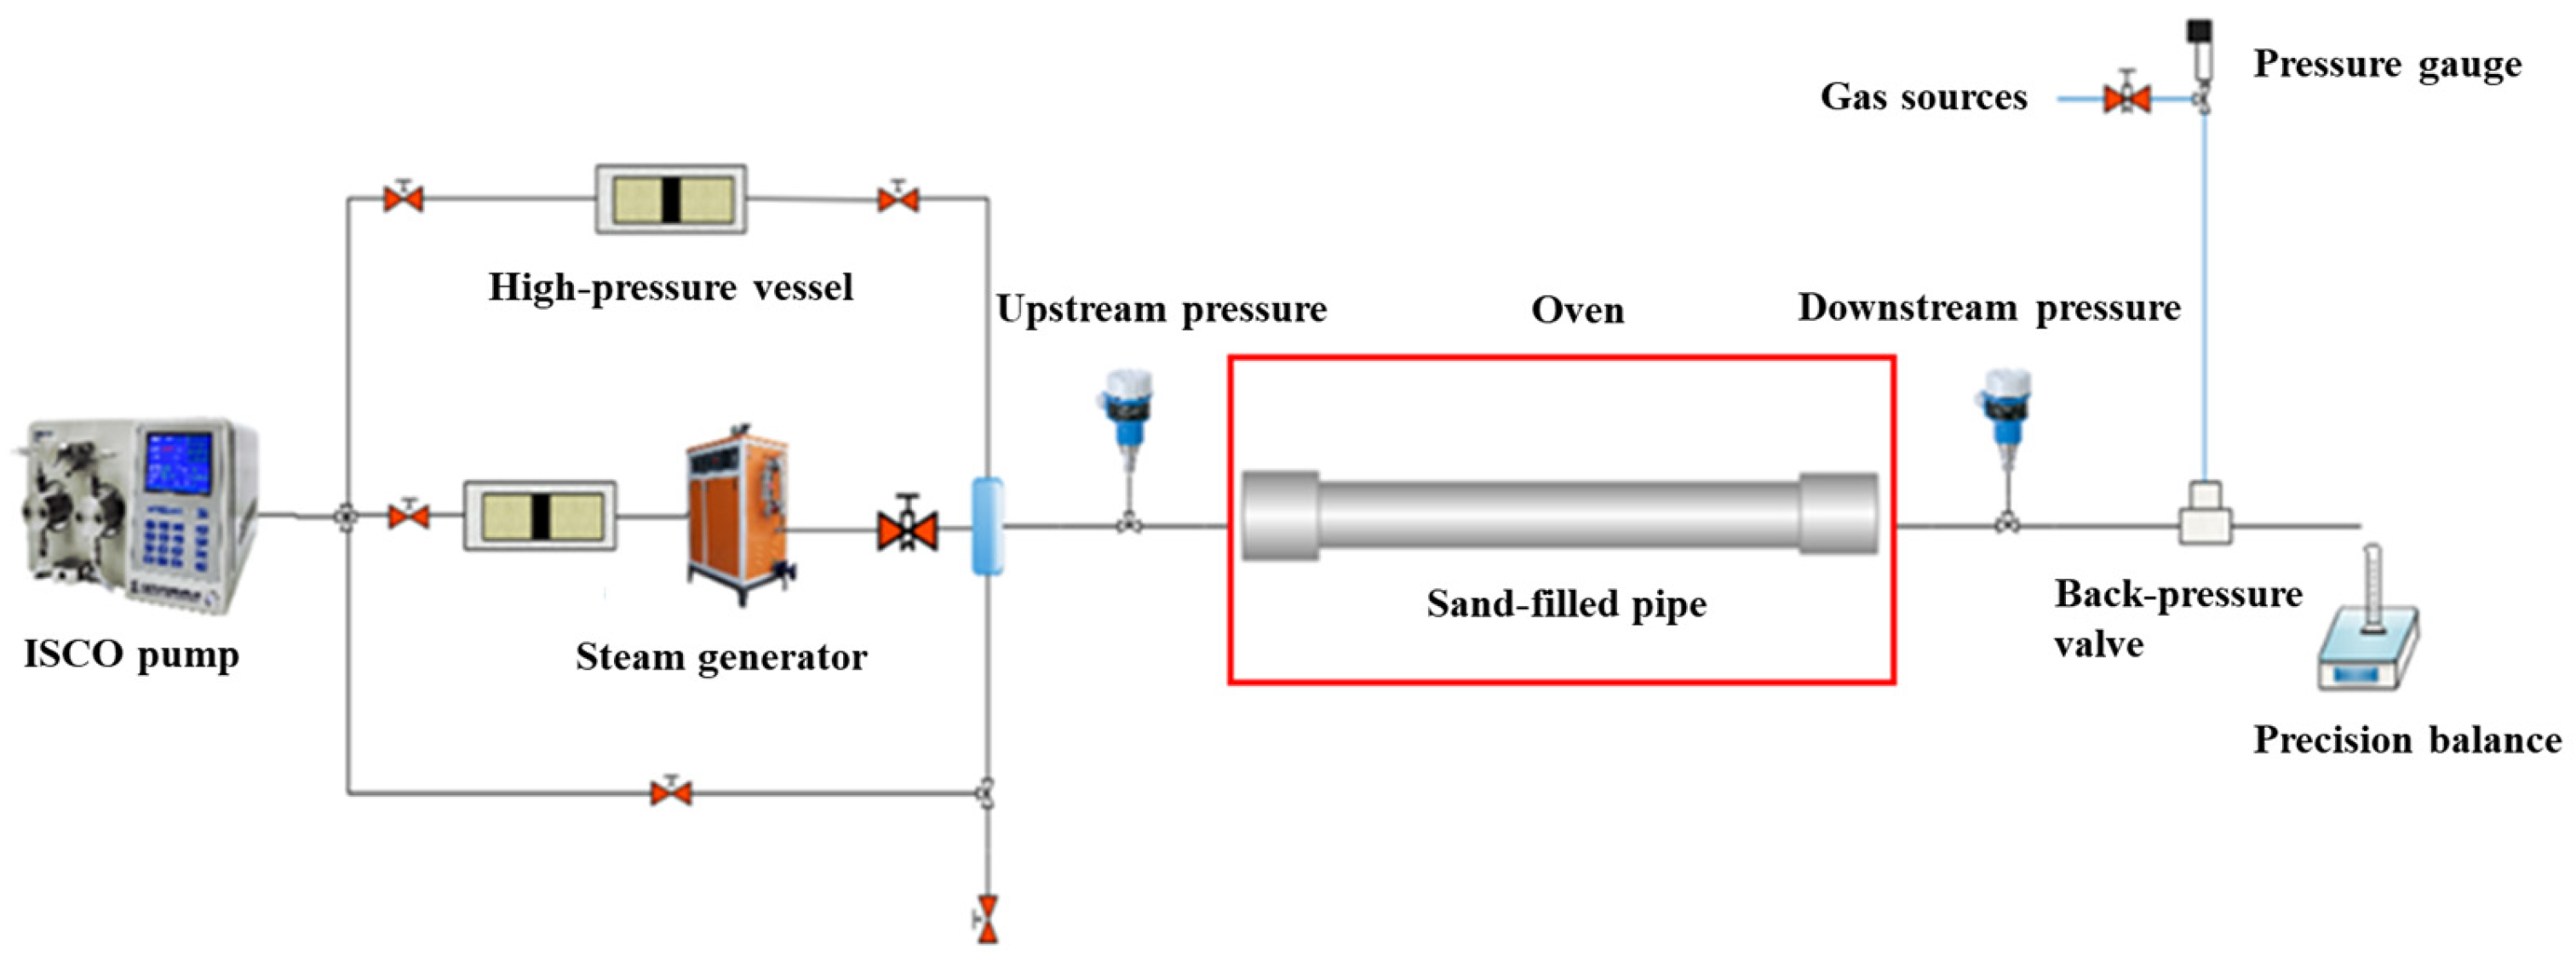
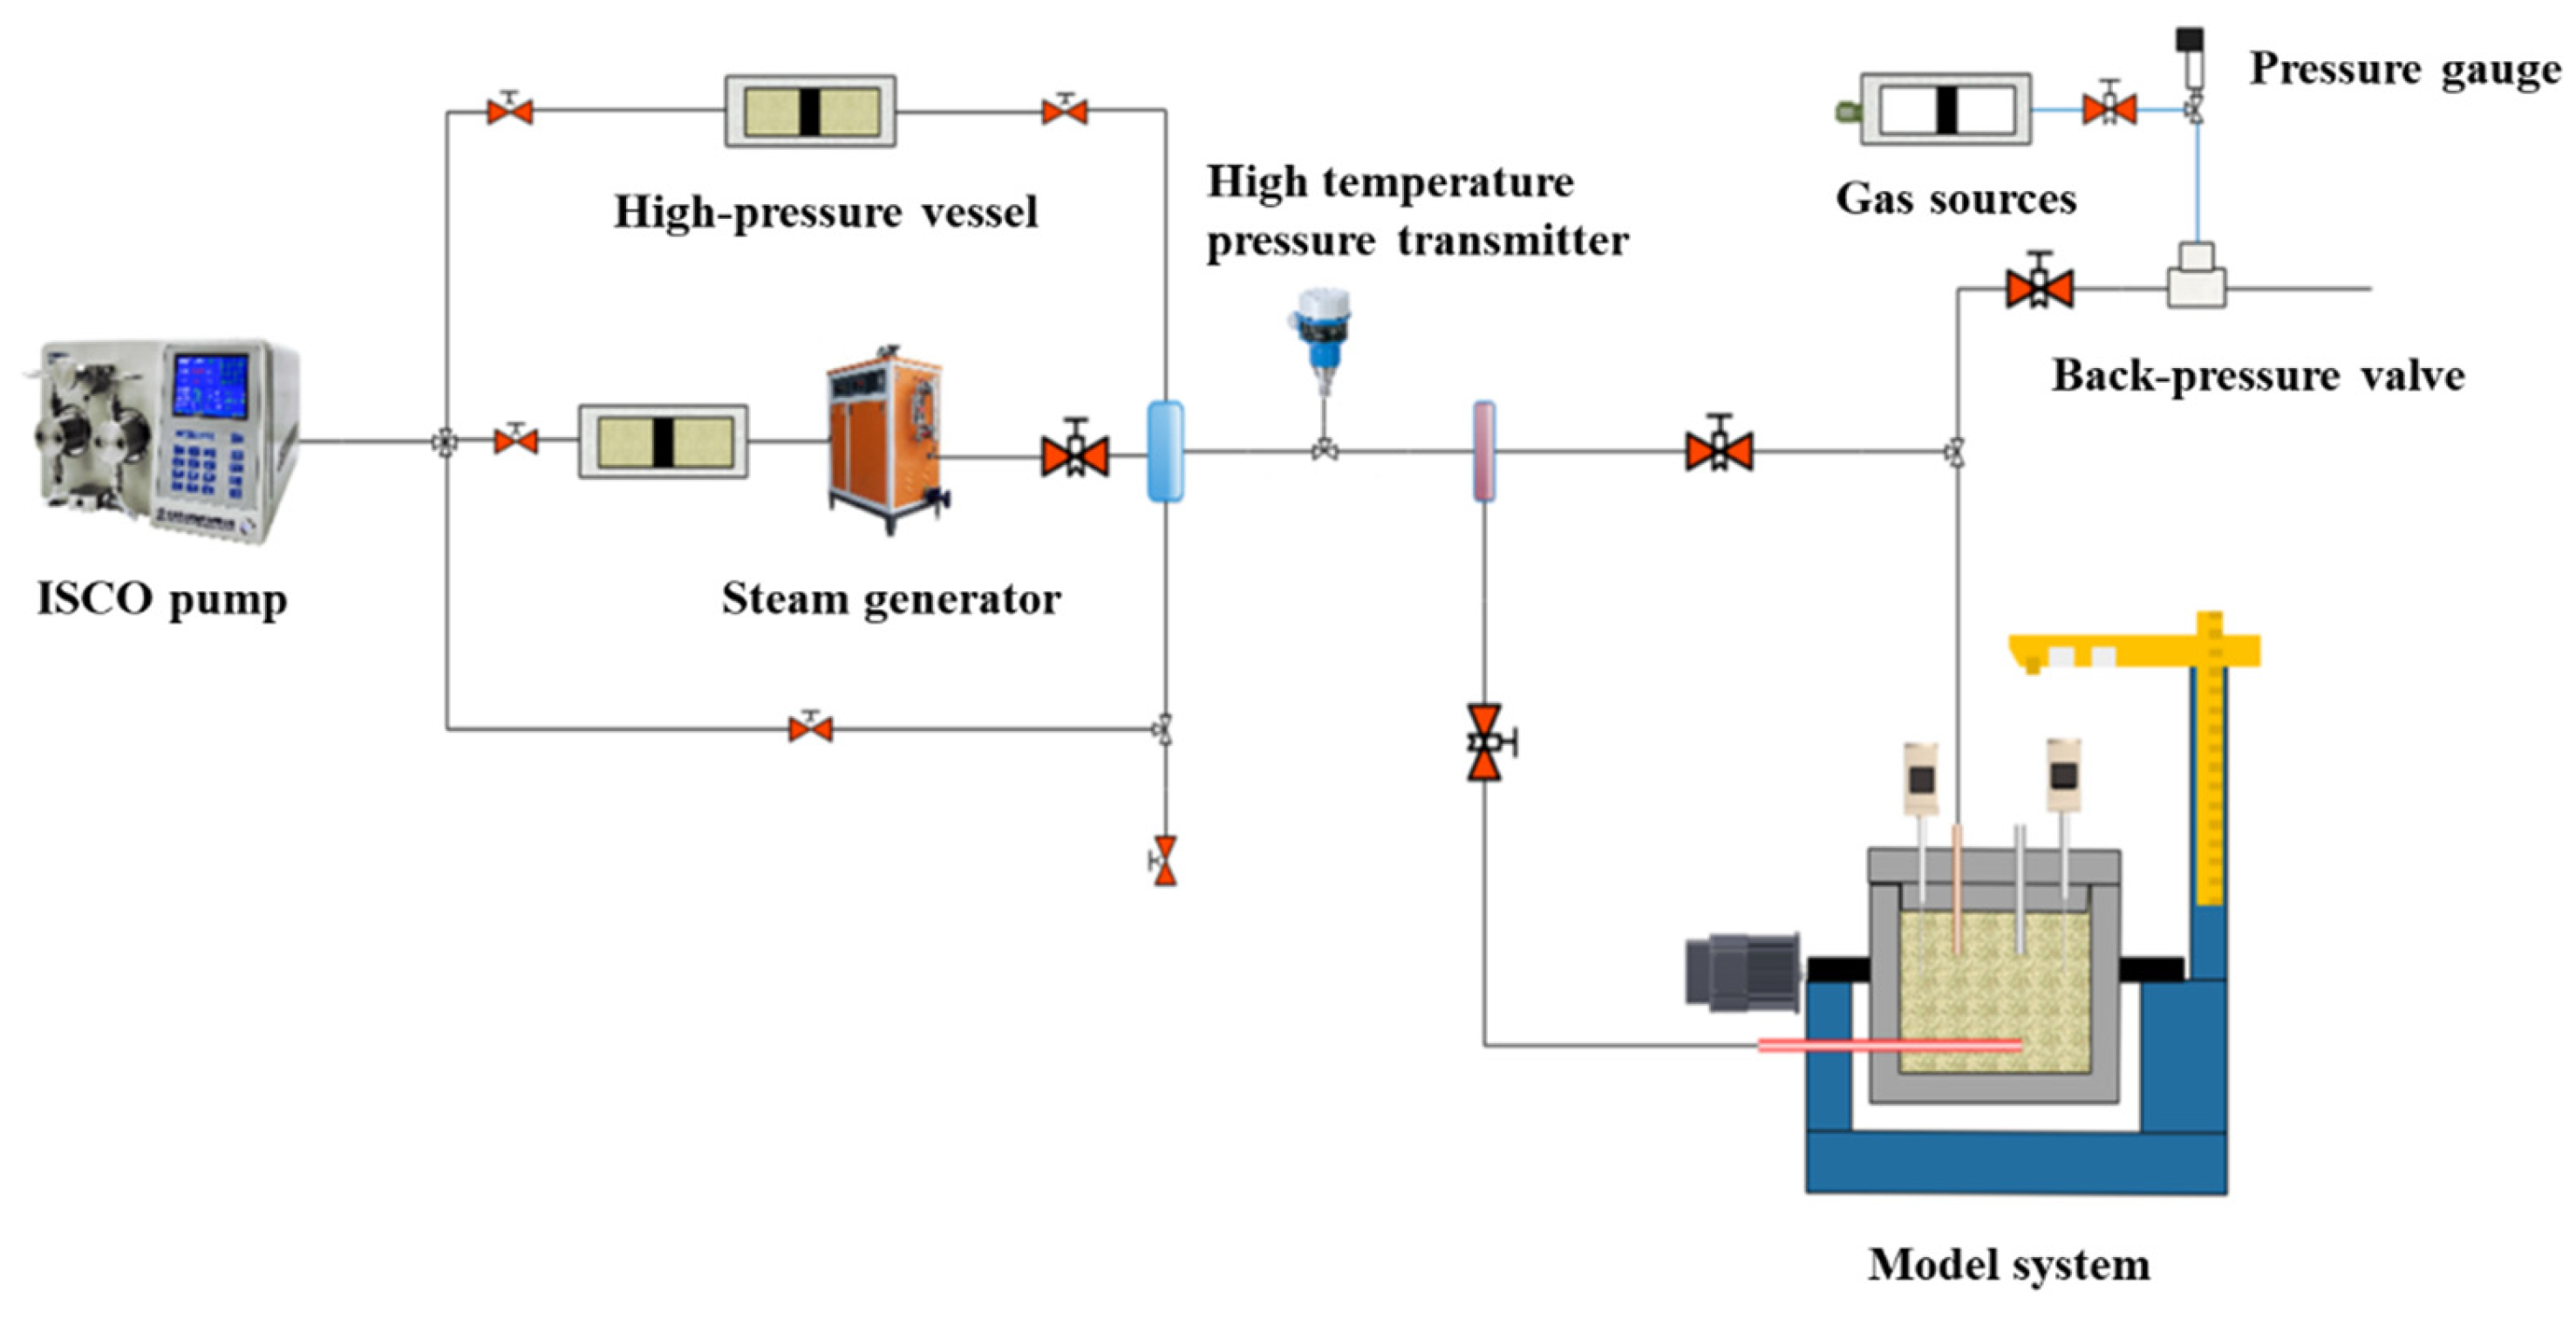
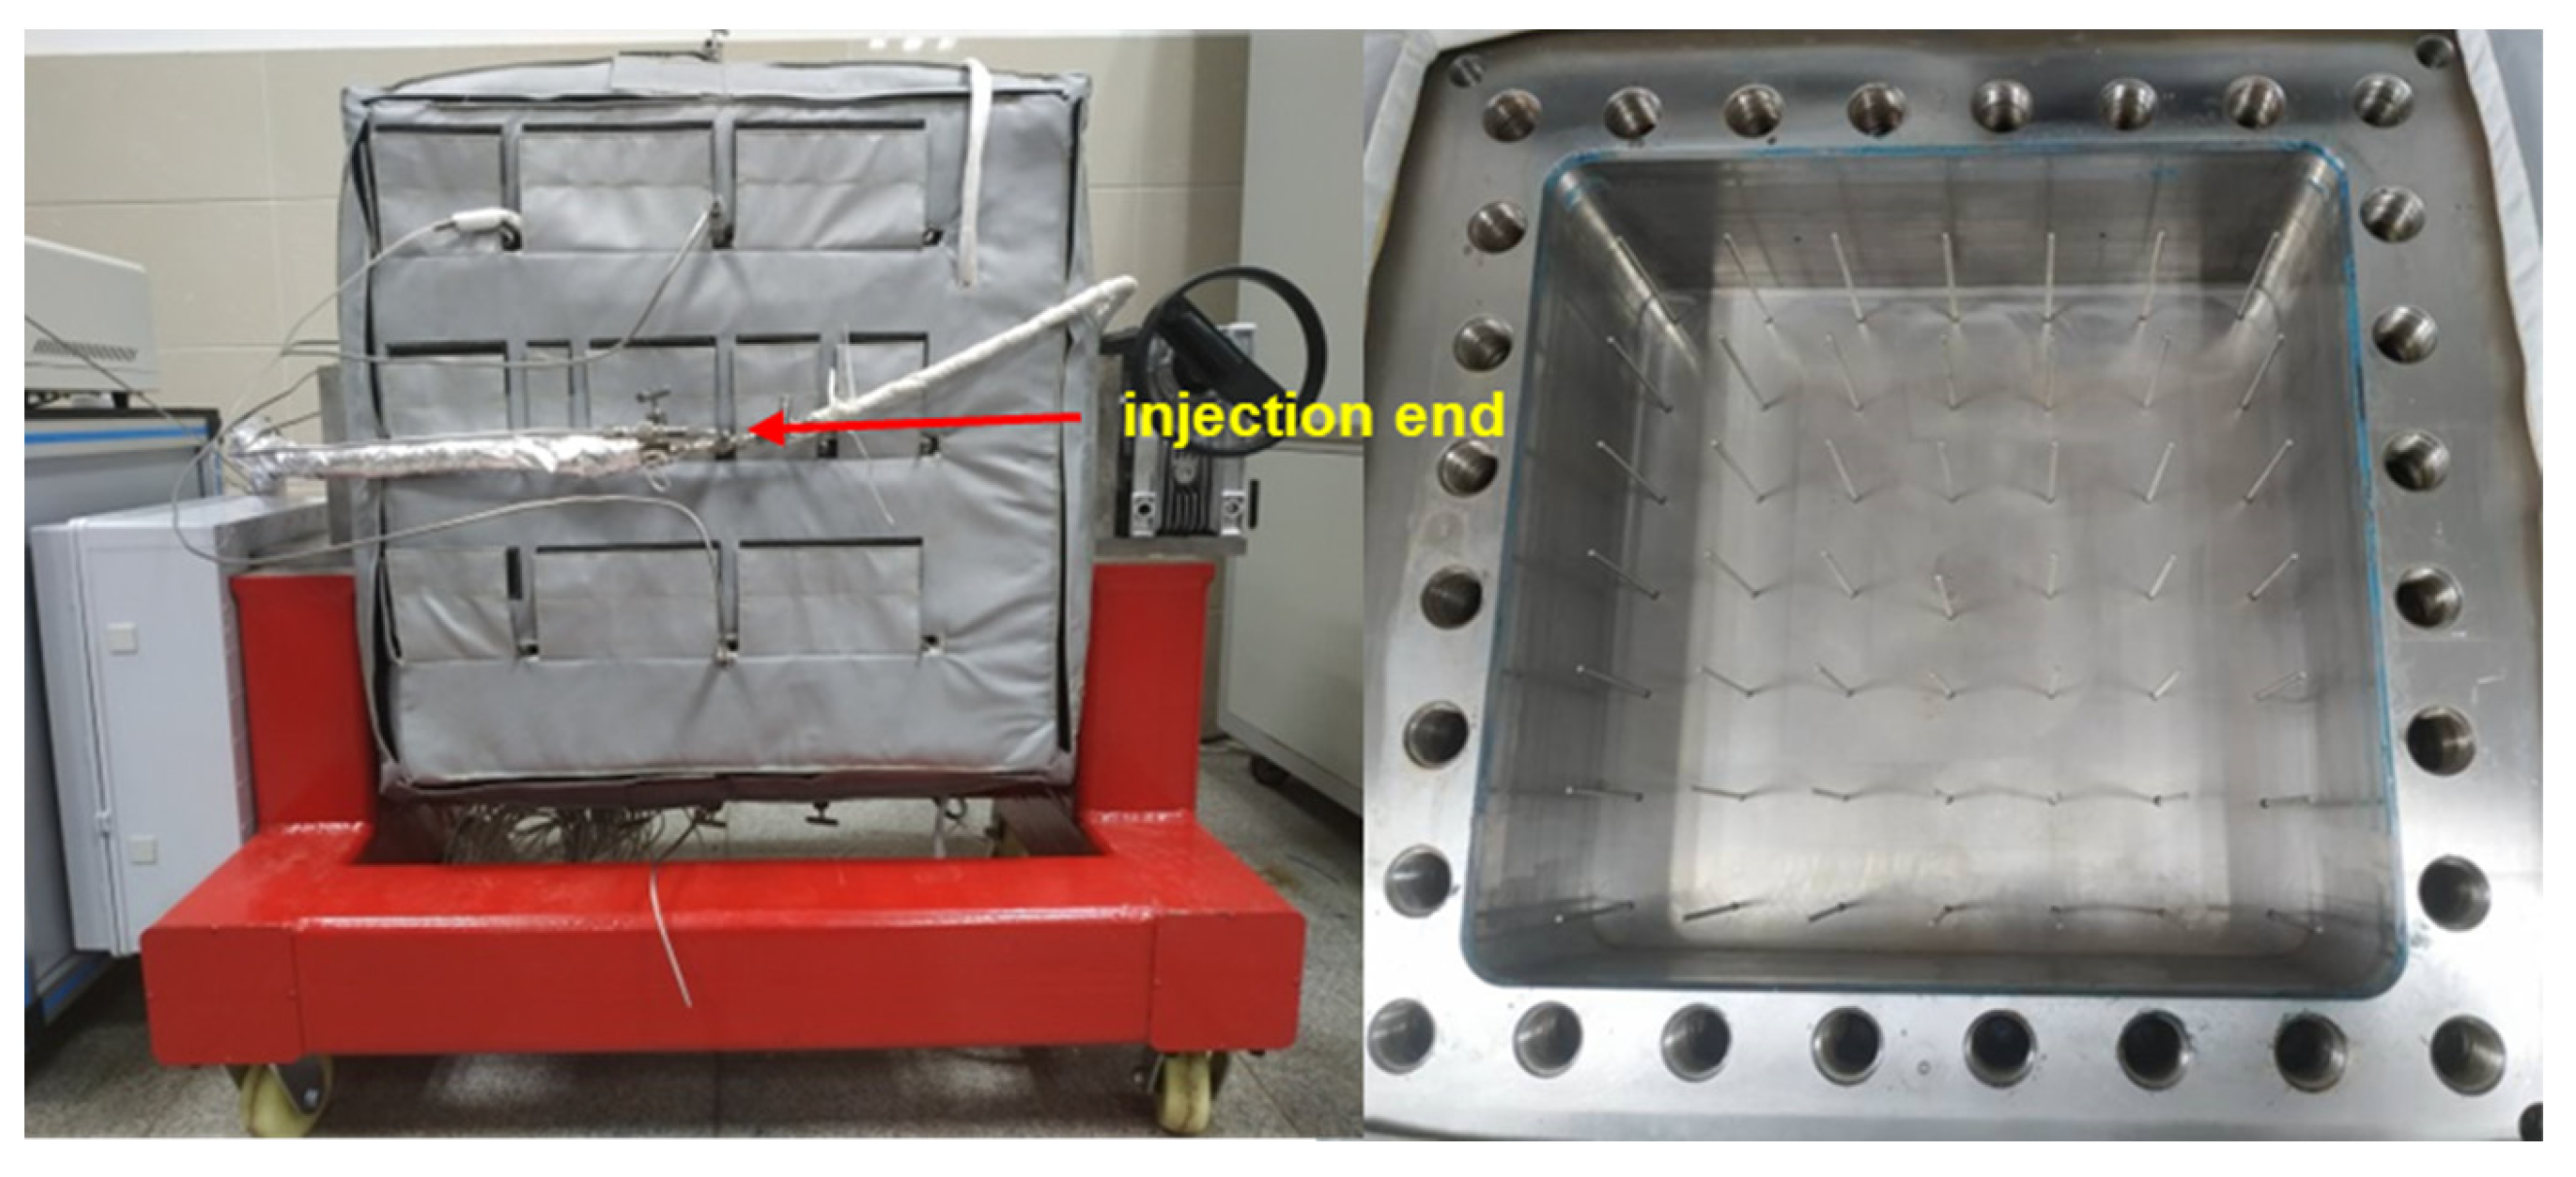
2.2.1. Experiment Equipment

The apparatus of 3D physical simulation is shown in Figure 2. It consists of five parts, including injection unit, 3D model, production unit, data acquisition unit, and auxiliary unit. The injection system includes constant speed constant pressure pump, steam generator, intermediate container, etc. The production unit is mainly composed of volumetric cylinders and control valves. The data acquisition unit mainly includes pressure sensors, temperature sensors, data transducers, and computer. The auxiliary unit mainly includes heating jacket, lifting device, and rotating device. The 3D model is shown in Figure 3. The length, width, and depth of the internal chamber are 50 cm, 50 cm, and 15 cm, respectively. The upper limit of experimental pressure and temperature are 10 MPa and 300 °C, respectively.

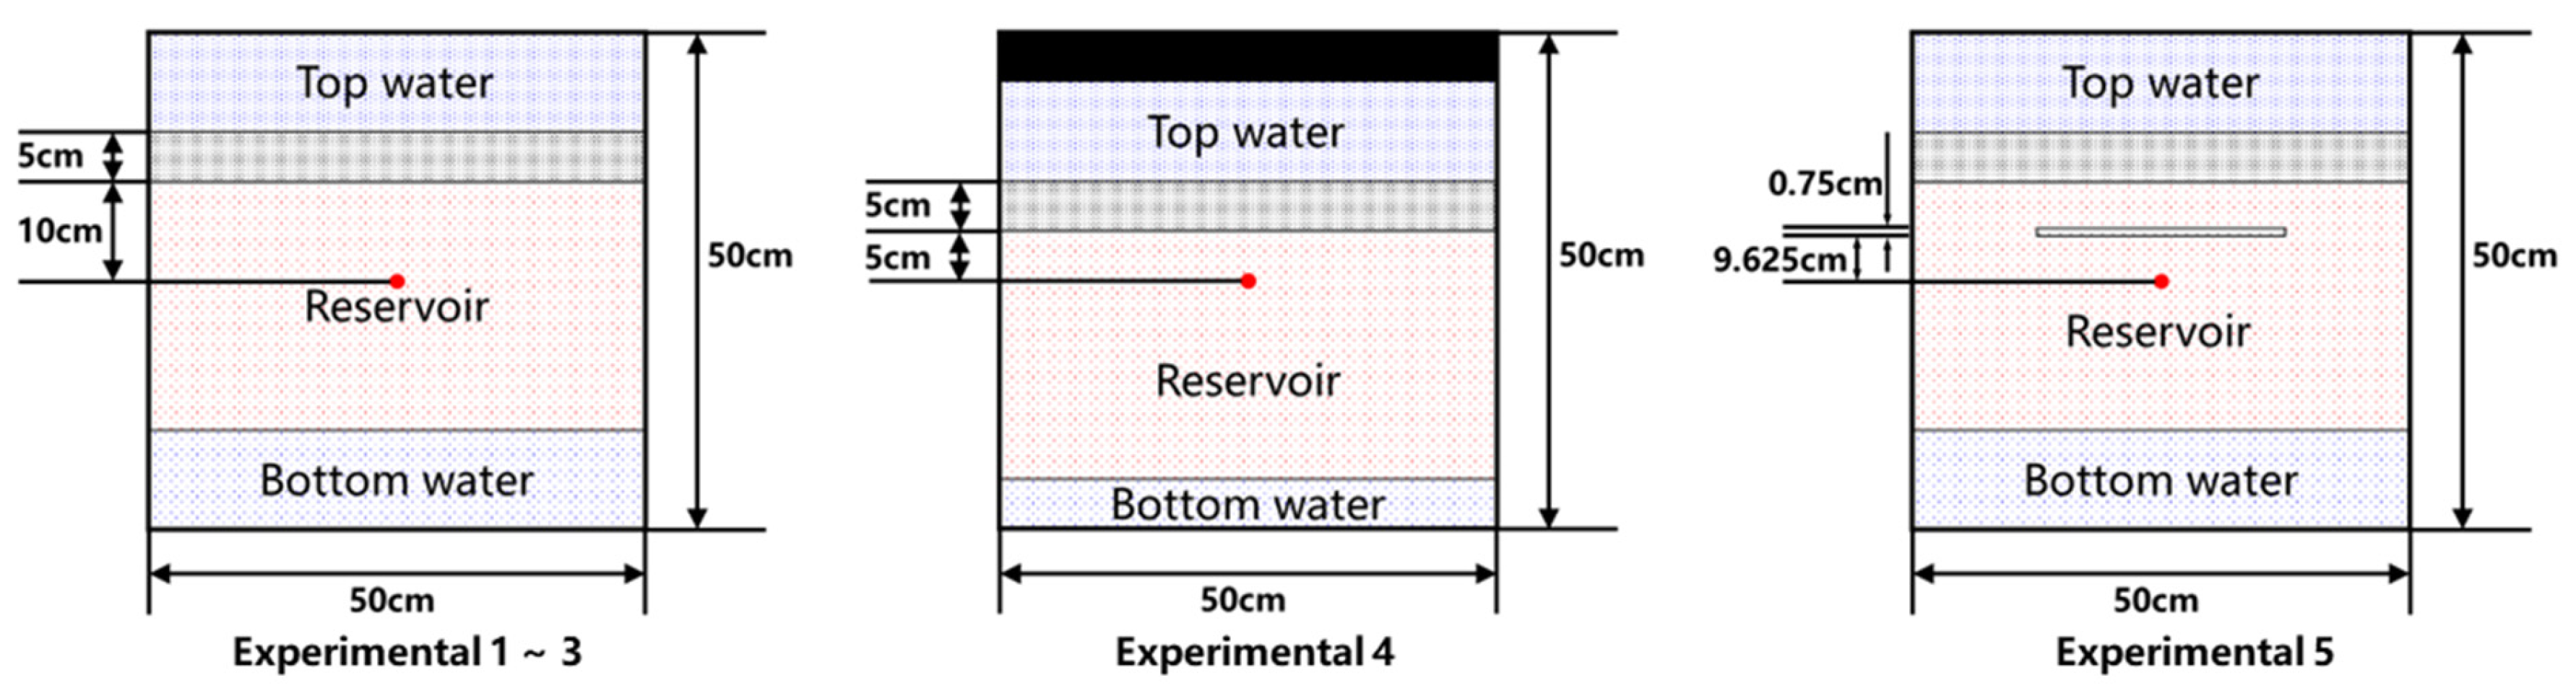
2.2.2. Experimental Design and Parameters

According to the similarity criterion of steam stimulation, the corresponding parameters can be transformed from the actual reservoir into a 3D model to study the effects of different experimental methods [31]. There are five dimensionless numbers for the similarity criteria used in the calculation experiment. The formula and physical meaning are shown in Table 1.
It is assumed that the thermal physical properties of quartz sand used in the laboratory are the same as those of the rock under reservoir conditions, and the operating temperature and pressure are also consistent with the field. According to the parameters of the actual reservoir, the size of the 3D model, and Table 1, we can obtain the following experimental parameters as listed in Table 2.
Five groups of 3D physical simulation experiments were designed by the single-factor experiment method to investigate the effects of interlayer permeability, horizontal well–interlayer distance, and Sandwich layer length on the steam chamber and production effect during CSS development. The experimental parameters are shown in Table 3, and the experimental model is shown in Figure 4.

2.2.3. Experimental Method

(1) Experiment preparation. Prepare quartz sands according to the experimental designs; test the properties of crude oil such as viscosity and density before experiments; check all temperature sensors and pressure sensors and then measure their accuracy.
(2) Model filling. The model is placed flat, and the clapboard is placed at the corresponding position. The water-wet quartz sand, resin quartz sand mixture, and oil sand are filled, respectively, to simulate the top/bottom water, interlayer, and oil layer. After the filling is completed, the clapboard is removed to erect the model.
(3) Pressure testing. Shut all valves in experimental system. Inject N2 of high pressure to test sealing performance of the total experimental system.
(4) Model heating. The model heating device is turned on, and the temperature is set to 45 °C for 2 days until the interlayer is solidified and the temperature difference of each temperature measurement point inside the model does not exceed 3 °C.
(5) Steam debugging. Adjust steam flux, steam temperature, and steam quality to meet the experimental designs. Inject steam into the horizontal wells after the steam parameters are stable.
(6) Back-pressure controlling. Install the back-pressure devices at the production end of the horizontal well. Use the larger diameter pipelines or valves for production unit to decrease flow resistance of heavy oil during experiments to prevent heavy oil from blocking the pipeline.
(7) Experiment operating. The steam stimulation experiment was carried out by using the designed injection–production parameters. During the experiment, the data of each temperature measuring point were monitored in real time, and the rates of liquid, oil, and water were measured to analyze the production performance.

3. Results and Discussion

3.1. Interlayer Fabrication

3.1.1. Screening of High-Temperature Resistant Resin Components

In order to prepare the resin system with 350 °C resistance, the components were determined as the epoxy resin base fluid, curing agent, diluent, and toughening agent. The epoxy resin-based solution is a self-made modified epoxy resin. According to literature research and market research, the materials of the curing agent, diluent, and toughening agent are shown in Table 4. Since there are no three factors and three levels in the conventional orthogonal table, the method of considering the equal number of levels is used to find the orthogonal table with the least number of test cases and slightly larger factor than 3, the four-factor three-level orthogonal table (i.e., L9 (34)), and the fourth factor is deleted. The orthogonal experiment table is shown in Table 5.
From Table 5, it can be seen that RB > RA > RC; that is, the type of diluent has the greatest influence on the viscosity of the resin system. Taking the viscosity of the resin system as the evaluation standard, the optimal composition is A1B1C2. For the curing time of the resin system, RA > RC > RB, that is, the type of curing agent has the greatest influence on the curing time of the resin system. Taking the curing time of resin as the evaluation standard, the optimal composition is A1B2C1. For the compressive strength of the resin system after curing, RC > RB > RA; that is, the toughening agent has the greatest influence on the compressive strength of the resin system after curing. Taking compressive strength as the evaluation standard, the optimal composition is A2B1C2. Considering the compressive strength, curing time, and viscosity of the base solution, the final optimal system composition is A1B1C2.

3.1.2. Selection of High-Temperature Resistant Resin Dosage

The components of the high-temperature resistant resin were determined as modified epoxy resin, 1-cyanoethyl-2-phenyl-4,5-bis (cyanoethoxymethylene) imidazole, toluene glycidyl ether, and modified nano core silicone rubber. The amount of each component was further determined by the orthogonal experiment. The orthogonal experiment table is shown in Table 6.
From Table 7, it can be seen that RB > RA > RC; that is, the dosage has the greatest influence on the viscosity of the resin system. Taking the viscosity of the resin system as the evaluation standard, the optimal dosage is A1B3C2. For the curing time of the resin system, RA > RC > RB; that is, the dosage of the curing agent has the greatest influence on the curing time of the resin system. Taking the curing time of resin as the evaluation standard, the optimal dosage is A3B1C1. For the compressive strength of the resin system after curing, RC > RB > RA; that is, the amount of toughening agent has the greatest influence on the compressive strength of the resin system after curing. Taking the compressive strength of resin as the evaluation standard, the optimal dosage is A1B1C3. Considering the compressive strength, curing time, base solution viscosity, and economic type, the optimal dosage composition was A3B2C2, 45% modified epoxy resin, 35% 1-cyanoethyl-2-phenyl-4,5-bis (cyanoethoxymethylene) imidazole, 10% toluene-based glycidyl ether, and 10% modified nano-core silicone rubber. The viscosity of the resin prepared with this formula was lower than 100 mPa·s, the curing time at 50 °C was 4.5 h, and the compressive strength was 29.36 MPa.

3.1.3. Performance Evaluation

The experimental results (Figure 5) show that the resin still has high compressive strength and mass retention after aging for a long time at high temperatures. With the increase in temperature and aging time, the compressive strength and mass retention rate decrease, but the decrease is small. After aging at 350 °C for 120 days, the compressive strength is still higher than 20 Mpa, and the mass retention rate is more than 90%, indicating that the resin has good temperature resistance, and the temperature resistance can reach 350 °C.
In the production process of the interlayer, the amount of epoxy resin had a great influence on its compressive strength and permeability. Under the pressure of 10 Mpa, the relationship between the compressive strength, permeability, and the amount of high-temperature resistant resin is simulated, as shown in Figure 6. With the increase in resin content, the permeability of the simulated interlayer decreases significantly, while the compressive strength increases significantly. However, when the resin content reaches 30 g, the increase in the compressive strength of the simulated interlayer by increasing the resin content is not obvious, which may be because the adsorption of the resin on the quartz sand surface is close to saturation.
The research shows that controlling the permeability of the simulated interlayer by quartz sand particle size has great advantages. When the quartz sand particle size is the same, the simulated interlayer has a similar pore structure and permeability. The influence of the quartz sand particle size on the performance of the simulated interlayer is shown in Figure 7. The larger the particle size of quartz sand is, the lower the compressive strength of the simulated interlayer is, and the permeability of the simulated interlayer increases with the increase in the particle size of the quartz sand.
As shown in Table 8, the maximum relative error of the simulated interlayer permeability is 7.47%, and the relative error of the breakthrough pressure gradient is 4.12%. It shows that the permeability of the simulated interlayer is similar to that of the actual interlayer, and its sealing performance for high-temperature steam is roughly the same. It provides strong support for the preparation of the interlayer in the three-dimensional high-temperature and high-pressure physical simulation experiment.

3.2. 3D Physical Simulation

3.2.1. Temperature Distribution

(1) Effect of interlayer permeability
The temperature field distribution under different interlayer permeability conditions is shown in Figure 8, Figure 9 and Figure 10. Figure 8 is the temperature field variation diagram of the steam recycling experimental model under an 800 mD interlayer. It can be seen from Figure 8 that when the permeability of the interlayer is 800 mD, the expansion of the steam chamber can be divided into three stages: preheating rise period, interlayer influence period, and breakthrough period [32]. The first CSS cycle is the preheating period. At this time, the overall temperature of the reservoir is low, the steam heating range is mainly concentrated near the wellbore, and the shape of the steam chamber is like a circle. The second CSS cycle is the rising period. Due to the overlapping effect of steam, the steam chamber develops rapidly in the longitudinal direction, and the steam sweep range gradually expands. At the end of the second CSS cycle, the steam expands to the interlayer position. The third CSS cycle is the interlayer influence period. When the steam expands to the interlayer position, the lateral expansion speed becomes faster, and the longitudinal expansion speed becomes slower. The fourth CSS cycle began to enter the breakthrough period. Due to the poor sealing performance of the interlayer with a permeability of 800 mD, the steam directly broke through the interlayer and entered the top water layer. In the subsequent huff and puff cycle, the steam continued to expand vertically from the breakthrough through the interlayer, developed in strips, and gradually reached the top of the model.
When the interlayer permeability decreases to 200 mD and 50 mD, the expansion of the steam chamber is similar to the model with a regular interlayer permeability of 800 mD. It can also be divided into three stages: preheating rising period, interlayer influence period, and breakthrough period, but the number of CSS cycles in different periods is different. For the model with an interlayer permeability of 200 mD, the first and second CSS cycles are the preheating rise period, the third and fourth CSS cycles are the interlayer influence period, and the fifth to eighth CSS cycles are the breakthrough period. For the model with an interlayer permeability of 50 mD, the further decrease in interlayer permeability leads to the enhancement of sealing capacity and the delay of the steam breakthrough period. The first and second CSS cycles are the preheating rising period, the third to fifth CSS cycles are the interlayer influence period, and the sixth to eighth CSS cycles are the breakthrough period. Comparing the temperature field diagrams under different interlayer permeability conditions, it can be seen that the lower the interlayer permeability, the longer the interlayer influence period and the later the steam breakthrough period.
(2) Effect of Horizontal well location
Figure 11 is the temperature field diagram of the horizontal well to the interlayer distance of 5 cm (the distance becomes 1/2 of the original). According to the change in temperature field, the development of the steam chamber can be roughly divided into three stages: preheating period, interlayer influence period, and breakthrough period. The first CSS cycle is the preheating period. Due to the close distance between the horizontal well and the interlayer, the steam has expanded to the interlayer position at the end of the cycle. The second CSS cycle is the interlayer influence period, and the third CSS cycle enters the breakthrough period. Compared with experiment 2, the decrease in the distance between the horizontal well and the interlayer makes the time the steam takes to reach the interlayer shorter and accelerates the breakthrough of steam. The steam breakthrough time is advanced from the fifth cycle to the third cycle.
(3) Effect of Sandwich layer
Figure 12 is the temperature field diagram at the end of different CSS cycle steam injections under the condition that the interlayer length is 25 cm (experiment 5). It can be seen from the figure that the development of the steam chamber can be roughly divided into four stages: preheating period, sandwich layer influence/rising period, interlayer influence period, and breakthrough period, among which the sandwich layer influence period is its unique stage. The first cycle is the preheating period; the second cycle and the third cycle are the sandwich layer influence period. At this stage, the blocking steam chamber of the sandwich layer does not expand vertically to the interlayer position but begins to develop horizontally. Then, some steam begins to expand upwards around the sandwich layer, and the crude oil above the sandwich layer is also heated by steam. The fourth and fifth cycles are the rising period. At this stage, the steam breaks through the sandwich layer and continues to develop upward to the interlayer position. The sixth cycle enters the breakthrough period, and the high-temperature steam breaks through the barrier and enters the top water layer. However, due to the barrier of the sandwich layer, the steam under the sandwich layer still expands horizontally. In the seventh and eighth cycles, the steam chamber develops from the breakthrough position through the barrier to the top water layer, and finally, the steam chamber is pear-shaped.

3.2.2. Production Performance

In Figure 13, some of the production indicators in experiments 1–5 are compared, including the oil production per cycle and the recovery factor. Comparing the production performance under different permeability interlayer conditions (experiment 1, experiment 2, and experiment 3), it can be seen that the oil production per cycle of different experiments increases first and then decreases, and the recovery rate increases first and then tends to be gentle [33,34]. However, due to the different sealing abilities of the interlayer, the final recovery rate is different, and the time and rate of decline of the peak oil production are also different. The model with an 800 mD interlayer has the largest decline and the lowest recovery rate, while the model with a 50 mD interlayer has the lowest decline rate and the largest recovery rate. The oil production per cycle of experiment 1 peaked in the third cycle. In the fourth cycle, due to the breakthrough of top water, the oil production per cycle decreased sharply, and the final recovery rate was 2.36% [35]. The oil production per cycle of experiment 2 reached its peak in the fourth cycle. In the fifth cycle, due to the top water breakthrough, the oil production per cycle decreased, the recovery rate tended to be gentle, and the final recovery rate was 3.66%. The interlayer sealing ability of experiment 3 is the strongest. Although the oil production per cycle also reaches the peak in the fourth cycle, the subsequent oil production per cycle decreases slowly, and the final recovery rate is 6.28%. For experiment 3, although the steam broke through the interlayer in the sixth cycle, the top water did not break through until the eighth cycle due to the small permeability of the interlayer. After the fourth cycle, due to the decrease in oil saturation near the production well and the large specific heat capacity of water, the increase in water content will cause the heat to be injected into more and more steam absorbed by water, so the oil production per cycle begins to decrease.
When the distance from the horizontal well to the interlayer decreases (experiment 4), the recovery and oil production per cycle is at a low level. In the first cycle, due to the low initial temperature of the reservoir, the steam sweep range is small, so the periodic oil production is low. In the second and third cycles, due to the short distance between the horizontal well and the interlayer, the steam chamber is extended to the interlayer position. Although the steam-swept area increases, most of the heat is absorbed by the top water layer, and the flowable crude oil is still less, so the oil production per cycle is further reduced. In the fourth cycle, the steam breaks through the interlayer, and the top of the top water layer leaks underwater. This led to a further decline in oil production per cycle, but the decline was not significant because of the low level of oil production per cycle. At the same time, the rate of increase in recovery is also getting smaller and smaller, and the final recovery is only 1.48%. This shows that when the horizontal well is close to the interlayer, the steam breakthrough time is earlier, the heat loss is larger, the fluidity of crude oil cannot be effectively improved, and the development effect of cyclic steam stimulation is not good.
After adding the sandwich layer (experiment 5), the oil production per cycle reached its peak in the fourth cycle. In the sixth cycle, the oil production per cycle decreased due to the breakthrough of the top water, the recovery rate tended to be gentle, and the final recovery rate was 3.90%. Although the sandwich layer can block the floating of steam and delay the time of top water discharge, the recovery rate of the first four cycles is lower than that of experiment 2 (without the sandwich layer) due to the blocking effect of the sandwich layer. Compared with experiment 2, the final recovery rate increased, but the increase was not large.

4. Conclusions

In the work reported in this paper, in view of the current situation of the LD5X oilfield, we studied a method of making a high-temperature resistant interlayer and carried out five groups of 3D physical simulation experiments based on the simulated interlayer. The main analytical findings are listed below:
1.
A high-temperature-resistant resin for simulating the interlayer of a heavy oil reservoir was prepared. The resin is a low-viscosity liquid at room temperature, the curing time is 4.5 h at 50 °C, and the compressive strength is 29.36 MPa. After aging at 350 °C for 120 days, the compressive strength of the resin is still higher than 20 MPa, and the mass retention rate is more than 90%, which has good high-temperature resistance;
2.
The results of the one-dimensional physical simulation experiment show that the simulated interlayer core and the actual interlayer core have similar sealing ability to steam, which provides a new technology for the physical simulation experiment of heterogeneous heavy oil reservoir;
3.
Under the condition of no interlayer, CSS production can be divided into three stages. The later the breakthrough period, the higher the recovery rate. The existence of an interlayer influence period can delay the breakthrough time of steam and the top water, but also hinder the flow of crude oil;
4.
The interlayer permeability and horizontal well position have a great influence on the production performance. For the top (low) water heavy oil reservoir, the deployment of horizontal wells can be far away from the top water and located below the low permeability interlayer, which is beneficial to improve the recovery rate.

Author Contributions

Data curation, H.F., T.F., L.Z., W.Z., Z.G., H.X. and X.L.; Writing—original draft, J.D.; Writing—review & editing, L.C. All authors have read and agreed to the published version of the manuscript.

Funding

This work was supported by the National Natural Science Foundation of China (No. 52074038).

Data Availability Statement

The data presented in this study are available on request from the Authors.

Conflicts of Interest

The authors declare that they have no known competing financial interests or personal relationships that could have appeared to influence the work reported in this paper.

References

  1. Guo, K.; Li, H.; Yu, Z. In-situ heavy and extra-heavy oil recovery: A review. Fuel 2016, 185, 886–902. [Google Scholar] [CrossRef]
  2. Dong, X.; Liu, H.; Chen, Z.; Wu, K.; Lu, N.; Zhang, Q. Enhanced oil recovery techniques for heavy oil and oilsands reservoirs after steam injection. Appl. Energy 2019, 239, 1190–1211. [Google Scholar] [CrossRef]
  3. Bai, Y.; Cao, Z.; Hu, Y.; Zhao, J.; Zhang, H. Highly thermoconductive biogel for enhancing thermal efficiency and soil self-remediation in heavy oil recovery. J. Clean. Prod. 2023, 398, 136643. [Google Scholar] [CrossRef]
  4. Xue, L.; Liu, P.; Zhang, Y. Development and Research Status of Heavy Oil Enhanced Oil Recovery. Geofluids 2022, 2022, 5015045. [Google Scholar] [CrossRef]
  5. Wang, Q.; Zheng, W.; Liu, J.; Cao, B.; Hao, J.; Lu, X.; Zheng, K.; Cui, L.; Cui, T.; Sun, H. Integration of Profile Control and Thermal Recovery to Enhance Heavy Oil Recovery. Energies 2022, 15, 7346. [Google Scholar] [CrossRef]
  6. Friedmann, F.; Smith, M.E.; Guice, W.R.; Gump, J.M.; Nelson, D.G. Steam-foam mechanistic field trial in the midway-sunset field. SPE Reserv. Eng. 1994, 9, 297–304. [Google Scholar] [CrossRef]
  7. Patzek, T.W. Field applications of steam foam for mobility improvement and profile control. SPE Reserv. Eng. 1996, 11, 79–86. [Google Scholar] [CrossRef]
  8. Gotawala, D.R.; Gates, I.D. Steam fingering at the edge of a steam chamber in a heavy oil reservoir. Can. J. Chem. Eng. 2008, 86, 1011–1022. [Google Scholar] [CrossRef]
  9. Fatemi, S.M. The effect of geometrical properties of reservoir shale barriers on the performance of steam-assisted gravity drainage (SAGD). Energy Sources Part A Recovery Util. Environ. Eff. 2012, 34, 2178–2191. [Google Scholar] [CrossRef]
  10. Lyu, X.; Liu, H.; Pang, Z.; Sun, Z. Visualized study of thermochemistry assisted steam flooding to improve oil recovery in heavy oil reservoir with glass micromodels. Fuel 2018, 218, 118–126. [Google Scholar] [CrossRef]
  11. Hou, J.; Wei, B.; Du, Q.; Wang, J.; Wang, Q.; Zhang, G. Production prediction of cyclic multi-thermal fluid stimulation in a horizontal well. J. Pet. Sci. Eng. 2016, 146, 949–958. [Google Scholar] [CrossRef]
  12. Yang, G.; Butler, R.M. Effects of reservoir heterogeneities on heavy oil recovery by steam-assisted gravity drainage. J. Can. Pet. Technol. 1992, 31, 37–43. [Google Scholar] [CrossRef]
  13. Ito, Y.; Hirata, T.; Ichikawa, M. The growth of the steam chamber during the early period of the UTF Phase B and Hangingstone Phase I projects. J. Can. Pet. Technol. 2001, 40. [Google Scholar] [CrossRef]
  14. Pooladi-Darvish, M.; Mattar, L. SAGD operations in the presence of overlying gas cap and water layer-effect of shale layers. J. Can. Pet. Technol. 2002, 41. [Google Scholar] [CrossRef]
  15. Ipek, G.; Frauenfeld, T.; Yuan, J.Y. Numerical study of shale issues in SAGD. In Proceedings of the Canadian International Petroleum Conference, Calgary, AB, Canada, 17–19 June 2008. OnePetro. [Google Scholar] [CrossRef]
  16. Chen, Q.; Gerritsen, M.G.; Kovscek, A.R. Effects of reservoir heterogeneities on the steam-assisted gravity-drainage process. SPE Reserv. Eval. Eng. 2008, 11, 921–932. [Google Scholar] [CrossRef]
  17. Shin, H.; Choe, J. Shale barrier effects on the SAGD performance. In Proceedings of the SPE/EAGE Reservoir Characterization & Simulation Conference, Abu Dhabi, United Arab Emirates, 19–21 October 2009; Cp-170-00012. EAGE Publications BV: Dubai, United Arab Emirates, 2009. [Google Scholar] [CrossRef]
  18. Le Ravalec, M.; Morlot, C.; Marmier, R.; Foulon, D. Heterogeneity impact on SAGD process performance in mobile heavy oil reservoirs. Oil Gas Sci. Technol.-Rev. IFP 2009, 64, 469–476. [Google Scholar] [CrossRef]
  19. Dang, T.Q.C.; Chen, Z.; Nguyen, T.B.N.; Bae, W.; Mai, C.L. Numerical simulation of SAGD recovery process in presence of shale barriers, thief zones, and fracture system. Pet. Sci. Technol. 2013, 31, 1454–1470. [Google Scholar] [CrossRef]
  20. Dang, C.T.Q.; Nguyen, N.T.B.; Bae, W.; Nguyen, H.X.; Tu, T.N.; Chung, T. Investigation of SAGD recovery process in complex reservoir. In Proceedings of the SPE Asia Pacific Oil and Gas Conference and Exhibition, Brisbane, Australia, 18–20 October 2010. [Google Scholar] [CrossRef]
  21. Zhou, Y.; Xi, C.; Wu, J. Effect of barriers on the SAGD performance result. In Proceedings of the International Petroleum Technology Conference, Beijing, China, 26–28 March 2013. [Google Scholar] [CrossRef]
  22. Xia, Y.; Huang, S.; Chen, X.; Cao, M.; Yang, L. Study on the characteristics of production performance and steam chamber of SAGD considering interlayer. In Proceedings of the SPE International Heavy Oil Conference and Exhibition, Kuwait City, Kuwait, 10–12 December 2018. [Google Scholar] [CrossRef]
  23. Huang, S.; Yang, L.; Xia, Y.; Du, M.; Yang, Y. An experimental and numerical study of a steam chamber and production characteristics of SAGD considering multiple barrier layers. J. Pet. Sci. Eng. 2019, 180, 716–726. [Google Scholar] [CrossRef]
  24. Zhang, L.; Li, J.; Sun, L.; Yang, F. An influence mechanism of shale barrier on heavy oil recovery using SAGD based on theoretical and numerical analysis. Energy 2021, 216, 119099. [Google Scholar] [CrossRef]
  25. Wei, S.; Duan, Y.; Wei, M.; Ren, K.; Lu, C.; Zhan, J.; Tang, Y. Experimental study on the effect of different distributed interlayer on SAGD performance. J. Pet. Sci. Eng. 2022, 209, 109827. [Google Scholar] [CrossRef]
  26. Zhang, Q.; Kang, X.; Liu, H.; Dong, X.; Wang, J. Breccia interlayer effects on steam-assisted gravity drainage performance: Experimental and numerical study. J. Pet. Explor. Prod. Technol. 2022, 12, 613–629. [Google Scholar] [CrossRef]
  27. Zhang, J.; Deng, B.; Hu, C.; Chang, J.; Li, X.; Li, H.; He, D. Computation method for water influx in different layers of natural edge water. Pet. Explor. Dev. 2016, 43, 825–831. [Google Scholar] [CrossRef]
  28. Gong, H.; Li, Y.; Dong, M.; Ma, S.; Liu, W. Effect of wettability alteration on enhanced heavy oil recovery by alkaline flooding. Colloids Surf. A Physicochem. Eng. Asp. 2016, 488, 28–35. [Google Scholar] [CrossRef]
  29. Yu, Q.; Mu, Z.; Liu, P.; Hu, X.; Li, Y. A new evaluation method for determining reservoir parameters for the development of edge-water-driven oil reservoirs. J. Pet. Sci. Eng. 2019, 175, 255–265. [Google Scholar] [CrossRef]
  30. Pang, Z.; Jiang, Y.; Wang, B.; Cheng, G.; Yu, X. Experiments and analysis on development methods for horizontal well cyclic steam stimulation in heavy oil reservoir with edge water. J. Pet. Sci. Eng. 2020, 188, 106948. [Google Scholar] [CrossRef]
  31. Wang, S.; Huang, Y.; Civan, F. Experimental and theoretical investigation of the Zaoyuan field heavy oil flow through porous media. J. Pet. Sci. Eng. 2006, 50, 83–101. [Google Scholar] [CrossRef]
  32. Wang, Y.; Ren, S.; Zhang, L.; Peng, X.; Pei, S.; Cui, G.; Liu, Y. Numerical study of air assisted cyclic steam stimulation process for heavy oil reservoirs: Recovery performance and energy efficiency analysis. Fuel 2018, 211, 471–483. [Google Scholar] [CrossRef]
  33. Jamaloei, B.Y.; Babolmorad, R.; Kharrat, R. Correlations of viscous fingering in heavy oil waterflooding. Fuel 2016, 179, 97–102. [Google Scholar] [CrossRef]
  34. Sandor, M.; Cheng, Y.; Chen, S. Improved correlations for heavy-oil viscosity prediction with NMR. J. Pet. Sci. Eng. 2016, 147, 416–426. [Google Scholar] [CrossRef]
  35. Hein, F.J. Geology of bitumen and heavy oil: An overview. J. Pet. Sci. Eng. 2017, 154, 551–563. [Google Scholar] [CrossRef]
Figure 1. The diagram of steam breakthrough simulation experiment.
Processes 11 01742 g001
Figure 2. The diagram of 3D physical simulation experiment.
Processes 11 01742 g002
Figure 3. Physical diagram of CSS physical model.
Processes 11 01742 g003
Figure 4. Model size diagram corresponding to different experiments.
Processes 11 01742 g004
Figure 5. Effect of aging time and temperature on compressive strength and retention rate of resin.
Processes 11 01742 g005
Figure 6. Effect of resin dosage on permeability and compressive strength of simulated interlayer.
Processes 11 01742 g006
Figure 7. Effect of quartz sand particle size on permeability and compressive strength of simulated interlayer.
Processes 11 01742 g007
Figure 8. Temperature distributions for different production phases of CSS.
Processes 11 01742 g008
Figure 9. Temperature distribution of different CSS cycles in experiment 2.
Processes 11 01742 g009
Figure 10. Temperature distribution of different CSS cycles in experiment 3.
Processes 11 01742 g010
Figure 11. Temperature distribution of different CSS cycles in experiment 4.
Processes 11 01742 g011
Figure 12. Temperature distribution of different CSS cycles in experiment 5.
Processes 11 01742 g012
Figure 13. Recovery and oil production of different CSS cycles.
Processes 11 01742 g013
Table 1. The parameters of similarity criterion for CSS in 3D physical simulation.
Similarity CriterionPhysical MeaningsSimulation Parameters
π 1 = K ρ o g t φ Δ S o μ o L The ratio between gravity and
viscous force
Permeability/time
π 2 = x ρ r L v M r Δ T The ratio between heat injection
and heat loss
Steam quality
π 3 = α t L 2 transient conductionProduction time
π 4 = ρ o g C t L φ Δ S o The dimensionless elastic energyComprehensive
compressibility of formation
π 5 = I s t φ Δ S ρ w L 3 The mass ratio between water
equivalent and mobile oil
steam injection speed
Table 2. Parameter values for both the reservoir and the physical model.
Physical PropertyReservoir DataModel Data
Oil density, kg/m3953.8~1003.3953.8~1003.3
Oil viscosity, mPa·s53,20353,203
Thickness, m1000.5
Simulation of well length, m5000.15
Temperature, °C4747
Pressure, MPa1010
Permeability, mD31923192
Porosity, %32.632.6
Steam quality0.7~1.00.7~1.0
Steam injection rate300 m3/d30 mL/min
Steam injection time25.33 d15.6 min
Top water thickness, m200.1
Interlayer thickness, m100.05
Sandwich layer thickness, m1.50.075
Sandwich layer permeability, mD160160
Table 3. Experiment conditions for different simulation schemes.
NoInterlayer Permeability (mD)Sandwich Layer
Length
Distance between Horizontal Well and Interlayer/cm
1800——10
2200——10
350——10
4200——5
520025 cm10
Table 4. Orthogonal factor level table (optimization of chemical drugs).
FactorABC
Level 30% Curing Agent8% Diluent10% Flexibilizer
11-cyanoethyl-2-phenyl-4,5-bis (cyanoethoxymethylene) imidazoleToluene glycidyl etherPolypropylene glycol
2Methyl-5-norbornene-2,3-dicarboxylic anhydrideN-butyl glycidyl etherModified Nano—core Silicone Rubber
32-Phenyl-4-methyl-5-hydroxymethylimidazoleStyrene oxideAcrylic rubber
Table 5. Orthogonal experimental scheme and results (optimization of chemical drugs).
NoInfluencing FactorEvaluating Indicator
Curing Agent (A)Diluent (B)Flexibilizer (C)Viscosity/mPa·sCuring Time/hCompressive Strength/MPa
1A1B1C11031.546.60
2A1B2C21411138.28
3A1B3C3209344.62
4A2B1C23340.549.81
5A2B2C34351723.88
6A2B3C1239628.77
7A3B1C3349429.43
8A3B2C12972124.53
9A3B3C22942.523.54
Viscosityk1194.33125.33243.00
k2272.33364.33235.00
k3269.33246.33258.00
R78.00239.0023.00
Curing timek13.3311.679.67
k210.839.5011.17
k318.5011.5012.00
R15.172.172.33
Compressive strengthk133.1737.6125.63
k237.4932.2343.88
k335.8336.6436.98
R4.325.3818.24
Table 6. Orthogonal factor level table(Optimization of Chemicals Dosage).
FactorABC
Level Curing Agent Content/%Diluent Content/%Flexibilizer Content/%
12556
2301010
3351514
Table 7. Orthogonal experimental scheme and results(Optimization of Chemicals Dosage).
NoInfluencing FactorEvaluating Indicator
Curing Agent (A)Diluent (B)Flexibilizer (C)Viscosity/mPa·sCuring Time/hCompressive
Strength/MPa
1A1B1C11221139.36
2A1B2C2871645.52
3A1B3C3542147.65
4A2B1C21291444.33
5A2B2C3941346.26
6A2B3C1661034.56
7A3B1C31325.549.39
8A3B2C1116733.34
9A3B3C2683.545.88
Viscosityk187.67127.67101.33
k296.3399.0094.67
k3105.3362.6793.33
R17.6765.008.00
Curing timek116.0010.179.33
k212.3312.0011.17
k35.3311.5013.17
R10.671.833.83
Compressive
strength
k144.1844.3635.75
k241.7241.7145.24
k342.8742.7047.77
R2.462.6512.01
Table 8. Comparison of physical parameters between simulated interlayer and interlayer.
LithologyPermeability/mDRative Error/%Breakthrough Pressure Gradient/Pa/mRative Error/%
Interlayer CoreSimulated InterlayerInterlayer CoreSimulated Interlayer
Gavel rock42.1745.327.4718.9918.671.69
160.05151.765.181.291.322.33
910.26887.912.460.971.014.12
Disclaimer/Publisher’s Note: The statements, opinions and data contained in all publications are solely those of the individual author(s) and contributor(s) and not of MDPI and/or the editor(s). MDPI and/or the editor(s) disclaim responsibility for any injury to people or property resulting from any ideas, methods, instructions or products referred to in the content.

