Article

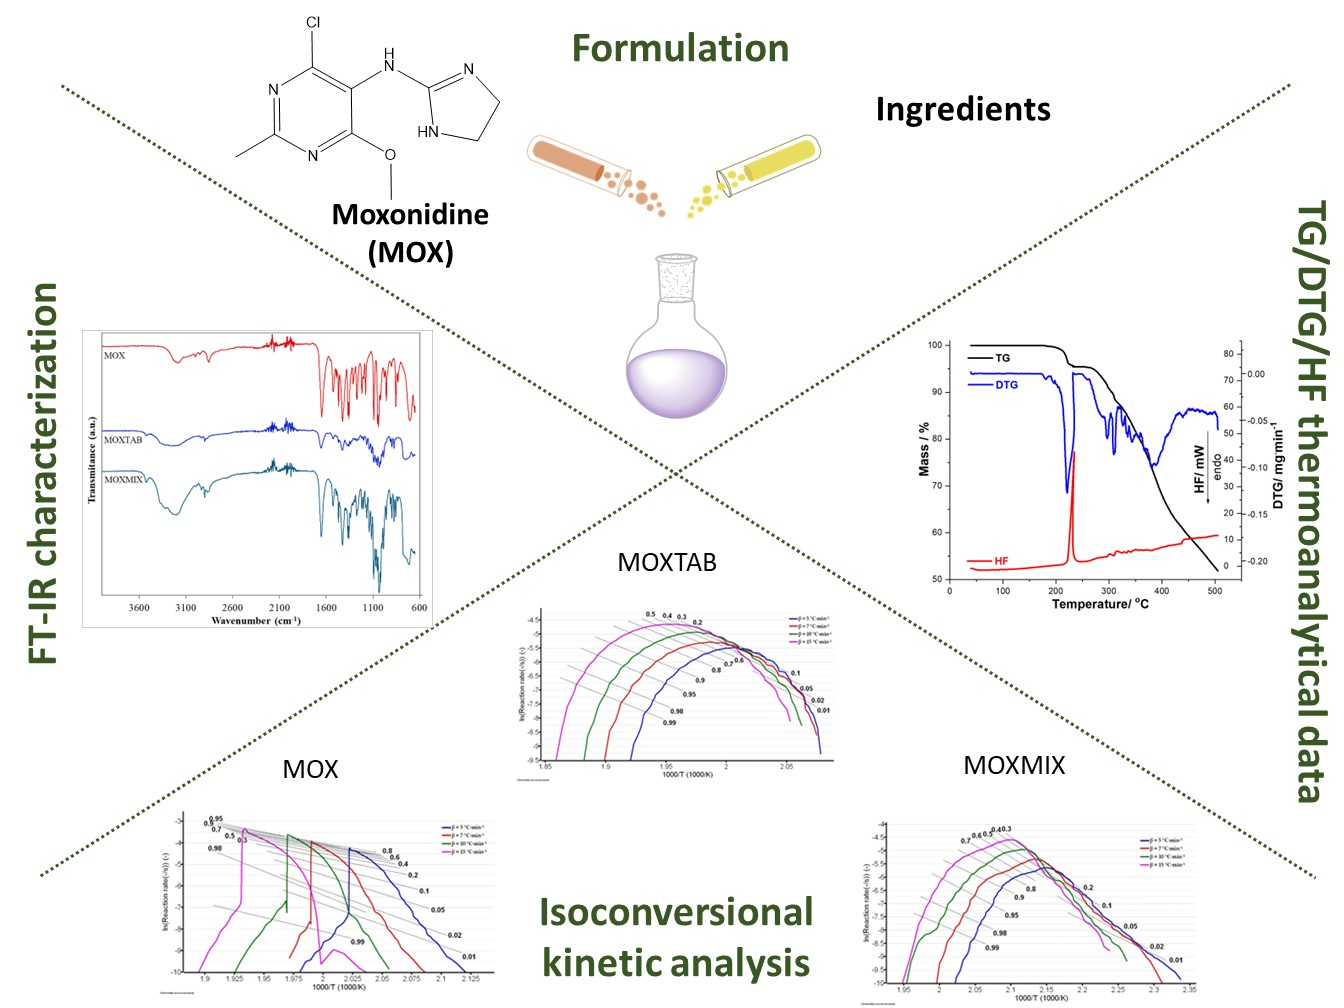
Thermal Stability and Kinetics of Degradation of Moxonidine as Pure Ingredient vs. Pharmaceutical Formulation

1
Faculty of Industrial Chemistry and Environmental Engineering, University Politehnica Timisoara, 2 Victoriei Square, 300006 Timisoara, Romania
2
Advanced Instrumental Screening Center, Faculty of Pharmacy, Victor Babeş University of Medicine and Pharmacy, 2 Eftimie Murgu Square, 300041 Timisoara, Romania
3
Research Centre for Thermal Analysis in Environmental Problems, West University of Timisoara, Pestalozzi Street 16, 300115 Timisoara, Romania
4
Research Institute for Renewable Energy, University Politehnica Timisoara, 138 Gavril Musicescu, 300501 Timisoara, Romania
*
Authors to whom correspondence should be addressed.
Processes 2023, 11(6), 1738; https://doi.org/10.3390/pr11061738
Submission received: 9 May 2023 / Revised: 29 May 2023 / Accepted: 31 May 2023 / Published: 7 June 2023

Abstract

:
The stability of active pharmaceutical ingredients (APIs) and the corresponding pharmaceutical formulations are nowadays of great importance in pharmaceutical research and technology. The quality of an API or of finished pharmaceutical products (FPPs) is time dependent under the influence of several parameters, such as light and air exposure, temperature, and humidity. Additionally, the stability profile of an API is influenced by the formulation composition, due to the presence of excipients or by the characteristic of the packaging materials. In this sense, the main objective of this study was to analyze the degradation kinetics of the antihypertensive drug moxonidine as a pure ingredient (MOX) and in two different solid mixtures, one corresponding to a pharmaceutical formulation (MOXTAB) and the other to an enriched pharmaceutical formulation in MOX (MOXMIX). As investigation techniques, FTIR (Fourier transform infrared) spectroscopy and TG/DTG/HF analysis were employed, while the thermoanalytical data were processed according to the ASTM E698 kinetic method and the isoconversional methods of Flynn–Wall–Ozawa (FWO) and Friedman (FR). The kinetic methods revealed that the excipients have a stabilizing effect on MOX (in terms of Ea values), but the decomposition mechanism of the samples is complex, according to the results suggested by the analysis of Ea vs. α values.

Graphical Abstract

1. Introduction

In the medical–pharmaceutical domain, the increasing percentage of patients with both obesity and hypertension led to the need to investigate molecules with therapeutic effects on these two chronic diseases [1]. From a physiological point of view, both conditions are associated with a hyperactivity of the sympathetic nervous system, including catecholamines and neuropeptides (leptin and neuropeptide Y) [2,3].
Moxonidine (abbreviated MOX, structural formula presented in Figure 1) is a new-generation API used in the treatment of mild to moderate essential hypertension [4], especially in overweight and obese patients [5], since it has been proved that the drug reduces body weight. The antihypertensive agent, along with rilmenidine, belongs to the second generation of the imidazoline derivatives, which are described as APIs with reduced sedative and central nervous system depressant activity and lower affinity to the α2-receptors compared to the first generation. The molecule acts as an agonist for the I1-imidazoline and α2-adrenergic receptors, participating in cardiovascular control by reducing the sympathetic activity [6,7]. The pharmaceutical market currently provides three common pharmaceutical formulations along other generics: Physiotens®, Moxon®, and Cynt®, with different concentrations of moxonidine—0.2 mg, 0.3 mg, and 0.4 mg, respectively, designed for oral administration as coated tablets. Currently, MOX is also being investigated for its efficacy in attention deficit hyperactivity disorder (ADHD), showing significant improvement in the symptoms [8].
Pharmaceutical formulations are obtained by conditioning APIs along excipients, which have a significant impact on the biopharmaceutical profile of the drug molecule [9]. The stability of the drugs can be evaluated using thermoanalytical tools, which lead to crucial information on its stability under thermal stress and decomposition under different conditions (in non-isothermal and/or isothermal conditions), based on irreversible mass loss [10] and phase transitions, including polymorphic shift [11]. Additionally, in the field of pharmaceuticals, thermal analysis can provide essential data on interactions between APIs and excipients [12,13], the formation and stability of supramolecular adducts such as guest–host complexes with cyclodextrins [14,15,16,17], salts and cocrystals [18,19,20,21,22], or even semisolid formulations, such as medicated jellies [23] or gels [24].
Kinetic analysis represents an analytical method based on the data obtained from various thermal analysis techniques (thermogravimetry and differential scanning calorimetry) and it serves as an important investigational method in the pharmaceutical research [10,25,26,27], among other scientific fields [28,29,30], leading to crucial information on stability, degradation mechanisms of the investigated compounds, and even shelf-life.
Considering the lack of information about the thermolysis mechanism for most substances currently used in therapy, isoconversional methods can be employed to determine their decomposition mechanism. This approach allows the approximation of the activation energy (Ea) without knowing or assuming an explicit model for the differential or integral conversion functions. To increase the quality of these studies, several recommendations have been described by the International Confederation for Thermal Analysis and Calorimetry (ICTAC) Kinetics Committee that must be taken into account in order to obtain realistic data [31,32,33,34].
The FWO integral isoconversional method is a fairly simple and widely used method to determine the value of the activation energy (Ea) of a decomposition process, using the data collected from the thermogravimetric curve (TG). The FWO method is based on the assumption that the conversion function does not fluctuate with the modification of the heating rate for all values of the conversion degree and it acts according to the Arrhenius-type temperature dependence without changing the form of the kinetic equation [35,36].
Using the FR differential isoconversional method, the values of the activation energies tend to be slightly higher than the ones determined with the FWO method; those results can be attributed to the calculation of the reaction rate and the higher sensitivity of the FR method to the experimental noise, due to differential processing of the data. Nonetheless, the FWO and FR methods reveal the same tendency of variation for the values of the activation energies; as the conversion rate increases, so does the activation energy [35,37].
Searching the literature data regarding the physicochemical characterization of MOX by instrumental analysis, scarce information was obtained. In 2006, a study regarding the determination of MOX in the blood plasma of humans by liquid chromatography–electrospray ionization–mass spectrometry was conducted by Zhao, Ding, and Wei [38], followed by some other dedicated papers regarding the investigation of this compound and its impurities by chromatographic techniques [39,40,41,42,43].
Forced degradation studies were performed for MOX as pure API and in pharmaceutical formulations according to the International Conference for Harmonization guides in acid, neutral, and basic environments, as well as to oxidative, thermal, and photolytic decomposition, in both solution and solid state [41].
The paper of Allada et al. presents the preparation, characterization, and crystal structure determination of a novel salt containing MOX, namely, the hydrated saccharinate with improved water solubility, which was characterized by TGA (thermogravimetric analysis), DSC (differential scanning calorimetry), and XRPD (X-ray powder diffraction) [44].
To the best of our knowledge, there are no published reports on the thermal degradation of MOX in solid state under thermal stress, or on the investigation of the degradation process using isoconversional kinetic studies. Thus, this study is focused on the thermal stability characterization of the MOX during thermal stress in oxidative atmosphere, in pure form, as a commercialized formulation MOXTABB that contains 0.4 mg MOX/tablet, and as a 5:1 mixture of MOXTAB and pure MOX (abbreviated MOXMIX). The obtained experimental data were initially processed using the preliminary ASTM E698 kinetic method, followed by the isoconversional methods of FWO and FR. All compounds were also subjected to FTIR analysis in order to prove the identity and purity of the active ingredient (MOX), as well as the presence of this API in the complex samples (MOXTAB and MOXMIX).

2. Materials and Methods

2.1. Samples and Preparation

Moxonidine (MOX) was acquired from Sigma-Aldrich (St. Louis, MO, USA) and the purity was according to the European Pharmacopoeia (EP) Reference Standard. The sample was kept in a sealed vial according to the supplier’s recommendations and was used in the studies as received.
The tablets were a commercialized product containing 0.4 mg MOX/dose, namely, Physiotens 0.4 mg (batch 28TACWG71H), produced by Mylan laboratories SAS/Viatris—France. In this study, 10 tablets were used. The excipients of the tablets were hydrated lactose, povidone K25, crospovidone, and magnesium stearate, as indicated in the patient information leaflet. The average mass of the tablet was 108.22 ± 1.11 mg, while after manually removing the film using a scalpel, the average mass was 93.91 ± 1.18 mg. The mass of the core taken into analysis was not the absolute mass of the core, but the remaining mass after the entire coating was removed together with some small external parts of the core.
Since MOXTAB contains 0.4 mg of MOX per tablet, we prepared a model system that mimics the behavior of the API in the commercialized formulation by adding to the crushed tablet (after mechanically removing the film) a required amount of API so that the final mixture contained one part of API to five parts of excipients. For this, 10 tablets were used; their film was completely removed by scratching and they were immediately crushed and triturated in an agate mortar, then sieved. Then, 100 mg of sieved powder was mixed with 20 mg of MOX using the agate mortar and then kept in sealed vials until analysis. The procedure was repeated in triplicate and the samples were in comparison, leading to practically identical results.

2.2. FTIR Investigations

FTIR spectra were drawn up using a Perkin Elmer SPECTRUM 100 device (Perkin-Elmer Applied Biosystems, Foster City, CA, USA) without any a priori preparation of the samples. Data were collected in a 4000–650 cm−1 domain on a UATR (Universal Attenuated Total Reflectance) accessory in order to eliminate the effect of pelleting due to the use of KBr and pressure. Spectra were built up after 64 co-added scans. The spectral range 2300–1900 cm−1 represents the crystal noise signal and has no spectroscopic significance.

2.3. Thermoanalytical Investigations

Thermal analysis investigations were carried out on a Perkin-Elmer DIAMOND apparatus (Perkin-Elmer Applied Biosystems, Foster City, CA, USA) to simultaneously obtain the TG (thermogravimetric/mass curve), DTG (derivative thermogravimetric/mass derivative), and HF (heat flow curve) in dynamic air atmosphere (100 mL·min−1) using open aluminum crucibles. The analyses were carried out under non-isothermal conditions at four heating rates β, namely, 5, 7, 10, and 15 °C·min−1, from ambient temperature up to 400/500 °C. To determine the thermal effects, the differential thermal analysis (DTA) data (in µV) were converted into HF (Heat Flow) data (in mW). The HF data (mW) were converted into normalized HF data by dividing the signal by the mass of the sample, thus obtaining the differential scanning calorimetry (DSC) data (in mW·mg−1).

2.4. Kinetic Study

The kinetic processing of the data (ASTM E698, Friedman and Flynn–Wall–Ozawa methods) was carried out on the first decomposition process of MOX, MOXTAB, and MOXMIX, using the AKTS—Thermokinetics Software version 4.46 (AKTS AG TechnoArk, Siders, Switzerland). As for abbreviations, we used the notations that are generally accepted by the ICTAC committee [34,45]: α—conversion degree, t—time, β—linear heating rate (°C·min−1), A—pre-exponential factor according to kinetic model of Arrhenius (min−1), f(α)—the differential conversion function, g(α)—the integral conversion function, Ea—activation energy (kJ·mol−1), R—universal gas constant (J·mol−1·K−1), T—absolute temperature (K), m0—mass of the sample at the beginning of decomposition, mf—mass of the sample at the end of decomposition, mT—mass of the sample at a certain temperature T.

3. Results and Discussion

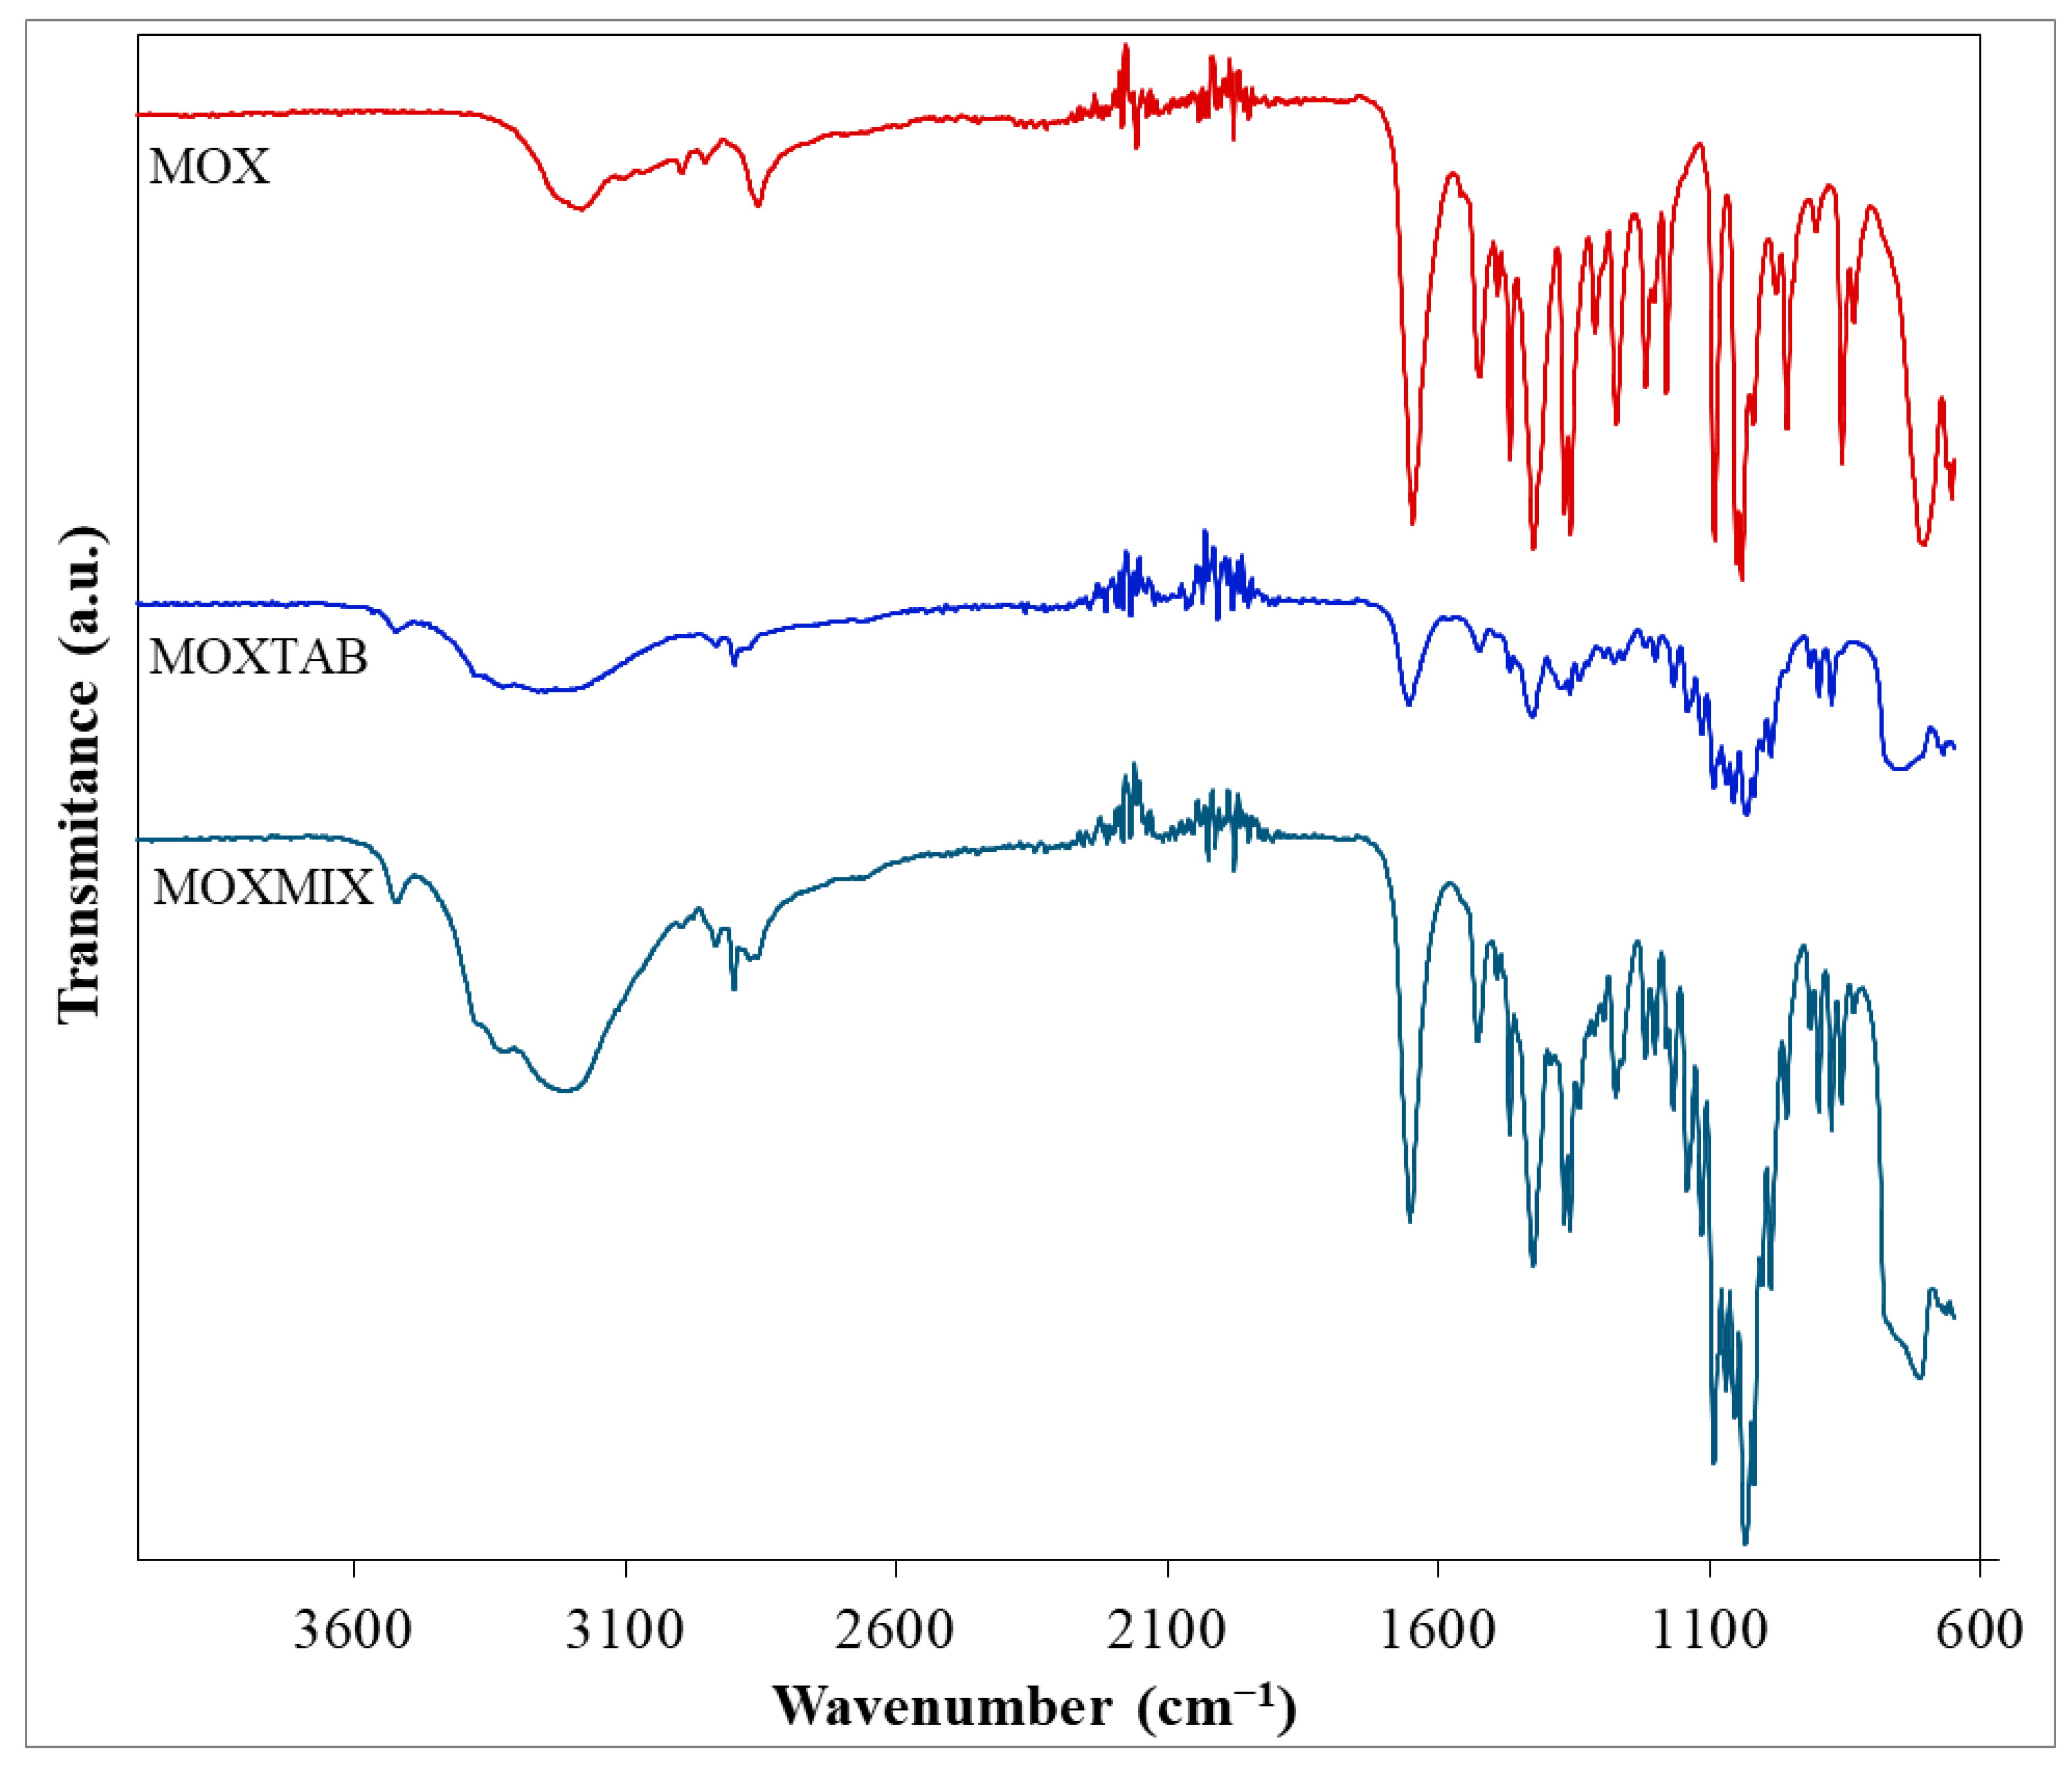
3.1. FTIR Investigations

FTIR analysis was performed for all three samples, namely, pure MOX, the commercially available pharmaceutical formulation MOXTAB containing 0.4 mg MOX in each film-coated tablet and, MOXMIX (the 5:1 mixture of MOXTAB and MOX), in order to characterize the pure API and to identify its presence in both mixtures.
The obtained FTIR spectra are presented superimposed in Figure 2. The major characteristic bands [46,47,48] associated with pure MOX can be easily observed in the spectrum and the data are in accordance with the scientific literature [44]. As such, for the primary amine groups, the N–H stretching vibration is revealed by the band seen in the high wavenumber range (3300–3125 cm−1) with a maximum at 3187 cm−1. This value is slightly lower than the usual position of this type of vibration, the shift being most likely due to the formation of hydrogen bonds. The bending vibration of the N–H bond is associated with the peak seen at 1648 cm−1, while the stretching vibrations of the different C–N bonds found within the architectural structure of the molecule can be correlated with the signals seen at 1219 and 1181 cm−1. The stretching vibrations of the double C=N bonds present in the pyrimidine and 2-imidazoline heterocycles can be matched with the peaks seen at 1561 and 1524 cm−1. The existence of the ether bond within MOX’s structure can easily be related to the absorption band observed at 1092 cm−1, since the C–O bond forms a C–O–C linkage whose stretching vibration determines a strong signal. At 857 cm−1, a peak can be distinguished, most likely indicating the presence of the C–Cl bond. The remaining hydrocarbon skeleton presents a series of characteristic vibrations, namely, the symmetric and asymmetric stretching vibrations of the C–H bonds from the methyl and methylene moieties (2997, 2953, and 2856 cm−1), the bending vibrations of the –CH3 groups (1469 and 1369 cm−1), as well as the scissoring (1426 cm−1), wagging (1313 cm−1), and rocking (705) vibrations of the –CH2 groups.
The spectral profiles of MOXTAB and MOXMIX are more complex due to the presence of the excipients in the analyzed mixtures (hydrated lactose, povidone K25, crospovidone, and magnesium stearate). When the spectrum of the pharmaceutical formulation MOXTAB is analyzed, it can be seen that the signals associated with MOX are attenuated in intensity and several bands that can be correlated with the presence of the excipients are revealed. For example, the stretching vibration of the O–H bonds found in the structure of lactose determines a broad band in the 3450–2990 cm−1 spectral range and a peak at 3524 cm−1, while the well-defined peak seen at 1655 cm−1 characterizes the stretching vibration of the C=O bonds present in the structure of the other three excipients. However, the addition of MOX to MOXTAB in the sample MOXMIX is revealed, since in this sample, more bands that characterize pure MOX can be observed and the intensity of the obtained signals is significantly increased.

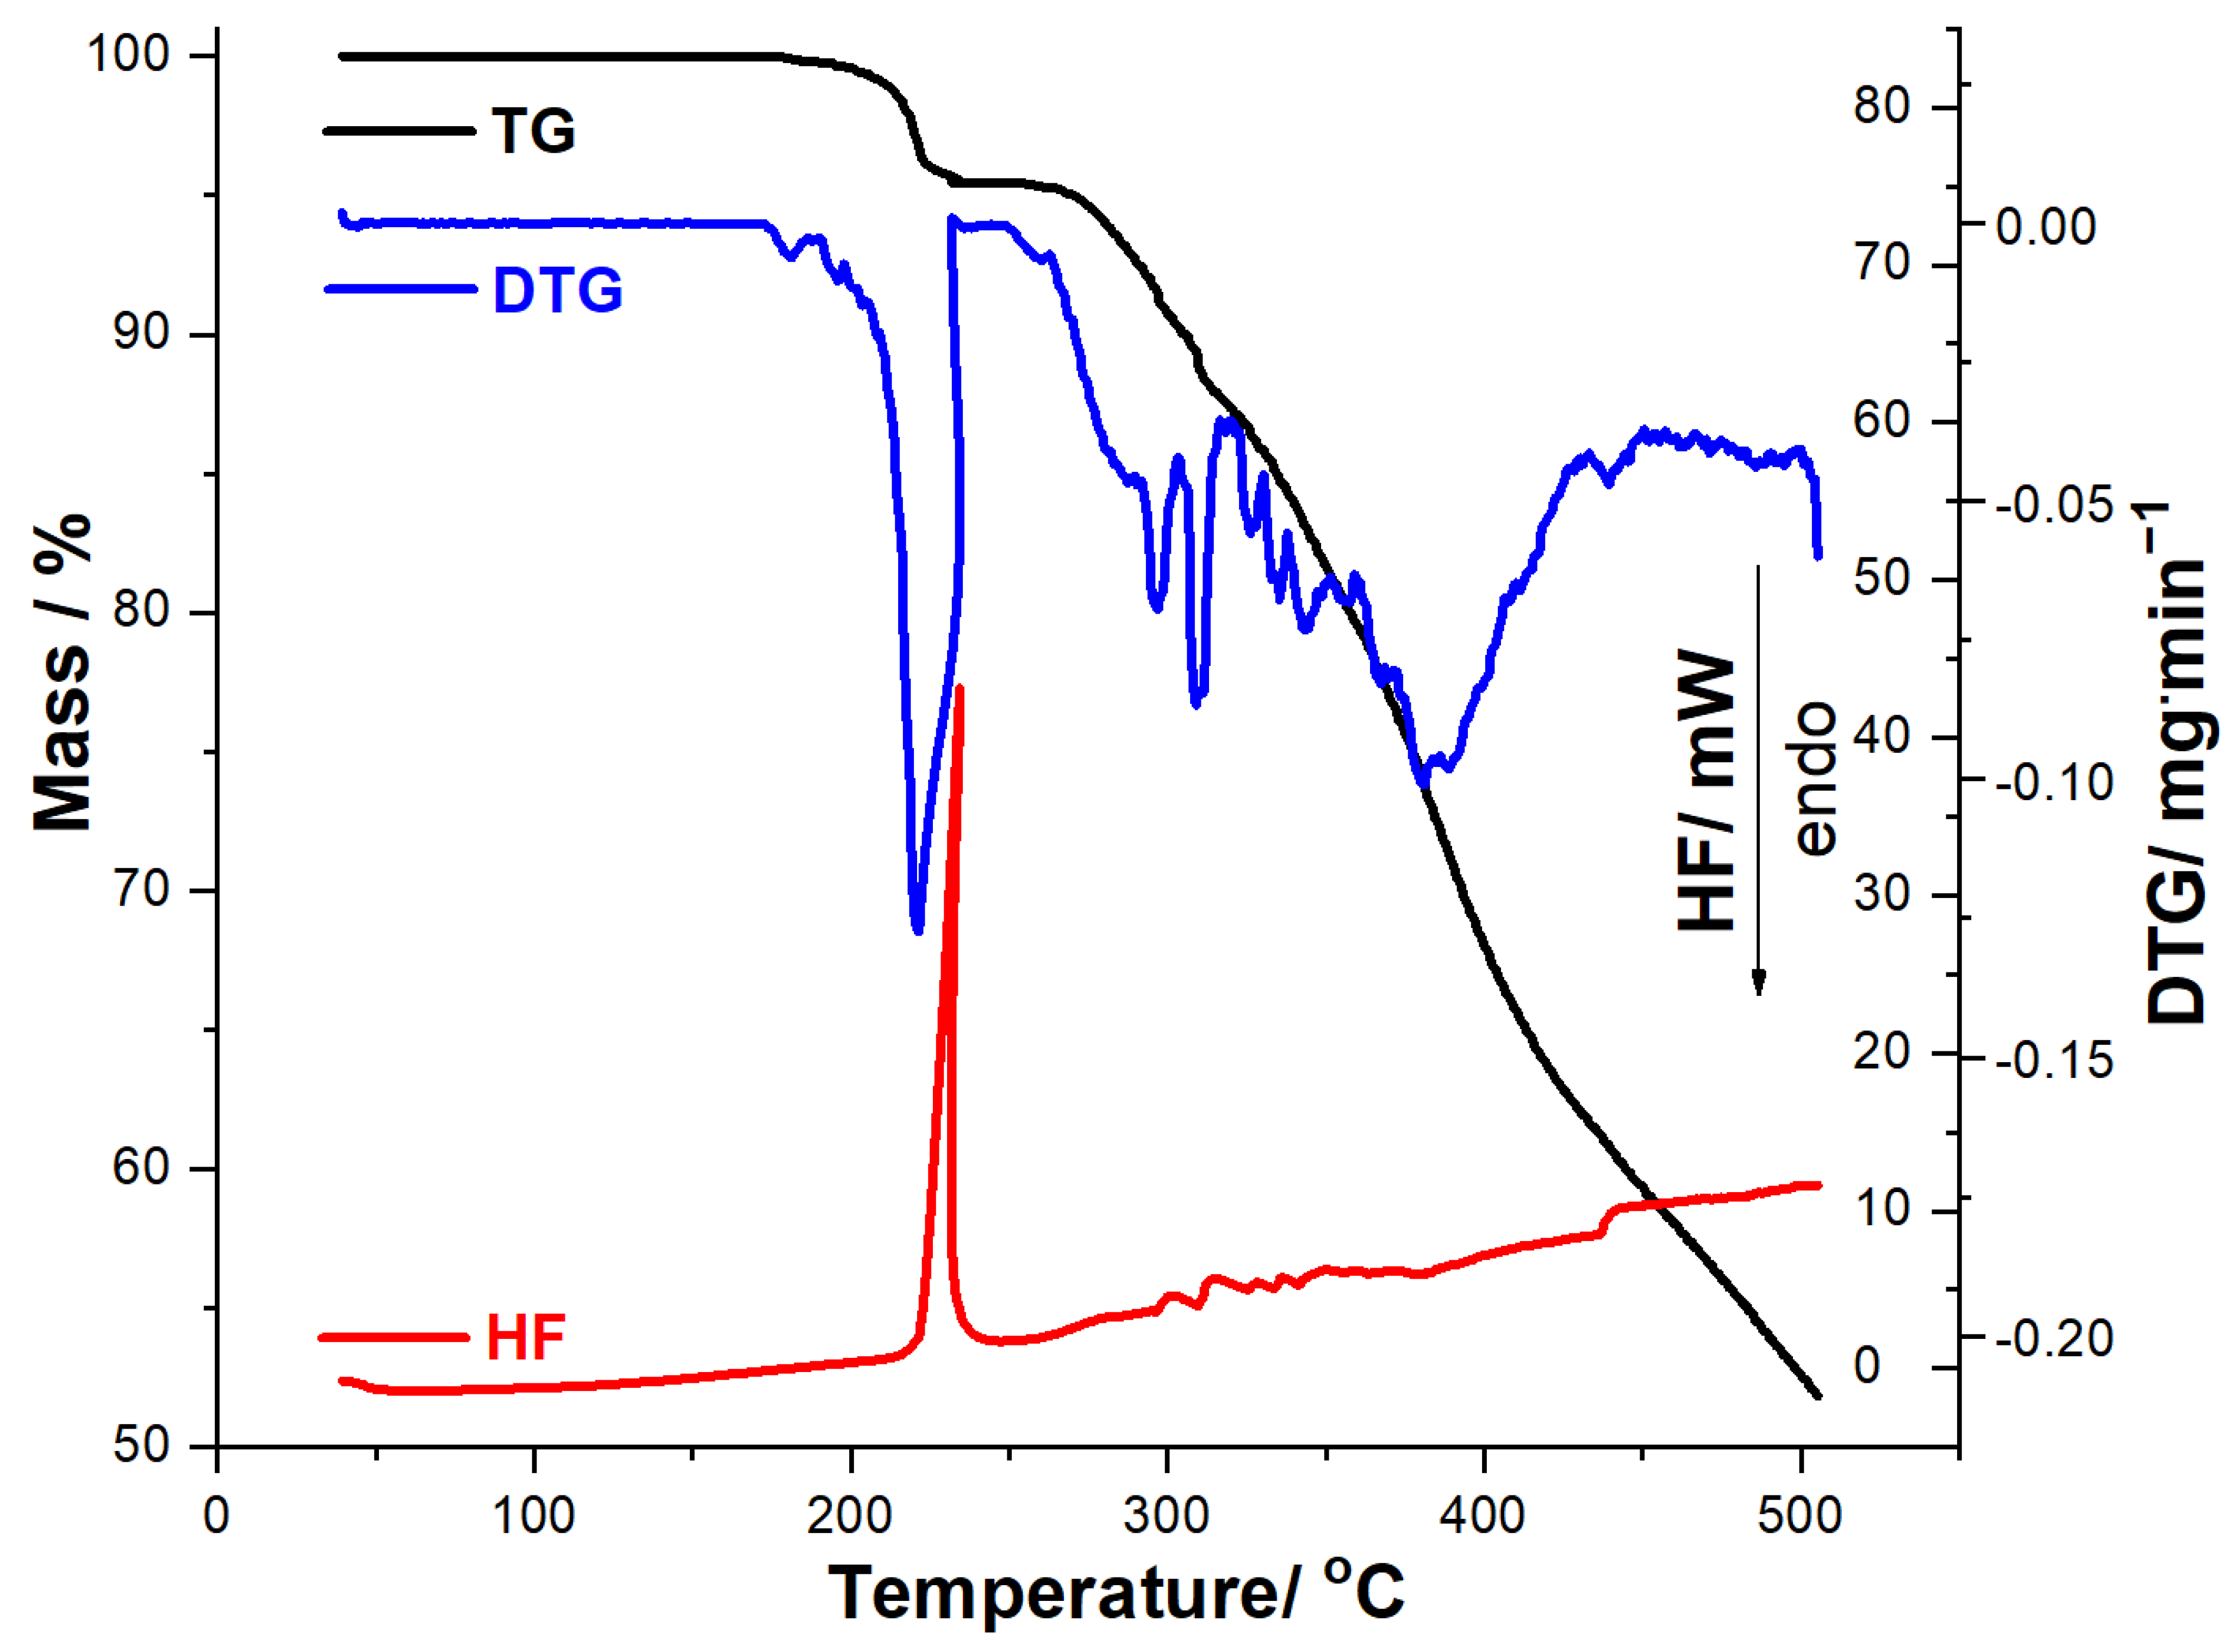
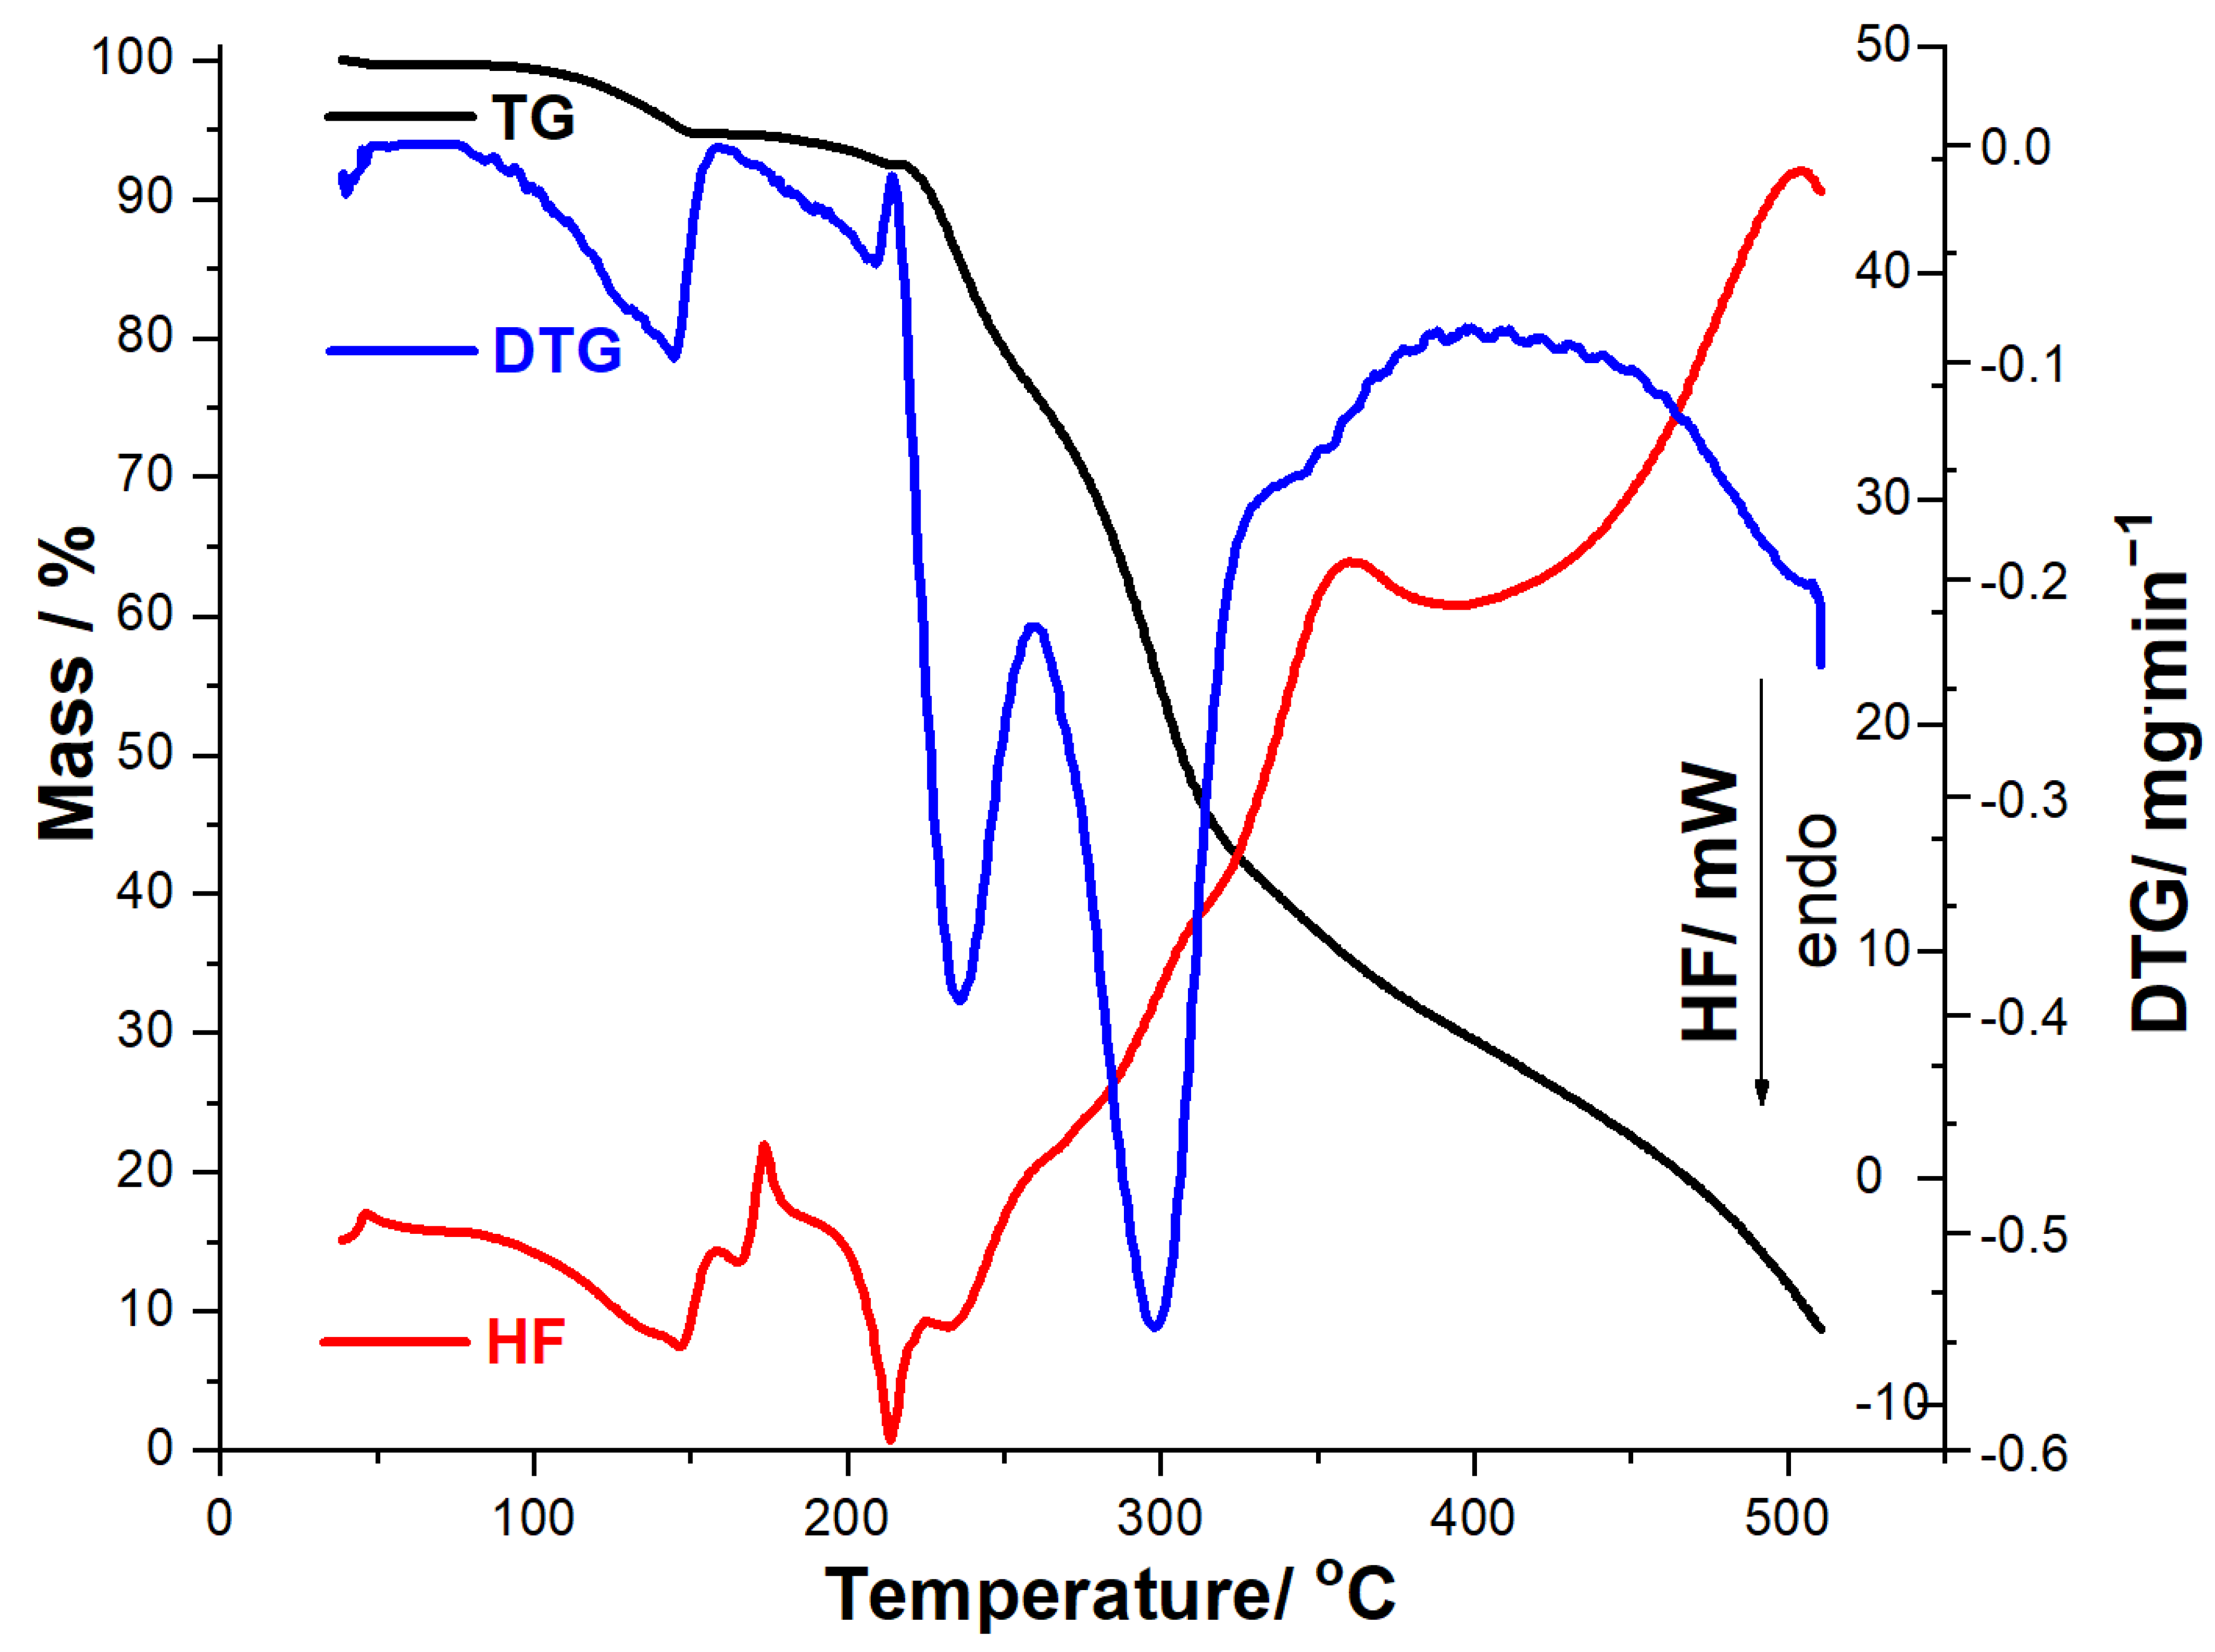
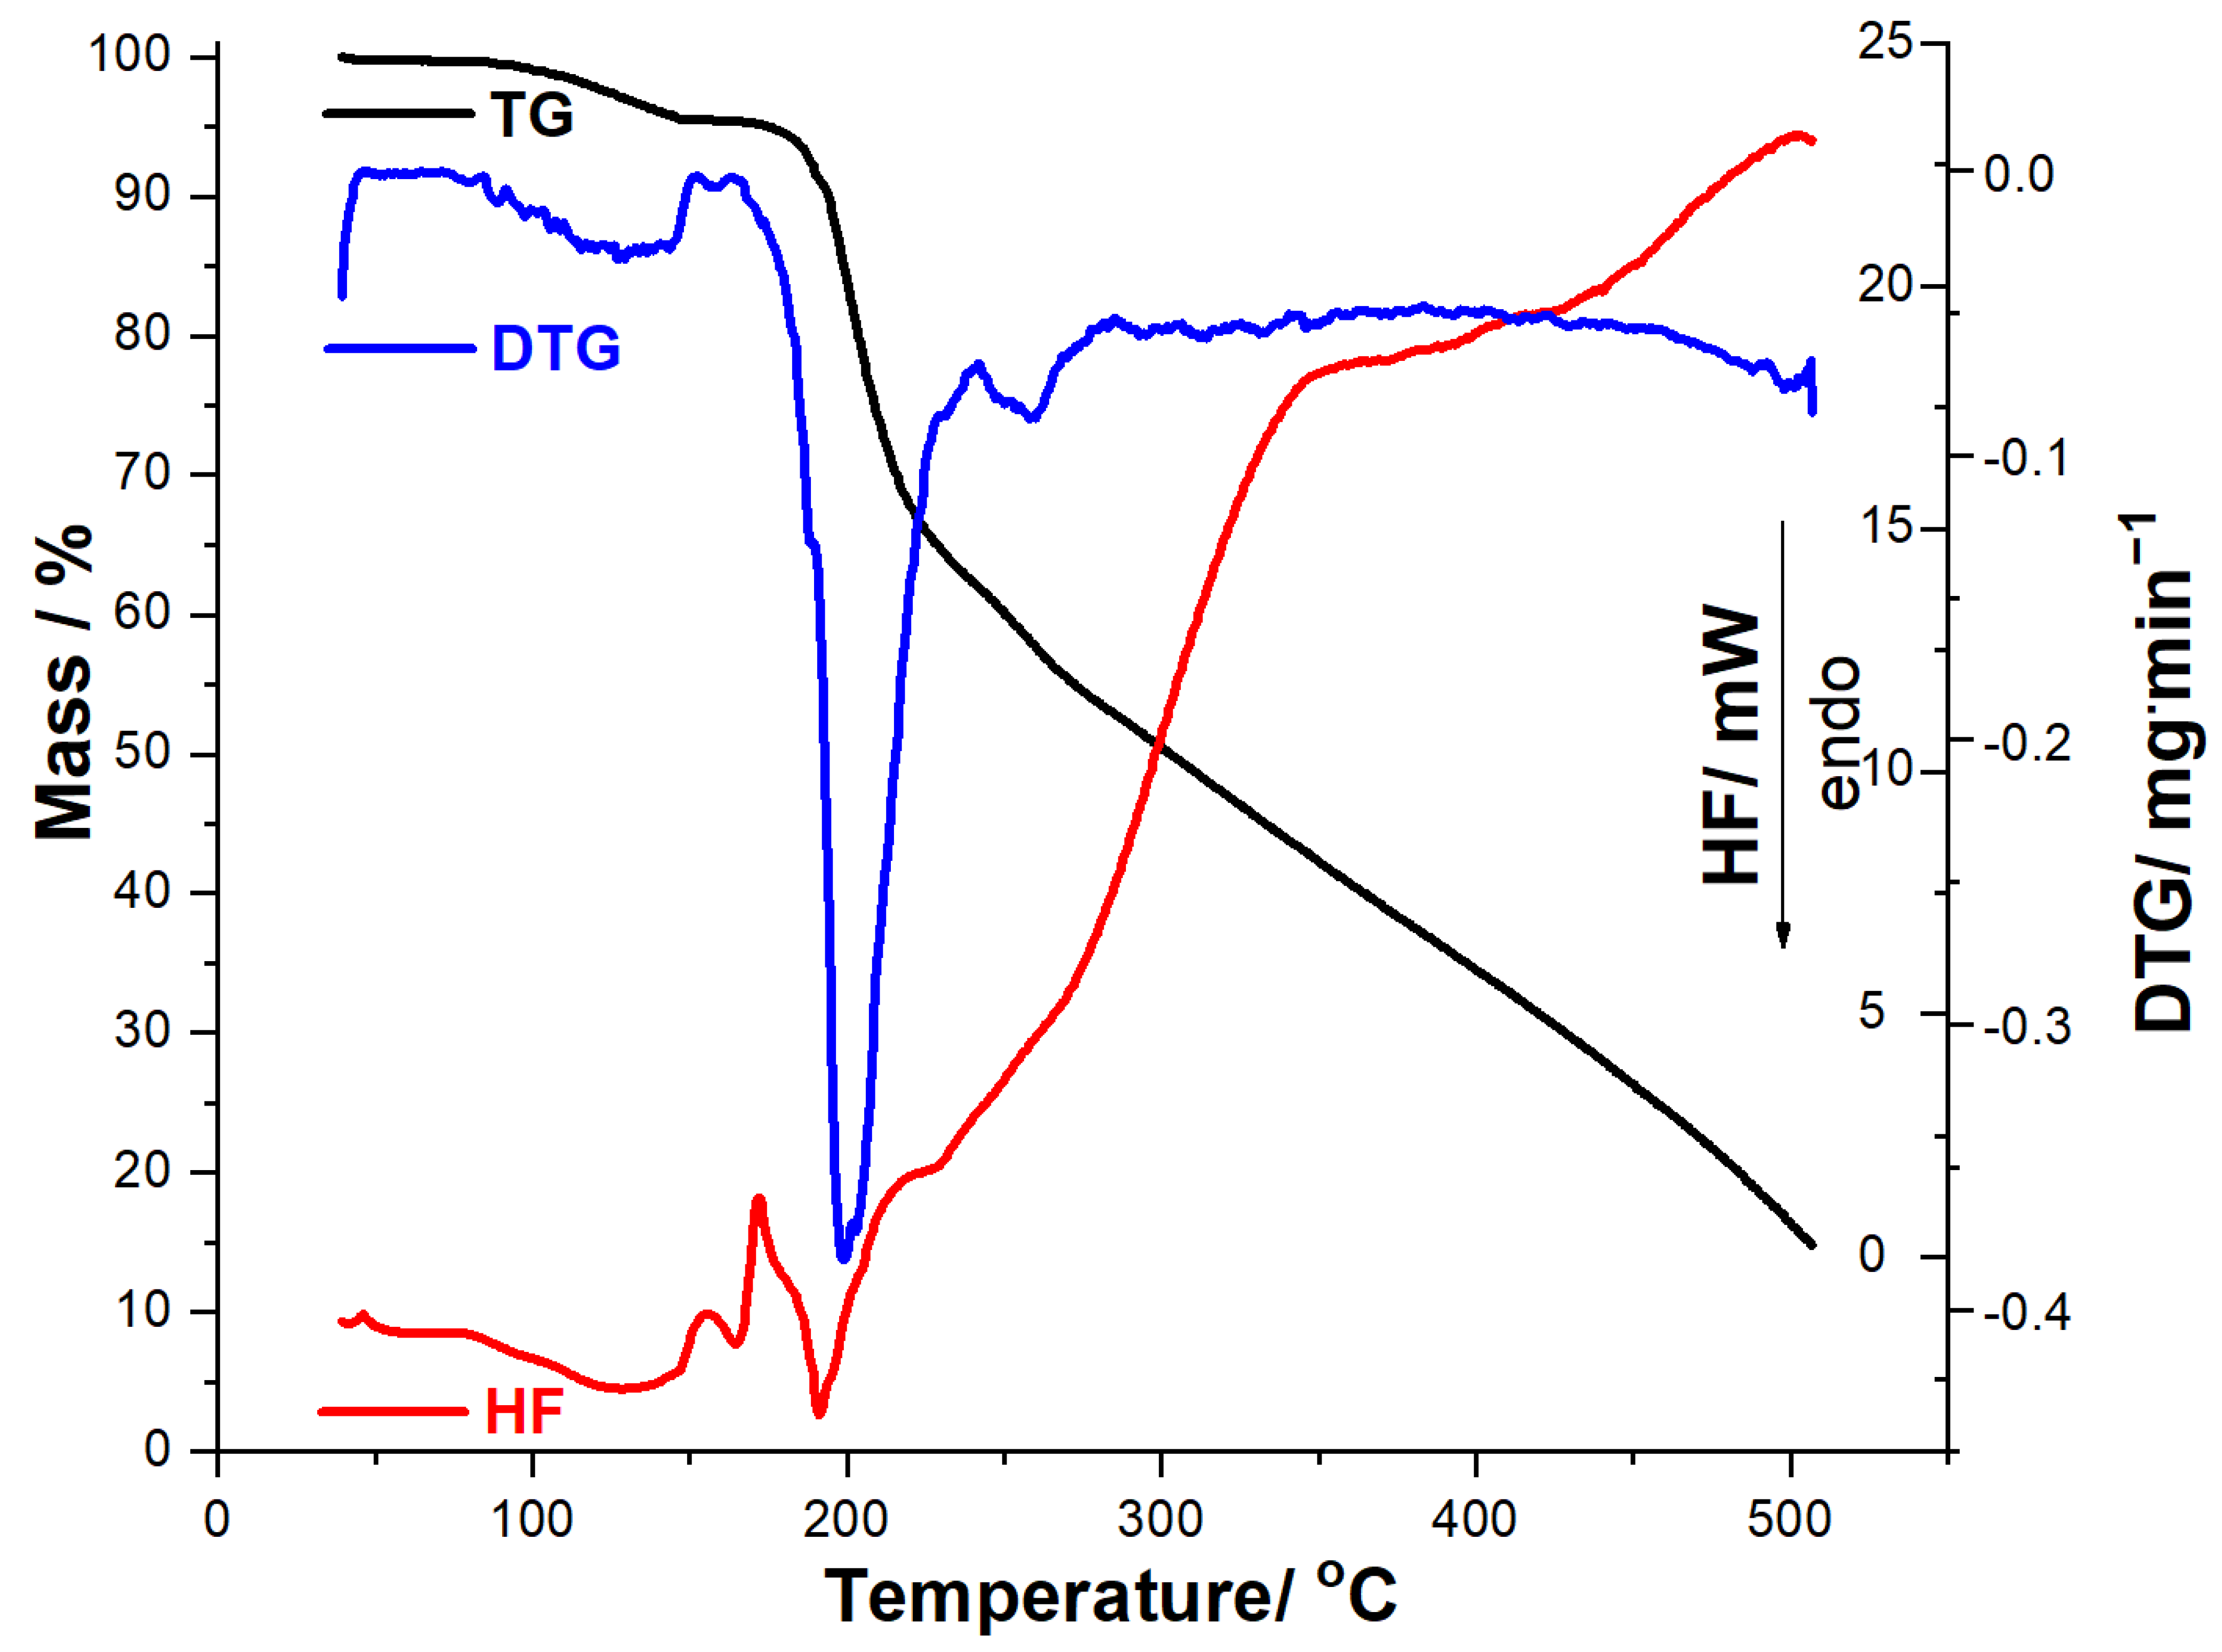
3.2. Thermoanalytical Investigations
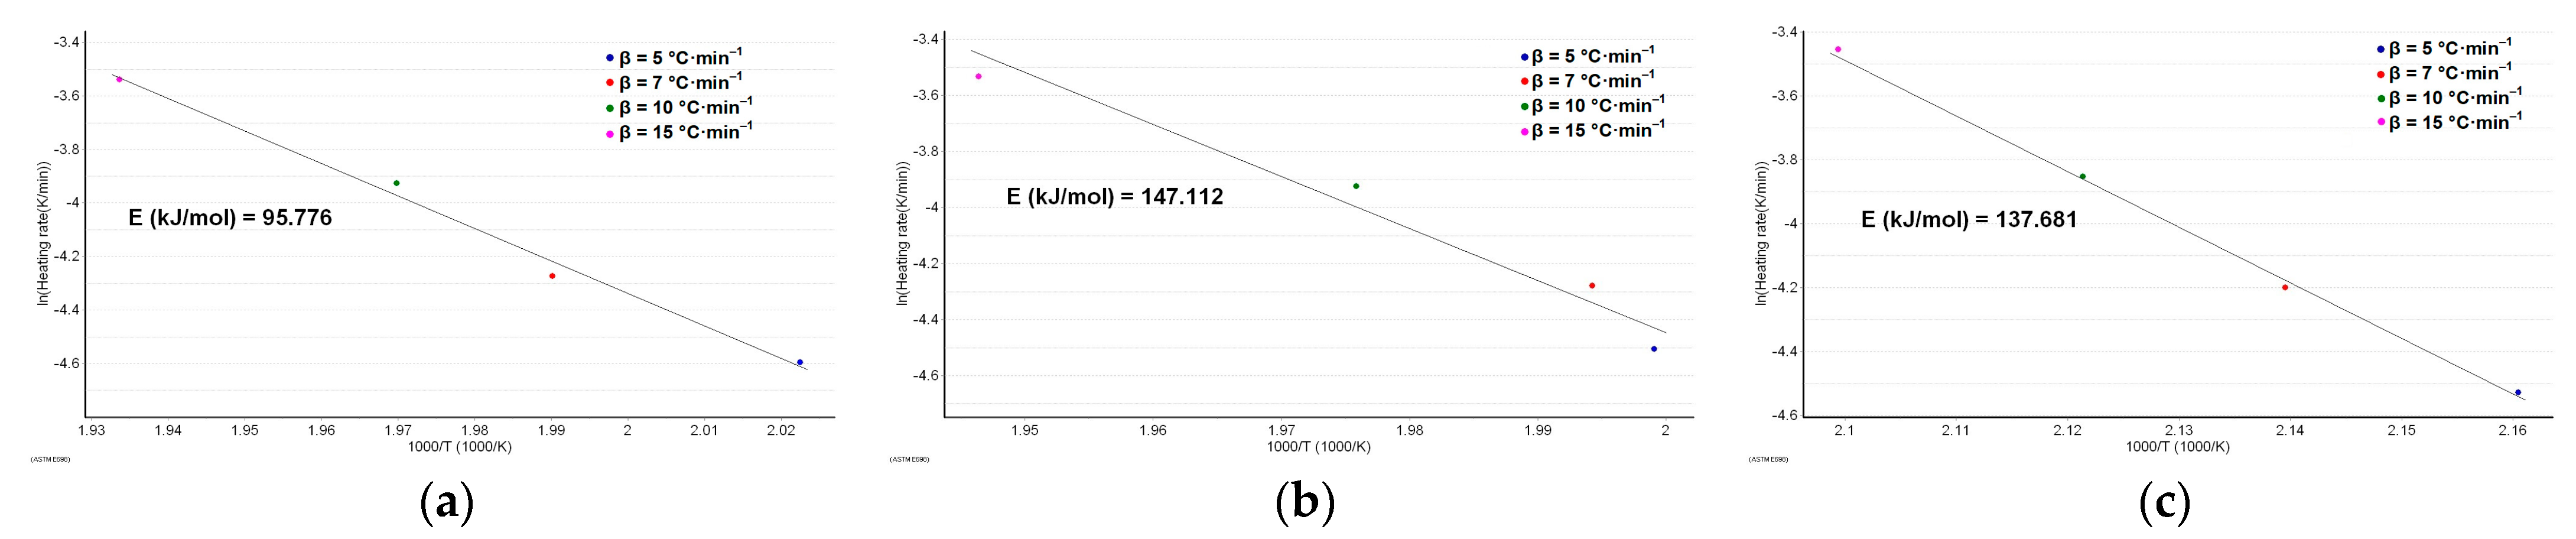
The thermal stability of MOX was investigated along with MOXTAB and MOXMIX under similar conditions, and the thermoanalytical data obtained at a heating rate of 10 °C/min are shown in Figure 3, Figure 4 and Figure 5.
The obtained thermoanalytical results suggest that MOX shows good thermal stability, so no mass loss or thermal events are observed under heating up to 173 °C, when the decomposition begins. In the 173–500 °C range, MOX is degraded by a complex mechanism consisting of several consecutive steps, separated solely on the DTG curve, the residual mass being 52.25%. HF data reveal that the compound does not present an endothermic phase transition (melting), as an intense exothermic event is observed in the 221–239 °C range (HF peak at 234 °C), while the following melting point/decomposition temperature ranges of MOX are reported in the literature: 197–205 °C on Pubchem and DrugBank [49,50] and 217–225 °C on AKSci [51].
In the case of solid formulation (tablet, MOXTAB), the thermoanalytical data presented in Figure 4 reveal a different behavior under thermal treatment, including a more complex HF profile, since the thermal events are associated along the API with the excipients. In the temperature range 40–159 °C, thermoanalytical data reveal two consecutive dehydration processes: first is the release of superficially adsorbed water (TG process between 40 and 86 °C, DTGpeak at 83 °C, Δm1 = 0.27%), followed by the dehydration of excipients, mainly hydrated lactose (TG process between 86 and 149 °C, DTG process between 86 and 149 °C, DTGpeak at 144 °C, Δm2 = 4.83%, HF peaks at 146 °C and 147 °C). At temperatures over 149 °C, the TG curve reveals that the tablet maintains its mass in the temperature range 149–174 °C, while in the 174–214 °C interval, the third mass loss is observed (Δm3 = 2.36%, DTGpeak at 209 °C, HFpeak at 173 °C and 214 °C). Two well-individualized degradation processes are separated on the DTG curve: one between 214 and 258 °C (Δm4 = 15.38%, DTGpeak at 235 °C, HFpeak at 224 °C and 233 °C), followed by another one in the 258–331 °C interval (Δm5 = 35.07%, DTGpeak at 297 °C). At temperatures above 331 °C, thermolysis is rapid and intensely exothermic (HF peaks at 361 °C and 503 °C, respectively), resulting in a residual mass of 8.82%.
Thermoanalytical data (TG/DTG/HF) recorded for MOXMIX in dynamic air atmosphere at β = 10 °C·min−1 (Figure 5) are closer to the MOX profile, since it contains a significantly higher amount of API compared to MOXTAB. TG data reveal that this sample is thermally stable up to 88 °C, when the first mass loss occurs up to 146 °C, i.e., a dehydration that is also evidenced by DTGpeaks at 88 °C and 127 °C and HFpeak at 129 °C, with a corresponding mass loss Δm1 = 4.44%. MOXMIX is then thermally stable, and no mass loss occurs between 146 and 168 °C, followed at 168–500 °C by a continuous mass loss due to thermolysis. On the DTG curve, there is a well-individualized mass loss process in the 168–242 °C range, with two overlapped DTGpeaks at 199 °C and 203 °C, HFpeaks at 172 °C, 191 °C, and 230 °C, and a corresponding mass loss Δm2 = 34.15%. At temperatures over 242 °C, thermolysis leads to a final residual mass of 14.55%, which is greater than the one obtained when the MOXTAB sample was analyzed. This behavior can be explained by the supplementary quantity of API, which has a greater residual mass at 500 °C compared to the excipients.

3.3. Kinetic Study

The aim of this kinetic study was to evaluate the effect of the excipient on MOX degradation. Since the thermal degradation of MOX is a heterogenous solid-state process, Equation (1) describes the reaction rate in differential form, where:
β d α dT = A · f α · exp E a RT
Equation (2) describes the reaction rate in integral form, after the integration of differential Equation (1) with the separation of variables for α belonging to the [0, α] interval and T belonging to the [T0, T] interval, where T0 represents the temperature at which the investigated process begins:
g ( α ) = 0 α d α f α = A β T 0 T exp E a RT dT
The fraction of mass loss (i.e., the degree of conversion) can be calculated using Equation (3):
α T = m 0 m T m 0 m f
According to the ICTAC protocols, the use of model-free isoconversional methods is recommended over model-fitting methods, and the integral methods of FWO and Kissinger–Akahira–Sunose and the FR differential method are by far the most frequently utilized methods for the kinetic analysis of solid-state degradation processes [28].
The decomposition kinetics was estimated from the TG/DTG curvatures using the ASTM E698 method [52,53] as a preliminary investigational method, followed by the employment of two isoconversional methods, namely, the FR differential method [54] and the integral method of FWO [55,56]. The advantages and limitations of isoconversional methods, as well as their development and use over time, are reported exhaustively in the literature [57,58,59]. However, to facilitate the access to information of the readers, a brief presentation of the mathematical models of the isoconversional methods is shown in Table 1.
The kinetically investigated degradation process was selected based on the aspect of the TG/DTG/HF curves for MOX, and the same process was chosen for both the pharmaceutical form (MOXTAB) and the MOX-enriched sample mixture (MOXMIX), according to the DTG curves. For the analyzed samples, the degradation process that was investigated from the kinetic point of view was chosen based on the aspect of the DTG curves for each heating rate, and the temperature intervals are presented in Table 2.
The results obtained after performing the ASTM E698 kinetic study are presented in Figure 6a–c.
As can be seen in Figure 6a–c, the variation in activation energy using the DTG peaks at the selected heating rates is significant. The preliminary information provided by this method is that the stability of MOX (in terms of activation energy, Ea for MOX being 95.8 kJ·mol−1) seems to increase in the presence of excipients from formulation, and the degradation process requires an additional 53% energy for the degradation of the tablet (Ea for MOXTAB is 147.1 kJ·mol−1). The destabilizing effect of moxonidine in the mixture is also proven after the analysis of the MOXMIX model system: the presence of the additional mass of active ingredient determines a decrease in activation energy to 137.7 kJ·mol−1.
The reaction progress was analyzed for all three samples, and the results obtained are presented in Figure S1a–c. Additionally, the increase in reaction rate and the shift in its maximum to higher temperatures with the increase in heating rate due to thermal inertia was observed for all three analyzed samples, as seen in Figure S2a–c, in good agreement with the reaction progress presented in Figure S1a–c.
The isoconversional kinetic study according to the FWO method was carried out by estimating the activation energy values vs. α for each heating rate, from the slopes of the linear plots of lnβ vs. T−1, as seen in Figure S3, with the corresponding values presented in Table 3. The obtained values agree with the results obtained by the ASTM E698 method, increasing to 5.84% for MOX, 18.1% for MOXTAB, and 1.81% for MOXMIX. Similarly, using the FR method, the plot of ln (β·dα/dT) vs. T−1 is linear (Figure S4), and the individual Ea(α) values were estimated for the same conversion degrees as in the case of the FWO method (Table 2).
The analysis of variation in Ea vs. α using such a narrow variation for conversion (5%) allows the estimation of a medium value of activation energy for the whole investigated process (considered a single-step process), but only if the variation in individual Ea values is placed inside a confidence interval of ±10% around the calculated medium value, i.e., 0.9 · E a ¯ E a α 1.1 · E a ¯ . As a consequence, if the variation in Ea(α) is monotonous (increasing or decreasing) or arbitrary, a multi-step degradation process, or a modification of the mechanism with increasing heating rate, is suspected (Figure S5).
The analysis of the data presented in Table 3 and Figure S5a–c reveals that the integral processing of the kinetic data according to the FWO isoconversional method indicates that the degradation of all samples is characterized by a mechanism that is not dependent on the degree of conversion, when 0.1   α   0.95. In the case of MOXTAB, there is solely one value for Ea outside the confidence interval, at α = 5%. For all samples, the tendency for Ea values follows different trends (Figure S5a–c) up to α = 0.25 and for α > 0.3, suggesting the existence of complex degradation processes. This tendency is more evident for MOXTAB and MOXMIX, where the presence of excipients is the reason for this behavior.
The FR isoconversional method (Figure S5d–f) reveals a higher dispersion of the Ea values vs. α. outside the ±10% limit. For MOX, the Ea values are higher at the beginning of the process, at lower conversion degrees (α < 0.2), and at the end of the process (α > 0.85). Furthermore, for MOXTAB and MOXMIX, the variation in Ea vs. α is irregular, mostly with extreme values for MOXMIX at α < 0.25, suggesting a complex mechanism of decomposition of these samples under thermal stress.

4. Conclusions

In this paper, we present the findings of the instrumental screening of the drug moxonidine, both as a pure ingredient and also in the presence of several excipients that are currently used in a commercial solid formulation that contains 0.4 mg API per tablet. To evaluate the excipient effect, we prepared an enriched mixture starting from this commercial formulation by adding pure API until a 5:1 tablet/API ratio was achieved. All samples were characterized by FTIR spectroscopy in order to check the identity and purity of MOX and to confirm the presence of API in the tablet and in the mixture. Thermal investigations were carried out for all samples using a dynamic oxidative atmosphere and four different linear heating rates, and the obtained data were processed using three kinetic methods. Initially, the simple AST-E698 method was used, and later, the isoconversional methods of FWO and FR were employed. If used alone, the ASTM-E698 method cannot produce realistic kinetic parameters regarding reactions that include simultaneous or consecutive reaction steps, while the isoconversional methods allow an estimation of the values of Ea vs. conversion degree. The different results of the three methods reside in the mathematical processing of the data, since in the case of the ASTM E698 method, the estimated Ea value does not consider the conversion degree as it is a mean value for the entirely investigated process. Excipients showed a stabilizing effect on MOX (in terms of Ea values), but the decomposition mechanism of the samples is complex, according to the results suggested by the analysis of Ea vs. α values.

Supplementary Materials

The following supporting information can be downloaded at: https://www.mdpi.com/article/10.3390/pr11061738/s1, Figure S1: The reaction progress vs. temperature at selected heating rates for: (a) MOX; (b) MOXTAB; and (c) MOXMIX. Figure S2: The reaction rate vs. temperature at selected heating rates for: (a) MOX; (b) MOXTAB; and (c) MOXMIX. Figure S3: Linear plot of FWO integral isoconversional method of the analyzed decomposition process for: (a) MOX; (b) MOXTAB; and (c) MOXMIX. Figure S4: Linear plotting of FR differential isoconversional method of the analyzed process of decomposition for: (a) MOX; (b) MOXTAB; and (c) MOXMIX. Figure S5: Variation in Ea vs. α according to FWO integral isoconversional method (a–c) and FR differential isoconversional method (d–f) of the analyzed decomposition process for: (a,d) MOX; (b,e) MOXTAB; and (c,f) MOXMIX.

Author Contributions

Conceptualization, B.B., A.L. and I.L.; methodology, B.B., D.C., T.V., G.V. and A.L.; validation, I.L., F.P., and T.V.; investigation, B.B., A.R. and D.C.; resources, A.L., F.P., T.V., G.V. and I.L.; writing—original draft preparation, I.L., D.C., A.L., G.V. and B.B.; writing—review and editing, A.L., F.P., D.C. and I.L.; supervision, A.L., T.V., F.P. and I.L.; project administration, B.B. All authors have read and agreed to the published version of the manuscript.

Funding

This paper was financially supported by the Project “Network of excellence in applied research and innovation for doctoral and postdoctoral programs/InoHubDoc”, project co-funded by the European Social Fund financing agreement no. POCU/993/6/13/153437.

Data Availability Statement

Raw data are available from the corresponding author of this work, on request.

Conflicts of Interest

The authors declare that they have no known competing financial interests or personal relationships that could have appeared to influence the work reported in this paper.

References

  1. Gamboa, A.; Okamoto, L.E.; Shibao, C.A.; Biaggioni, I. Obesity-associated hypertension. In Primer on the Autonomic Nervous System; Biaggioni, I., Browning, K., Fink, G., Jordan, J., Low, P.A., Paton, J.F.R., Eds.; Academic Press: Cambridge, MA, USA, 2023; pp. 471–474. ISBN 978-0-323-85492-4. [Google Scholar]
  2. Karlafti, E.; Didangelos, T.; Benioudakis, E.; Kotzakioulafi, E.; Kaiafa, G.; Kotsis, V.; Ziakas, A.; Doumas, M.; Goulas, A.; Savopoulos, C. Effects of Moxonidine Administration on Serum Neuropeptide Y Levels in Hypertensive Individuals: A Prospective Observational Study. Endocrines 2022, 3, 43–52. [Google Scholar] [CrossRef]
  3. Karlafti, E.F.; Hatzitolios, A.I.; Karlaftis, A.F.; Baltatzi, M.S.; Koliakos, G.G.; Savopoulos, C.G. Effects of moxonidine on sympathetic nervous system activity: An update on metabolism, cardio, and other target-organ protection. J. Pharm. Bioallied Sci. 2013, 5, 253–256. [Google Scholar] [PubMed]
  4. Fenton, C.; Keating, G.M.; Lyseng-Williamson, K.A. Moxonidine: A review of its use in essential hypertension. Drugs 2006, 66, 477–496. [Google Scholar] [CrossRef] [PubMed]
  5. Abellán, J.; Leal, M.; Hernández-Menárguez, F.; García-Galbis, J.A.; Martínez-Pastor, A.; De Vinuesa, S.G.; Luño, J. Efficacy of moxonidine in the treatment of hypertension in obese, noncontrolled hypertensive patients. Kidney Int. Suppl. 2005, 67, S20–S24. [Google Scholar] [CrossRef] [PubMed] [Green Version]
  6. Wang, Y.; Nguyen, D.T.; Anesi, J.; Alramahi, A.; Witting, P.K.; Chai, Z.; Khan, A.W.; Kelly, J.; Denton, K.M.; Golledge, J. Moxonidine Increases Uptake of Oxidised Low-Density Lipoprotein in Cultured Vascular Smooth Muscle Cells and Inhibits Atherosclerosis in Apolipoprotein E-Deficient Mice. Int. J. Mol. Sci. 2023, 24, 3857. [Google Scholar] [CrossRef] [PubMed]
  7. Ernsberger, P.; Friedman, J.E.; Koletsky, R.J. The I1-imidazoline receptor. J. Hypertens. 1997, 15, S9–S23. [Google Scholar] [CrossRef]
  8. Sveinsdóttir, H.S.; Christensen, C.; Þorsteinsson, H.; Lavalou, P.; Parker, M.O.; Shkumatava, A.; Norton, W.H.J.; Andriambeloson, E.; Wagner, S.; Karlsson, K.Æ. Novel non-stimulants rescue hyperactive phenotype in an adgrl3.1 mutant zebrafish model of ADHD. Neuropsychopharmacology 2022. [Google Scholar] [CrossRef]
  9. Kramzer, L.F.; Hamorsky, K.T.; Graebing, P.W.; Wang, L.; Fuqua, J.L.; Matoba, N.; Lasnik, A.B.; Moncla, B.J.; Zhang, J.; Palmer, K.E.; et al. Preformulation Characterization of Griffithsin, a Biopharmaceutical Candidate for HIV Prevention. AAPS PharmSciTech 2021, 22, 83. [Google Scholar] [CrossRef]
  10. Asran, A.M.; Mohamed, M.A.; Khedr, G.E.; Eldin, G.M.G.; Yehia, A.M.; Mishra, R.K.; Allam, N.K. Investigation of the thermal stability of the antihypertensive drug nebivolol under different conditions: Experimental and computational analysis. J. Therm. Anal. Calorim. 2022, 147, 5779–5786. [Google Scholar] [CrossRef]
  11. Bengescu, C.; Ledeți, A.; Olariu, T.; Cîrcioban, D.; Muntean, C.; Vlase, G.; Vlase, T.; Tomoroga, C.; Dragomirescu, A.O.; Dascălu, D.; et al. Instrumental investigations of promestriene: First report regarding the solid-state characterization and compatibility with pharmaceutical excipients. J. Therm. Anal. Calorim. 2023, 148, 4641–4649. [Google Scholar] [CrossRef]
  12. Ledeti, I.; Bolintineanu, S.; Vlase, G.; Circioban, D.; Ledeti, A.; Vlase, T.; Suta, L.M.; Caunii, A.; Murariu, M. Compatibility study between antiparkinsonian drug Levodopa and excipients by FTIR spectroscopy, X-ray diffraction and thermal analysis. J. Therm. Anal. Calorim. 2017, 130, 433–441. [Google Scholar] [CrossRef]
  13. Rojek, B.; Wesolowski, M. A combined differential scanning calorimetry and thermogravimetry approach for the effective assessment of drug substance-excipient compatibility. J. Therm. Anal. Calorim. 2023, 148, 845–858. [Google Scholar] [CrossRef]
  14. Li, X.; Liu, J.; Qiu, N. Cyclodextrin-Based Polymeric Drug Delivery Systems for Cancer Therapy. Polymers 2023, 15, 1400. [Google Scholar] [CrossRef] [PubMed]
  15. Kovacs, T.; Nagy, P.; Panyi, G.; Szente, L.; Varga, Z.; Zakany, F. Cyclodextrins: Only Pharmaceutical Excipients or Full-Fledged Drug Candidates? Pharmaceutics 2022, 14, 2559. [Google Scholar] [CrossRef] [PubMed]
  16. Soe, H.M.S.H.; Maw, P.D.; Loftsson, T.; Jansook, P. A Current Overview of Cyclodextrin-Based Nanocarriers for Enhanced Antifungal Delivery. Pharmaceuticals 2022, 15, 1447. [Google Scholar] [CrossRef]
  17. De Gaetano, F.; Cristiano, M.C.; Paolino, D.; Celesti, C.; Iannazzo, D.; Pistarà, V.; Iraci, N.; Ventura, C.A. Bicalutamide Anticancer Activity Enhancement by Formulation of Soluble Inclusion Complexes with Cyclodextrins. Biomolecules 2022, 12, 1716. [Google Scholar] [CrossRef]
  18. Dhondale, M.R.; Thakor, P.; Nambiar, A.G.; Singh, M.; Agrawal, A.K.; Shastri, N.R.; Kumar, D. Co-Crystallization Approach to Enhance the Stability of Moisture-Sensitive Drugs. Pharmaceutics 2023, 15, 189. [Google Scholar] [CrossRef]
  19. Xie, Y.; Yuan, P.; Heng, T.; Du, L.; An, Q.; Zhang, B.; Zhang, L.; Yang, D.; Du, G.; Lu, Y. Insight into the Formation of Cocrystal and Salt of Tenoxicam from the Isomer and Conformation. Pharmaceutics 2022, 14, 1968. [Google Scholar] [CrossRef]
  20. Birolo, R.; Bravetti, F.; Bordignon, S.; D’Abbrunzo, I.; Mazzeo, P.P.; Perissutti, B.; Bacchi, A.; Chierotti, M.R.; Gobetto, R. Overcoming the Drawbacks of Sulpiride by Means of New Crystal Forms. Pharmaceutics 2022, 14, 1754. [Google Scholar] [CrossRef]
  21. Islam, N.U.; Umar, M.N.; Khan, E.; Al-Joufi, F.A.; Abed, S.N.; Said, M.; Ullah, H.; Iftikhar, M.; Zahoor, M.; Khan, F.A. Levofloxacin Cocrystal/Salt with Phthalimide and Caffeic Acid as Promising Solid-State Approach to Improve Antimicrobial Efficiency. Antibiotics 2022, 11, 797. [Google Scholar] [CrossRef]
  22. Drozd, K.V.; Manin, A.N.; Boycov, D.E.; Perlovich, G.L. Simultaneous Improvement of Dissolution Behavior and Oral Bioavailability of Antifungal Miconazole via Cocrystal and Salt Formation. Pharmaceutics 2022, 14, 1107. [Google Scholar] [CrossRef] [PubMed]
  23. Mateescu, M.; Vlase, G.; Budiul, M.M.; Cernuşcă, B.D.; Vlase, T. Preliminary study for preparation and characterization of medicated jelly based on Ibuprofen or Ambroxol. J. Therm. Anal. Calorim. 2023, 148, 4601–4614. [Google Scholar] [CrossRef]
  24. Aslam, A.; Ashraf, M.U.; Barkat, K.; Mahmood, A.; Hussain, M.A.; Farid-ul-Haq, M.; Lashkar, M.O.; Gad, H.A. Fabrication of Stimuli-Responsive Quince/Mucin Co-Poly (Methacrylate) Hydrogel Matrices for the Controlled Delivery of Acyclovir Sodium: Design, Characterization and Toxicity Evaluation. Pharmaceutics 2023, 15, 650. [Google Scholar] [CrossRef]
  25. Vecchio, S.; Rodante, F.; Tomassetti, M. Thermal stability of disodium and calcium phosphomycin and the effects of the excipients evaluated by thermal analysis. J. Pharm. Biomed. Anal. 2001, 24, 1111–1123. [Google Scholar] [CrossRef] [PubMed]
  26. Chachorovska, M.; Petrushevski, G.; Stojanovska Pecova, M.; Ugarkovic, S.; Makreski, P. Thermal analysis assisted by spectra-structure studies of BCS class II active pharmaceutical ingredients: Ezetimibe and lercanidipine hydrochloride. The concept of preformulation. J. Therm. Anal. Calorim. 2022, 147, 8779–8790. [Google Scholar] [CrossRef]
  27. Ledeti, A.; Olariu, T.; Caunii, A.; Vlase, G.; Circioban, D.; Baul, B.; Ledeti, I.; Vlase, T.; Murariu, M. Evaluation of thermal stability and kinetic of degradation for levodopa in non-isothermal conditions. J. Therm. Anal. Calorim. 2018, 131, 1881–1888. [Google Scholar] [CrossRef]
  28. Kremer, I.; Tomić, T.; Katančić, Z.; Hrnjak-murgić, Z.; Erceg, M.; Ciprioti, S.V.; Schneider, D.R. Effect of Zeolite Catalyst on the Pyrolysis Kinetics of Multi-Layered Plastic Food Packaging. Symmetry 2022, 14, 1362. [Google Scholar] [CrossRef]
  29. Arcenegui-Troya, J.; Sánchez-Jiménez, P.E.; Perejón, A.; Pérez-Maqueda, L.A. Relevance of particle size distribution to kinetic analysis: The case of thermal dehydroxylation of kaolinite. Processes 2021, 9, 1852. [Google Scholar] [CrossRef]
  30. Rotaru, A.; Moanta, A.; Constantinescu, C.; Dumitru, M.; Manolea, H.O.; Andrei, A.; Dinescu, M. Thermokinetic study of CODA azoic liquid crystal and thin films deposition by matrix-assisted pulsed laser evaporation. J. Therm. Anal. Calorim. 2017, 128, 89–105. [Google Scholar] [CrossRef]
  31. Brown, M.E.; Maciejewski, M.; Vyazovkin, S.; Nomen, R.; Sempere, J.; Burnham, A.; Opfermann, J.; Strey, R.; Anderson, H.L.; Kemmler, A.; et al. Computational aspects of kinetic analysis Part A: The ICTAC Kinetics Project-data, methods and results. Thermochim. Acta 2000, 355, 125–143. [Google Scholar] [CrossRef]
  32. Vyazovkin, S. Computational aspects of kinetic analysis. Part C. The ICTAC Kinetics Project—The light at the end of the tunnel? Thermochim. Acta 2000, 355, 155–163. [Google Scholar] [CrossRef]
  33. Roduit, B. Computational aspects of kinetic analysis. Part E: The ICTAC Kinetics Project—Numerical techniques and kinetics of solid state processes. Thermochim. Acta 2000, 355, 171–180. [Google Scholar] [CrossRef]
  34. Verma, R.K.; Szilagyi, I.M.; Pielichowska, K.; Raftopoulos, K.N.; Šimon, P.; Melnikov, A.P.; Ivanov, D.A. Good laboratory practice in thermal analysis and calorimetry. J. Therm. Anal. Calorim. 2023, 148, 2211–2231. [Google Scholar] [CrossRef]
  35. Zou, H.; Yi, C.; Wang, L.; Liu, H.; Xu, W. Thermal degradation of poly(lactic acid) measured by thermogravimetry coupled to Fourier transform infrared spectroscopy. J. Therm. Anal. Calorim. 2009, 97, 929–935. [Google Scholar] [CrossRef]
  36. Pal, A.K.; Katiyar, V. Theoretical and analyzed data related to thermal degradation kinetics of poly (L-lactic acid)/chitosan-grafted-oligo L-lactic acid (PLA/CH-g-OLLA) bionanocomposite films. Data Br. 2017, 10, 304–311. [Google Scholar] [CrossRef]
  37. Guigo, N.; Sbirrazzuoli, N.; Vyazovkin, S. Gelation on heating of supercooled gelatin solutions. Macromol. Rapid Commun. 2012, 33, 698–702. [Google Scholar] [CrossRef]
  38. Zhao, L.; Ding, L.; Wei, X. Determination of moxonidine in human plasma by liquid chromatography- electrospray ionisation-mass spectrometry. J. Pharm. Biomed. Anal. 2006, 40, 95–99. [Google Scholar] [CrossRef]
  39. Zhang, Q.; Chu, M.F.; Li, Y.H.; Li, C.H.; Lei, R.J.; Wang, S.C.; Xiao, B.J.; Yang, J.G. Quantitative analysis by reversed-phase high-performance liquid chromatography and retinal neuroprotection after topical administration of moxonidine. Int. J. Ophthalmol. 2020, 13, 390–398. [Google Scholar] [CrossRef]
  40. Filipic, S.; Shenger, M.S.M.; Nikolic, K.; Agbaba, D. Determination of Moxonidine and Its Impurities by Thin-Layer Chromatography. J. Liq. Chromatogr. Relat. Technol. 2015, 38, 1121–1125. [Google Scholar] [CrossRef] [Green Version]
  41. Otašević, B.; Milovanović, S.; Zečević, M.; Golubović, J.; Protić, A. UPLC method for determination of moxonidine and its degradation products in active pharmaceutical ingredient and pharmaceutical dosage form. Chromatographia 2014, 77, 109–118. [Google Scholar] [CrossRef]
  42. Milovanović, S.; Otašević, B.; Zečević, M.; Živanović, L.; Protić, A. Development and validation of reversed phase high performance liquid chromatographic method for determination of moxonidine in the presence of its impurities. J. Pharm. Biomed. Anal. 2012, 59, 151–156. [Google Scholar] [CrossRef] [PubMed]
  43. Filipic, S.; Elek, M.; Popović, M.; Nikolic, K.; Agbaba, D. Development of Hydrophilic Interaction Liquid Chromatography Method for the Analysis of Moxonidine and Its Impurities. J. Anal. Methods Chem. 2016, 2016, 3715972. [Google Scholar] [CrossRef] [PubMed] [Green Version]
  44. Allada, R.; Maruthapillai, A.; Devikala, S.; Pallepogu, R. Hydrated moxonidine saccharinatesalt: Synthesis, Characterization, Crystal structure determination and dissolution enhancement. Mater. Today Proc. 2019, 14, 618–629. [Google Scholar] [CrossRef]
  45. Vyazovkin, S.; Achilias, D.; Fernandez-Francos, X.; Galukhin, A.; Sbirrazzuoli, N. ICTAC Kinetics Committee recommendations for analysis of thermal polymerization kinetics. Thermochim. Acta 2022, 714, 179243. [Google Scholar] [CrossRef]
  46. Stuart, B.H. Infrared Spectroscopy: Fundamentals and Applications; John Wiley & Sons: Hoboken, NJ, USA, 2004; ISBN 0470011130. [Google Scholar]
  47. Silverstein, R.M.; Webster, F.X.; Kiemle, D. Spectrometric Identification of Organic Compounds, 7th ed.; John Wiley & Sons: Hoboken, NJ, USA, 2005; ISBN 9781118311653. [Google Scholar]
  48. Coates, J. Interpretation of Infrared Spectra, A Practical Approach. In Encyclopedia of Analytical Chemistry; Meyers, R.A., McKelvy, M.L., Eds.; John Wiley & Sons: Hoboken, NJ, USA, 2006; ISBN 9780470027318. [Google Scholar] [CrossRef]
  49. Moxonidine (Compound) on PubChem. Available online: https://pubchem.ncbi.nlm.nih.gov/compound/Moxonidine#section=Melting-Point (accessed on 22 March 2023).
  50. Moxonidine (Compound) on DrugBank. Available online: https://go.drugbank.com/drugs/DB09242 (accessed on 22 March 2023).
  51. Moxonidine (Compound) on AKSci. Available online: https://aksci.com/item_detail.php?cat=K289 (accessed on 22 March 2023).
  52. Duswalt, A.A. The practice of obtaining kinetic data by differential scanning calorimetry. Thermochim. Acta 1974, 8, 57–68. [Google Scholar] [CrossRef]
  53. Lu, W.-Y.; Lin, W.-C.; Huang, A.-C.; Shu, C.-M. Determination of the ambience duration of lavender essential oil with three perfume fixatives using the thermokinetics approach. J. Therm. Anal. Calorim. 2022, 147, 7551–7561. [Google Scholar] [CrossRef]
  54. Friedman, H.L. Kinetics of thermal degradation of char-forming plastics from thermogravimetry. Application to a phenolic plastic. J. Polym. Sci. 1964, 6, 183–195. [Google Scholar] [CrossRef]
  55. Flynn, J.H.; Wall, L.A. A quick, direct method for the determination of activation energy from thermogravimetric data. J. Polym. Sci. Part B Polym. Lett. 1966, 4, 323–328. [Google Scholar] [CrossRef]
  56. Ozawa, T.A. New Method of Analyzing Thermogravimetric Data. Bull. Chem. Soc. Jpn. 1965, 38, 1881–1886. [Google Scholar] [CrossRef] [Green Version]
  57. Vyazovkin, S. Isoconversional kinetics. In Handbook of Thermal Analysis and Calorimetry, Vol. 5: Recent Advances, Techniques and Applications; Brown, M.E., Gallagher, P.K., Eds.; Elsevier: Amsterdam, The Netherlands, 2008; pp. 503–538. [Google Scholar]
  58. Budrugeac, P.; Cucos, A. Application of Kissinger, isoconversional and multivariate non-linear regression methods for evaluation of the mechanism and kinetic parameters of phase transitions of type I collagen. Thermochim. Acta 2013, 565, 241–252. [Google Scholar] [CrossRef]
  59. Budrugeac, P.; Criado, J.M.; Gotor, F.J.; Malek, J.; Pérez-Maqueda, L.A.; Segal, E. On the evaluation of the nonisothermal kinetic parameters of (GeS2)0.3(Sb2S3 )0.7 crystallization using the IKP method. Int. J. Chem. Kinet. 2004, 36, 309–315. [Google Scholar] [CrossRef]
Figure 1. Chemical structure of moxonidine (4-chloro-N-(4,5-dihydro-1H-imidazol-2-yl)-6-methoxy-2-methylpyrimidin-5-amine).
Processes 11 01738 g001
Figure 2. FTIR spectra for MOX, MOXTAB, and MOXMIX.
Processes 11 01738 g002
Figure 3. Thermoanalytical data (TG/DTG/HF) recorded for MOX in dynamic air atmosphere at β = 10 °C·min−1.
Processes 11 01738 g003
Figure 4. Thermoanalytical data (TG/DTG/HF) recorded for MOXTAB in dynamic air atmosphere at β = 10 °C·min−1.
Processes 11 01738 g004
Figure 5. Thermoanalytical data (TG/DTG/HF) recorded for MOXMIX in dynamic air atmosphere at β = 10 °C·min−1.
Processes 11 01738 g005
Figure 6. The plot according to the ASTM E698 kinetic method with the estimated activation energy for: (a) MOX; (b) MOXTAB; and (c) MOXMIX.
Processes 11 01738 g006
Table 1. Mathematical models of the integral method of FWO and the differential method of FR.
MethodLinearized FormPlotting
FWO ln β = ln A · E a R · g α 5.331 1.052 · E a R · T ln β  vs. (1/T)
FR ln β d α dT = ln A · f α E a R · T ln β d α dT  vs. (1/T)
Table 2. Temperature interval according to DTG curves for the degradation process that was investigated by kinetic analysis.
Heating Rate β (°C·min−1)DTG Temperature Interval (°C) for Kinetic Analysis of Samples
MOXMOXTABMOXMIX
5174–244187–243150–227
7175–247190–248154–231
10175–253193–254165–241
15176–260199–259168–243
Table 3. Ea values vs. conversion degree α obtained by the two isoconversional methods and the mean value of Ea for MOX, MOXTAB, and MOXMIX.
Compoundα0.050.10.150.20.250.30.350.40.450.50.550.60.650.70.750.80.850.90.95 E a ¯
(kJ·mol−1)
MOXFWO98.8102.8103.4103.5103.3103.0102.6102.1101.6101.2100.8100.6100.3100.099.699.399.198.9106.4101.4 ± 0.5
FR127.7118.2106.995.292.689.386.685.184.584.083.682.481.380.881.387.594.6100.6115.293.6 ± 3.2
MOXTABFWO201.0185.9180.1179.2173.2186.7181.8178.2174.8171.8170.0168.9167.3165.3164.4163.2162.6163.7163.1173.7 ± 2.4
FR164.1113.7133.8144.8148.1139.1143.9146.1143.4144.3159.9157.3150.0140.9162.1152.2161.5164.6167.3149.3 ± 3.0
MOXMIXFWO141.6143.3142.7147.0152.0151.7150.4149.3148.1147.0146.0145.0143.5142.5141.5137.6133.8132.2129.6143.4 ± 1.5
FR164.7126.1157.1154.0157.1144.5137.7137.9137.7136.6138.1134.5131.1140.9112.497.6122.1121.8121.2135.4 ± 3.8
Disclaimer/Publisher’s Note: The statements, opinions and data contained in all publications are solely those of the individual author(s) and contributor(s) and not of MDPI and/or the editor(s). MDPI and/or the editor(s) disclaim responsibility for any injury to people or property resulting from any ideas, methods, instructions or products referred to in the content.

