Article

Numerical Simulation of Dynamic Variation Characteristics of Particles in a Rolling Fluidized Bed

1
School of Chemical Engineering, Hebei University of Technology, Tianjin 300132, China
2
National and Local Joint Laboratory of Chemical Energy Saving Process Integration and Resource Utilization, Tianjin 300130, China
*
Authors to whom correspondence should be addressed.
Processes 2023, 11(6), 1696; https://doi.org/10.3390/pr11061696
Submission received: 8 May 2023 / Revised: 25 May 2023 / Accepted: 28 May 2023 / Published: 1 June 2023
(This article belongs to the Special Issue Multiphase Flows and Particle Technology)

Abstract

:
When transplanting the gas–solid fluidized bed technology to the offshore floating platform, the gas–solid flow characteristics in the bed will be affected by the rolling of the platform. In this paper, the flow field, especially the dynamic variation characteristics of the particles, in a two-dimensional rolling fluidized bed, is investigated using the numerical simulation method. The results show that when the bed is in an inclined position, the gas/particle phases gather in the upper/lower wall region of the inclined bed. During the rolling process of the bed, this behavior results in a periodic change in the gas–solid flow state near the wall region, forming an overall particle internal circulation flow mode of ‘upward flow rate in the upper wall region and downward flow rate in the lower wall region’. The solid holdup in the lower wall region fluctuates at a low amplitude around high values, with a corresponding downward solid flow rate. Meanwhile, the upper wall region has a high frequency and amplitude of solid holdup fluctuations and a corresponding upward solid flow rate. In addition, affected by the Coriolis force, a ‘lag phenomenon’ appears when the inclination angle decreases, compared with the instantaneous inclination angle increase stage. It is anticipated that this paper will provide theoretical guidance for the engineering application of the fluidized bed on the offshore floating platform.

1. Introduction

With the decrease in land oil/gas reserves and the increase in actual demand, it is of great strategic significance to promote the development of marine oil and gas resources to ensure energy security. The construction and application of offshore floating platforms represented by FPSO (Floating Production Storage and Offloading) has shown a significant growth trend in recent years. Because of its advantages of strong adaptability to sea conditions and flexible movement, it can be easily used for the development of marginal oil fields [1]. From the existing main functions of FPSO, it is mainly used as a platform for the production, processing, storage and transportation of marine oil/gas resources. Combined with the future development needs of the marine field, the floating platform also provides a platform for the application of land-based resource utilization and environmental protection technology [2], or the development and utilization of new technologies based on the characteristics of marine resources and environment [3]. On land, the gas–solid fluidized bed is widely used in petroleum and mineral processing, solid waste treatment and other fields [4]. If the gas–solid fluidized bed technology is transplanted to the floating offshore platform, on the one hand, it can expand the function of the platform and enhance the development and utilization of marine resources. On the other hand, it can also open up a new method for the reduction, recycling and harmless treatment of these solid wastes. Thus, the dual functions of marine resource utilization and environmental protection can be realized in the process of marine development.
In the existing resource processing or environmental protection technologies for offshore floating platforms, the multiphase flow processes studied in the past are mostly gas–liquid or gas–liquid–solid systems, e.g., the packed bed scrubbers for offshore CO2 capture [5], the trickle bed reactors for offshore crude oil catalytic hydrogenation pretreatment or Fischer–Tropsch synthesis [6], the packed bed reactors for offshore natural gas purification [7] and the heat exchangers for low-temperature liquefaction of natural gas on offshore platforms [8]. However, there is relatively little research on the gas–solid systems. From the existing research results of the gas–solid system, it can be seen that in the marine environment, affected by the wave motion, the fluidized bed above the floating platform will also undergo the motions of ups, downs, translation and rolling. In particular, the rolling motion of the platform has the greatest influence on the gas–solid flow [9]. This results in the temporal and spatial dynamic changes of the flow field parameters, which show many characteristics that are different from conventional land devices.
Based on the fact that the rolling motion has the greatest influence on the multiphase flow in the various forms of motion of the floating platform, the research on the gas–solid fluidized bed under the existing rolling condition can be summarized into the following three aspects:
(1)
Research on gas–solid dense phase fluidized bed for marine fluidized bed boiler
In the context of the ‘energy crisis’ in the 1980s, the researchers represented by Japanese scholars tried to replace oil with coal on marine fuel, and carried out exploration and research on marine fluidized bed boilers. In the study of the gas–solid flow, Yasui [10] found in the study of shallow beds that the bed interface will tilt according to the axis of the device under the rolling condition, and the phenomenon of uneven fluidization will occur in the bed. When the fluidized bed is in an instantaneous incline attitude, bubble aggregation behavior will occur near the low material surface of the upper wall of the inclined bed, and the particles will aggregate to the high material surface of the lower wall. Nishi [11] studied the dynamic pressure drop of the bed rolling process. The results show that the bed pressure drop has periodic variation characteristics with the reciprocating motion of the bed. The average pressure drop is the smallest when the bed is rolling close to the maximum inclination angle, and the largest when the bed is upright. The experimental results of pulverized coal combustion in a marine fluidized bed boiler show that [12,13], only under the condition of a persistent incline, the above gas–solid flow characteristics will cause the bed combustion efficiency to decrease to a certain extent. Under the condition of continuous rolling, the combustion efficiency and temperature distribution in the bed are the same as those in the conventional upright fluidized bed. Based on the above research results, the rolling motion has a certain influence on the fluidization quality in the fluidized bed.
(2)
Study on gas–solid circulating fluidized bed for marine diesel engine exhaust purification and waste heat utilization
In recent years, in response to increasingly stringent environmental requirements, researchers represented by Japan and China carried out research on gas–solid circulating fluidized beds for marine diesel engine exhaust purification and waste heat utilization. The research conducted by Murata [14] shows that under the condition of rapid fluidization, the flow field parameters still have obvious spatial and temporal dynamic characteristics when the bed rolls. Under the instantaneous inclined attitude, the phenomena of gas accumulation and gas–solid separation are more prominent than those of the dense phase fluidized bed. Zhao [15,16,17] pointed out that the characteristics of the dispersed phase (particle agglomerates) in the circulating fluidized bed under the rolling condition are also different from those under the upright condition. The combined force of the gravity component and the additional inertial force controls the radial distribution behavior of the particles. As the particles are accelerated by high-speed airflow, the particle velocity increases along the axial direction of the bed, and the influence of the inertial force also increases. The radial movement of the particles becomes severe, which makes the heat transfer coefficient between the particles and the wall significantly improved.
(3)
Research on gas–solid dense phase fluidized bed for offshore floating platform oil and gas resource processing and solid waste treatment
Recently, in order to meet the needs of resource processing technology for offshore floating platforms, our research group carried out the research of the gas–solid dense phase fluidized bed in the early stage. Studies [18,19] have shown that, in the case of increasing bed height–diameter ratio, the typical gas–solid flow state in the rolling fluidized bed can be divided into five flow regions, as shown in Figure 1. Among them, the fixed bed region mainly exists in the case of a large inclination angle or a low gas velocity. In other cases, the particles are mostly in the downward moving bed state near the lower wall of the inclined bed. The particles in the bed form an internal circulation process of the ‘I-IV-V-III-I’ route.
Based on the existing research on the rolling fluidized bed, it can be seen that there is a great application potential to transplant the gas–solid fluidized bed technology to the offshore floating platform. Researchers have obtained a certain understanding of the macroscopic or time-averaged flow characteristics of the rolling fluidized bed. At the same time, it should also be noted that the coordination between the ‘gas–solid flow dynamic change + bed dynamic change’ has high requirements for an accurate experimental measurement, and it is difficult to accurately track and measure the parameter changes in the process of particle dynamic change. Numerical simulation technology is an effective means to make up for the above experimental deficiencies. Through numerical simulation research, it is expected to gain a deep understanding of the dynamic characteristics of the gas–solid flow in a rolling fluidized bed.

2. Numerical Simulation

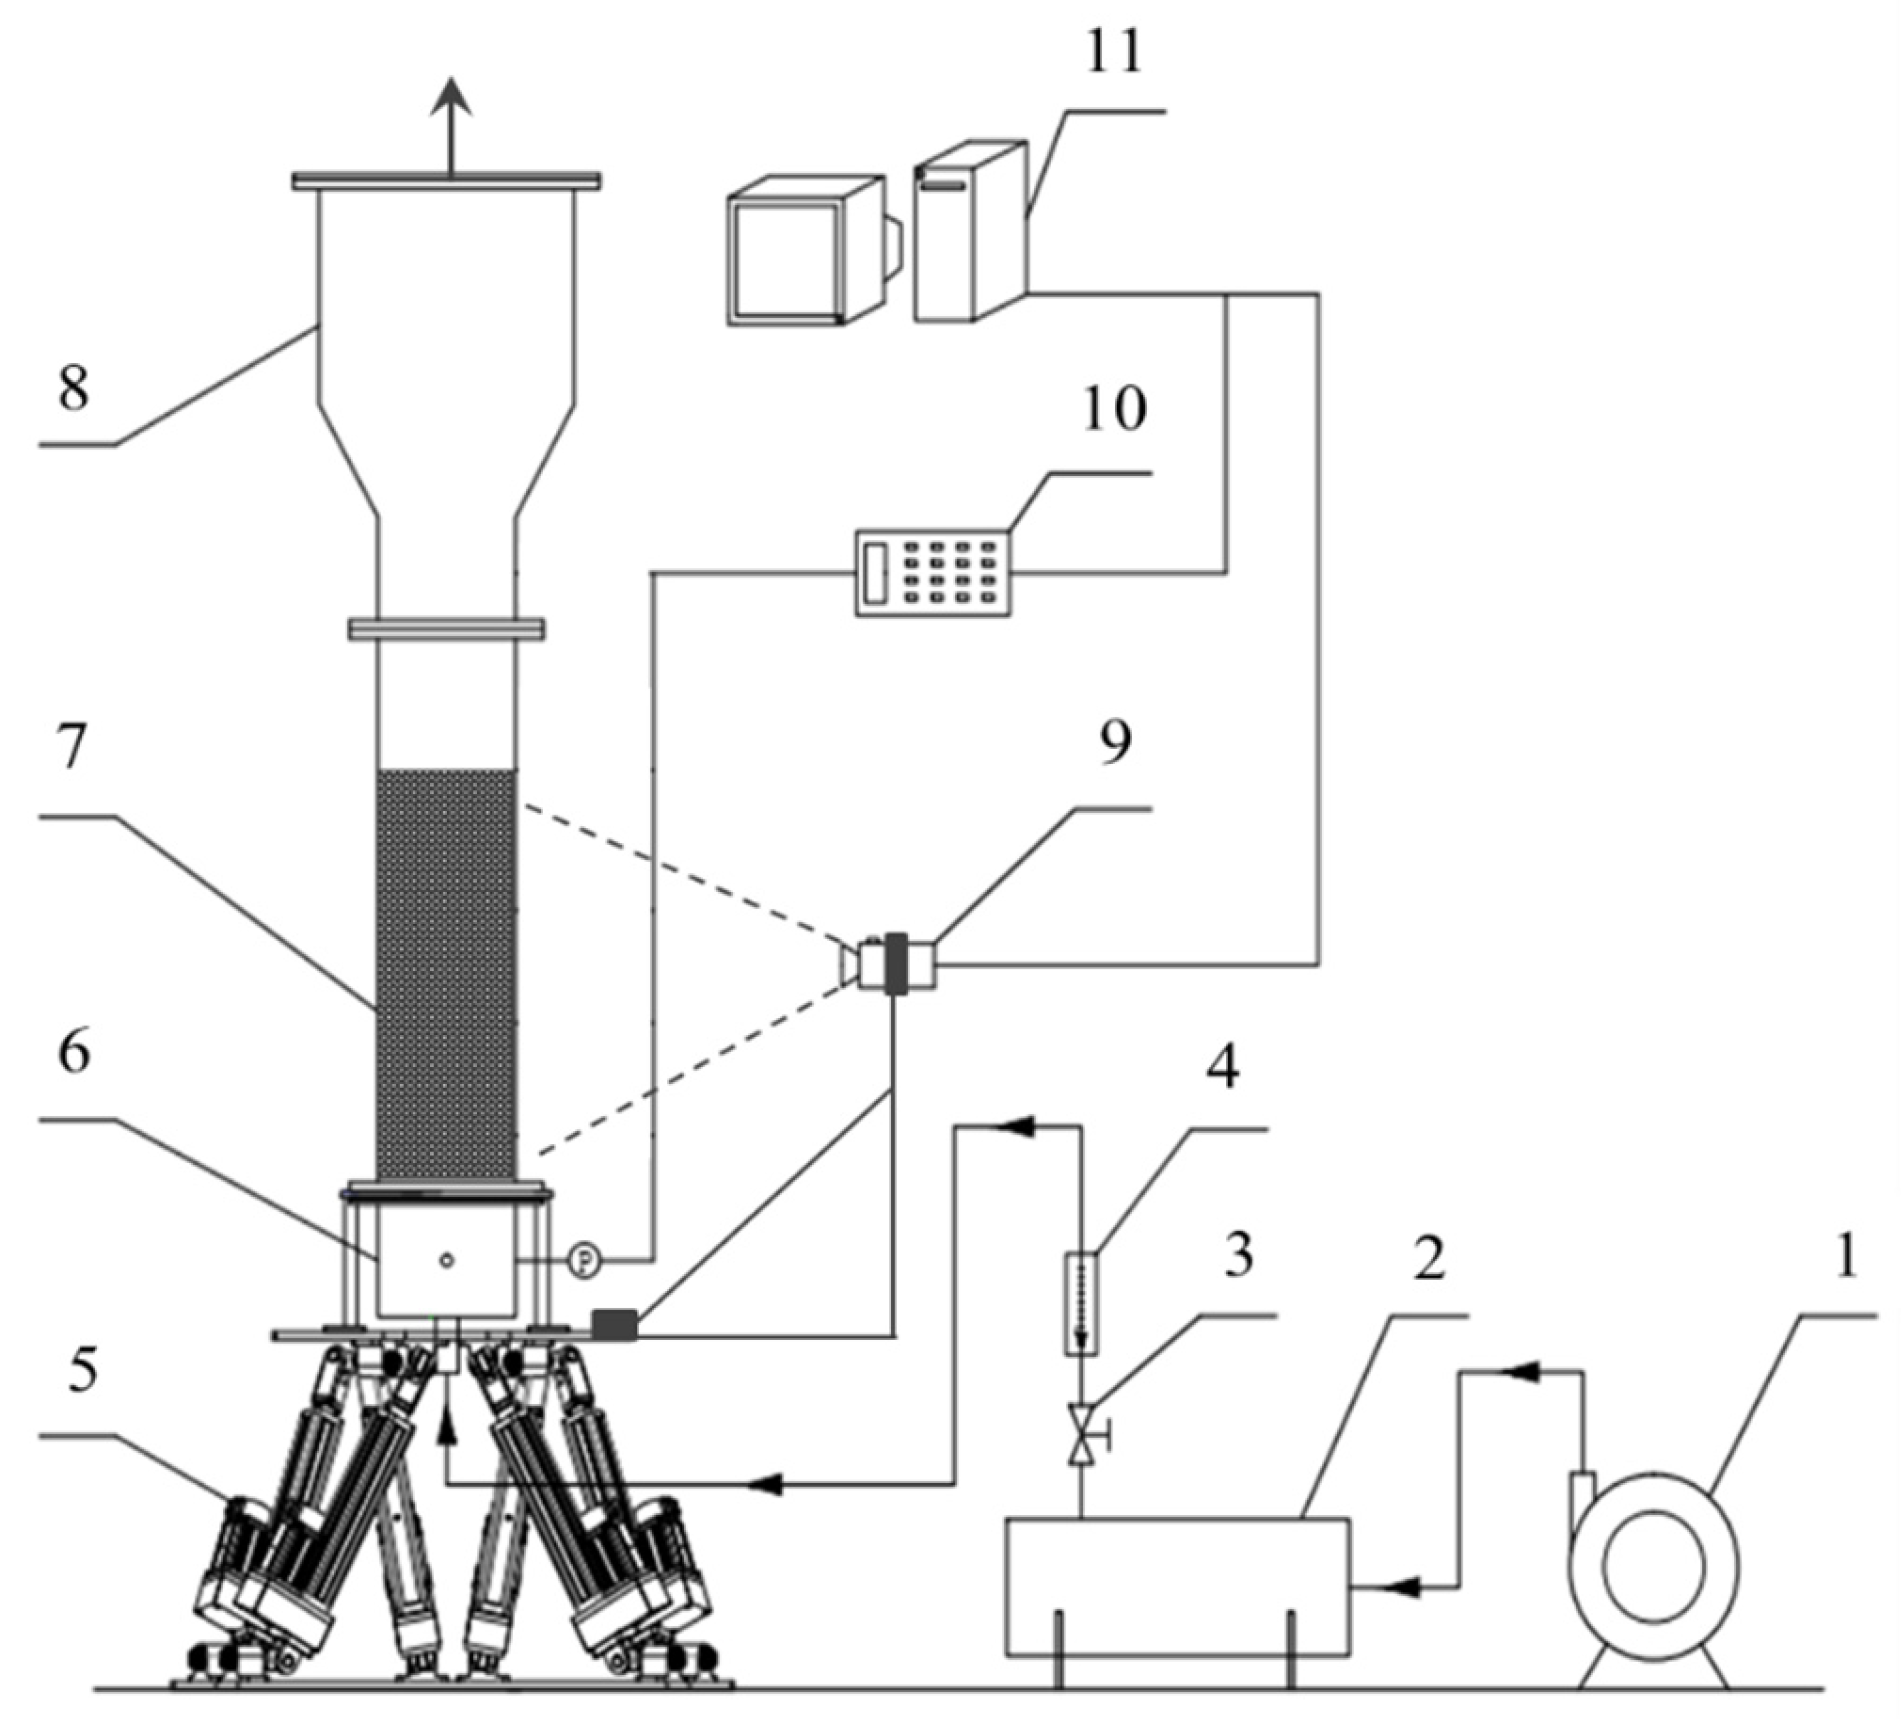
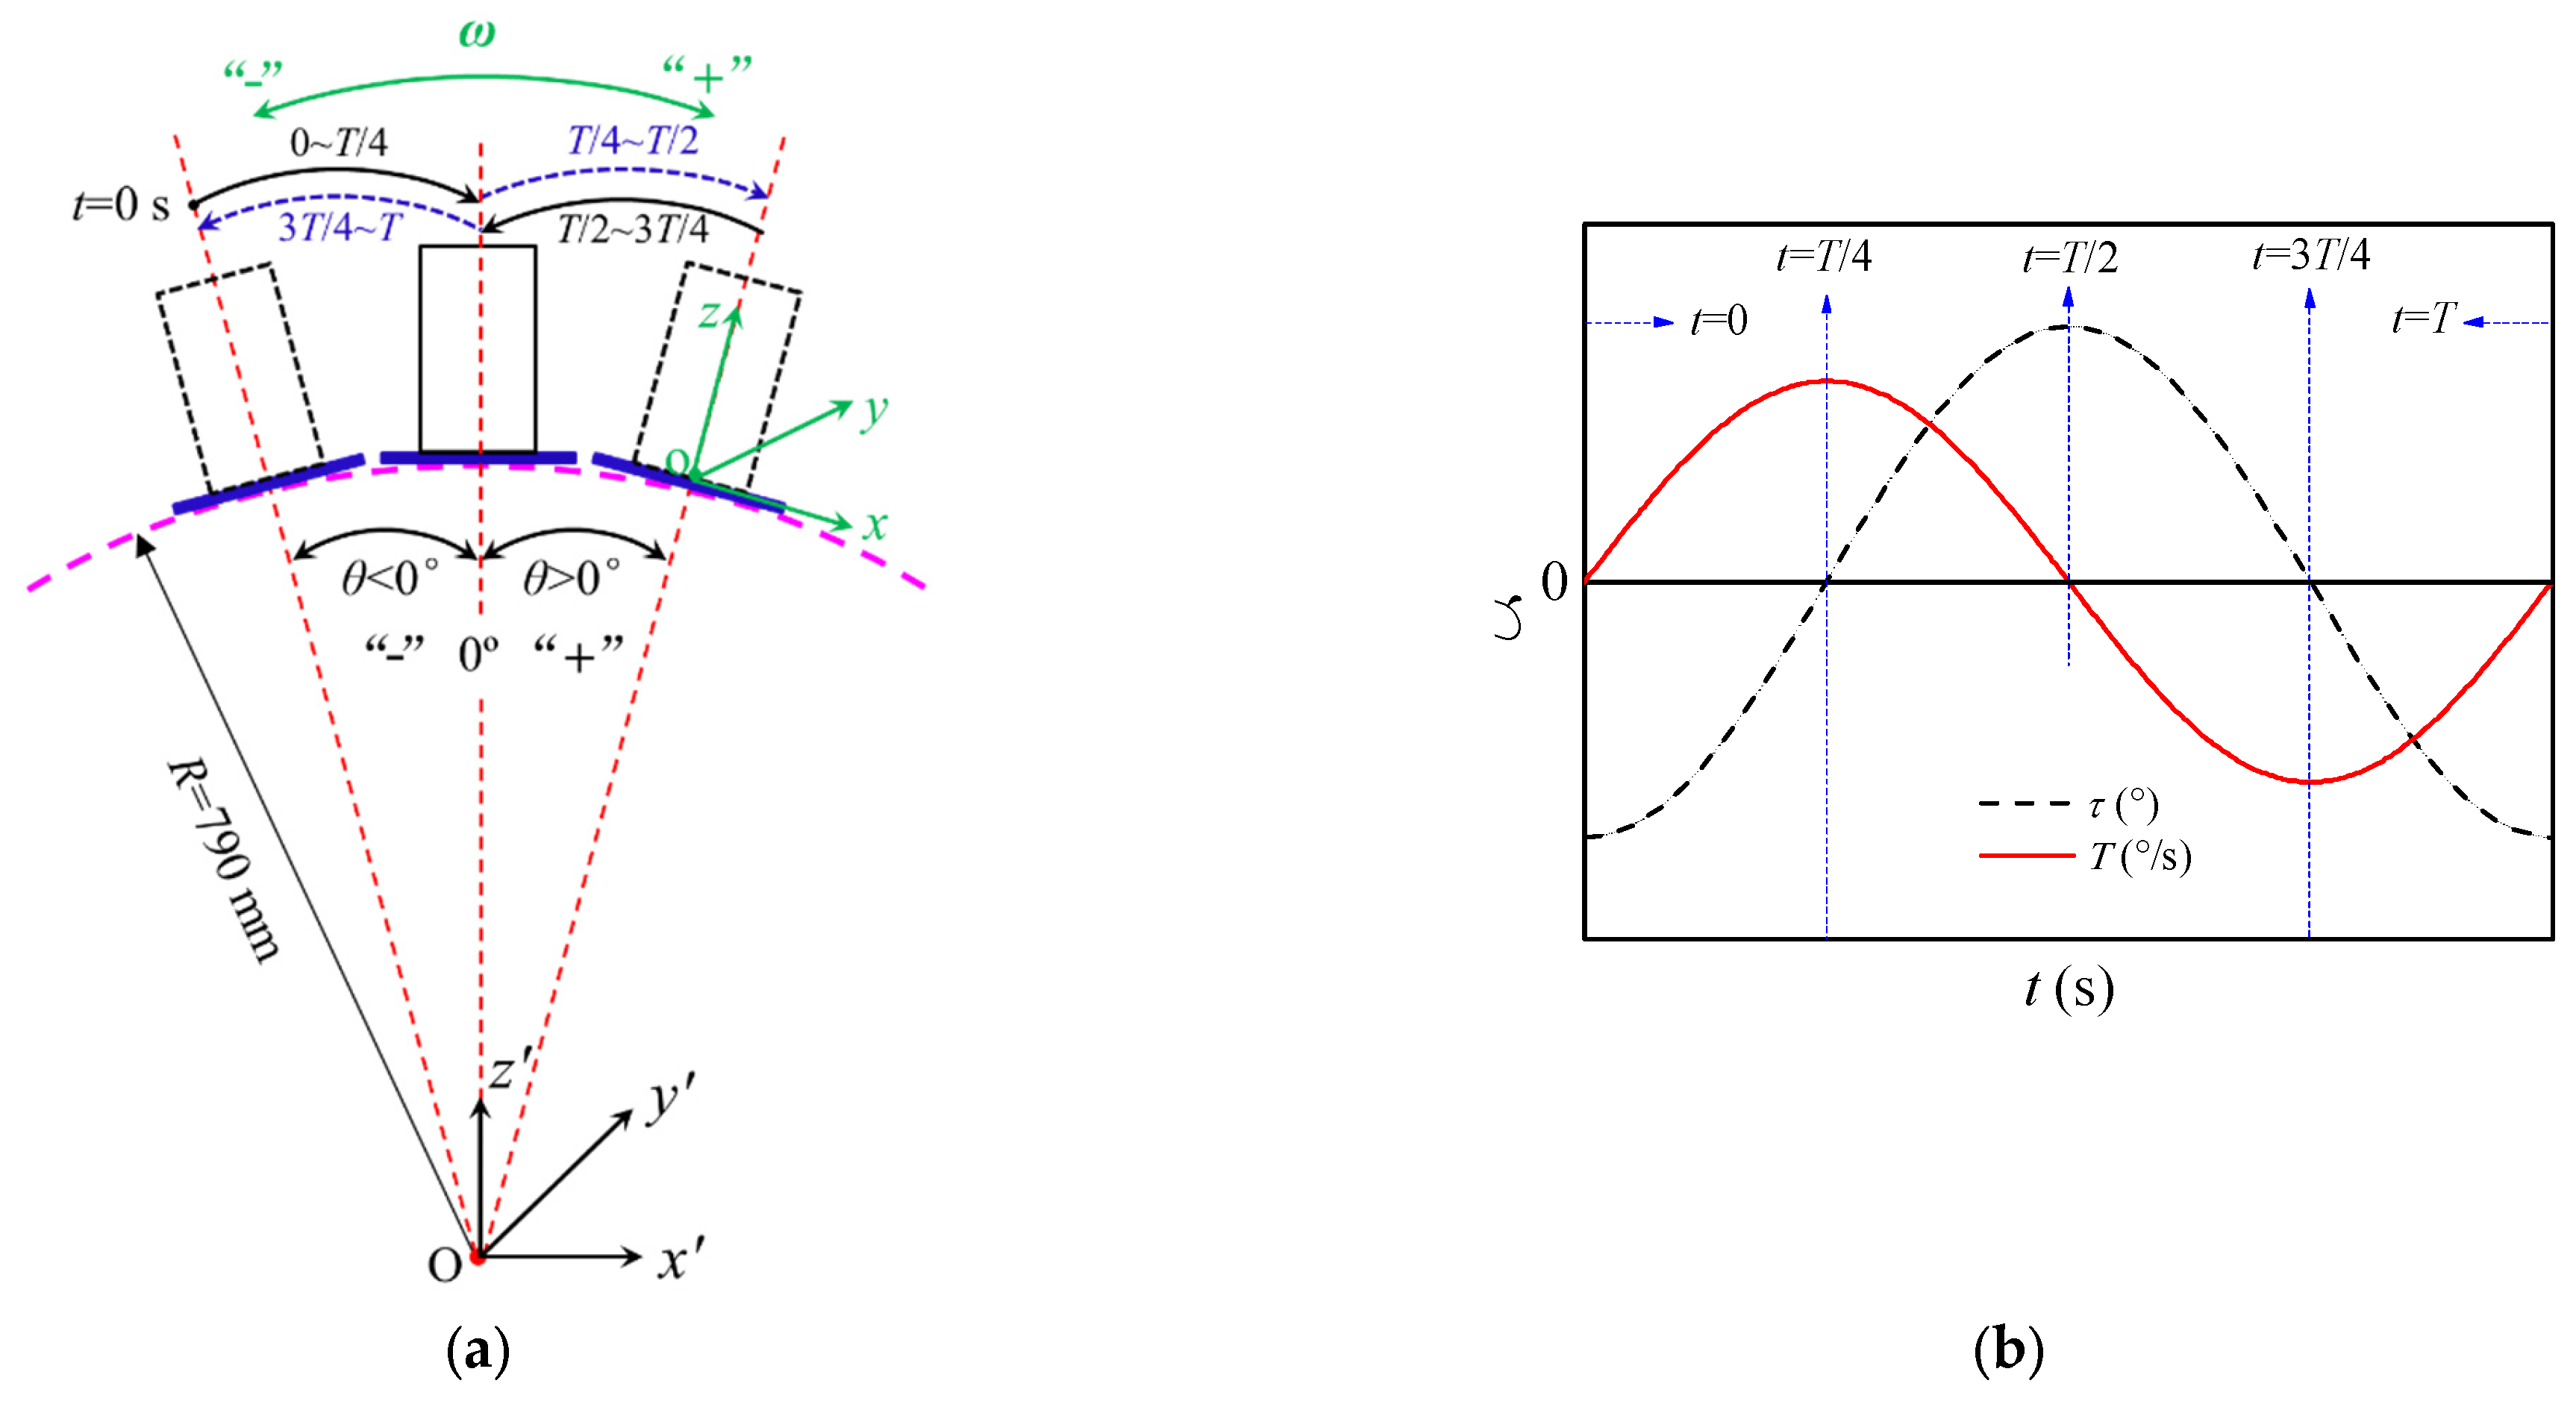
2.1. Experimental Devices and Process

The rolling fluidized bed in reference [18] was selected as the simulation object, as shown in Figure 2. The experimental device mainly includes the following four parts: conveying and metering system, rolling platform, fluidized bed body, pressure signal acquisition and image recording system.
The instantaneous inclination angle and instantaneous angular velocity of the bed posture with the rolling change can be calculated using Equations (1) and (2), respectively. The curve change characteristics of Θ and ω in a single rolling period are shown in Figure 3b.
θ t = Θ sin 2 π T t π 2
ω t = 2 π T Θ cos 2 π T t π 2
According to Figure 3a,b, in a single rolling period, the rolling process can be divided into four stages, and the motion characteristics are as follows: (1) t = 0~T/4, the bed rolls to the right from the left maximum inclination angle, and the angular velocity increases gradually with the decrease in the inclination angle; (2) t = T/4~T/2, the bed rolls from the upright posture to the right, the angular velocity gradually decreases, and the inclination angle in the relative vertical direction gradually increases; (3) t = T/2~3T/4, the bed rolls to the left from the right side of the maximum inclination angle, the angular velocity increases gradually, and the inclination angle in the relative vertical direction decreases gradually; (4) t = 3T/4~T, the bed rolls from the upright posture to the left, and the angular velocity gradually decreases with the increase in the inclination angle. According to the above motion law, the bed body continuously carries out the dynamic conversion of the ‘incline-upright-incline’ attitude during the rolling process.

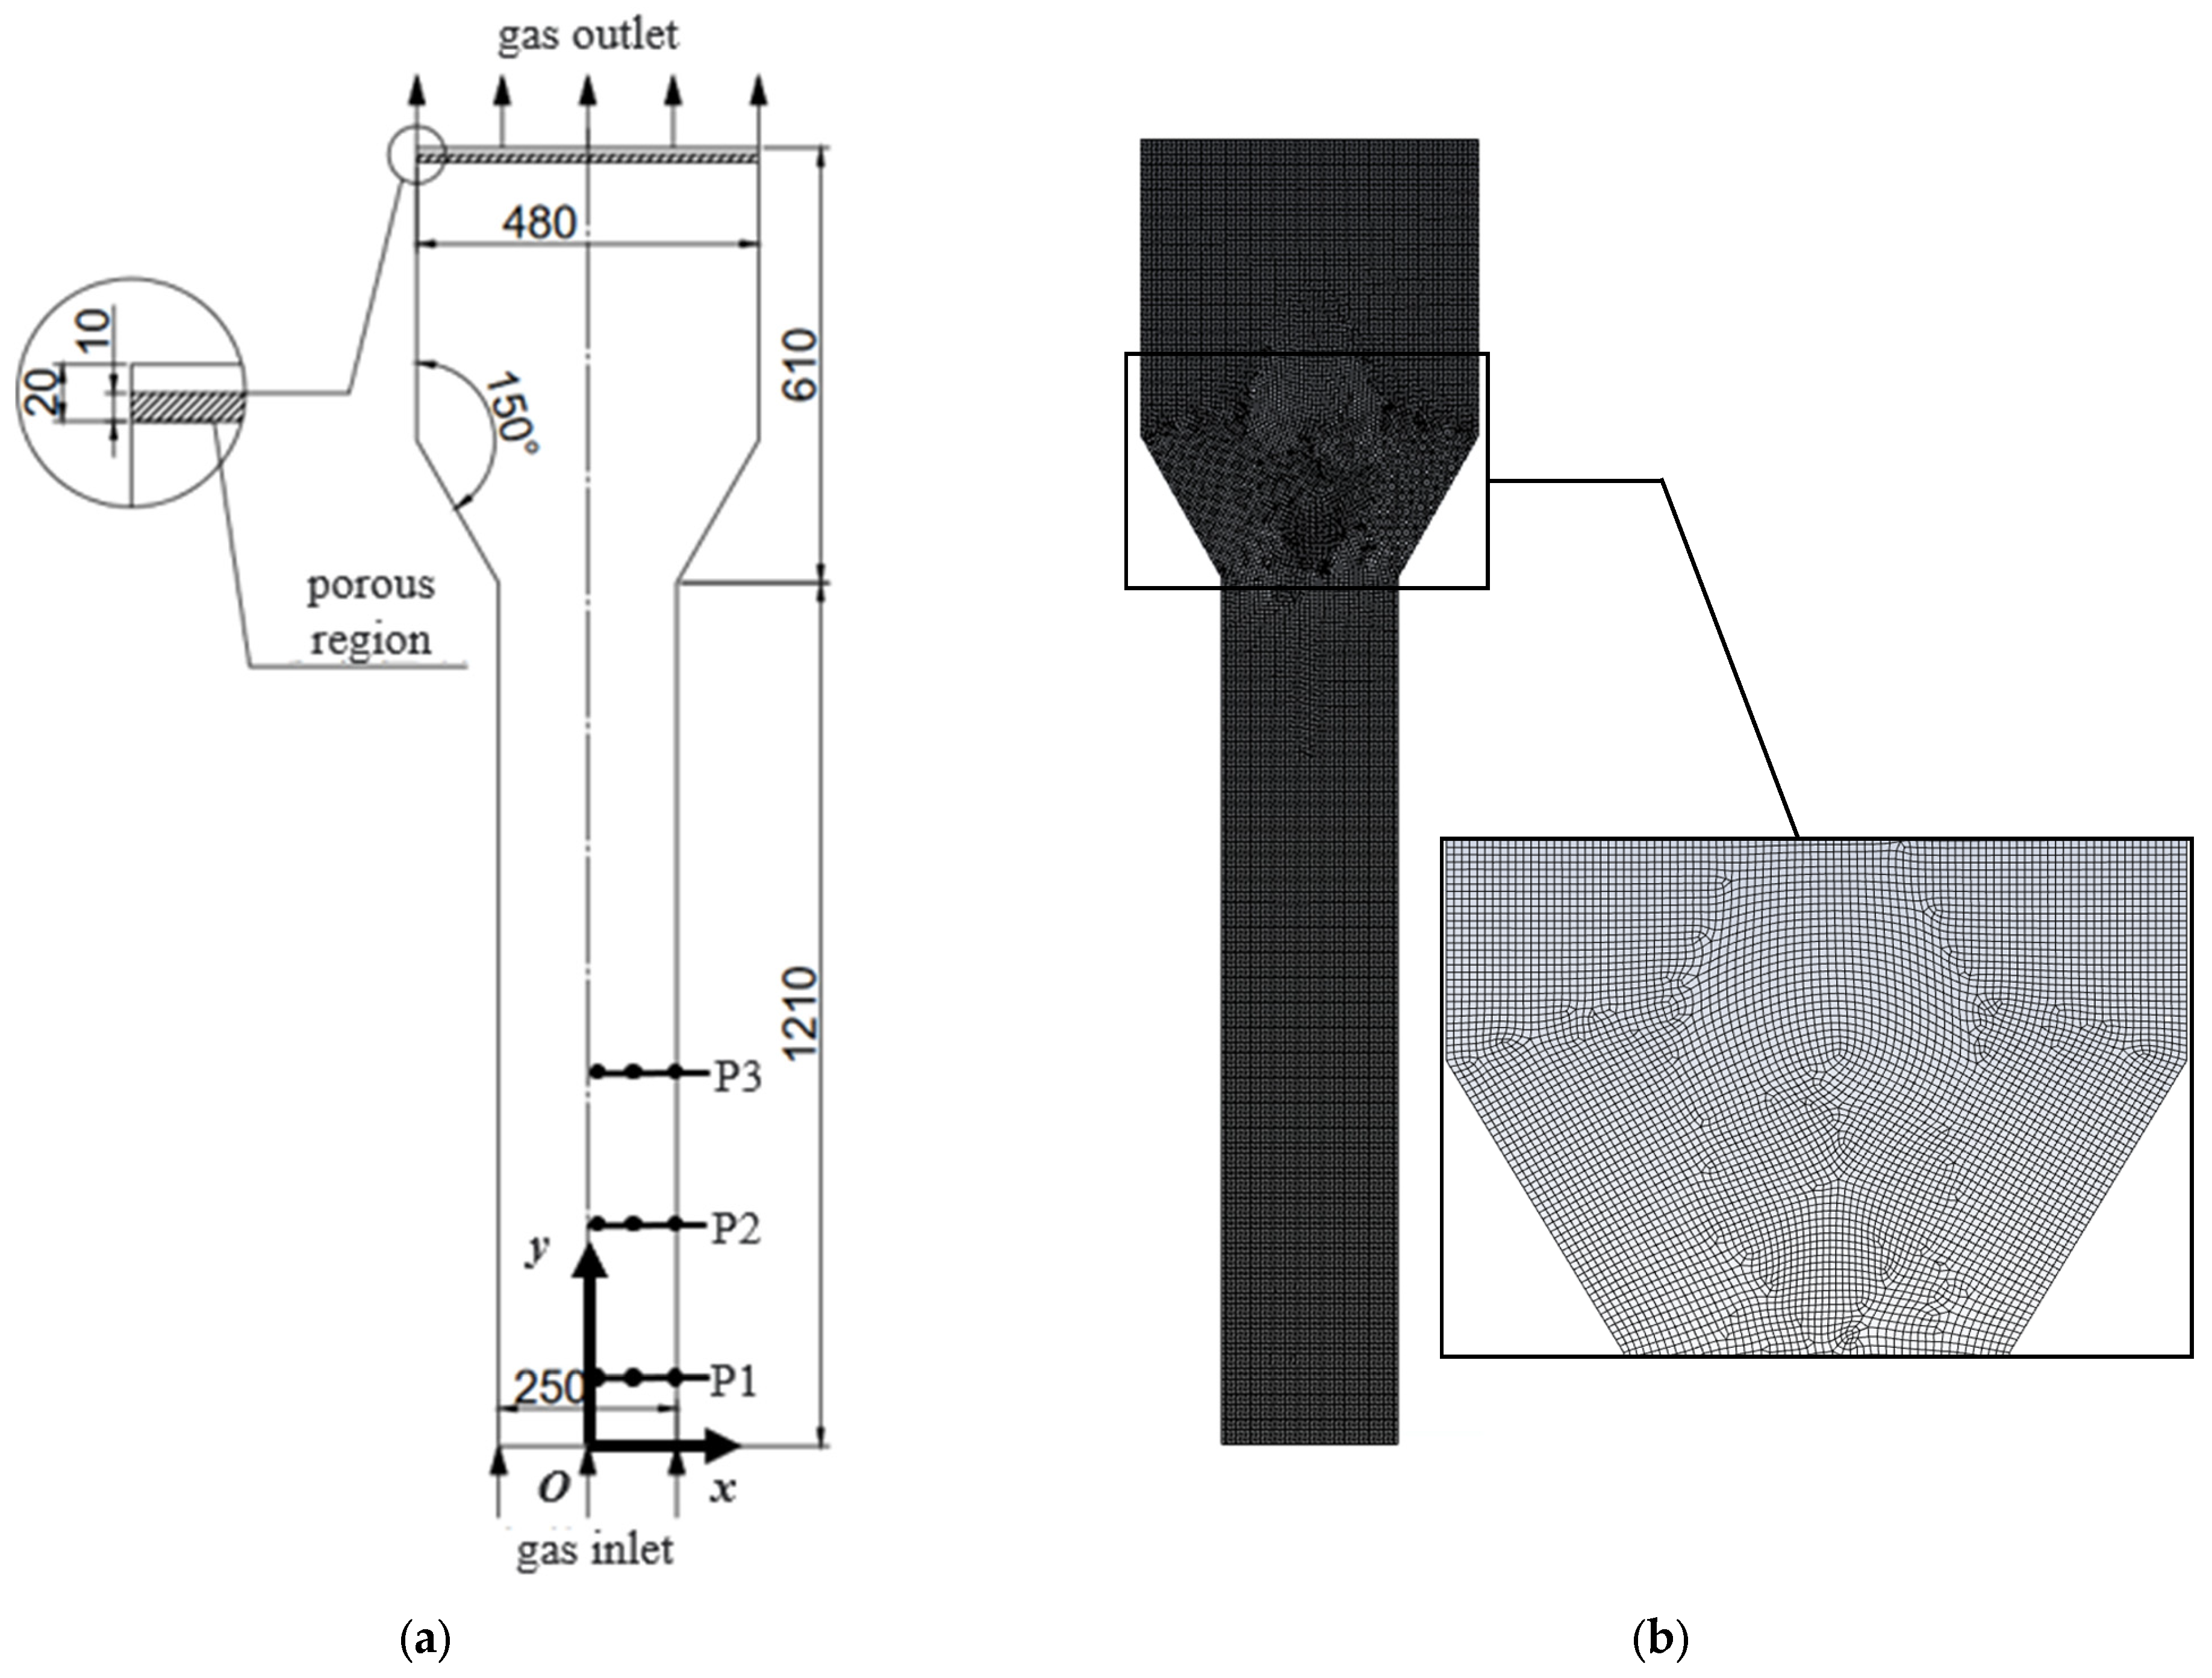
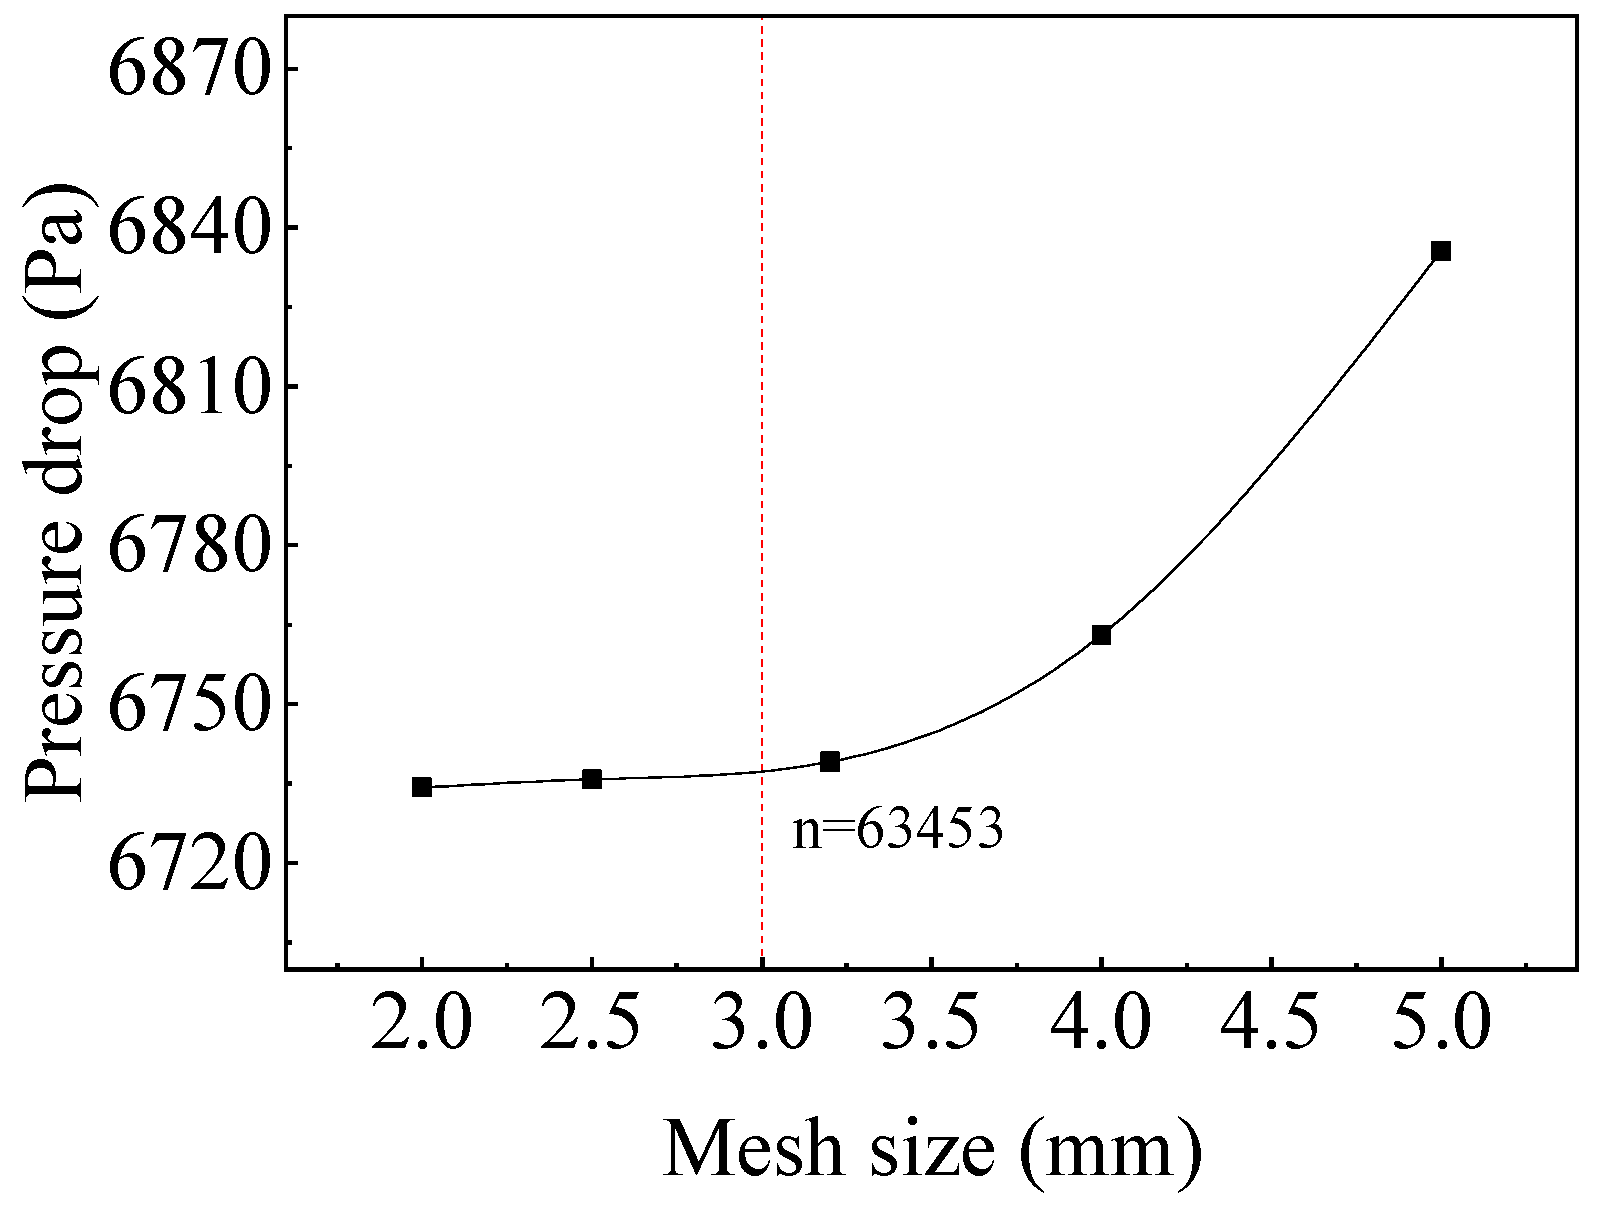
2.2. Modeling and Meshing

The Gambit 2.4.6 software was used for physical modeling and meshing. As shown in Figure 4a, the gas flow space inside the fluidized bed is selected as the calculation domain. The bed thickness is 25 mm (the same thickness as the expanding part). The size of the left, right, upper and lower two-dimensional space is 250 mm × 1210 mm, and the overall size of the settlement section containing the expanding part is 480 mm × 610 mm. Considering the time cost of the simulation calculation, the rectangular bed is simplified into a two-dimensional model. At the same time, a porous region is set at the upper end of the bed, which is used to prevent the particles from flowing out of the bed. The size of the porous region is 480 mm × 10 mm. The quadrilateral mesh and pave method is applied, as shown in Figure 4b.
As shown in Figure 4a, the data extraction is performed on these points of the axial position P1-P3 to analyze the particle motion parameters at different positions in the bed. In order to facilitate the description, each point is represented in (x/X, h), where x/X represents the dimensionless position of the transverse measuring point of the bed, x represents the x value of the position of the measuring point, X represents the distance between the two-dimensional bed side wall and the center line and h represents the axial height of the bed measuring point.
Nine measuring points are selected to monitor the dynamic characteristic parameters. Referring to the initial bed height, three axial positions of h = 0.11, 0.31 and 0.51 are chosen here. For each axial position, three horizontal positions of x/X = 0, 0.5 and 1 are selected to study the horizontal distribution of the flow field in the rolling fluidized bed.

2.3. Numerical Method and Model

In this paper, the Euler–Euler two-fluid model is used to simulate the subsequent simulation using the Fluent 6.3.26 software. The mass and momentum equations are shown in Equations (3) and (4), where the subscript i = g, s represents the gas phase (g) and solid phase (s), respectively; ρ is density; ε is the volume fraction; u is the superficial gas velocity; j = g, s, ji; Kgs is the interphase drag coefficient; f is the gravity control function, which can realize the rolling bed by adjusting the direction and magnitude of gravity and τ ¯ ¯ represents the stress–strain tensor, which can be calculated using Equation (5).
ρ i ε i t + ρ i ε i u i = 0
ε i ρ i u i t + ε i ρ i u i u i = ε i p K g s u i u j + τ i ¯ ¯ + ε i ρ i f
τ i ¯ ¯ = ε i μ i u i + u i T + ε i λ i 2 3 μ i u i I ¯ ¯
The particles investigated in this paper are Geldart B particles. Referring to the previous studies [20,21,22], the gas–solid interaction force is calculated using the Gidaspow model, as shown in Equation (6). Meanwhile, according to the research conducted by Enwald [23], the laminar flow model is used for calculation.
K g s = 3 ε s ε g 1.65 ρ g 4 d p C D u s u g , ε g > 0.8 150 ε s 1 ε g μ g ε g d p 2 + 1.75 ε s ρ g u s u g d p , ε g 0.8
C D = 24 α g Re s 1 + 0.15 ε g Re s 0.687 , Re s 1000 0.44   , Re s > 1000
Re s = ρ g d p u s u g μ g
The kinetic theory of granular flow [24] was used to simulate the solid phase. Due to the characteristic of the ‘pseudo-fluid’ in the particle phase, the concept of the particle pseudo-temperature (Gt, m2/s2) is introduced to characterize the energy corresponding to the particle velocity fluctuation, as shown in Equation (7). This theory takes into account the collision between the particles and the resistance between the gas and solid phases, and introduces the solid pressure, the solid volume viscosity, the solid particle viscosity and the probability distribution function of the particle motion, which can be seen in Equations (8)–(10) [25,26,27].
3 2 t ε s ρ s G t + ε s ρ s G t u s = p s I ¯ ¯ + τ s ¯ ¯ : u s + Γ G t G t γ G t + Φ 1 s G t = 1 3 C s C s
p s = ε s ρ s G t + 2 ρ s 1 + e ε s 2 g 0 G t
λ s = 4 3 ε s ρ s d p g 0 1 + e G t π
μ s = μ s , c o l + μ s , k i n + μ s , f r
μ s , c o l = 4 5 ε s 2 ρ s d p g 0 1 + e G t π μ s , k i n = 10 ρ s d p G t π 96 ε s 1 + e g 0 1 + 4 5 g 0 ε s 1 + e 2 ε s
μ s , f r = p s sin ϕ 2 I 2 D
Because the rolling motion has the greatest influence on the flow characteristics of the medium in the fluidized bed, and other motions’ effects can be neglected, this paper focuses on the simulation of the rolling conditions of the fluidized bed. In the simulation, the rolling condition can be realized using many methods, such as using a dynamic grid, adding a source term, and changing the gravity term. Compared to other methods, changing the gravity term is relatively simple and applicable with the introduction of UDF (user-defined functions). Meanwhile, the gravity term relates to the instantaneous rolling angle and angular velocity (Equations (1) and (2)) and can be calculated using Equation (11).
f = f x = g sin θ t = g sin Θ sin 2 π T t π 2 f y = g cos θ t = g cos Θ sin 2 π T t π 2
The gas phase is the air at room temperature, ρg = 1.225 kg/m3, μg = 1.79 × 10⁻⁵ Pa·s. The particle phase is spherical black glass beads, ρs = 2325 kg/m3, the bulk density is ρp = 1402 kg/m3, the average particle size is dp = 0.60 mm, and the maximum solid holdup is 0.60.
The gas inlet at the bottom of the bed is set as the velocity boundary condition. The gas outlet is set as the pressure outlet boundary condition, and the pressure value is set as the atmospheric pressure. For the wall, the specularity coefficient κ is introduced to quantify the collision strength between the particles and the wall in order to describe the friction between the particles and the wall [28]. The gas and solid phase adopt non-slip (κ = 1) and partial slip (κ = 0.5) boundary conditions, respectively [29].
In this paper, the dynamic characteristics of the particle flow in the fluidized bed under the upright and rolling conditions are investigated. The gas velocity is ug = 0.44 m/s, the initial loading height is H = 500 mm, the rolling period is T = 8 s and the rolling amplitude is Θ = 10°. At the same time, referring to the rolling period and the calculation convergence, the time step is 0.0002 s, and the total calculation time is 16 s.

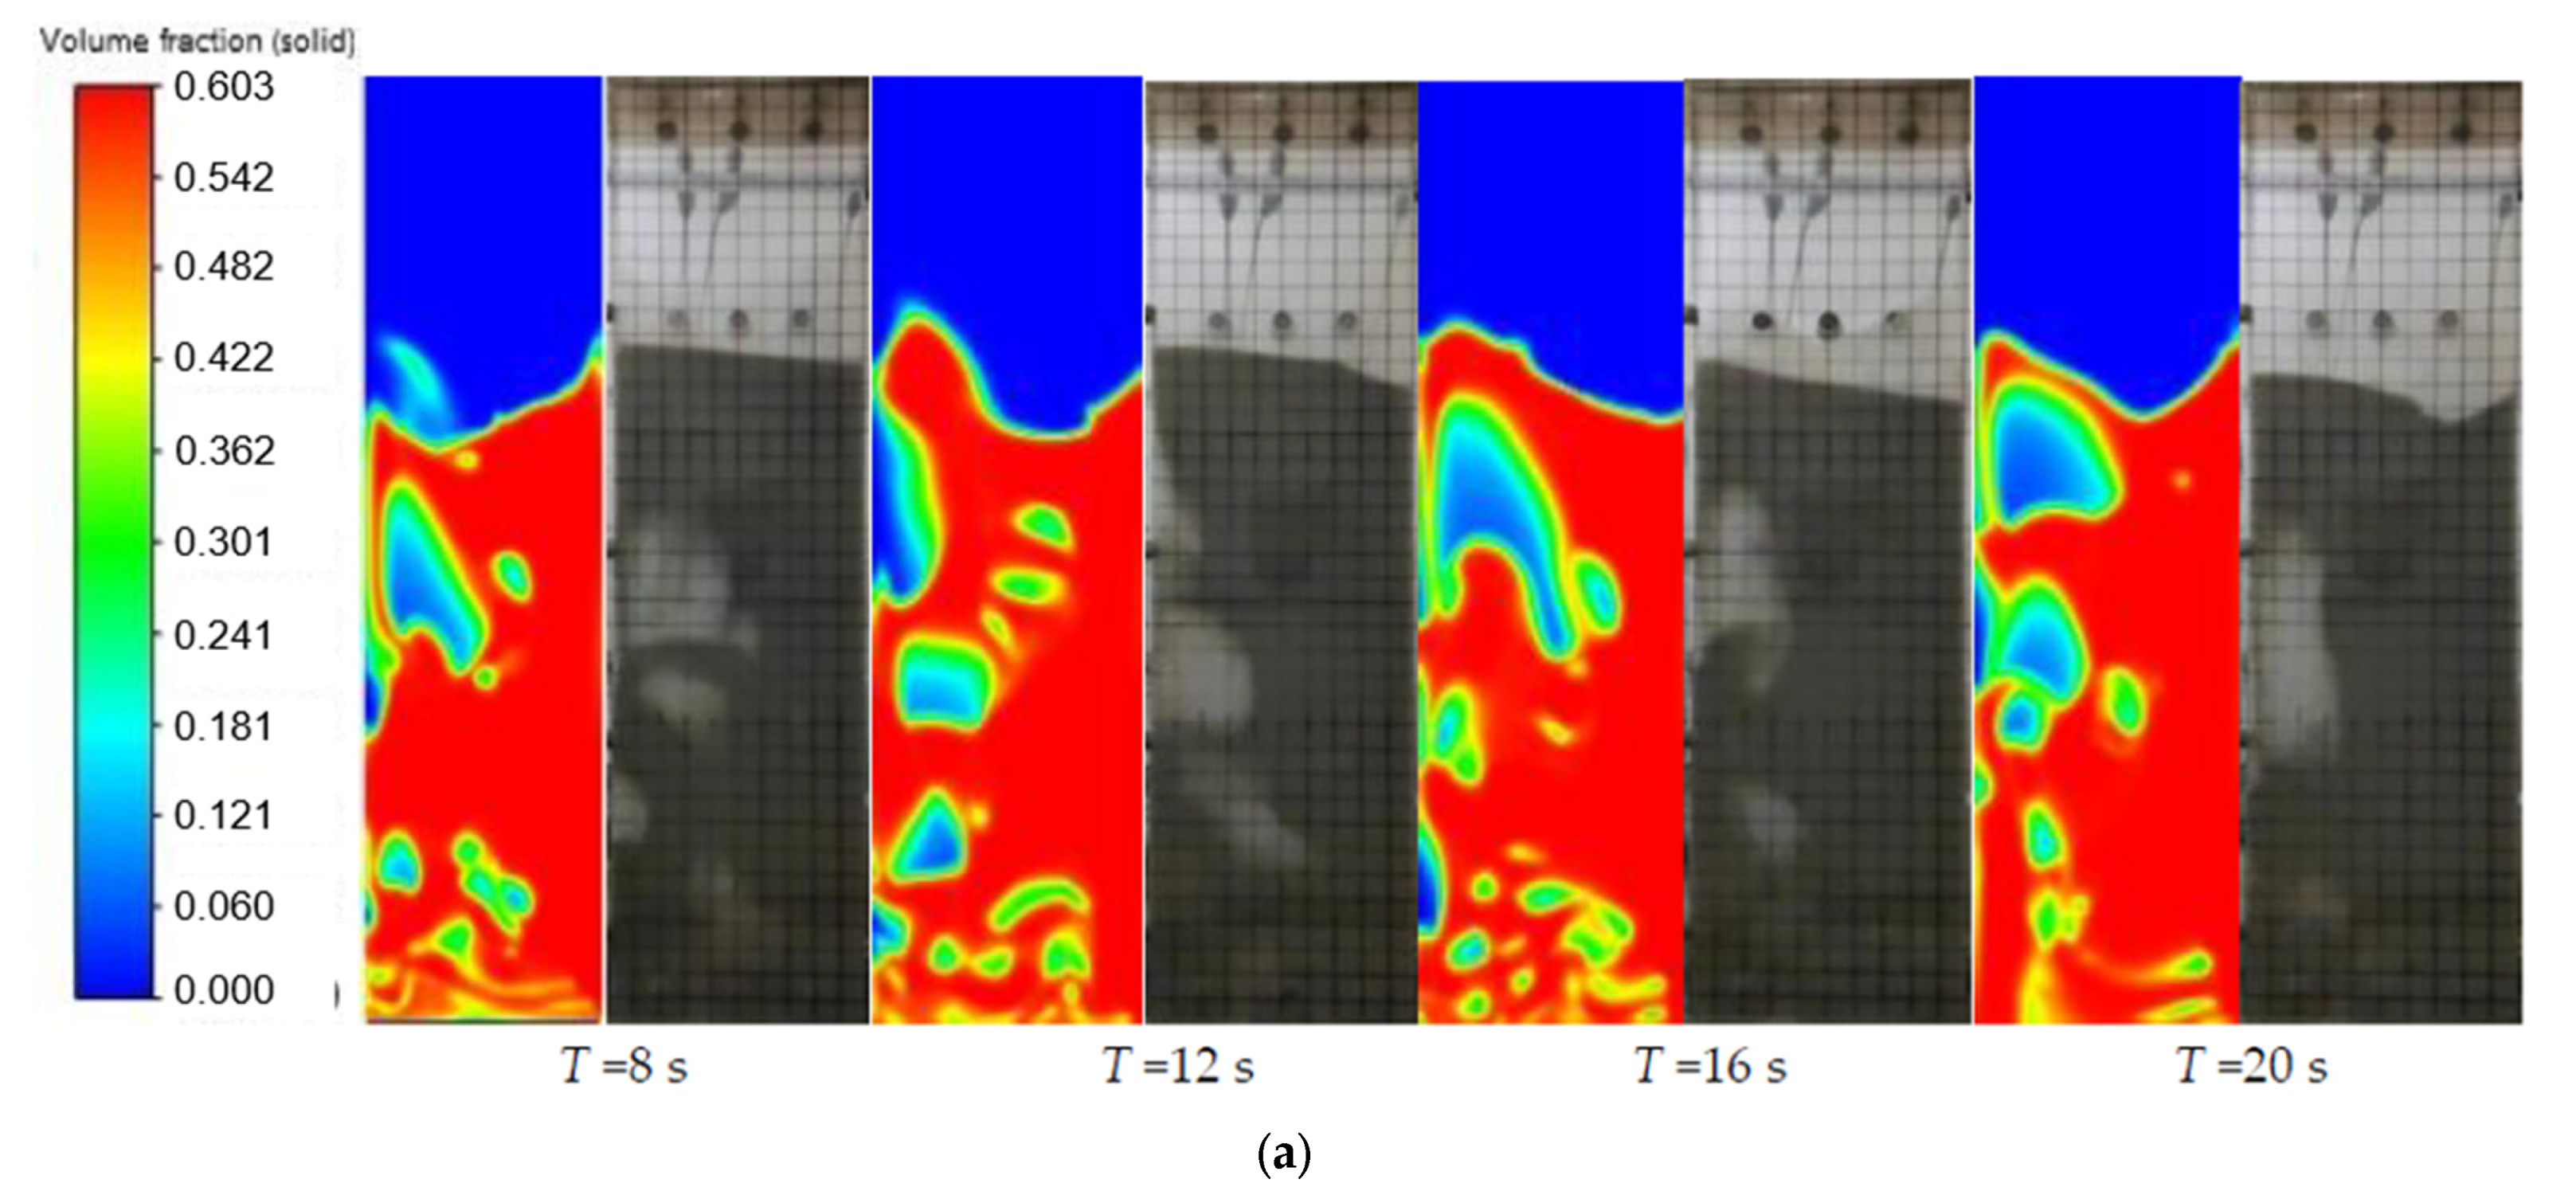
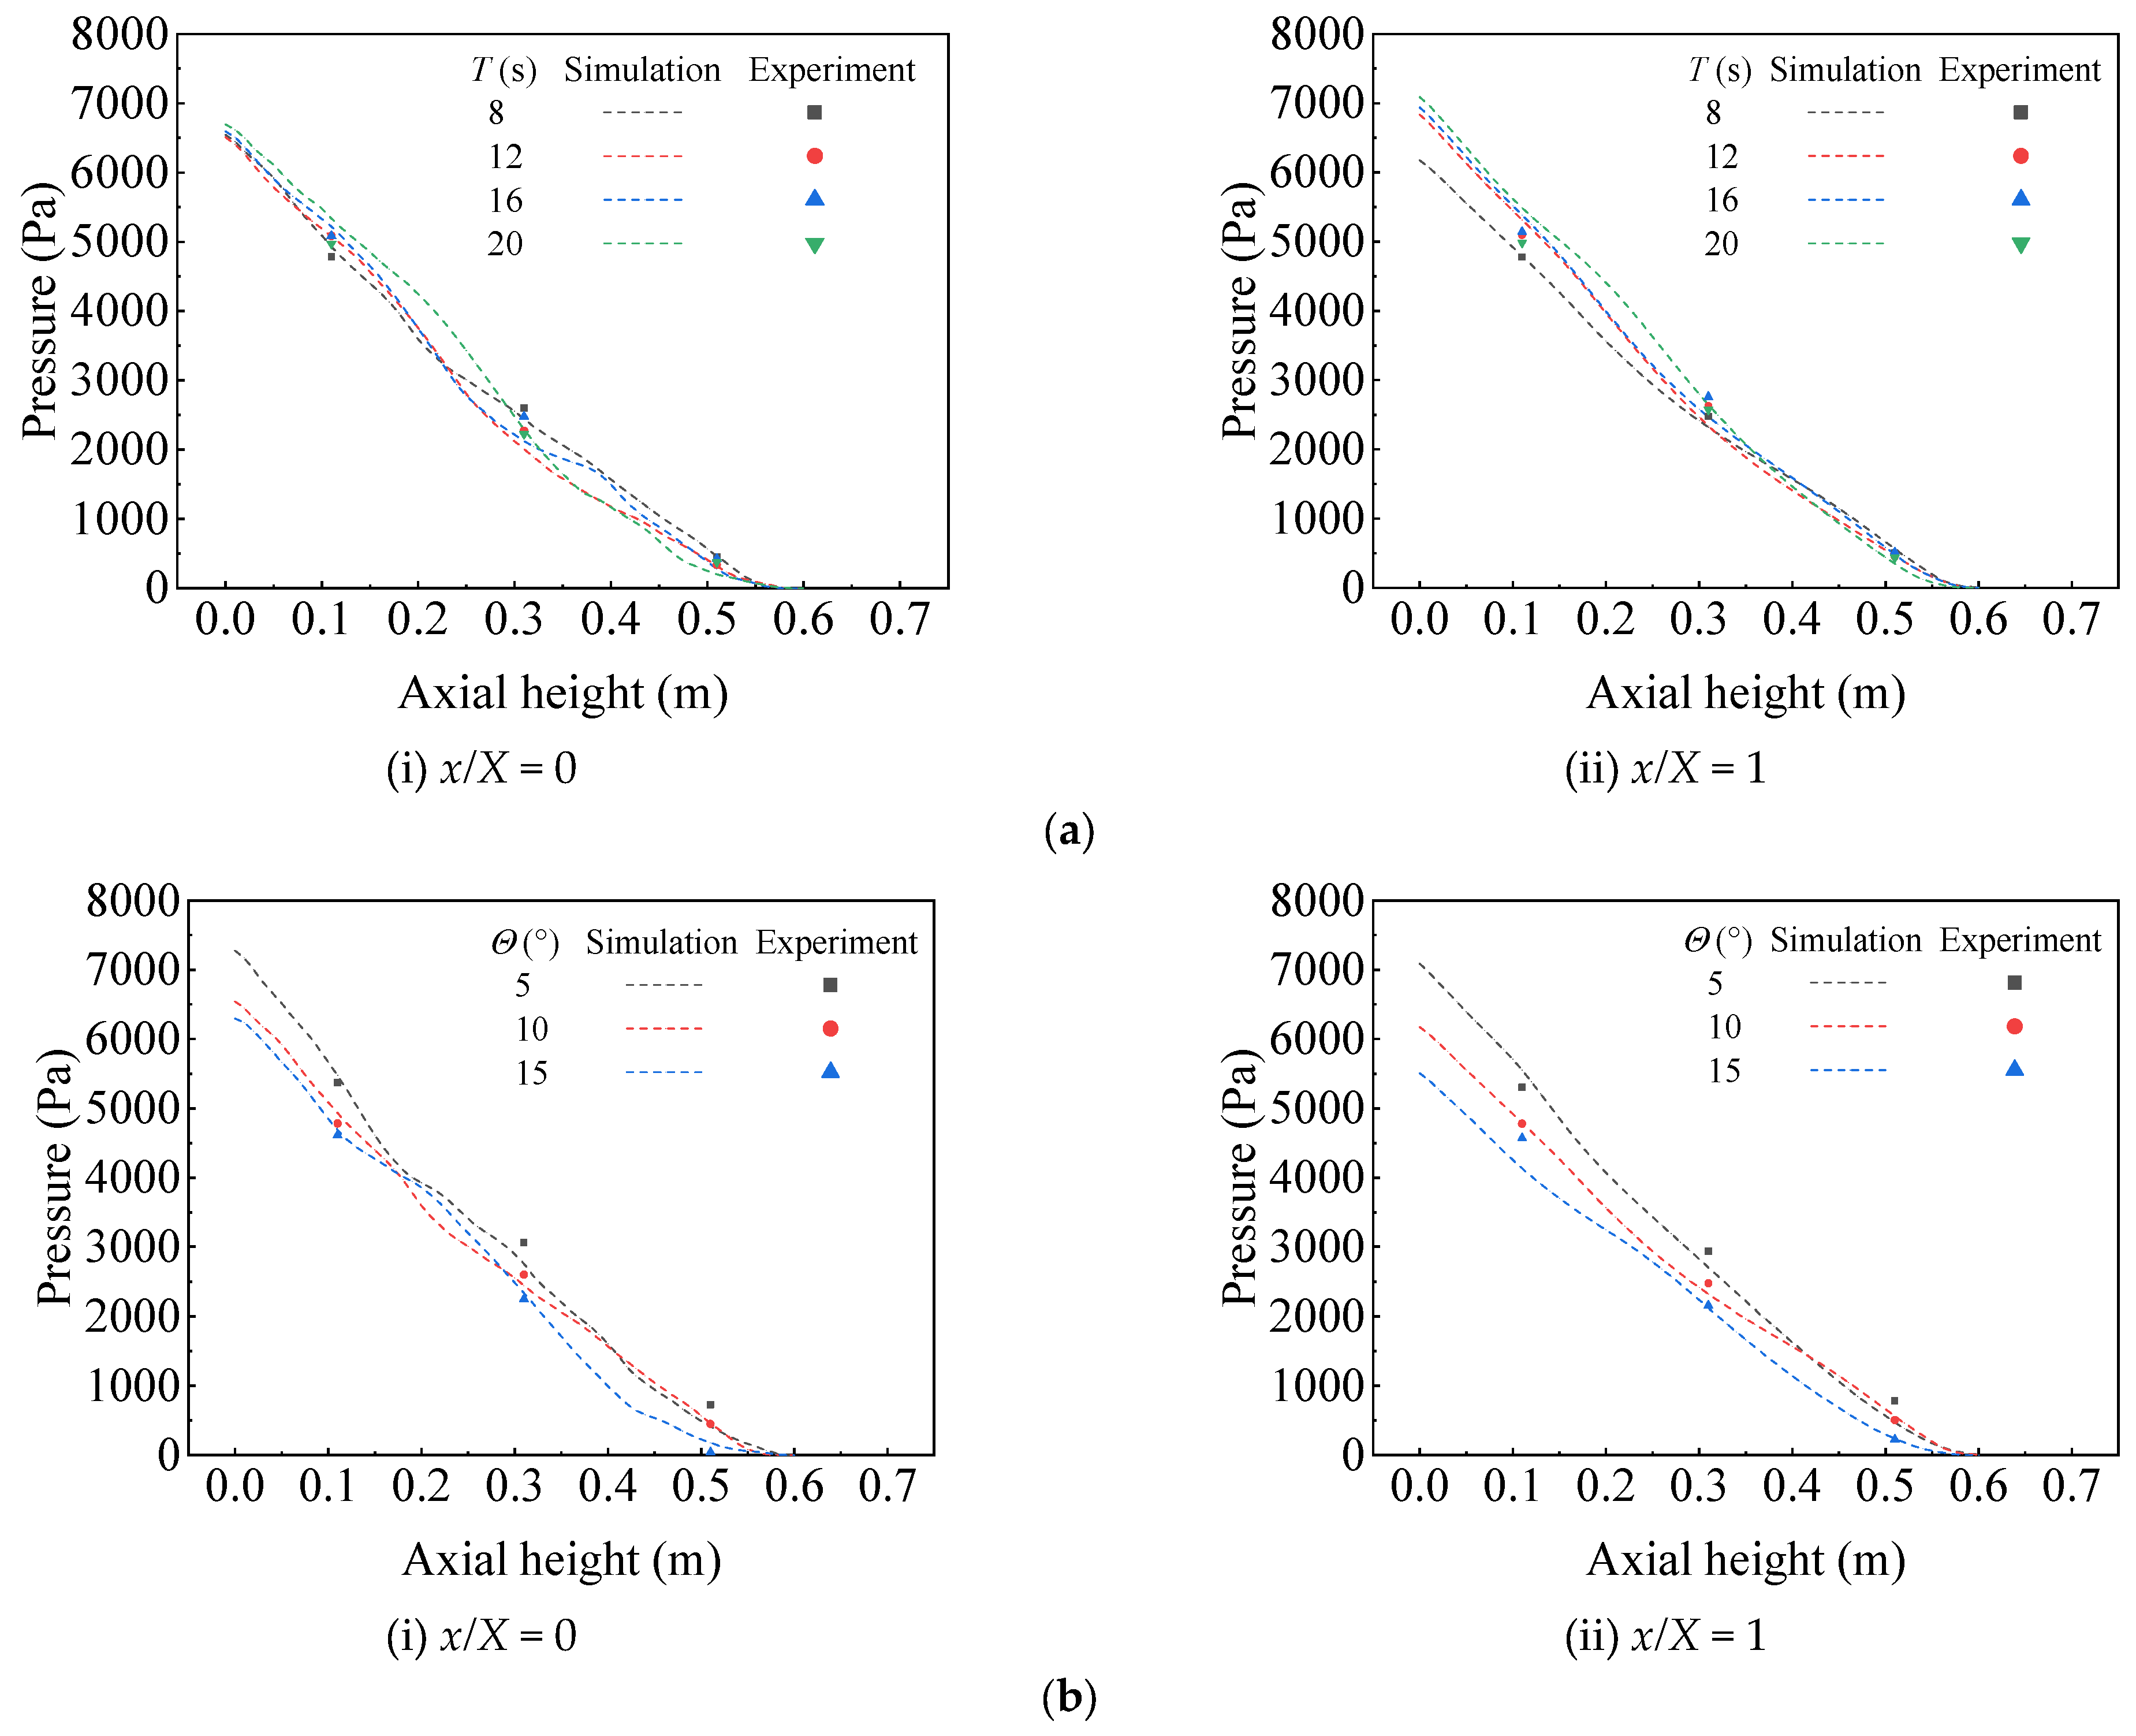
2.4. Model Validation

According to the previous studies [30,31,32], the mesh sizes are chosen as 5, 4, 3.2, 2.5 and 2 mm in this paper. The corresponding grid numbers are 22,892; 35,918; 55,732; 91,535 and 143,182, respectively. It can be seen from Figure 5 that when the mesh size is less than 3.2 mm, the flow field distribution no longer changes with the decrease in the mesh size. Thus, a grid size of 3 mm is used for subsequent simulation research.
The simulated object of this study is a dense phase fluidized bed, and the gas flow is almost a laminar flow under normal conditions. Therefore, this study assumes a laminar flow for all the simulations carried out in this paper.
As shown in Figure 6, under different rolling periods and amplitudes, the simulated solid holdup distribution is in good agreement with the phenomena observed in the experiment, such as the distribution and aggregation tendency of the bubbles. Meanwhile, as indicated by Figure 7, the experimental and simulated pressure values both decrease with the increase in the axial height and rolling amplitude, but the rolling period has little effect on them. The simulated values of pressure are close to the experimental results, and the relative errors are within 20%. This indicates that the above models can be used to simulate the gas–solid flow field accurately in the rolling fluidized bed.

3. Results and Discussion

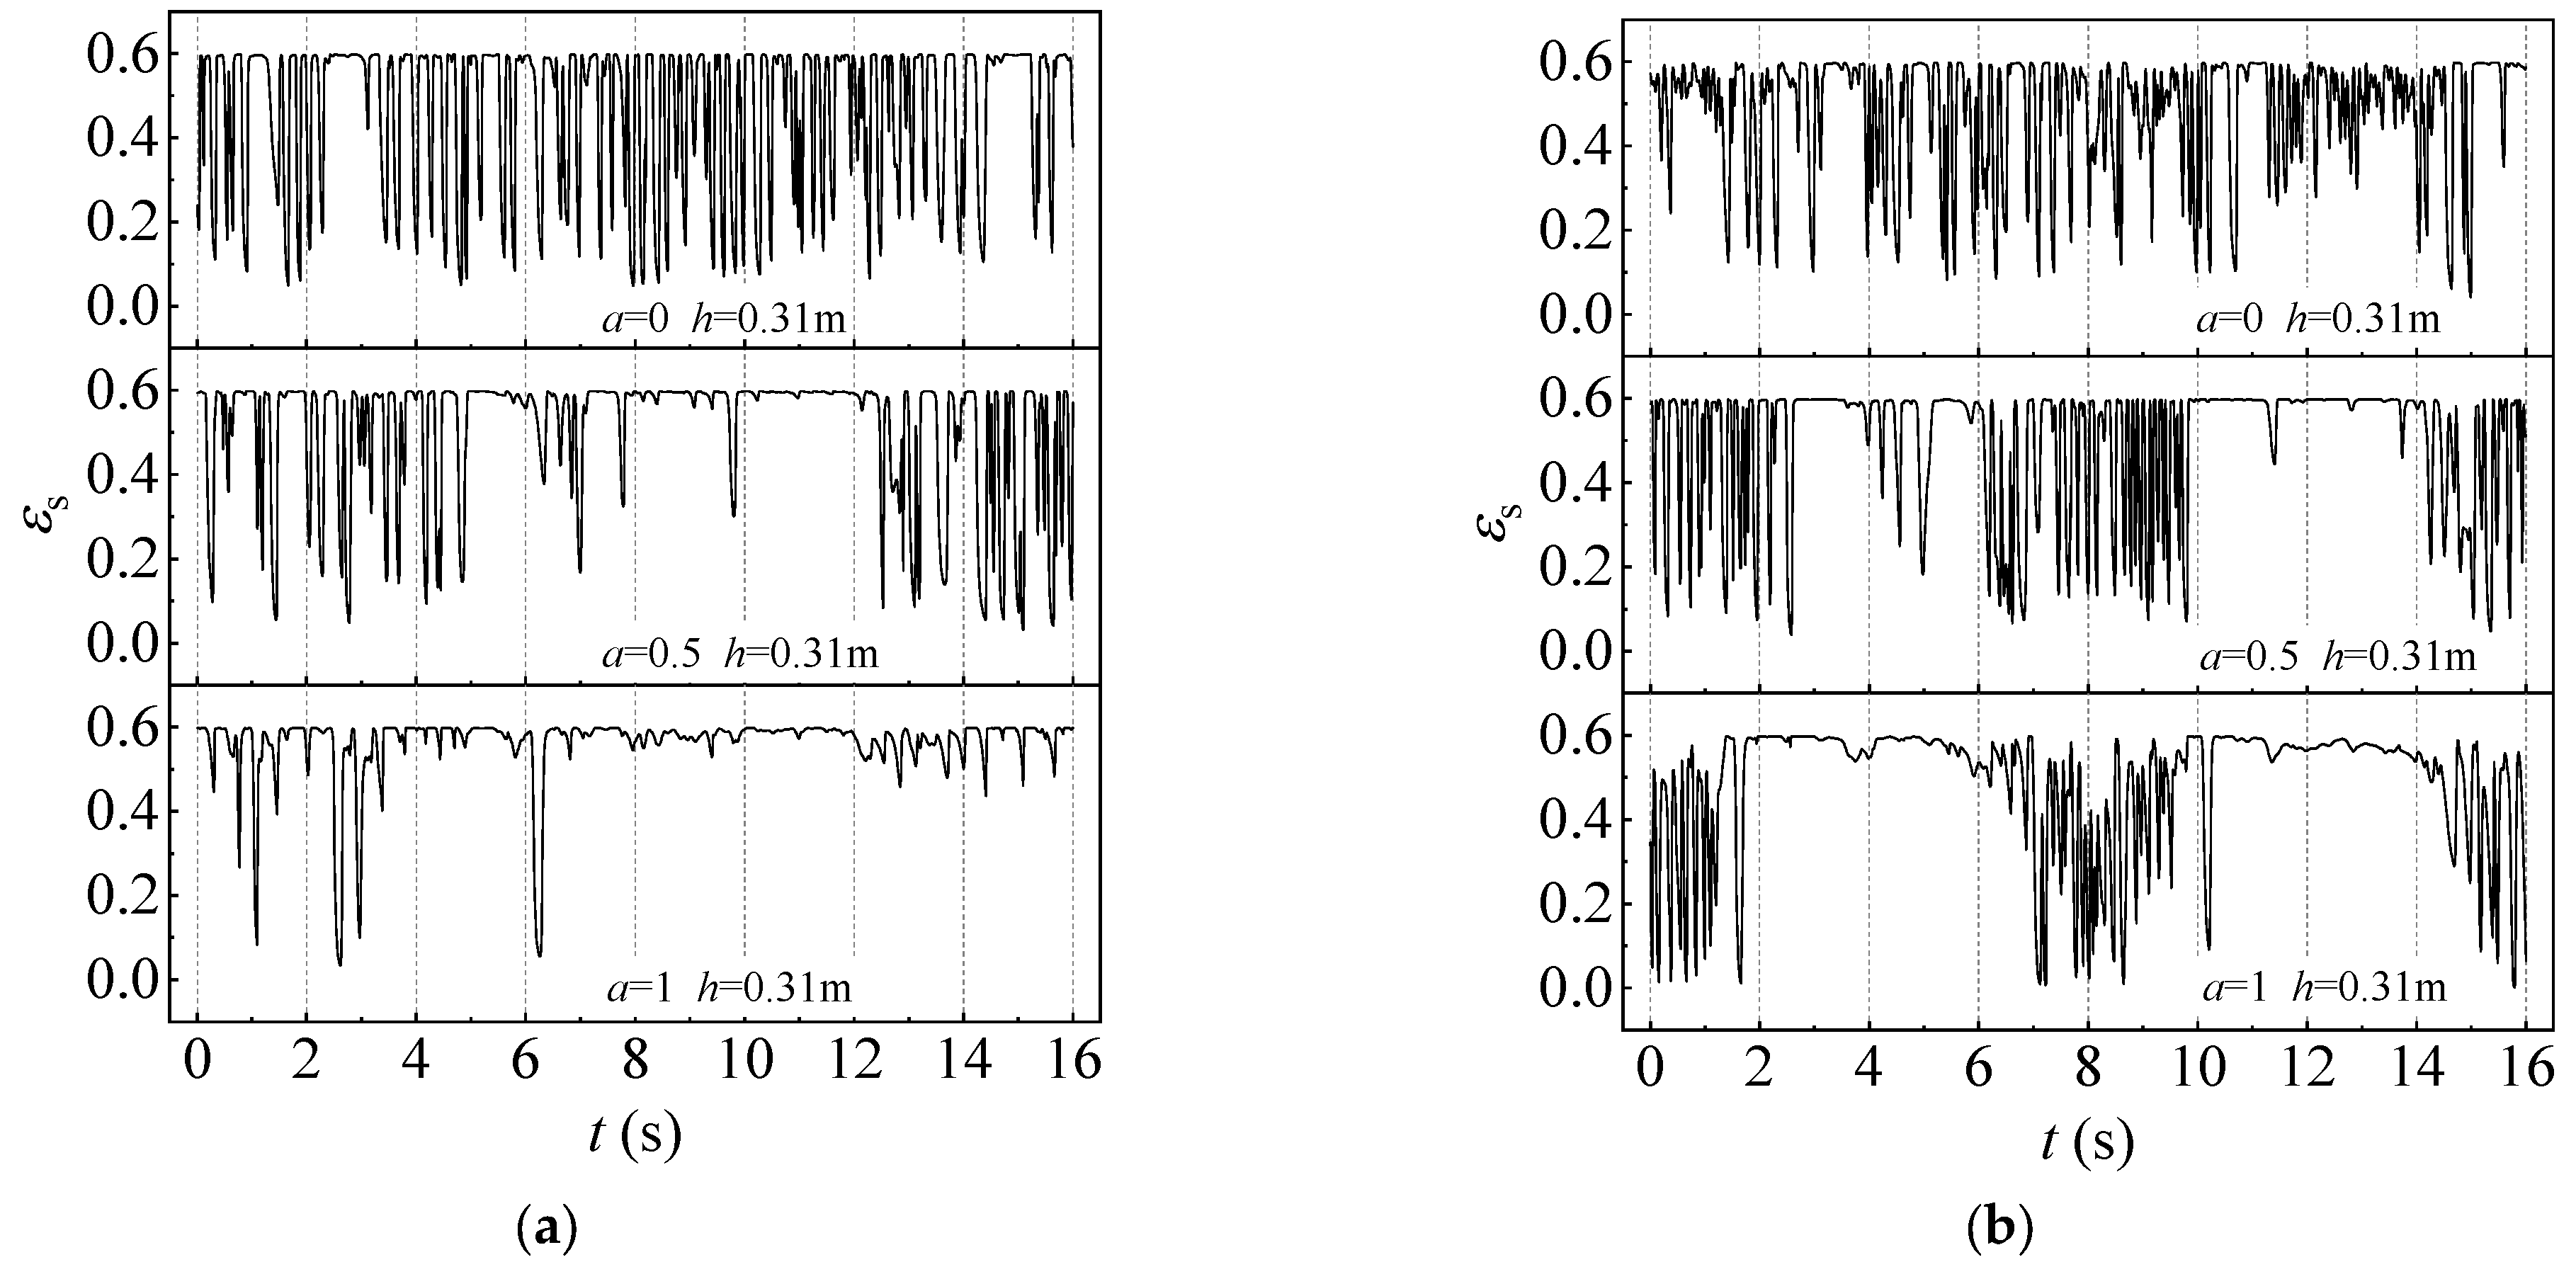
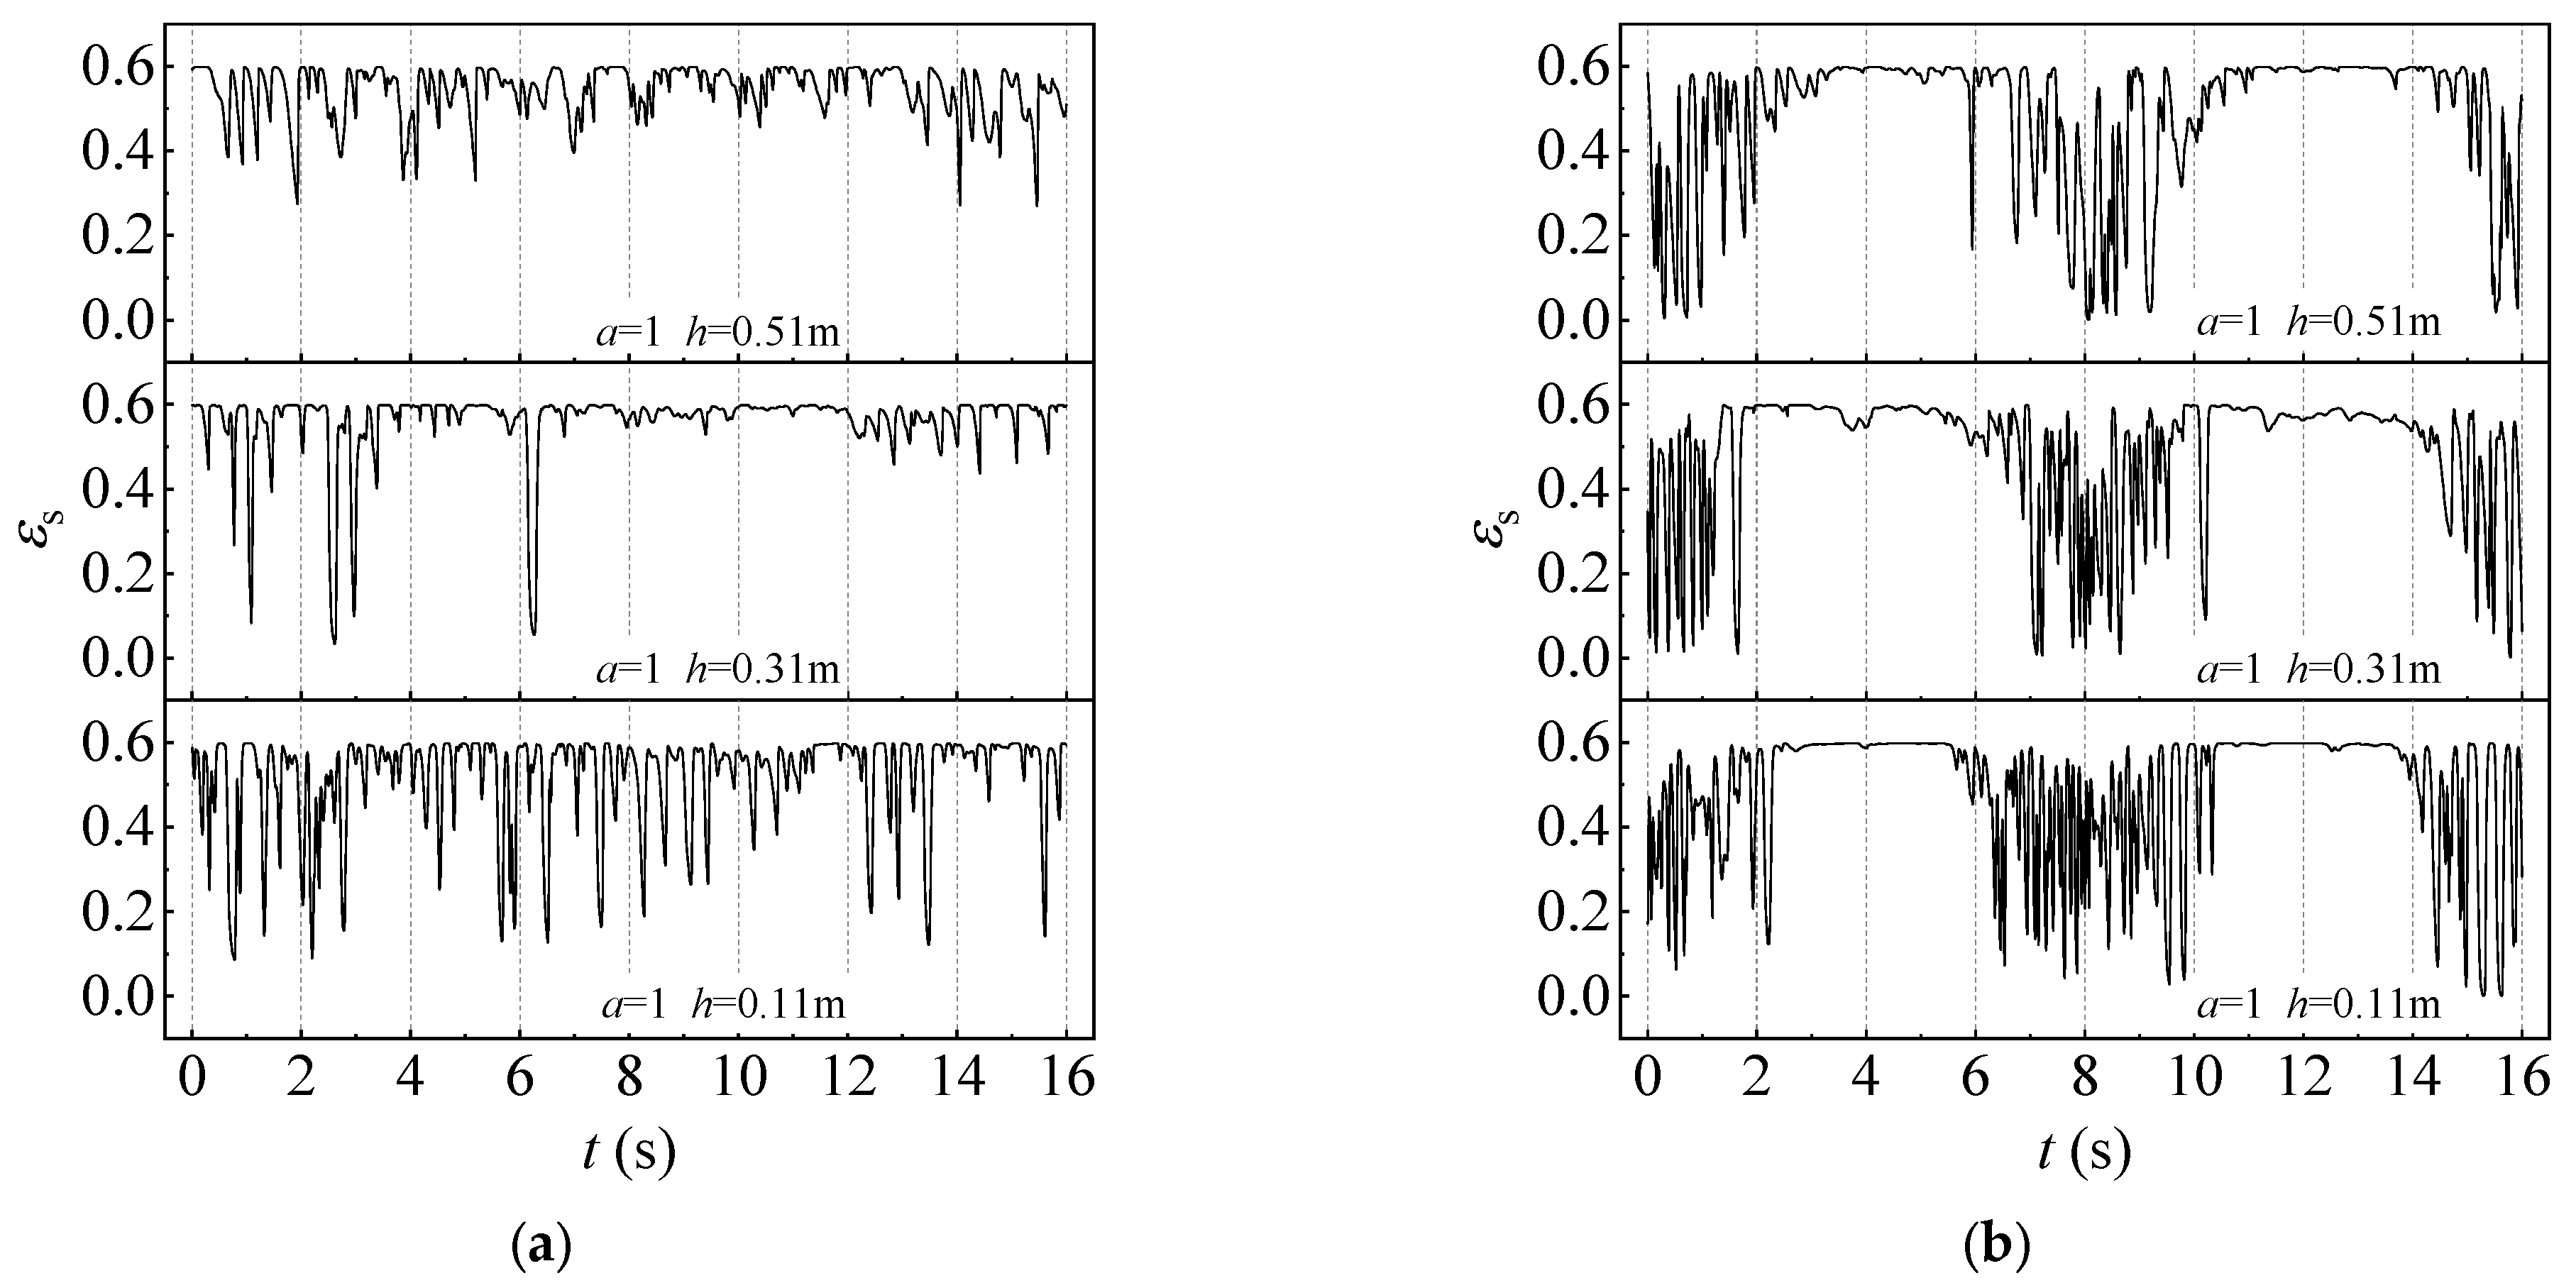
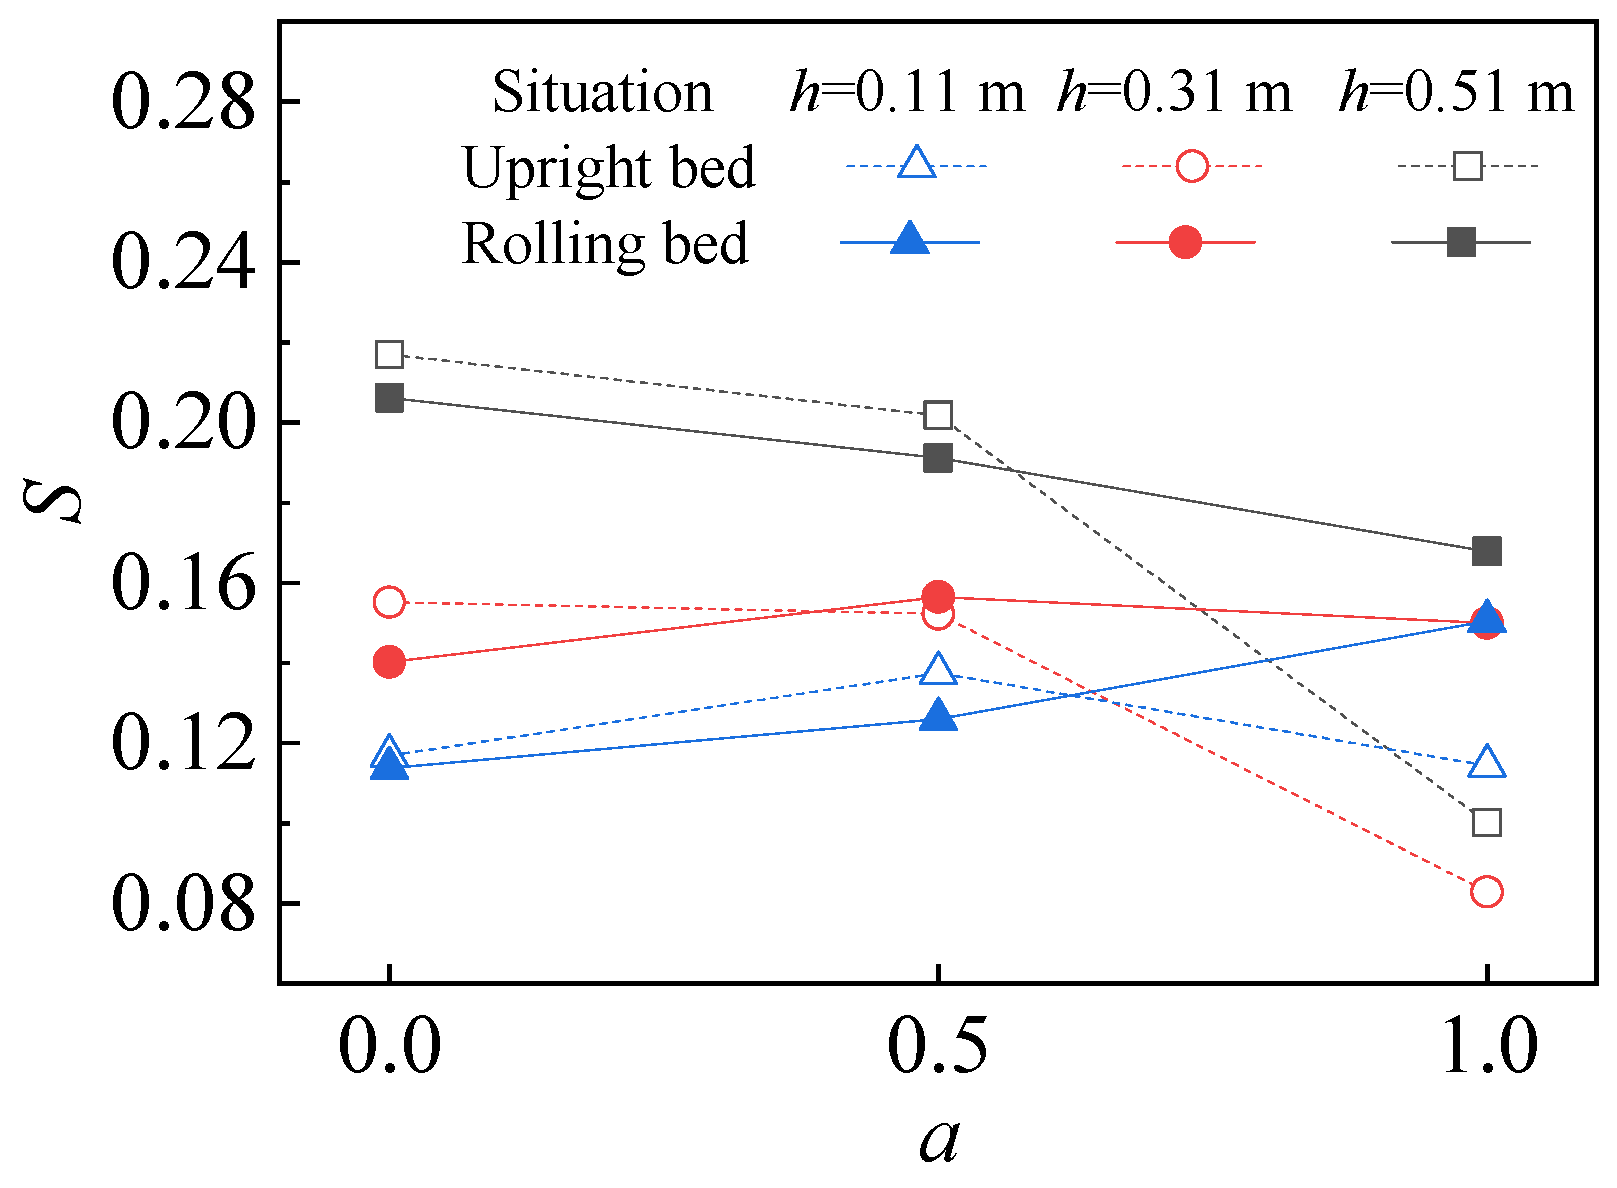
3.1. Dynamic Variation Characteristics of Solid Holdup Signal

From Figure 8a, it can be seen intuitively that the solid holdup signal fluctuates most violently in the middle of the upright bed (x/X = 0). The fluctuation intensity of the solid holdup signal is weakened, and the proportion of the low-value solid holdup signals is significantly reduced with the increase in x/X. From Figure 8b, it can be seen that in the rolling mode, only the time series signal of the solid holdup in the middle of the fluidized bed (x/X = 0) changes, similarly to that of the upright bed, showing a random distribution state. This indicates that even in the rolling mode, the gas–solid two-phase in this area can still maintain a strong gas–solid effect, and the bubbles are generated and broken more frequently. With the change of the x/X value, the change in the solid holdup is quite different from that of the upright bed. In the rolling bed, the closer to the side wall, the more obvious the periodicity of the solid holdup signal is, that is, as the bed rolls, when in the gas phase aggregation state, the solid holdup signal fluctuates violently. When in the particle aggregation state, the solid holdup signal value is large, and the fluctuation amplitude is small. Its change frequency is roughly consistent with the rolling frequency of the bed. This is because the inclination of the bed causes the gas phase to gather to the upper wall of the inclined bed, resulting in a smaller gas content closer to the lower wall of the inclined bed. This means that the gas is less likely to form bubbles, and more inclined to pass through the particle gap, so the disturbance to the particles (or particle clusters) is smaller.
It can be seen from Figure 9a that in the upright bed, the frequency of the low-value solid holdup signal is the highest when h = 0.11 m. With the increase in the axial height, the frequency of the low-value solid holdup signal decreases, and the duration of the high-value solid holdup signal gradually increases. This reflects that after the gas enters the bed from the distributor, there is a tendency for the gas to gather toward the center line of the bed during the upward process. Therefore, the closer to the upper wall region, the higher the frequency of the high-value solid holdup signal. As shown in Figure 9b, with the increase in the axial position, the fluctuation characteristics and values of the high-value solid holdup signal in the lower wall region of the inclined bed changes slightly, but the frequency of the solid holdup fluctuation in the upper wall region of the inclined bed decreases. This is because the bottom region of the bed is close to the distributor, and the newly formed bubbles are numerous and small in size, and the coalescence between the bubbles is frequent. As the axial height increases, the bubble size gradually increases. As a result, the response to the change in the solid holdup signal is relatively slow, and the time of the solid holdup signal at a low value is prolonged. This, in turn, leads to the change frequency being slowed down.
Figure 10 shows the variation of the standard deviation of the solid holdup in different regions of the bed under the two operating modes of the upright bed and rolling bed. It can be seen that in the conventional upright bed, the higher the axial height, the greater the standard deviation. This is because during the rising process of the bubble, its diameter and axial velocity gradually increase, resulting in more intense movement of the particles around the bubble. Finally, the bubble moves to the middle of the bed surface to break, resulting in violent fluctuations of the particles located on the bed surface. The solid holdup in the bed wall region fluctuates less because the particles are in the downward flow of the inner circulation. Compared with the conventional upright bed, in the rolling mode, the closer to the side wall, the greater the increase in the standard deviation of the solid holdup. This indicates that the solid holdup distribution in the side wall region has a great inhomogeneity in the rolling period. It is further illustrated that the wall region on both sides of the rolling bed is the region that is most affected by the rolling motion. The gas–solid flow state in this region is significantly different, and there is a periodic conversion with the rolling of the bed.

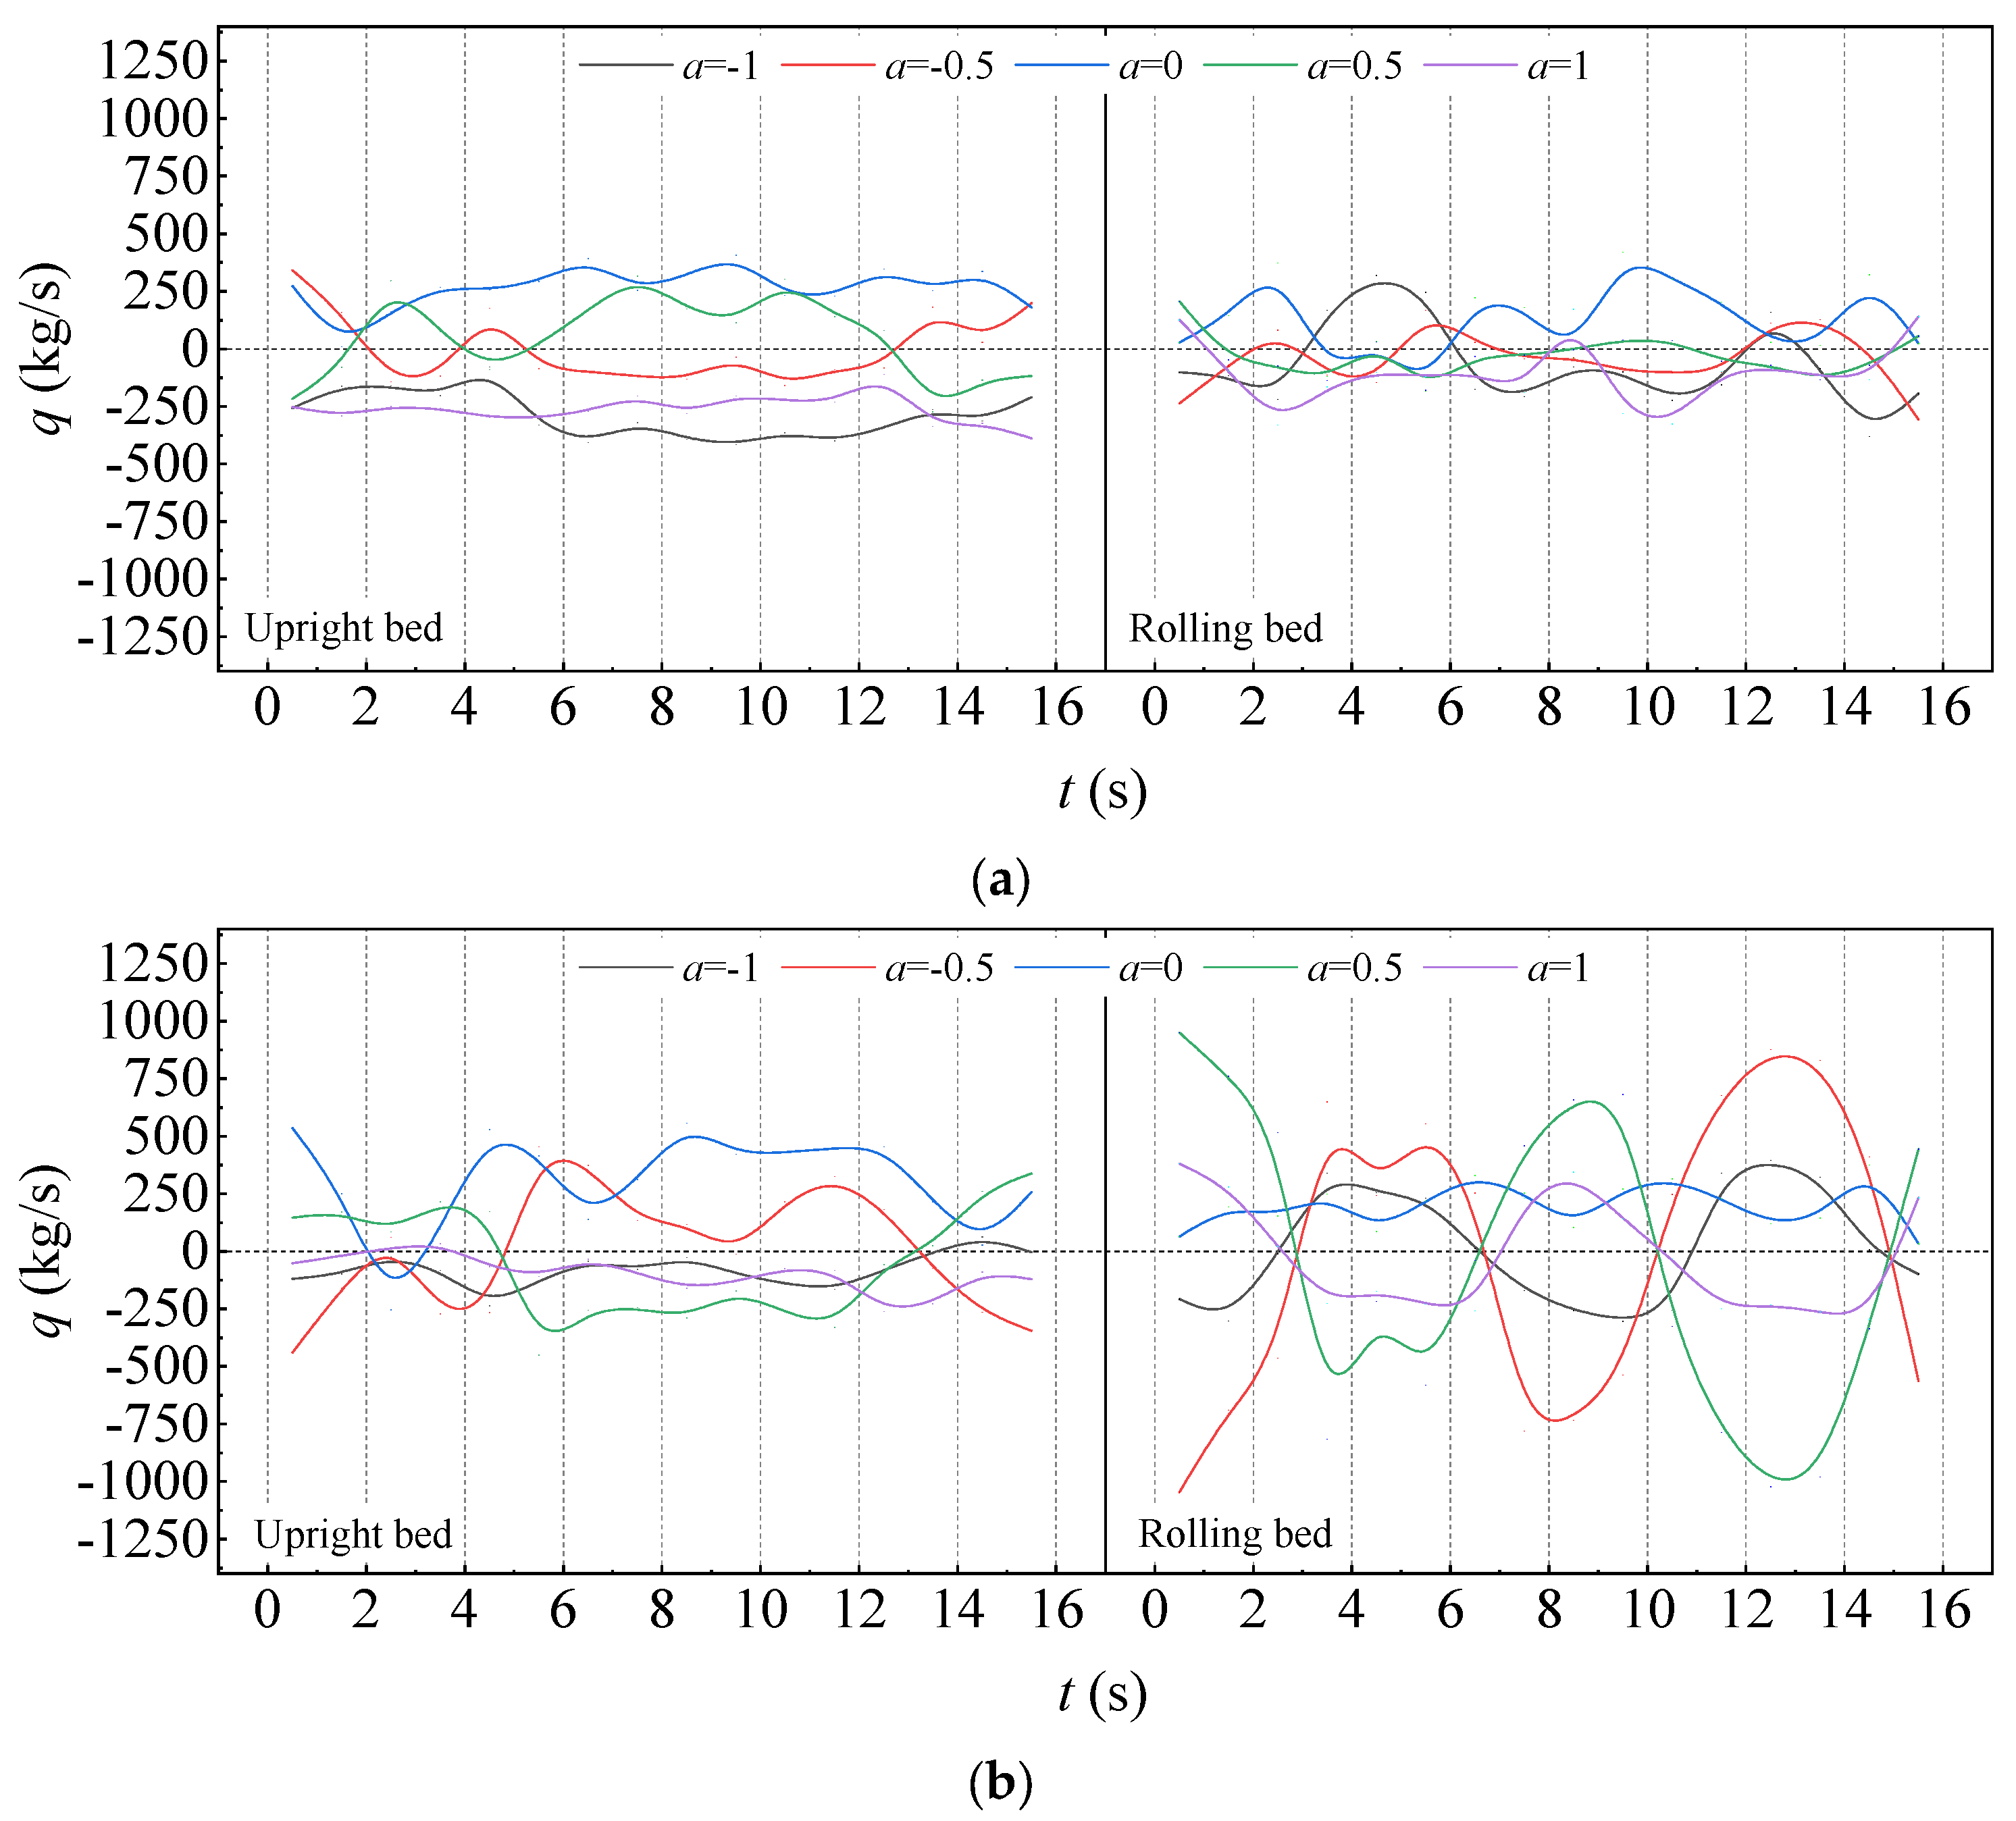
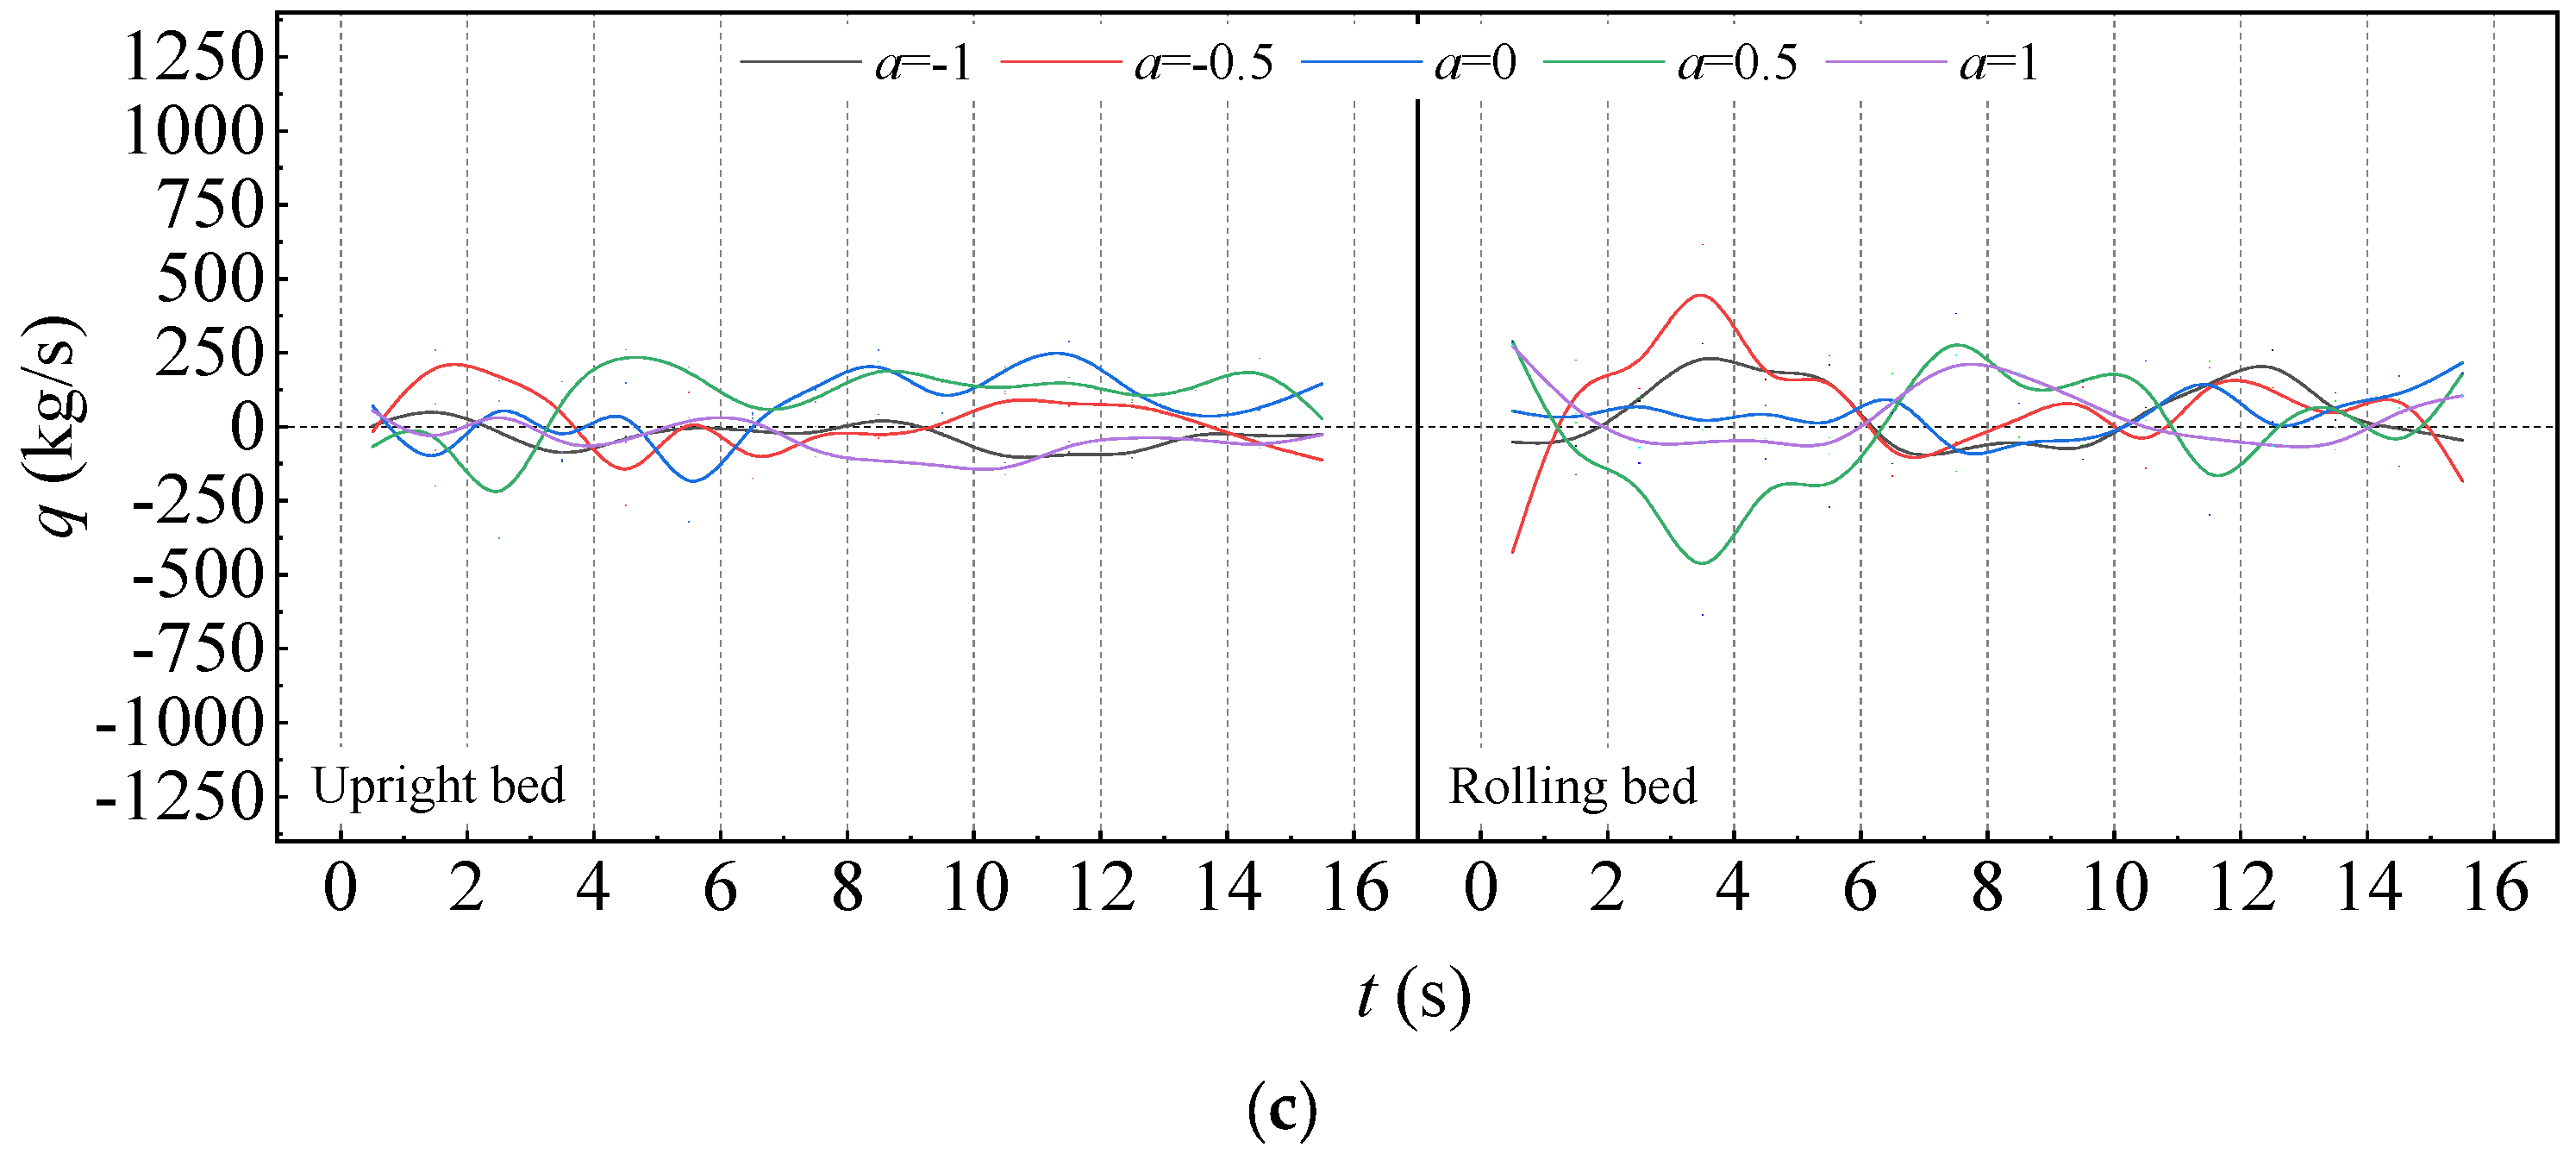
3.2. Time Variation Characteristics of Solid Circulating Rate

This study combines the solid holdup and instantaneous velocity to obtain the solid flow rate (Equation (12)), which is an important physical quantity that is used to characterize the gas–solid flow characteristics in the fluidized bed.
q = ε s ρ s u s
In the above formula, εs is the solid holdup, ρs is the particle density and us is the particle velocity.
In previous research, it was observed that there was an internal circulation phenomenon in the particle flow in the bed [19]. In order to further investigate the particle circulation characteristics of the different height sections, on each height section, five measuring points are selected and recorded as x/X = −1, −0.5, 0, 0.5 and 1. Taking the data of t = 0~2T, Figure 11 shows the time variation of the solid internal circulating rate. The value of ‘+’ indicates that the solid flow rate is upward, and the value of ‘−’ indicates that the solid flow rate is downward.
For the upright bed, as shown in the left half of Figure 11a–c, the solid flow rate is generally positive near the center line of the bed (such as x/X = 0), that is, the particles move upward. In the region near the bed wall (such as x/X = −1 and 1), the particles generally flow downward. In the region between the centerline and the wall (such as x/X = −0.5 and 0.5), the particles flow upward or downward, but the solid circulating rate directions of x/X = −0.5 and 0.5 are always opposite. From this point of view, there are two internal circulation modes of the particles in the upright bed (See Figure 12a); one mode is the internal circulation model of the center up and the side wall down. This is a circulation model formed by the overall density difference between the center and the side wall of the bed, which can be called ‘overall internal circulation’. This is because the bubbles are generally close to the center line of the bed during the rising process. The other internal circulation mode is in the region between the center line and the wall surface, which is called ‘local internal circulation’. On both sides of the center line of the bed, the particles on one side move upward, and the particles on the other side move downward. This internal circulation mode is mainly caused by the movement of local large-sized bubbles. It is random and limited in time and space, and the range of the influence is relatively limited. Comparing the solid flow rate at different heights of the bed, the internal circulation phenomenon in the middle and upper parts of the bed is more obvious than that of the bottom of the bed. This is because the bubble size at the bottom of the bed is small, and the overall circulation of the particles at the bottom of the bed is diverted.
For the rolling bed, as shown in the right half of Figure 11a–c, in the region near the center line of the bed (such as x/X = 0), the solid flow rate is generally upward, and the value is slightly affected by the periodic rolling of the bed. For the region except the above (such as x/X = −1, −0.5, 0.5, 1), the characteristics of the solid flow rate are mainly manifested in two aspects; one is that the direction of the solid flow rate changes periodically with the periodic rolling of the bed, and the other is that the direction of the solid flow rate in the upper and lower wall regions of the inclined bed is always the opposite at each stage of the rolling period. The variation characteristics of the solid flow rate indicates that there is only one main internal circulation mode in the rolling bed (see Figure 12b), which can also be called the ‘overall internal circulation’. In the upper wall region of the inclined bed, the particles mainly move upward in the axial direction under the action of the gas (or bubbles). In the lower wall region of the inclined bed, the probability of the bubbles’ generation is low, and the particles are mainly affected by gravity and flow downward in the moving bed. When the inclination angle is large, there may be a small range of fixed bed area close to the wall. The direction of this internal circulation switches with the inclined attitude in the rolling bed. Compared with the upright bed, the bubbles in the rolling bed have obvious characteristics of gathering to the upper wall of the inclined bed, and it is easy to form a large rising bubble in the form of a wall attachment. Therefore, the local internal circulation is the same as the overall internal circulation in the rolling bed. Compared with different heights of the rolling bed, the internal circulation characteristics above are the most obvious in the middle of the bed, followed by the bottom of the bed. The top of the bed is not obvious in the change in the solid flow rate due to the influence of the large bubbles’ rupture and the particle filling flow in the adjacent region.

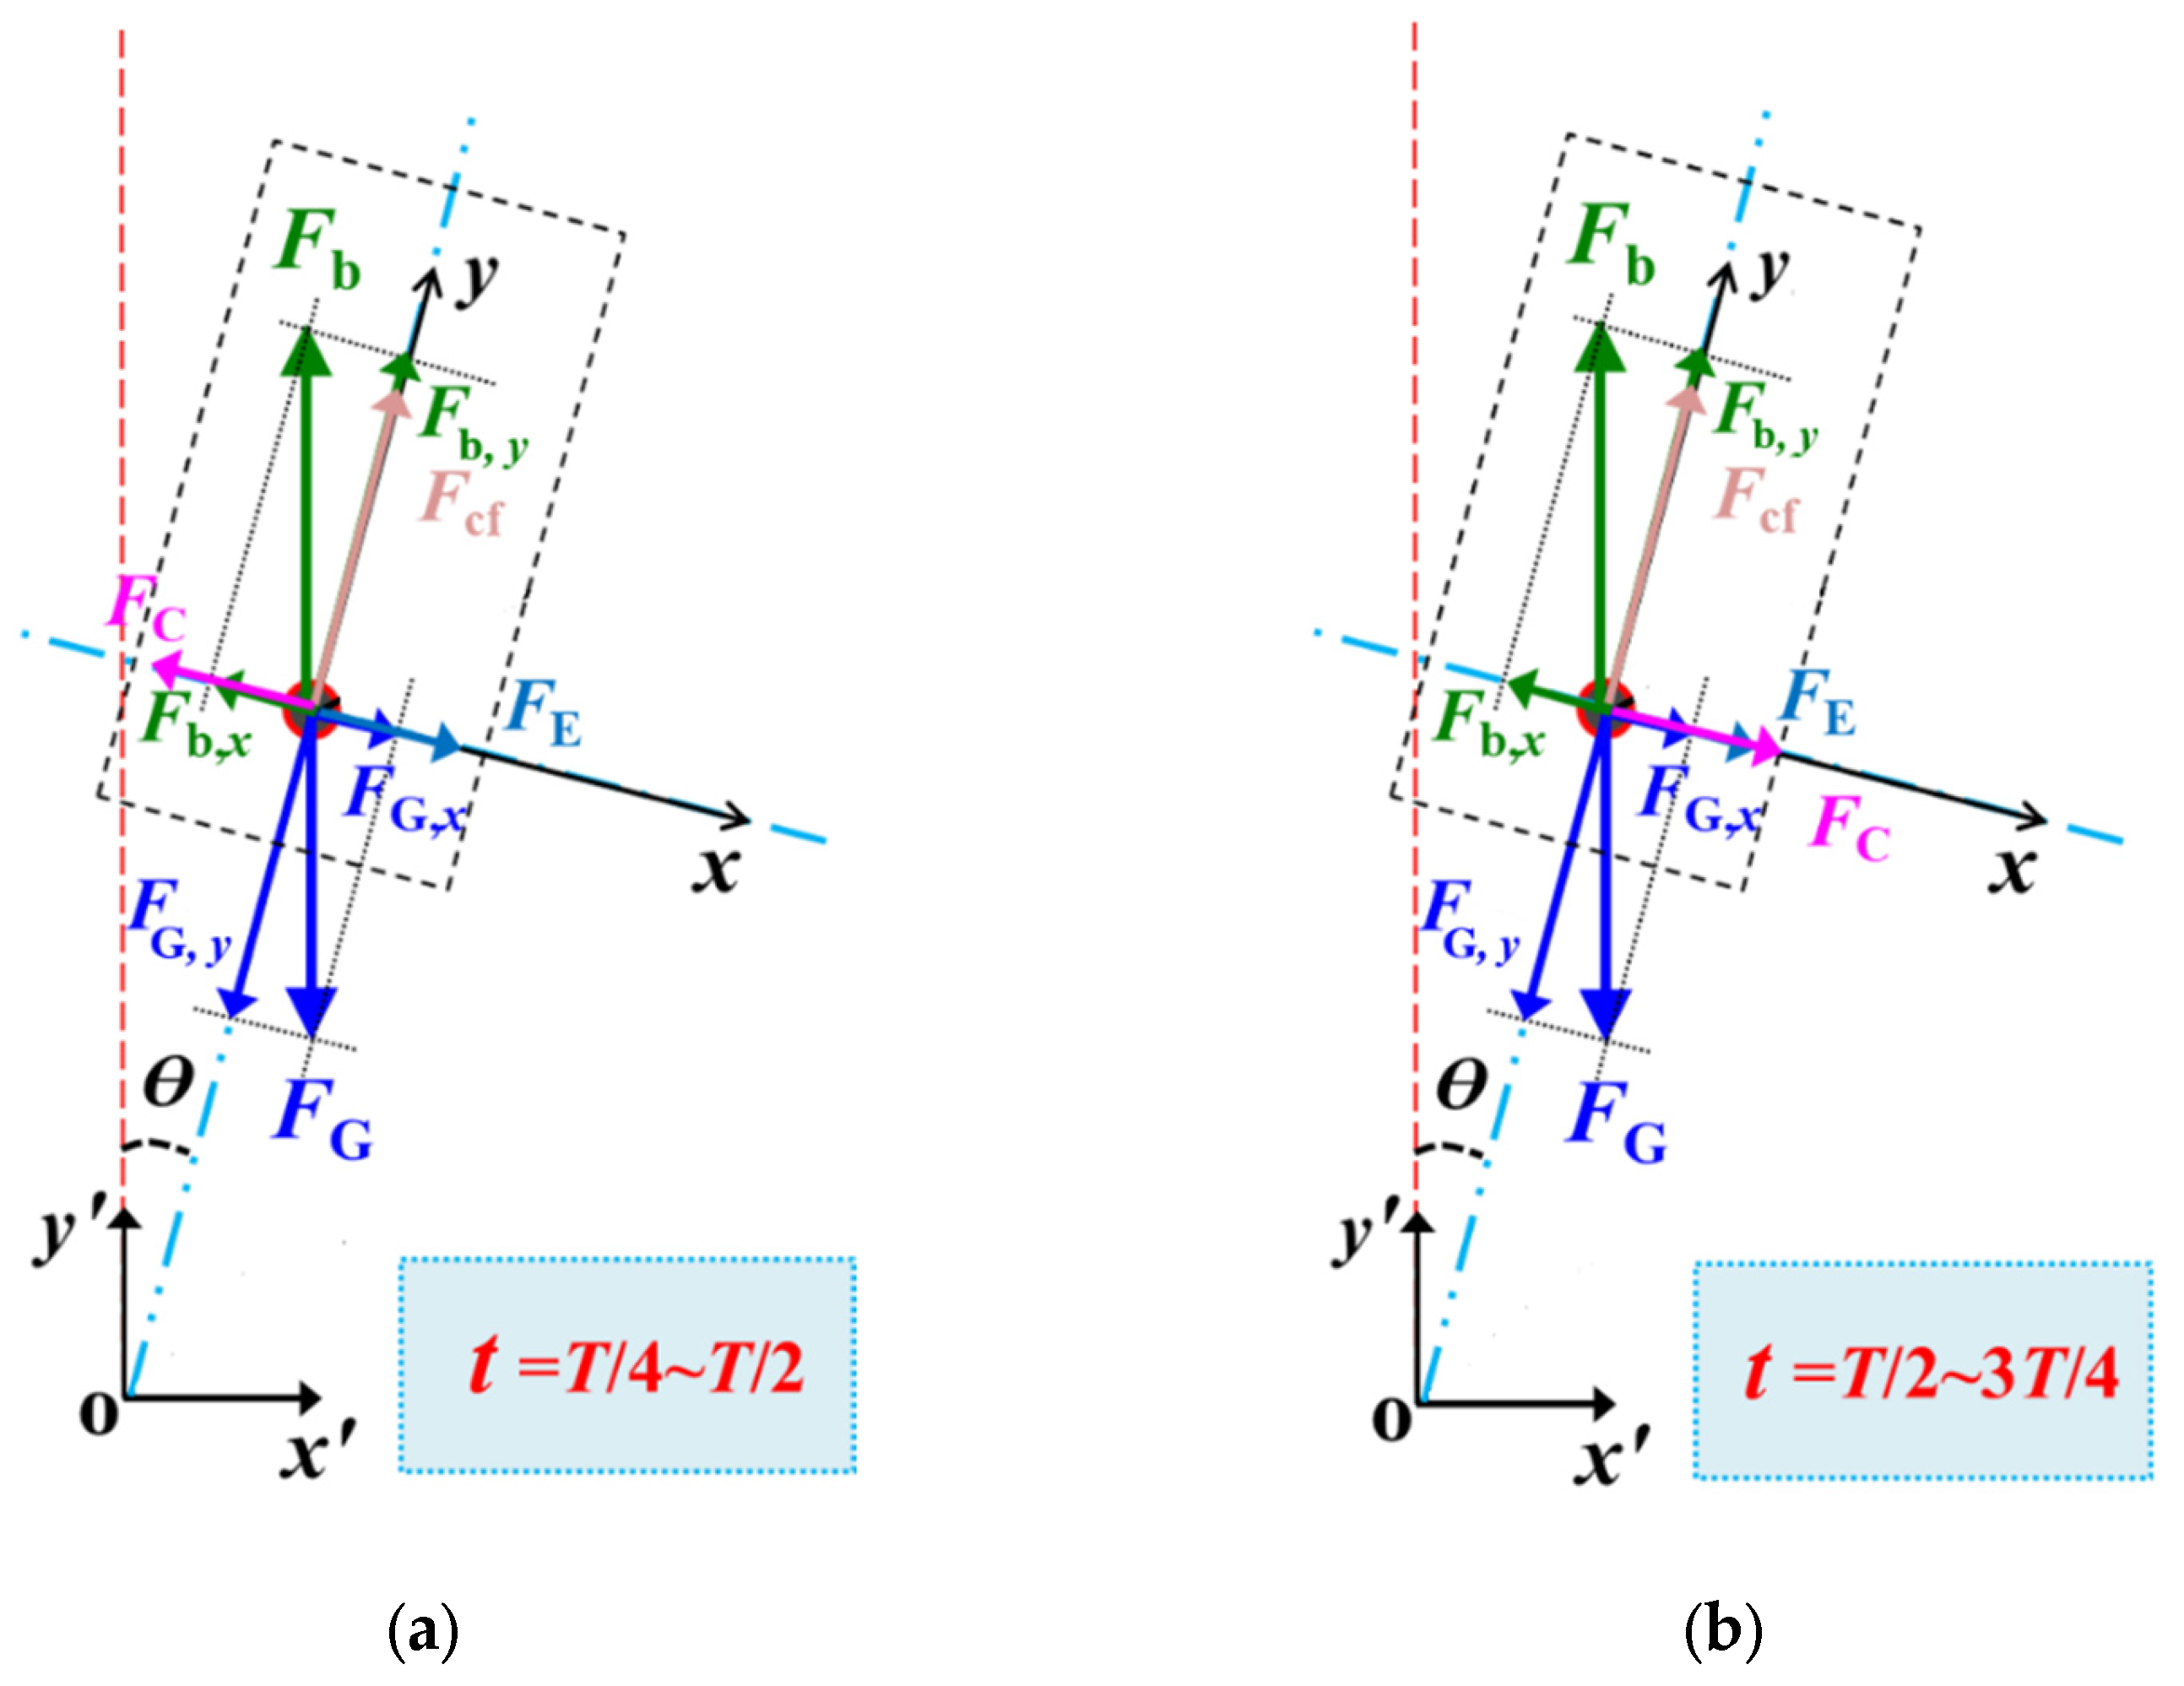
3.3. Lag Phenomenon in the Lower Wall Region of Inclined Bed

It can be seen from Figure 11 that the solid flow rate curve in a single rolling period shows an asymmetry before and after t = T/2, especially in the t = T/4~T/2 and t = T/2~3T/4 stages. At this time, the direction of the solid flow rate in the lower wall of the inclined bed is generally downward, but the change in the inclination angle is different. The asymmetry of the curve in the figure shows that compared with the t = T/4~T/2 stage, there is a ‘lag phenomenon’ in the transition of the solid flow rate with the decrease in the inclination angle during the stage of t = T/2~3T/4, that is, the downward solid flow rate does not change synchronously with the decrease in the inclination angle.
The lower wall region of the inclined bed is always in the state of solid accumulation during the stage of t = T/4~3T/4, and the solid holdup is stable at a high level. Moreover, the combined force in the y-axis direction only affects the size of the particle velocity. It can be judged that the occurrence of the ‘lag phenomenon’ is mainly caused by the different combined forces of the particle phase in the x-axis direction. In the x-axis direction, the particle phase is mainly affected by the following four forces: gravity force, buoyancy force, Coriolis force and Euler force. The Coriolis force and Euler force belong to the additional inertial force generated by the rolling bed. The direction of each force is shown in Figure 13 (the line segment with arrows in the figure is mainly used to illustrate the direction of each force, not the size of each force). It can be seen that the centrifugal force (Fcf) is always perpendicular to the x-axis, so only the effects of gravity (FG), buoyancy (Fb), Coriolis force (FC) and Euler force (FE) need to be considered. The gravity component expression, buoyancy component expression, Coriolis force expression and Euler force expression in the x-axis direction are as follows:
F G , s = m s g sin θ = ρ s V s g sin θ = ρ p 1 ε mf g sin θ V s
F b , s = m g g sin θ = ρ g g sin θ V s
F C , s = 2 m s u ω = 2 ρ s V s u s ω = 2 ρ p 1 ε mf u s ω V s
F E , s = m s r α ω = ρ s V s r α ω = ρ p 1 ε mf r α ω V s
Among them, εmf is the critical gas volume fraction, ρp is the particle bulk density, αω is the instantaneous angular acceleration of rolling, Vs is the volume of the particle and r is the radius of curvature of the force point with the rolling of the bed.
For the buoyancy component, since the solid medium is Geldart B particles, it is assumed that the density in the minimum fluidization state is the particle packing density. ρp(1 − εmf) = 1402 kg/m3, ρg = 1.225 kg/m3 and ρp(1−εmf)/ρg = 1.14 × 10³. By comparing the buoyancy component with the gravity component, the buoyancy component of the solid phase can be ignored.
For the other three forces, the main differences are gsin(Θ) (gravity force), 2usω (Coriolis force) and ω (Euler force), which are analyzed and compared below.
(1)
gsin(Θ)
This is mainly related to the size of the instantaneous inclination. The rolling amplitude of this study is 5~15°, so gsin(Θ) = 0.855~2.539 rad·m·s−2.
(2)
2usω
The key point is that the current particle velocity is difficult to determine. Because the point (1, 0.31) is located in the lower wall region of the inclined bed at the stage of t = T/4~3T/4, and the particles flow downward, the Coriolis force is opposite to the rolling tangential direction. From the point of view of particle flow in this study, the average particle velocity downward is about half of the gas velocity, which is about 1.0 × 10⁻¹ in the order of magnitude. This study takes the gas velocity as 0.15~0.3 m/s, and thus, the value range of the term is 2usω = 0.0053~0.0785 rad·m·s−2.
(3)
ω
This is not only related to the axial distance between the force point in the bed and the rolling axis, but also the angular acceleration of the rolling. Under the conditions of this study, taking the initial bed height of 500 mm as an example, considering the expansion and inclination of the bed, the axial distance between the force point of the bed and the center of the rolling axis is about 1.6 m. If the average angular acceleration is taken, the value range of the average angular acceleration is αω,ave = 0.0274~0.2056 rad/s2, and the calculated value range is ω = 0.0219~0.3290 rad·m·s−2.
By comparing these three items separately, it can be concluded that under different rolling parameters or in different stages under the same rolling parameter, the three forces may affect the particle flow at the same time. The combined force of the final particle phase is as follows:
t = T/4~T/2:
F T 2 , x = F G , x F C + F E = m g sin θ 2 u s ω + r α ω
t = T/2~3T/4:
F T 3 , x = F G , x + F C + F E = m g sin θ + 2 u s ω + r α ω
When t = T/4~3T/4, because the gravity component is always higher than the sum of the other two items, the direction of the combined force in the x-axis is always perpendicular to the right wall, that is, the positive direction along the x-axis. However, when the rolling tangential direction of the bed changes, the direction of the Coriolis force changes at the same time. This results in different combined forces in the x-axis direction in t = T/4~T/2 and t = T/2~3T/4. The value in t = T/2~3T/4 is larger. For the downward flowing particles, the combined force in the vertical downward direction is larger. This promotes the particles to maintain a large downward flow rate at these stages, thus delaying the conversion of the value and direction of the particle flow rate. Therefore, the difference of the Coriolis force direction between the particle phase in t = T/4~T/2 and t = T/2~3T/4 is the main reason for the appearance of the ‘lag phenomenon’ at this stage. This phenomenon leads to the prolonged accumulation of particles in the lower wall area of the inclined bed. This is not conducive to the fluidization of the gas–solid two-phase in the bed, and thus, further reduces the efficiency of the fluidized bed. Its complexity also brings some difficulties to the implementation of future regulatory measures.

4. Conclusions

(1)
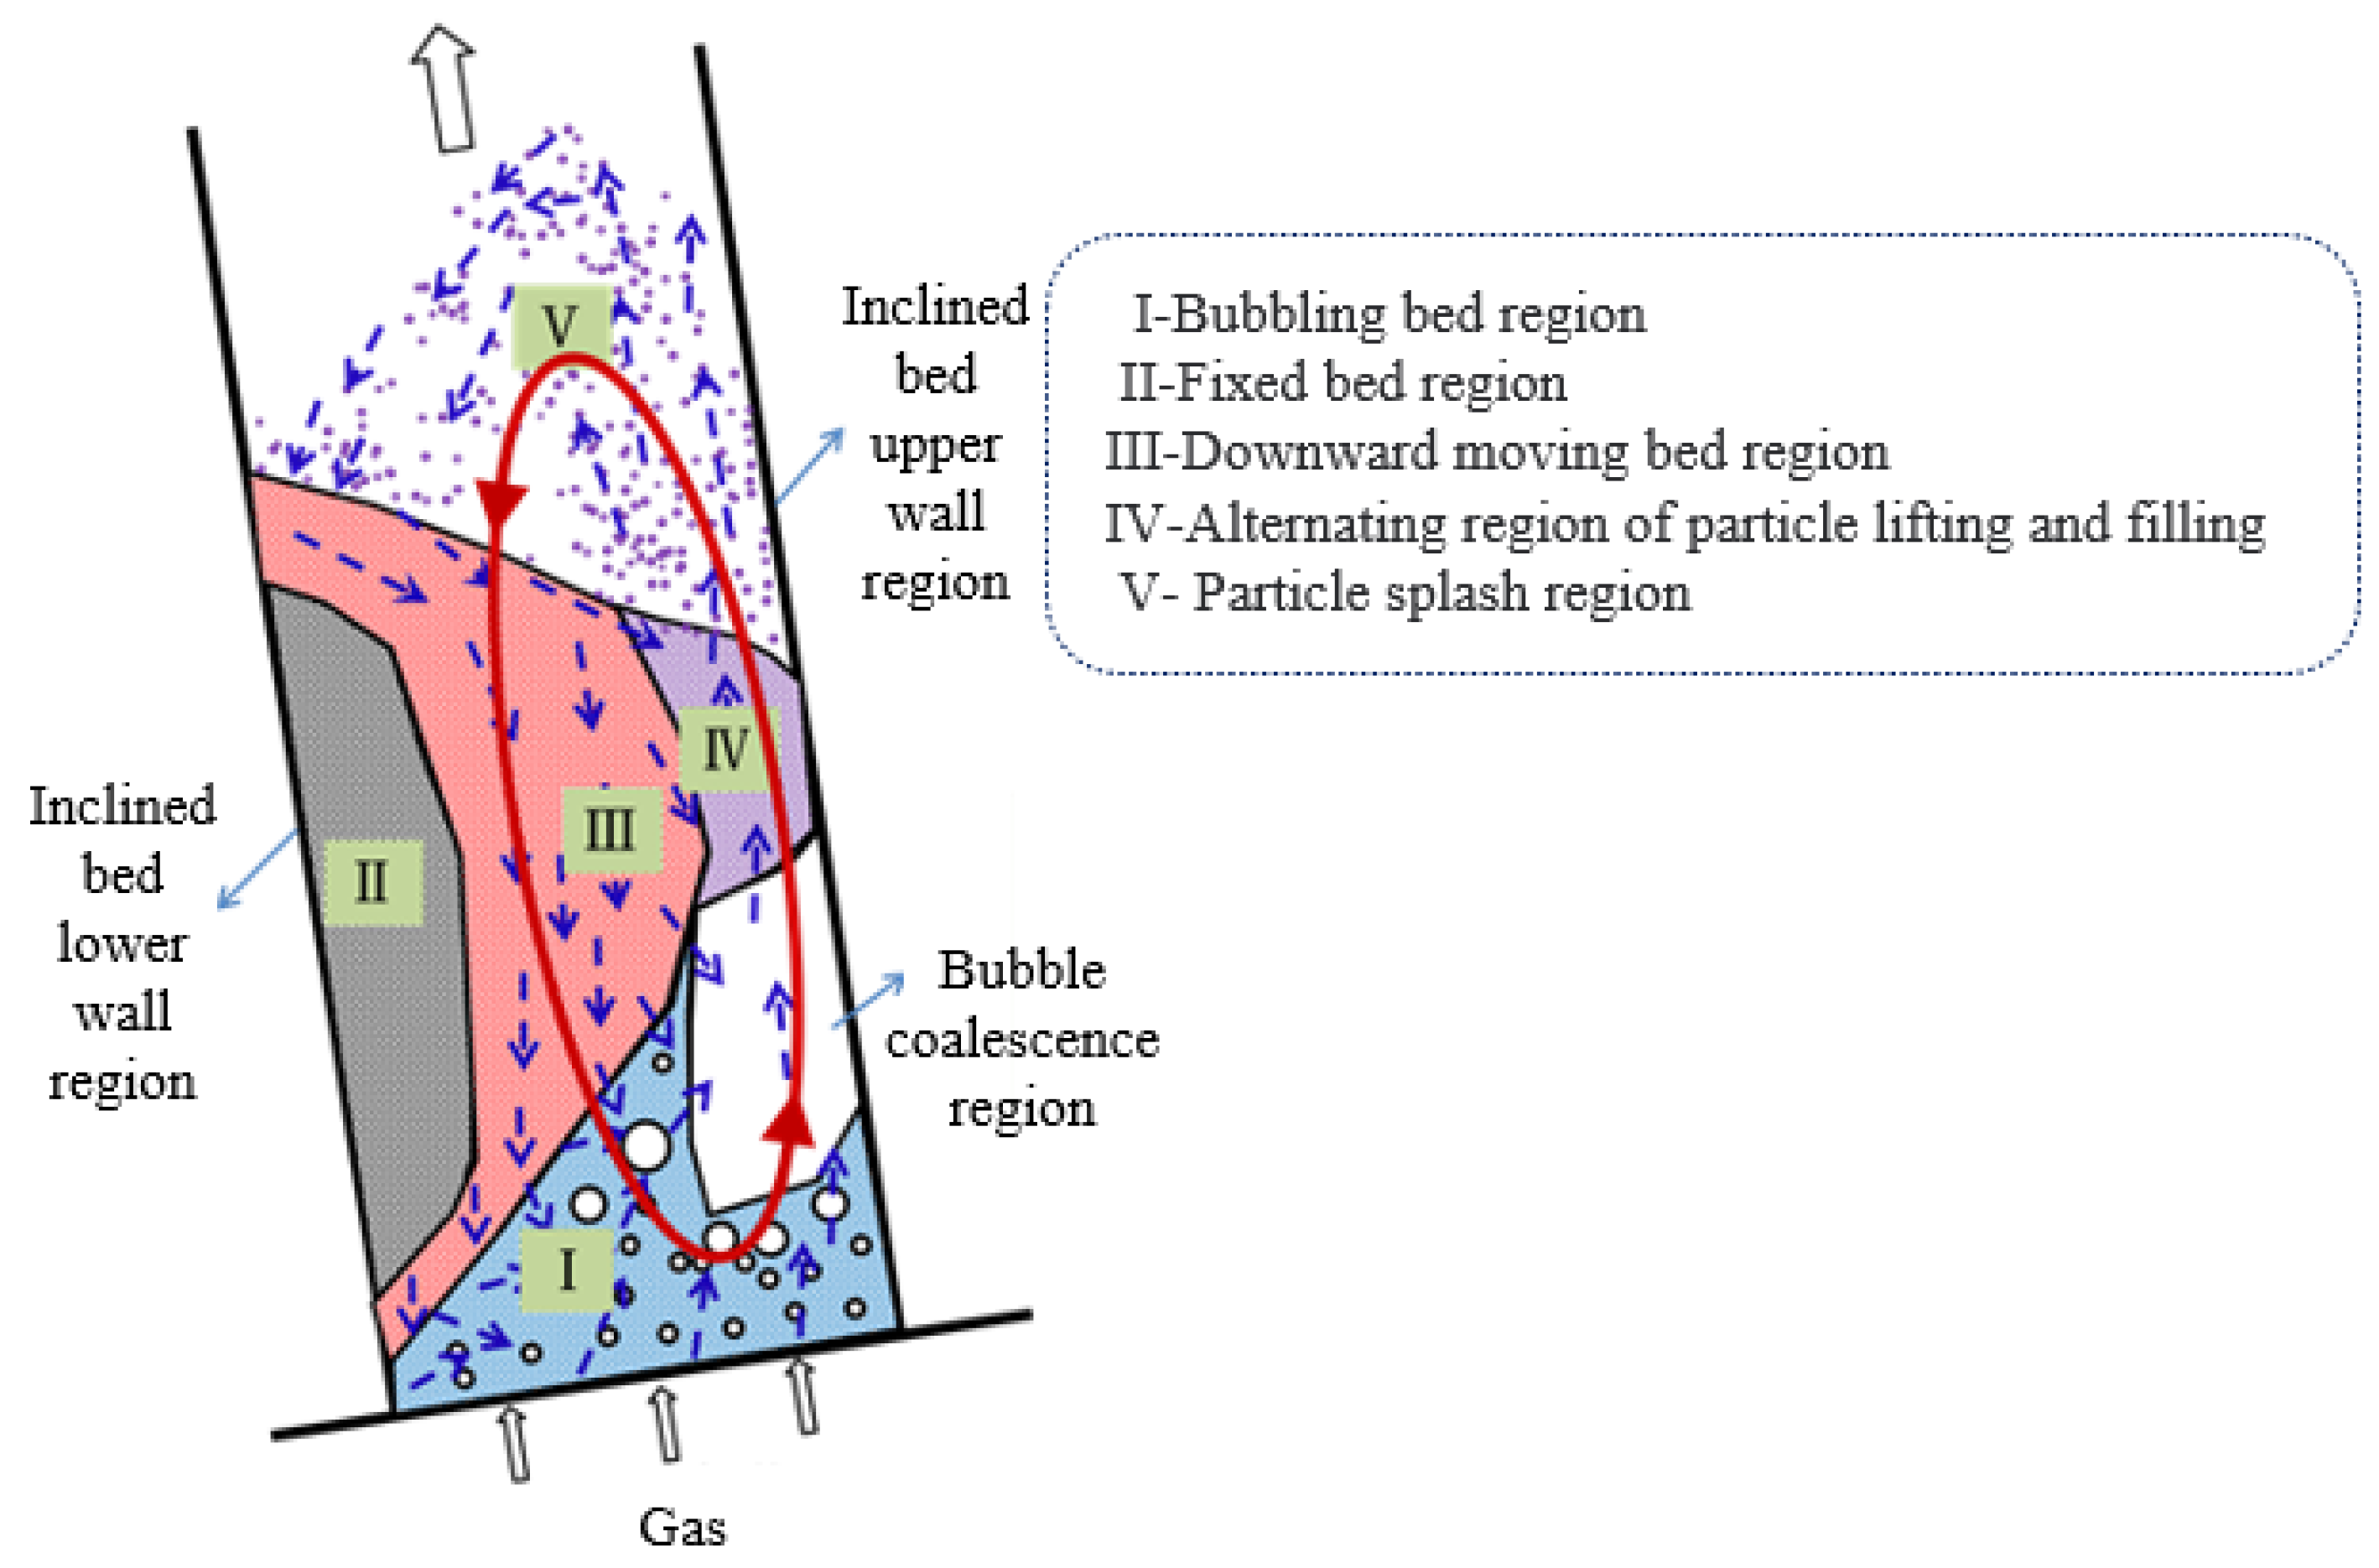
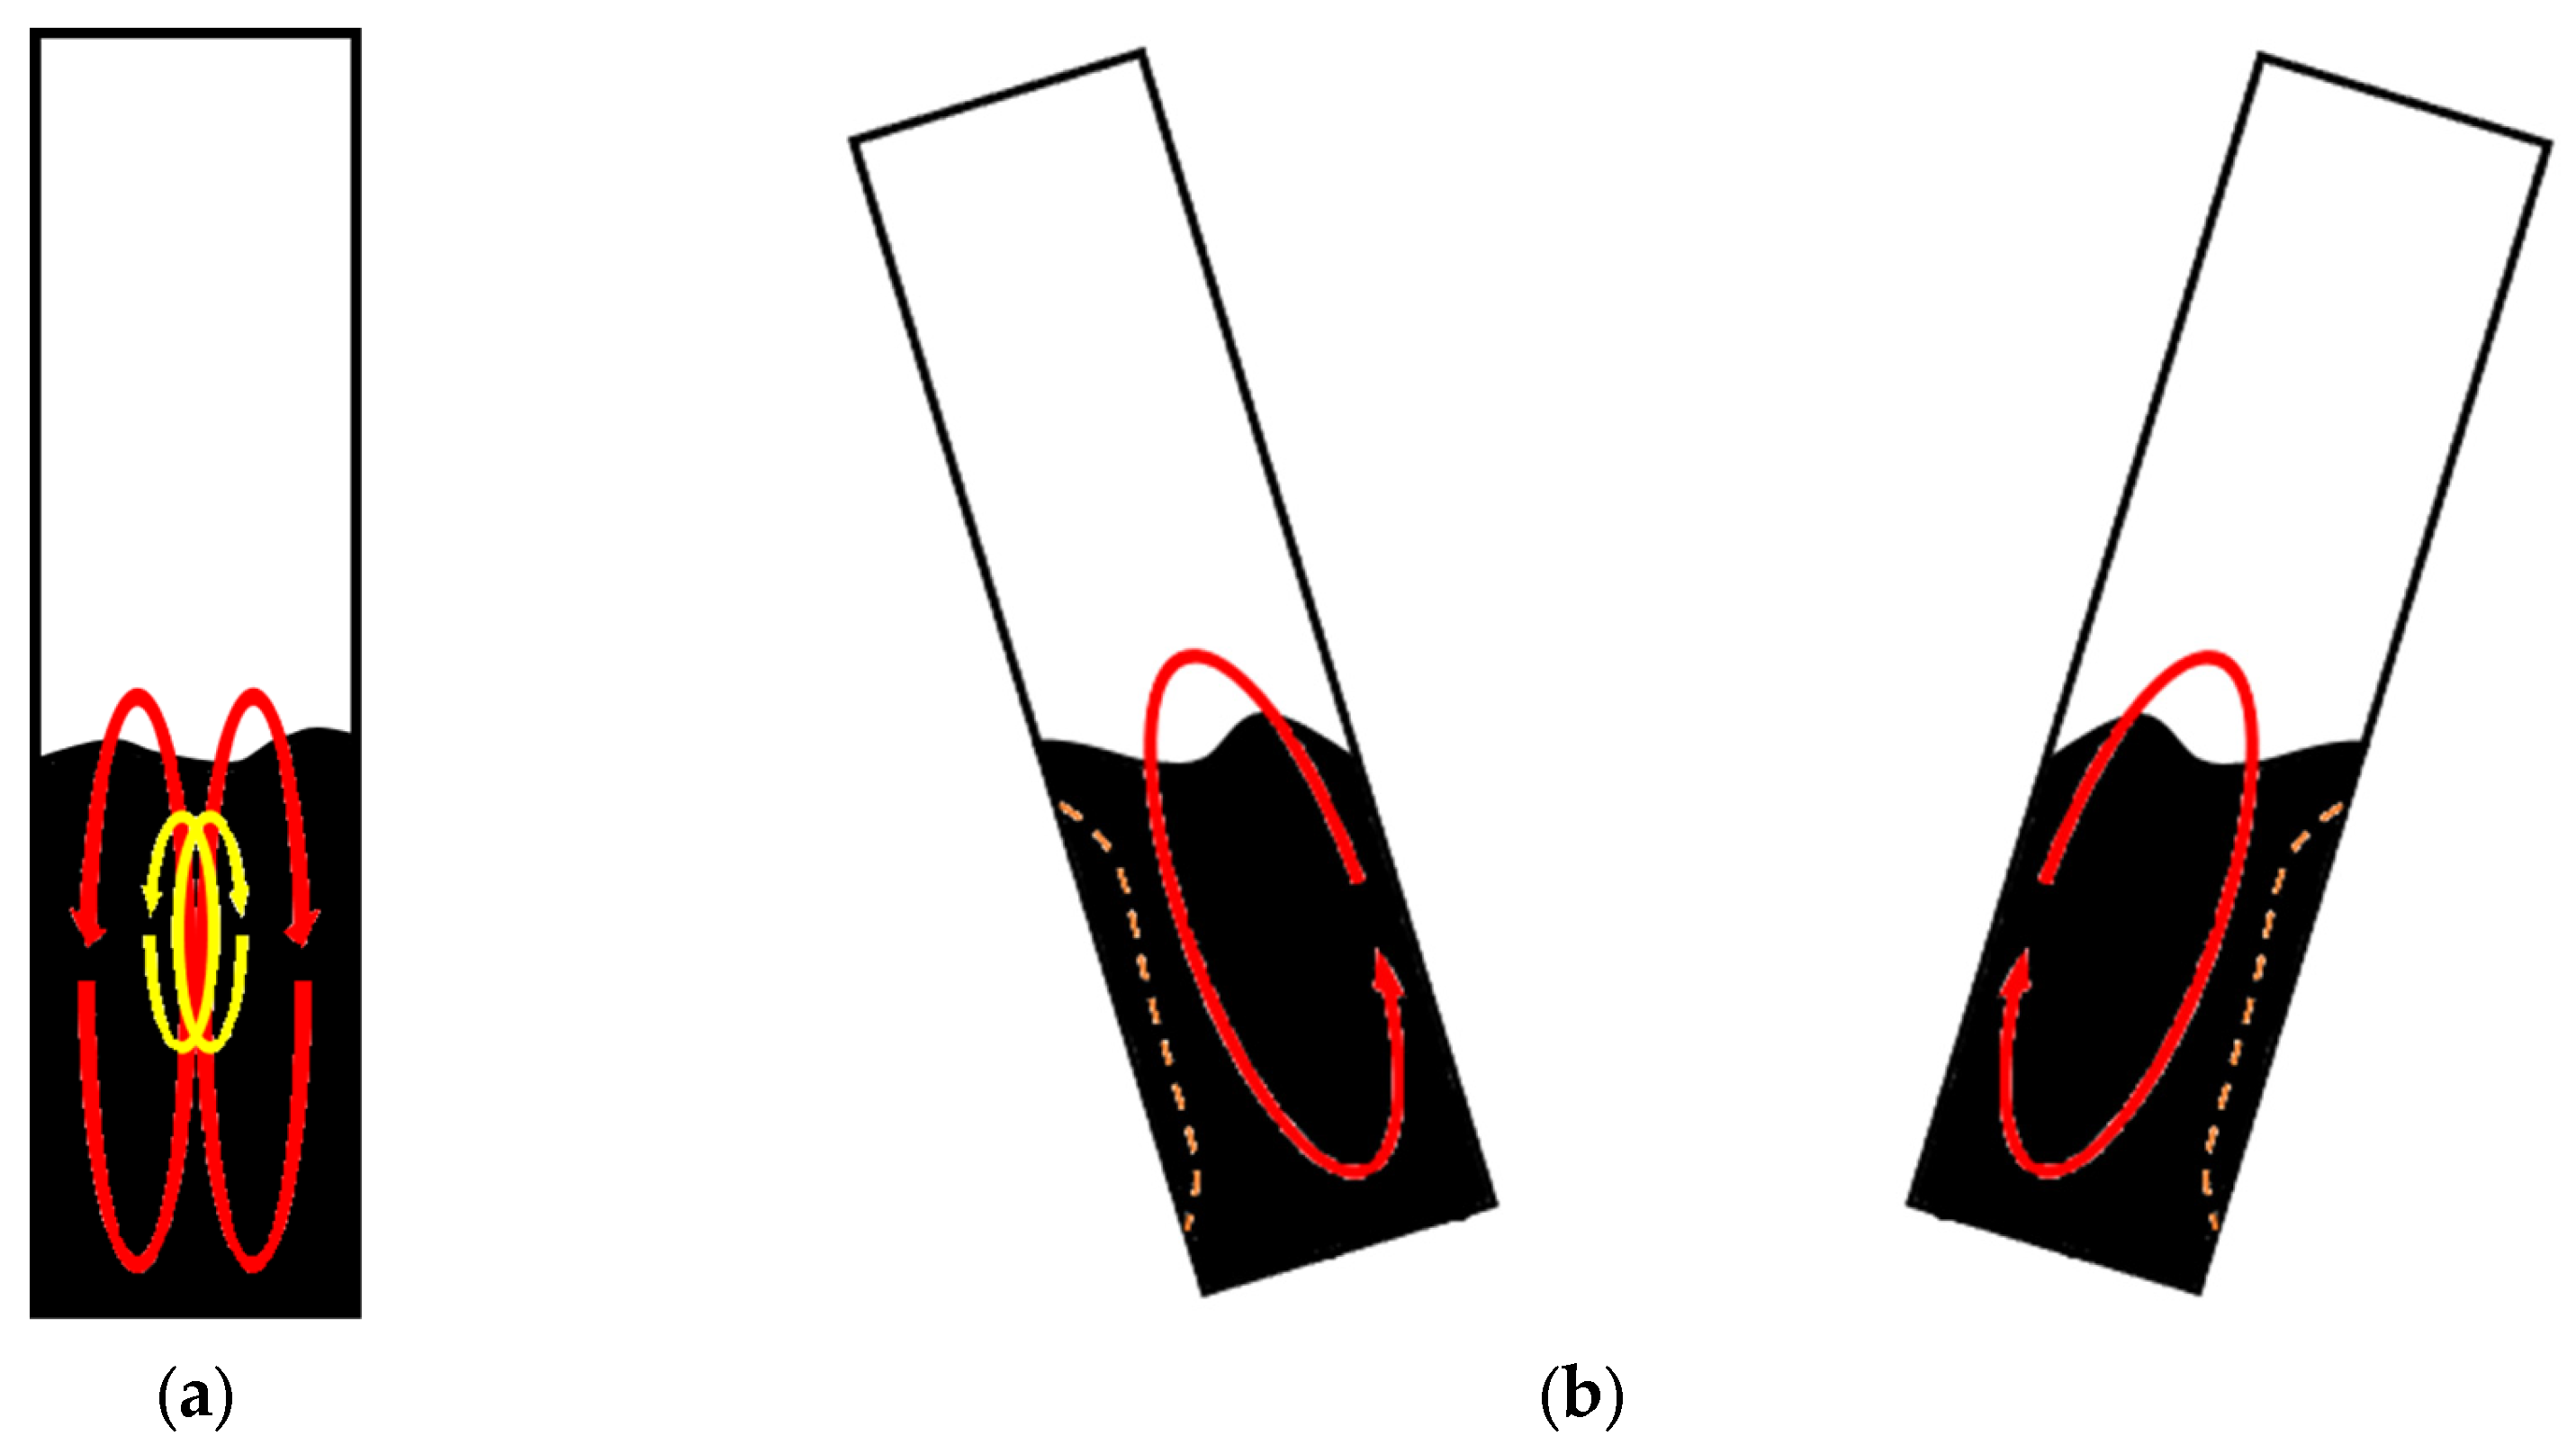
In the periodic rolling of the bed, the gas–solid accumulation state changes in the wall region, and the transient solid content signal shows periodic transition characteristics accordingly. The solid holdup in the lower wall region fluctuates at a low amplitude around high values. Meanwhile, the upper wall region has a high frequency and amplitude of solid holdup fluctuations. The characteristics of this periodic transition gradually weakens as the position moves toward the center line of the bed. At the center of the bed, its fluctuation pattern is similar to that in the upright bed.
(2)
The solid flow rate direction in the region near the center line of the rolling bed always remains upward, which is similar to that in the upright bed. The particles in the upper/lower wall region of the inclined bed are in an internal circulation flow mode. There is the gas phase aggregation in the upper wall region of the inclined bed, with the upward solid flow rate. On the contrary, the particle phase accumulates in the lower wall region of the inclined bed, with the downward solid flow rate.
(3)
Compared with the instantaneous inclination angle increase stage, there is a ‘lag phenomenon’ when the inclination angle decreases. Mainly affected by the change in the Coriolis force, the downward solid flow rate does not change synchronously with the decrease in the inclination angle. It is not conducive to the fluidization of the gas–solid two-phase in the bed, and thus, further reduces the efficiency of the fluidized bed.

Author Contributions

Conceptualization, S.Z. and J.H.; methodology, D.W.; software, J.H. and R.W.; validation, J.H., R.X. and B.W.; formal analysis, D.W.; investigation, Y.L.; resources, R.W.; data curation, J.H.; writing—original draft preparation, J.H.; writing—review and editing, D.W.; visualization, R.X.; supervision, B.W.; project administration, R.W.; funding acquisition, D.W. All authors have read and agreed to the published version of the manuscript.

Funding

This research was funded by Natural Science Foundation of Hebei Province: (B2022202003). The APC was funded by Natural Science Foundation of Hebei Province.

Data Availability Statement

Where no new data were created.

Acknowledgments

This work was supported by the Natural Science Foundation of Hebei Province (B2022202003).

Conflicts of Interest

The authors declare no conflict of interest.

Nomenclature

dpAverage particle size of particle in bedmm
g Acceleration of gravitym/s2
H Initial loading height of the bedmm
h Axial height of the bedm
p Pressure of fluidized bedPa
PbPressure drop in the fluidized bedPa
q Particle flow ratekg/s
r Radius of curvature of the force point with rolling of the bedm
SStandard deviation of solid holdupDimensionless
T Rolling periods
t Transient rolling moments
ugGas velocitym/s
umfMinimum fluidization velocitym/s
VsParticle volumem3
x Position of two-dimensional bed in horizontal directionmm
y Position of two-dimensional bed along axial height directionmm
αωInstantaneous angular acceleration of bed rollingrad/s2
εiComponent volume fractionDimensionless
εmfCritical gas volume fractionDimensionless
κ Specularity coefficientDimensionless
μiComponent viscosityPa·s
ΘRolling amplitude of rolling fluidized bed and inclination angle of inclined bed°
θ Instantaneous rolling angle°
ρiDielectric densitykg/m3
ρpParticle bulk densitykg/m3
ω Instantaneous rolling angular velocityrad/s
Subscripts
iSpecies in the bed
gGas
sParticle

References

  1. Du, C.S.; Wang, Z.F.; He, Y.L.; Qiu, H.W. Development law of floating production platform and development trend of South China Sea. New Technol. New Prod. China 2021, 9, 133–136. [Google Scholar]
  2. Zhang, L.L.; Fu, J.W.; Luo, Y.; Sun, B.C.; Zou, H.K.; Chu, G.W.; Chen, J.F. Technology and application of supergravity process strengthening for offshore engineering. J. Chem. Ind. Eng. 2020, 71, 1–15. [Google Scholar]
  3. Hong, G.H.; Moon, D.J. Development of fixed bed reactor for application in GTL-FPSO: The effect of nitrogen and carbon dioxide contents in feed gas on Fischer-Tropsch synthesis reaction over Ru/Co/Al2O3 catalyst. Catal. Today 2020, 353, 73–81. [Google Scholar] [CrossRef]
  4. Xu, P.F. Numerical Simulation and Structural Optimization Design of Two-Phase Flow Characteristics in Gas-Solid Fluidized Bed. Master’s Thesis, Qingdao University of Science and Technology, Shandong, China, 2020. [Google Scholar]
  5. Dashliborun, A.M.; Larachi, F.; Taghavi, S.M. Gas-liquid mass-transfer behavior of packed-bed scrubbers for floating/offshore CO2 capture. Chem. Eng. J. 2019, 377, 119236. [Google Scholar] [CrossRef]
  6. Iliuta, I.; Larachi, F. Fischer-Tropsch synthesis in vertical, inclined and oscillating trickle-bed reactors for offshore floating applications. Chem. Eng. Sci. 2018, 177, 509–522. [Google Scholar] [CrossRef]
  7. Dashliborun, A.M.; Füssel, A.; Larachi, F. Prospect of open-cell solid foams for floating-platform multiphase reactor applications—Maldistribution susceptibility and hydrodynamic behavior. Chem. Eng. J. 2018, 32, 596–607. [Google Scholar] [CrossRef]
  8. Sun, X.Z.; Li, Y.X.; Han, H.; Zhu, J.; Wang, S.; Liu, L. Experimental and numerical simulation study on the offshore adaptability of spiral wound heat exchanger in LNG-FPSO DMR natural gas liquefaction process. Energy 2019, 189, 116–178. [Google Scholar] [CrossRef]
  9. Dashliborun, A.M.; Zhang, J.; Taghavi, S.M.; Larachi, F. Marinization of Multiphase Reactors through the Prism of Chemical Engineers. Ind. Eng. Chem. Res. 2019, 58, 2607–2630. [Google Scholar] [CrossRef]
  10. Yasui, T.; Nakayama, T.; Yoshida, K. Heat-transfer characteristics in a rocking fluidized bed. Int. Commun. Heat Mass Transf. 1984, 11, 477–488. [Google Scholar] [CrossRef]
  11. Nishi, Y. Characteristics of fluidized bed under oscillation. Kagaku Kogaku Ronbunshu 1986, 12, 414–419. [Google Scholar] [CrossRef] [Green Version]
  12. Namie, S.; Osanai, T.; Yamanouchi, H.; Yokomura, T. Investigation on Fluidized Bed Combustion for Marine Application. J. Mar. Eng. Soc. Jpn. 1984, 19, 943–950. [Google Scholar] [CrossRef] [Green Version]
  13. Zhao, S. Research on Marine Fluidized Bed Waste Gas Boiler. Ship Sci. Technol. 1992, 3, 13–18. [Google Scholar]
  14. Murata, H.; Oka, H.; Adachi, M.; Harumi, K. Effects of the ship motion on gas-solid flow and heat transfer in a circulating fluidized bed. Powder Technol. 2012, 231, 7–17. [Google Scholar] [CrossRef]
  15. Zhao, T.; Liu, K.; Murata, H.; Harumi, K.; Takei, M. Experimental and numerical investigation of particle distribution behaviors in a rolling circulating fluidized bed. Powder Technol. 2014, 258, 38–48. [Google Scholar] [CrossRef]
  16. Zhao, T.; Liu, K.; Murata, H.; Harumi, K.; Takei, M. Investigation of bed-to-wall heat transfer characteristics in a rolling circulating fluidized bed. Powder Technol. 2015, 269, 46–54. [Google Scholar] [CrossRef]
  17. Zhao, T.; Nakamura, Y.; Liu, K.; Murata, H.; Takei, M. The effect of rolling amplitude and period on particle distribution behavior in a rolling circulating fluidized bed. Powder Technol. 2016, 294, 484–492. [Google Scholar] [CrossRef]
  18. Tian, P.; Wang, D.W.; Wang, R.J.; Tang, M.; Hao, X.L.; Zhang, S.F. Gas-solid flow characteristics of oscillating fluidized bed. J. Chem. Ind. Eng. 2021, 72, 5102–5113. [Google Scholar]
  19. Tian, P. Fluidization Characteristics of Gas-Solid Rolling Fluidized Bed. Master’s Thesis, Hebei University of Technology, Tianjin, China, 2021. [Google Scholar]
  20. Ma, S.H. Numerical Simulation of Geldart A Granular Packed Bed. Master’s Thesis, Hebei University of Technology, Tianjin, China, 2019. [Google Scholar]
  21. Sun, M.Y.; Yu, C.B.; Lv, D.; Wei, L.B. Adaptability of models with different liquid-solid momentum exchange coefficients to numerical simulation of particle fluidization behavior. J. Cent. South Univ. 2019, 50, 1–8. [Google Scholar]
  22. Bai, L.; Han, C.; Xu, Y.F.; Zhou, L.; Zhang, L.J.; Shi, W.D. Numerical simulation and experimental study on CFD-DEM of bubbling fluidized bed based on different drag models. J. Drain. Irrig. Mach. Eng. 2022, 40, 49–54. [Google Scholar]
  23. Enwald, H.; Peirano, E.; Almstedt, A.E. Eulerian two-phase flow theory applied to fluidization. Int. J. Multiph. Flow 1996, 22, 21–66. [Google Scholar] [CrossRef]
  24. Huilin, L.; Gidaspow, D.; Bouillard, J.; Wentie, L. Hydrodynamic simulation of gas–solid flow in a riser using kinetic theory of granular flow. Chem. Eng. J. 2003, 95, 1–13. [Google Scholar] [CrossRef]
  25. Lun, C.K.K.; Savage, S.B.; Jeffrey, D.J.; Chepurniy, N. Kinetic theories for granular flow: Inelastic particles in Couette flow and slightly inelastic particles in a general flow field. J. Fluid Mech. 1984, 140, 223–256. [Google Scholar] [CrossRef]
  26. Gidaspow, D.; Bezburuah, R.; Ding, J. Hydrodynamics of Circulating Fluidized Beds: Kinetic Theory Approach; Illinois Institute of Technology: Chicago, IL, USA, 1991. [Google Scholar]
  27. Schaeffer, D.G.; Pitman, E.B. Ill-posedness in three-dimensional plastic flow. Commun. Pure Appl. Math. 1988, 41, 879–890. [Google Scholar] [CrossRef]
  28. Johnson, P.C.; Jackson, R. Frictional–collisional constitutive relations for granular materials, with application to plane shearing. J. Fluid Mech. 1987, 176, 67–93. [Google Scholar] [CrossRef]
  29. Li, D.Y. Research on Gas-Solid Two-Phase Flow Model of Fluidized Bed Based on Fluent Software. Master’s Thesis, Chongqing University, Chongqing, China, 2009. [Google Scholar]
  30. Yang, F.J. Experimental and Simulation Study on Gas-Solid Fluidized Bed. Master’s Thesis, Zhejiang University, Zhejiang, China, 2005. [Google Scholar]
  31. Dong, S.Q. Experimental Study and Numerical Simulation on Flow Characteristics of Gas-Solid Fluidized Bed. Master’s Thesis, Qingdao University of Science and Technology, Shandong, China, 2009. [Google Scholar]
  32. Hu, R.T.; Ren, L.B.; Wang, D.W.; Liu, Y.; Zhang, S.F. Numerical simulation of liquid-solid flow characteristics in fully developed section of vertical narrow channel. J. Chem. Ind. Eng. 2018, 69, 3408–3417. [Google Scholar]
Figure 1. Schematic diagram of typical gas–solid flow state and intra-particle circulation in a rolling fluidized bed [18].
Processes 11 01696 g001
Figure 2. Schematic diagram of gas–solid rolling fluidized bed experimental device and process [18]. 1. Roots blower; 2. gas buffer tank; 3. stop valve; 4. rotameter; 5. rolling platform; 6. air chamber; 7. bed section; 8. settling section; 9. camera; 10. pressure signal acquisition system; 11. computer.
Processes 11 01696 g002
Figure 3. Rolling mode of the bed and the time variation of instantaneous inclination angle and angular velocity during the rolling process. (a) Rolling mode of the bed; (b) instantaneous inclination angle and angular velocity.
Processes 11 01696 g003
Figure 4. Physical modeling, meshing and data extraction point placement (unit: mm). (a) Physical modeling and data extraction point placement; (b) meshing.
Processes 11 01696 g004
Figure 5. Pressure drop under different mesh sizes.
Processes 11 01696 g005
Figure 6. Comparison of the flow field distribution of the fluidized bed under different rolling periods and amplitudes ( t = T/2, ug = 0.44 m/s, H = 500 mm). (a) Different rolling periods (Θ = 10°); (b) different rolling amplitudes (T = 8 s).
Processes 11 01696 g006aProcesses 11 01696 g006b
Figure 7. Comparison of the simulated pressure axial distribution and experimental results under different rolling conditions ( t = T/2, ug = 0.44 m/s, H = 500 mm). (a) Different rolling periods (Θ = 10°; (b) different rolling amplitudes (T = 8 s).
Processes 11 01696 g007
Figure 8. Time variation of solid holdup under different horizontal positions in the upright and rolling bed (ug = 0.44 m/s, H = 500 mm, T = 8 s, Θ = 10°). (a) Upright bed; (b) rolling bed.
Processes 11 01696 g008
Figure 9. Time variation of solid holdup under different axial positions in the upright and rolling bed (ug = 0.44 m/s, H = 500 mm, T = 8 s, Θ = 10°). (a) Upright bed; (b) rolling bed.
Processes 11 01696 g009
Figure 10. Standard deviation of solid holdup at different points in the rolling and upright bed (ug = 0.44 m/s, H = 500 mm, T = 8 s, Θ = 10°).
Processes 11 01696 g010
Figure 11. Time variation of solid flow rate in different regions of the upright and rolling bed (ug = 0.44 m/s, H = 500 mm, T = 8 s, Θ = 10°). (a) The top of the bed (h = 0.51 m); (b) the middle of the bed (h = 0.31 m); (c) the bottom of the bed (h = 0.11 m).
Processes 11 01696 g011aProcesses 11 01696 g011b
Figure 12. Schematic diagram of the solid circulation form in the upright and rolling bed. (a) Upright bed; (b) rolling bed.
Processes 11 01696 g012
Figure 13. Force analysis of the particle phase in the right inclined state. (a) t = T/4~T/2; (b) t = T/2~3T/4.
Processes 11 01696 g013
Disclaimer/Publisher’s Note: The statements, opinions and data contained in all publications are solely those of the individual author(s) and contributor(s) and not of MDPI and/or the editor(s). MDPI and/or the editor(s) disclaim responsibility for any injury to people or property resulting from any ideas, methods, instructions or products referred to in the content.

