Abstract
The industrial sector demands 25% of global energy as heat, where one-third is used at temperatures below 150 °C. Nevertheless, the installed solar heating capacity in the industry is only 0.02%, even though the integration of solar heating systems into production processes could significantly reduce fossil fuel consumption at a competitive cost. Among other reasons, this low penetration is due to the final users’ lack of knowledge of solar heating technologies. As a result, a free pre-feasibility assessment tool was developed for non-specialised users to evaluate the possibility of integrating solar heat into their processes using basic information. This tool uses transient simulation to estimate a feasible solar heating system through the parametric optimisation of the solar collection area, thermal storage volume, heat exchange capacity, and solar integration schemes at the supply level and costs. A commercial facility in Mexico was analysed using the developed tool as a case study. However, even when this is not a design tool, the calculated solar collector area, storage tank volume, and investment were only 2.1%, 9.0%, and 2.3% higher than reported by the solar designer. Pre-feasibility assessment tools are essential to overcome the certainty gap between end users and solar designers, thus enhancing the possibility of implementing solar heating systems in various commercial and industrial processes.
1. Introduction
According to the International Renewable Energy Agency, by the end of 2020, there was a global renewable energy generation capacity of 2799 GW, where hydro shares 43%, wind 26%, and solar 26% [1]. Solar energy stands out among the other renewable energy sources as the most significant contributor to capacity growth this year, with 127 GW [1]. Furthermore, the accumulated solar thermal capacity was 501 GWth, and the annual solar thermal production of 407 TWh was equivalent to 141.3 million tons of CO2 not emitted to the atmosphere [2].
More than 90% of the installed solar thermal systems are small-scale solar water heating systems. However, large-scale district heating systems and industrial applications have grown considerably [3]. As a result, they reached record-breaking levels in solar heat capacity additions, as revealed by the world thermal energy report [2] and the Solar Heat for Industrial Processes (SHIP) plants database [4].
Most of the energy demand in both the domestic and commercial sectors is in the low-temperature range (less than 150 °C). Such demand can be easily covered with flat-plate or evacuated tube solar collectors, which are mature technologies with a consolidated market. A similar situation arises in the industrial sector, where 30% of its heat consumption is below 150 °C, and 22% is medium-temperature (150 °C to 400 °C), where solar concentrating systems can cover this temperature range [5].
The industrial sector consumes 38% of the global energy demand, two-thirds of which is heat; therefore, integrating solar heating systems into industrial applications is a sustainable solution for reducing greenhouse gases (GHG) [6]. In addition, many countries have great potential to incorporate solar heating systems into their industrial sectors.
However, despite its environmental and economic advantages, only a few industries are using solar heat, since the current installed capacity is less than 0.02%, although, by 2026, industrial heat consumption will be expected to triple [7]. Already, SHIP systems have shown to be a viable alternative in numerous industrial processes such as curing, drying, washing, pasteurisation, and sterilisation, among many others [8]. Therefore, solar heat for industrial processes is a worldwide niche for commercialisation, especially for processes with low- and medium-temperature requirements.
One of the barriers to achieving better market penetration is the final users’ lack of certainty about the economic advantages and technical feasibility of solar thermal systems, especially for small- and medium-scale industries. Furthermore, the complex nature of integrating solar heating technologies into industrial processes makes it necessary to count on technical knowledge, reliable information, and some design tools.
Several steps for the adequate development of any solar heating project need to be considered, from process characterisation and conceptual integration of the system, passing on the pre-feasibility study, to modelling and simulation, technical–economic optimisation, detail engineering, installation, and commissioning [9]. Thus, a first decision is to be made based on a pre-feasibility analysis, which allows for a quick estimate as to whether it is feasible to use solar heat in the process. In other words, the user needs an estimate depending on the available space to install the solar heating system, the initial investment required, and the payback time. In addition, a simple pre-feasibility study requires knowing at least the location, annual energy use profile, the available area for the SHIP installation, and process temperature requirements. This information is considered essential and easy to obtain for any industrial process. A positive result from a pre-feasibility analysis could be considered the first requirement to further developing a complex solar energy project.
In recent years, robust tools have increasingly been developed to analyse solar thermal systems; some perform transient analysis and even incorporate economic analysis to calculate the feasibility of implementing such systems into an energy project. For example, Karki et al. developed an MS-Excel tool to analyse several scenarios using flat-plate collectors for applications below 100 °C, to be used by small and medium industrial users [10]. The tool was oriented to be practical with a smaller computational demand than simulation-based tools. Moreover, Eddouibi et al. implemented a tool for a case study of an organic Rankine cycle in a plant that uses parabolic trough collectors (PTC), with open-source tools (SAM, coolprop, and Python) using dynamic simulations and a thermodynamic module [11].
Casanovas-Rubio and Armengou [12] created a tool to categorise and select domestic water heating systems (WHS) to determine the system with the least environmental and social impact and the lowest economic cost. Ktistis et al. developed an autonomous TRNSYS model to study an industrial PTC system and validated it using experimental data from the actual system [13]. This tool was developed as a design instrument to be used by the industrial sector interested in finding a system that meets their needs. The user can obtain valuable information about the size, solar gains, financial information such as the LCCA (life-cycle cost analysis), savings, and avoided CO2 emissions. Biencinto et al. implemented a computational model to simulate the performance of a PTC in a thermo-hydraulic loop for steam generation [14]. This tool was developed using TRNSYS in a quasi-dynamic approach and compared against experimental data. In addition, it was designed in a modular scheme, allowing for the integration of a complete solar thermal plant and the capability to develop long-term energy analyses.
At the commercial level, several software tools on the market can perform a pre-feasibility study of SHIP projects, such as Polysun, Greenius, TSol, SAM, IKI Solar, Insel, RETScreen, and ColSim, among others. However, some of these tools require advanced technical knowledge, are intended for specialised users only, or even require formal training and a commercial licence. In other cases, their databases are limited, outdated, or have low flexibility for different integration schemes [15]. Moreover, there are a few tools for non-specialised users with free access, such as SHIPCal-ReSSSPI, Insun, AppSol, SHIP Design Tool, and Fraunhofer SHIP Calculator. Nevertheless, many of these tools are limited in the available options for integration schemes, technologies included, or the application of geographical regions, such as AppSol, which applies only to the Chilean region [16].
In Mexico, only three pre-feasibility assessment tools are available, two of which are intended for specialised users only [17,18]. Among other capabilities, they allow for setting the load profile of the process and a solar fraction target but require technical information such as the average temperature of the solar collectors’ operation and incident solar irradiation. Furthermore, they need economic data such as the collectors’ and storage tank costs, inflation rates, operation and maintenance costs, etc. The third tool is based on the F-Chart methodology [19] and is not an open-access tool, since it is intended for companies in the Mexican thermo-solar industry.
All the tools mentioned above perform a pre-feasibility analysis on a case-by-case basis, and most do not consider a transient system operation, which directly influences the sizing of the solar thermal system and the expected savings.
This work presents a pre-feasibility assessment tool based on transient simulation for solar heating systems for industrial or commercial processes in Mexico. An optimisation algorithm was also implemented to find the system with the shortest payback time for each of the four integration schemes available, with multiple parameter variations such as the solar field area, thermal storage volume, and heat exchanger capacity. An important contribution of the developed tool is the transient analysis using hourly weather information for each specific location instead of constant monthly averages.
The tool provides the flexibility to pre-assess the technical and economic feasibility of solar industrial process heating implementation using minimum information. Thus, the objective of this work is to provide a valuable and free tool that allows the end users to pre-assess the feasibility of solar heat applications, even for non-specialised users.
Finally, the aim is to provide a preliminary economic forecast, obtained quickly and easily with basic information, to determine the possibility of implementing SHIP.
2. Integration Schemes Analysed
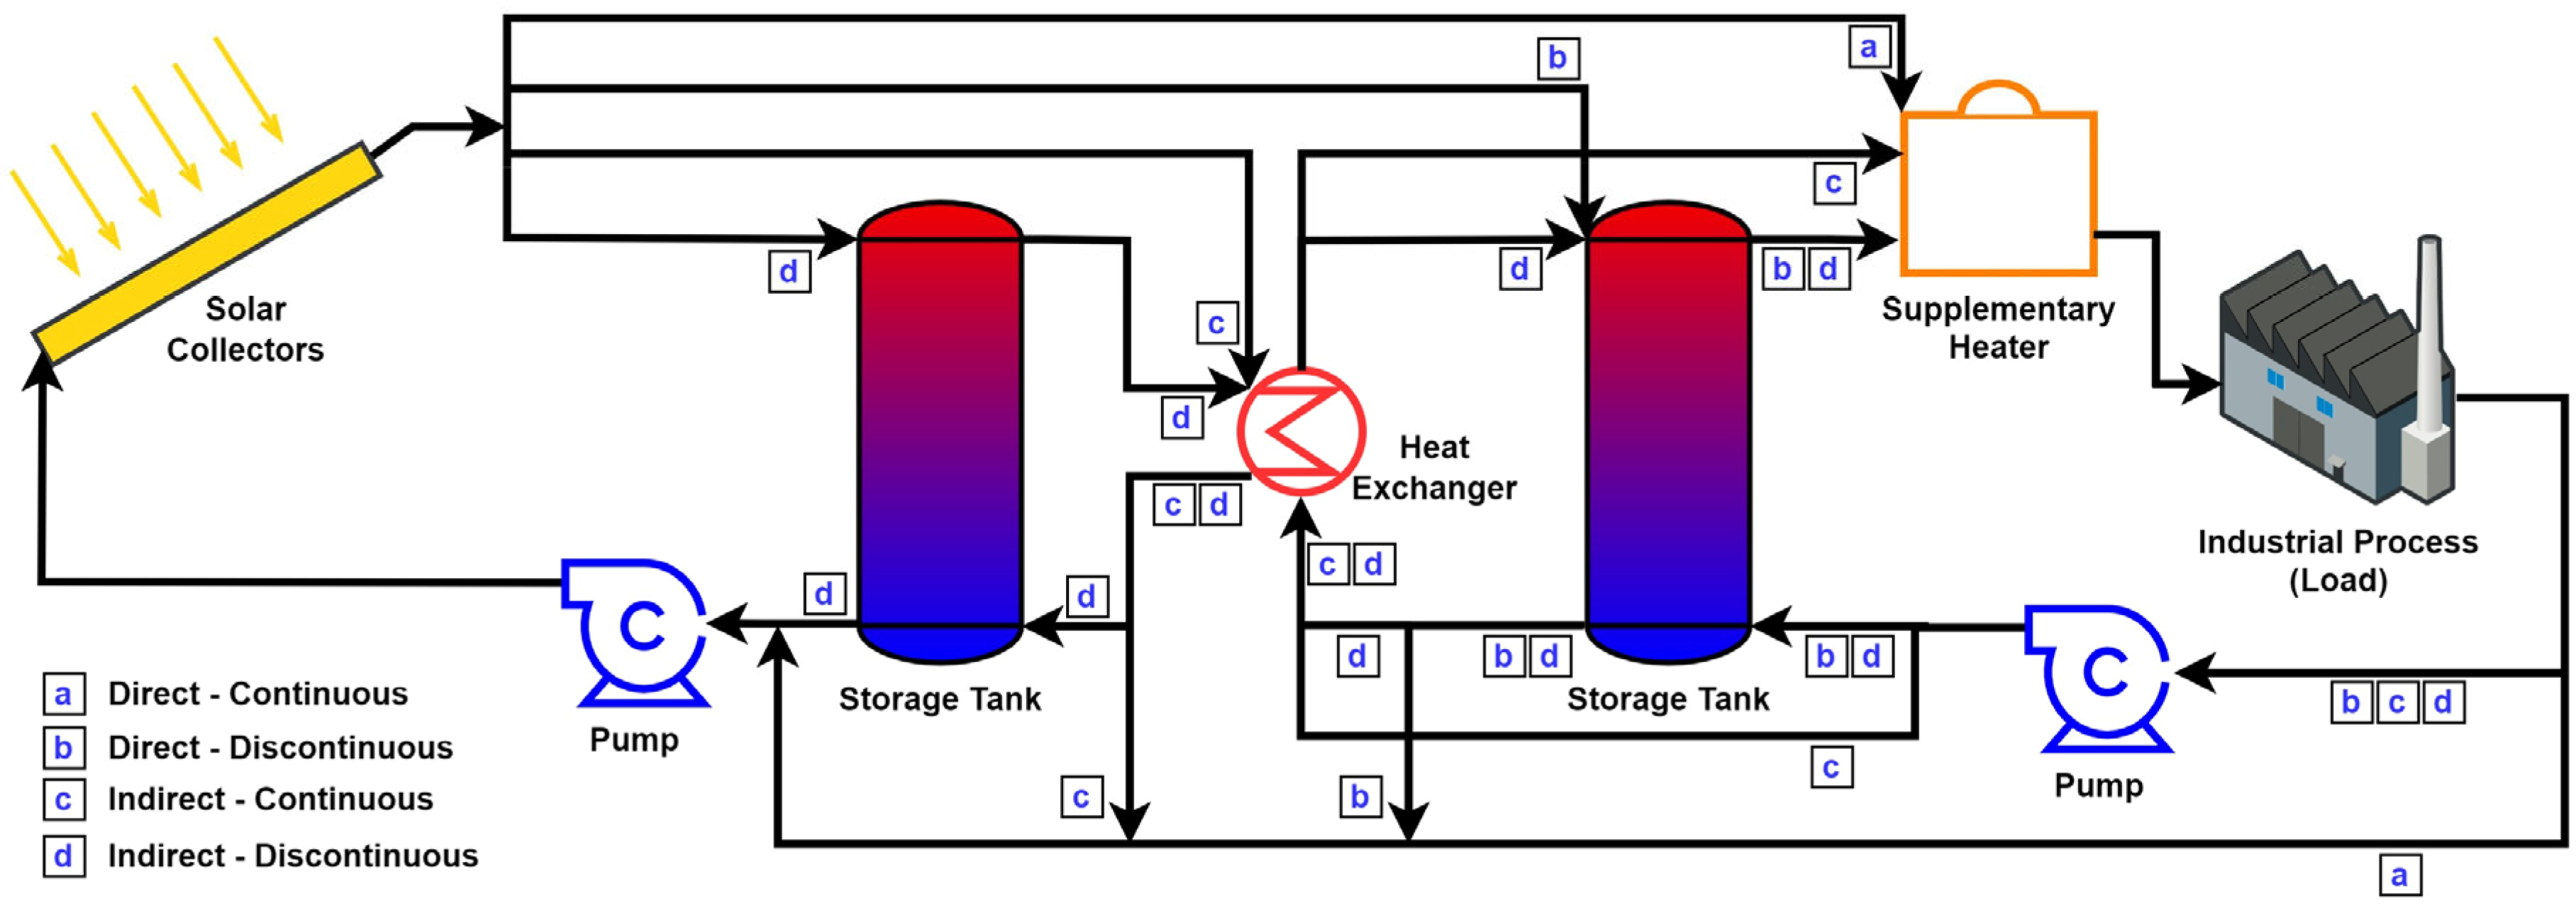
Four different integration schemes at the supply level were defined in the simulation model (see Figure 1). First, an indirect–discontinuous scheme of solar integration was developed, where the solar heating loop and process loop are separated by a heat exchanger (indirect system). The process has a storage tank used as a hot fluid buffer, which allows for delivering energy to the process for extended periods (discontinuous operation). After, based on the flow path, the indirect–discontinuous scheme of solar integration can be simplified to analyse an indirect–continuous scheme, a direct–discontinuous scheme, or a direct–continuous scheme. In every case, the solar system has a supplementary heat source to guarantee the temperature required at the load’s supply.
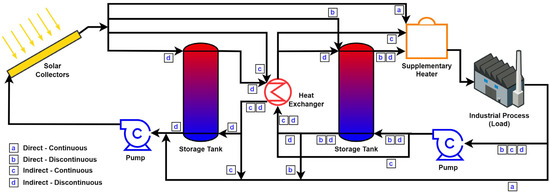
Figure 1.
General integration schemes.
The four integration schemes are:
- (a)
- Direct–continuous scheme: The fluid from the solar collectors is sent to the supplementary heater and then to the process load.
- (b)
- Direct–discontinuous scheme: The fluid from the solar collectors is sent to the first thermal storage tank, then to the supplementary heater, and finally to the process load.
- (c)
- Indirect–continuous scheme: The fluid from the solar collectors is in a closed loop with the heat exchanger. Further, the load fluid passes through the heat exchanger to the supplementary heater and finally to the process load.
- (d)
- Indirect–discontinuous scheme: The fluid from the solar collectors is in a closed loop with a thermal storage tank and to the heat exchanger. In another closed loop, the load fluid goes from the second thermal storage tank to the heat exchanger, then to the supplementary heater, and finally to the process load.
These four integration schemes were selected, since they are considered standard options for supply-level solar integrations [4].
Components
The main components involved in the four integration schemes are solar collectors, thermal storage tanks, and heat exchangers. In addition, a supplementary heater and several valves and pumps are considered.
Some information, such as efficiency, capacity, and equipment costs (in USD), was gathered from the Mexican market. As a result, data from ten certified solar collectors were available: seven flat-plate collectors (FPC), two evacuated tube collectors (ETC), and a parabolic trough collector (PTC) [20,21,22]. Table 1 shows the main information needed to model the solar collectors, including the coefficients for calculating the thermal efficiency at normal incidence and the incidence angle modifier (IAM) [23]:

Table 1.
Solar collector information in the pre-feasibility simulation model.
In all cases, the test fluid reported is water, except for the PTC, where a thermal oil was used.
The thermal storage tanks are stratified and have a constant thermal loss coefficient of 0.833 W/m2·K. The heat exchanger operates in parallel flow mode, and the supplementary heater has an efficiency of 80%.
In addition, two equations were defined and implemented into the transient simulation to calculate the associated cost of storage tanks and heat exchangers (data from seven high-temperature porcelain-enamelled steel storage tanks and ten plate heat exchangers were used):
3. Pre-Feasibility Assessment Tool
The tool was created by combining multiple TRNSYS18 capabilities [24], such as those in the TRNSYS simulation studio for the simulation model design, trnsed for creating constraints, and programming the user’s front end, through which the user can set the input values.
In addition, an optimisation algorithm was implemented using GenOpt to obtain one possible solution for each integration scheme to meet the user’s technical requirements and to deliver solar heat to the process in question at the fastest possible amortisation. GenOpt is a Generic Optimisation Program that minimises cost functions assessed by other simulation programs [25], whereas TRNOPT couples GenOpt to the TRNSYS operation [26]. In other words, every simulation performed is a potential solution for the user. Moreover, this algorithm selects the solution with the shortest payback time from the pool of all the possible solutions found. Once the optimisation process reaches the solution, the user obtains a simple and easy-to-understand report containing enough financial information to decide whether the solar heating system is feasible. This tool presents the novelty of implementing several TRNSYS capabilities for a pre-feasibility assessment of solar industrial processes’ heating, taking advantage of TRNSYS reliability, using simple information that can be provided by any non-specialised user without the need for a commercial licence.
However, the application of this tool is limited, temporarily, to liquid working fluids and weather information of the Mexican territory. In addition, thermal inertia as a result of piping installation is not considered. At this stage of the project analysis, the piping systems connecting the various devices are not yet defined. Finally, the tool allows for an accurate estimation of the cost of systems up to 150 m2 of solar collection area.
3.1. Transient Simulation Methodology
The tool was developed in the TRNSYS simulation studio, a modular system in which a mathematical model represents each physical component (named Type in TRNSYS); operating conditions are fed as inputs, and, as a result, output conditions are obtained; thus, all components are interconnected, so that the behaviour of the whole solar thermal system is analysed. The main components included in the simulation model are listed in Table 2.

Table 2.
Simulation main component models.
The transient simulation model uses a 200 s time step to analyse the operation of solar thermal systems over a typical meteorological year for each of the four integration schemes.
The integration scheme to perform each simulation is set by means of changing the flow direction in the several three-way valves. Additionally, other valves in the simulation are used to select the solar collector type, i.e., flat-plate, evacuated tube, or parabolic trough collector.
In addition, the model has several operation periods, such as seasonal (summer or winter) or a year through operation, as well as several options for weekly and daily profiles. All of the above are forcing functions set in the TRNSYS simulation, whose values directly impact the load profile distribution throughout the year. However, this load profile distribution will result in a constant value throughout the working hours of the days specified by the user in the front end. Currently, the tool integrates information for the 18 major cities in Mexico listed in Table 3, with the possibility of incorporating new ones at the demand of the end user.

Table 3.
Mexican cities’ coordinates and yearly solar resources [28].
3.2. Cost Analysis
The cost analysis was carried out using the method, incorporated in the type 582b of TESS libraries [29]. This method allows for determining the life-cycle cost () of an investment option or alternative. In addition, this component has the capability of comparing the resulting of two system alternatives by determining the and indicators [29]:
The indicator is the rate between the fuel cost during the life cycle and the fuel cost throughout the first year of operation. Similarly, the indicator is the rate between the additional investment costs throughout the life cycle and the initial investment [29]:
where the indicator is calculated as:
Meanwhile, the indicator is:
Both of the above equations were simplified by neglecting tax deductibles. The investment cost includes the costs of the equipment considered in the integration scheme plus an additional 33% to account for hydraulic components, control, instrumentation, planning, and installation [30].
Nevertheless, from all the above information, the objective function used in this methodology is the payback time, although other economic functions can be chosen in the optimisation interface [26]:
The economic analysis was conducted using the parameters shown in Table 4.

Table 4.
Main economic parameters.
3.3. Optimisation Method
The optimisation procedure minimizes the payback time function through the economic type 582b, using the TRNOPT software complement [29]. TRNOPT allows for the use of GenOpt to evaluate several simulations in parallel, using the multiple cores of the computer to achieve a faster solution. Furthermore, the variation limits of every parameter can be established, and a particle swarm optimisation algorithm is applied to minimize the result of the specified function.
Three input parameters varied: the solar collection area, the storage tanks’ volume, and the capacity of the heat exchanger. The analysis of different combinations of these three parameters allows for determining the best integration scheme resulting in the minimum payback time, as well as for establishing the number of solar collectors required, the additional components’ capacity, and the investment cost required.
The main limiting parameter in the simulation is the maximum number of solar collectors that can be installed in the available area set by the user, since this considers the space required to avoid shading between the solar collectors and the other components involved in the hydraulic loop. Therefore, the number of solar collectors is determined as the nearest integer resulting from the calculation:
The required volume of the storage tank is directly related to the solar collection area through the specific storage volume, namely, the storage volume used per unit of solar collection area, whose value also depends on the temperature required in the process, the temporal dependence of the load, and the specific application [30]. The heat exchangers’ overall thermal conductance directly relates to the maximum allowed flow rate.
Thus, the design variables involved in the optimisation process were established as continuous or discrete. The continuous variables take any value within a predetermined range. In the simulation, they allow for control of the number of solar collectors, the storage tank volume, and the overall thermal conductance of the heat exchanger. On the other hand, the discrete variables take values of 0 or 1 and interact in the simulation to include or exclude components such as storage tanks or heat exchangers, thus allowing for different solar integration schemes in the optimisation analysis. Table 5 shows all the design variables and their application intervals.

Table 5.
Transient simulation design variables.
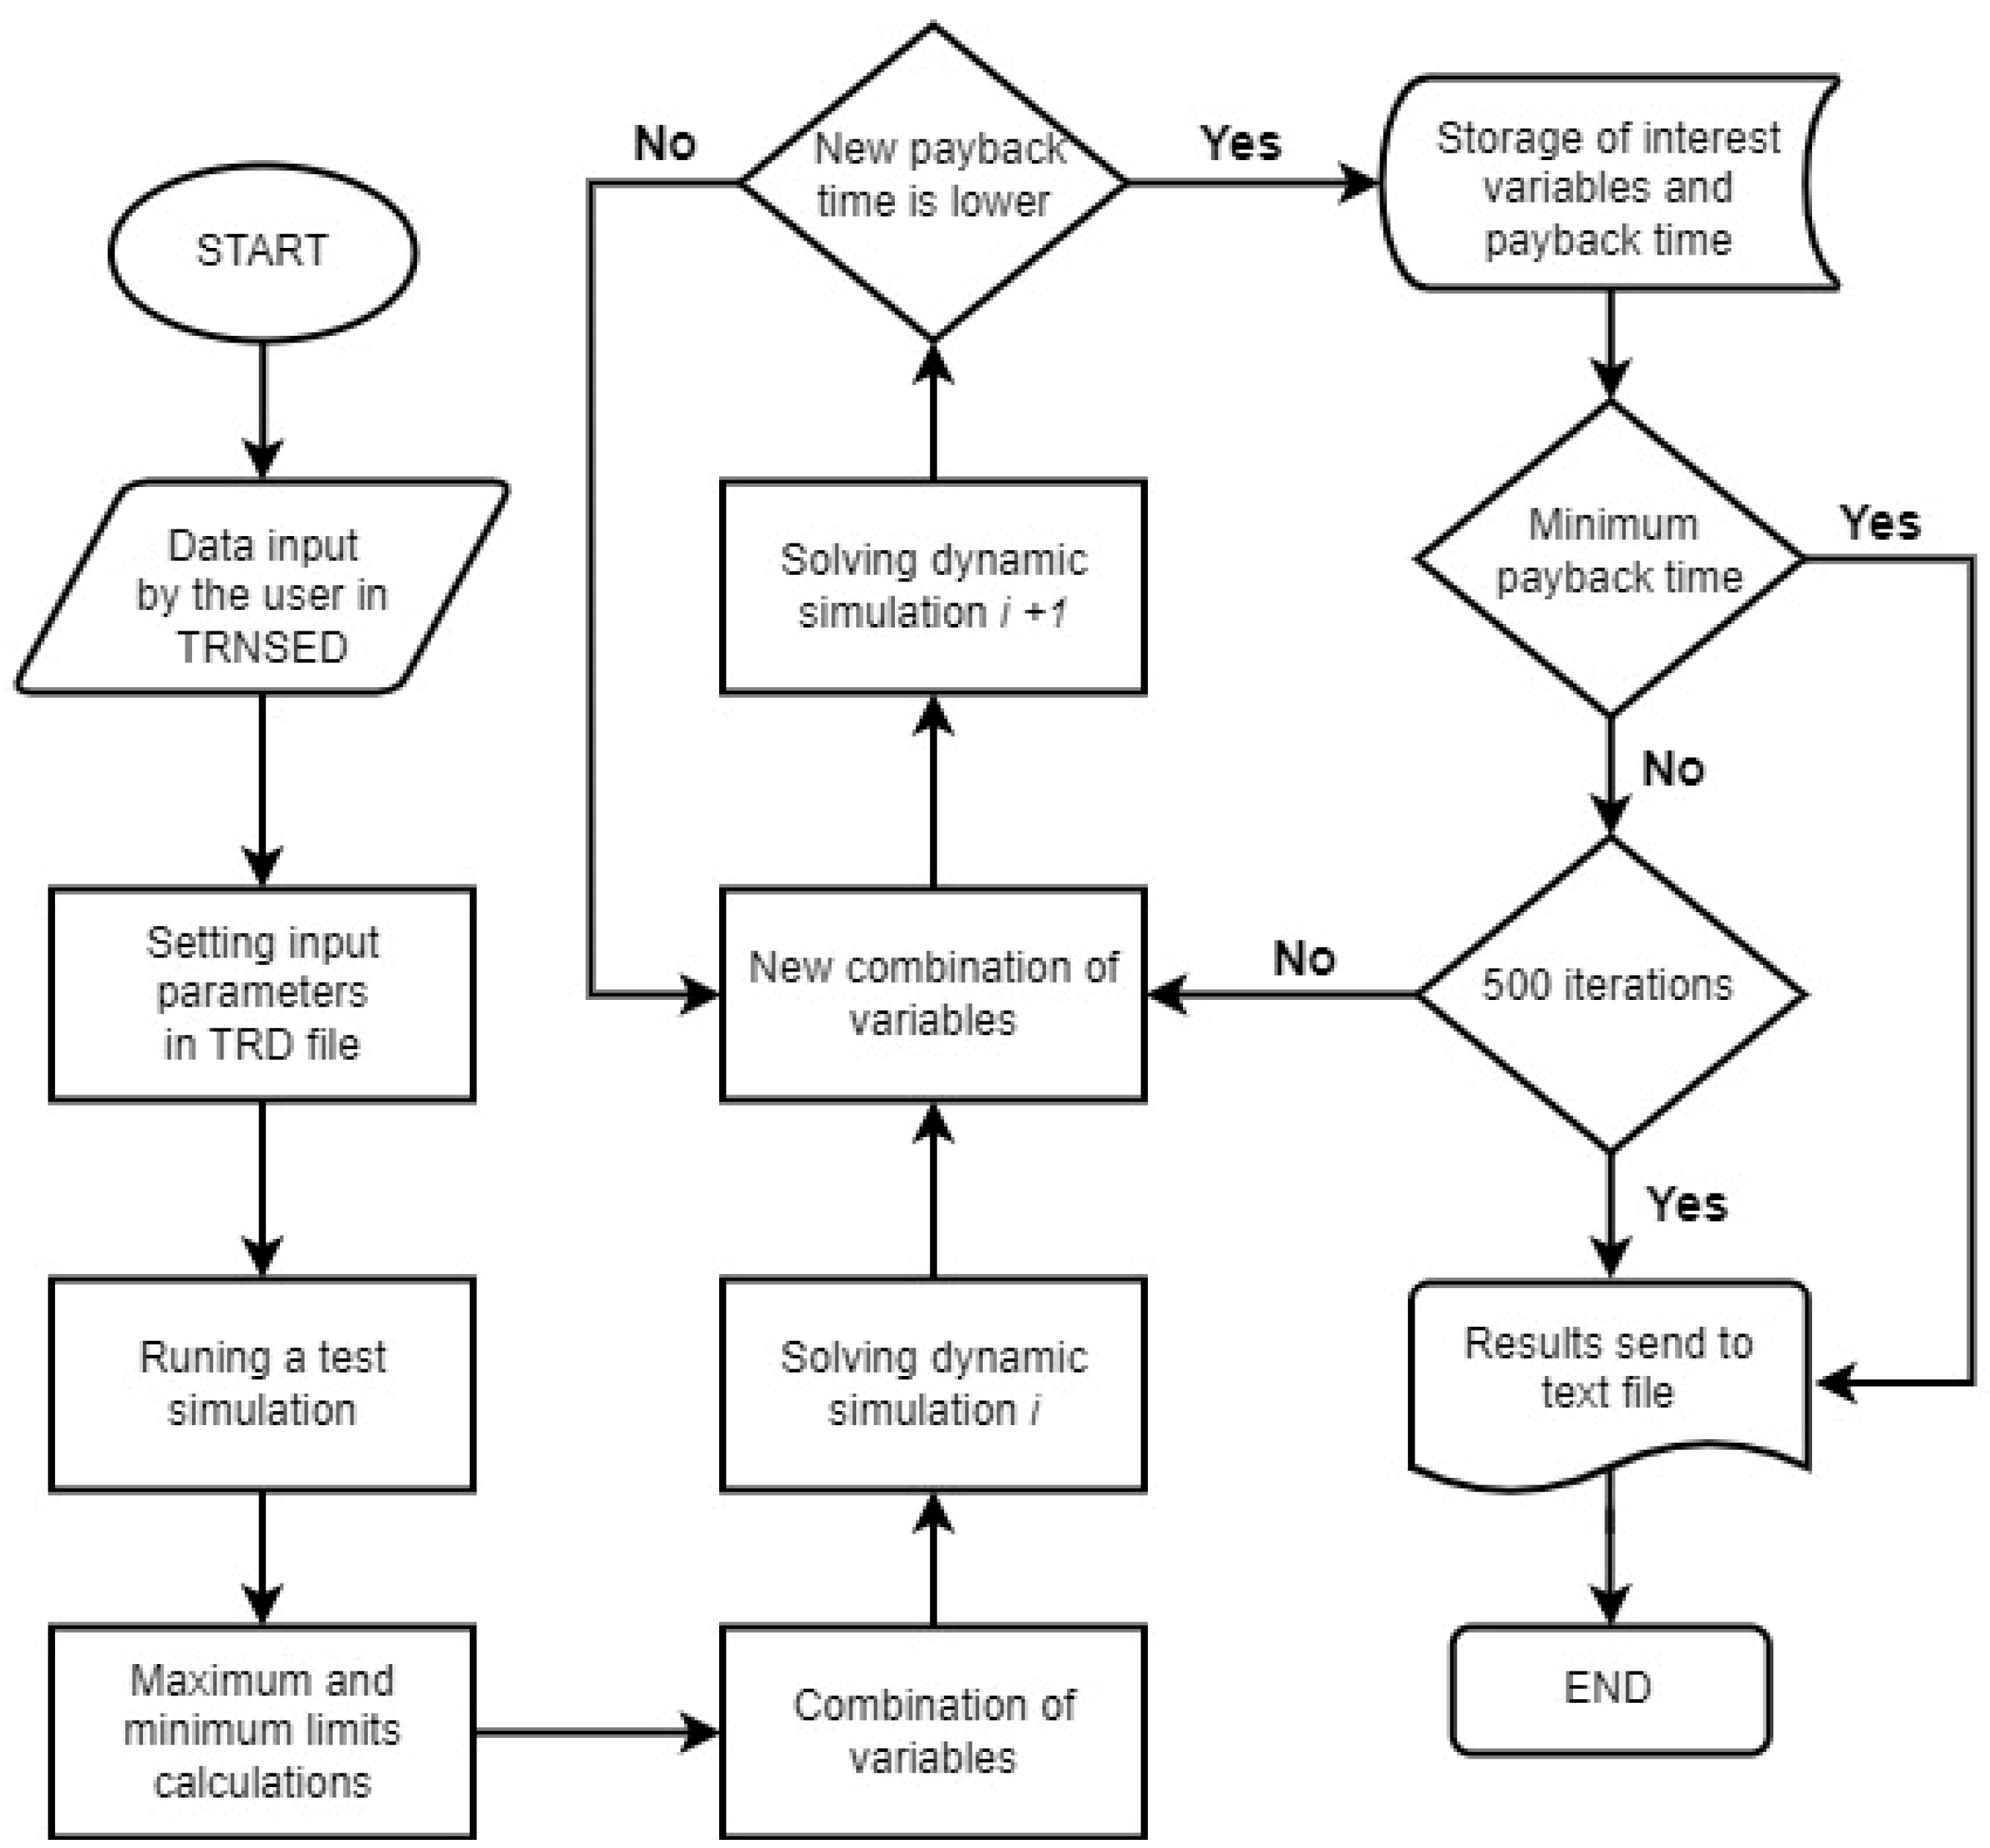
The algorithm generates combinations of the variables of interest, solves the TRNSYS model for each combination, and distributes the results evenly. It then performs a generalised search pattern to determine the combinations of parameters and integration settings that provide the lowest payback time. This cycle is repeated until an optimised value is reached, or a maximum limit of 500 iterations is reached. Thus, the optimisation follows the next sequence (see Figure 2):
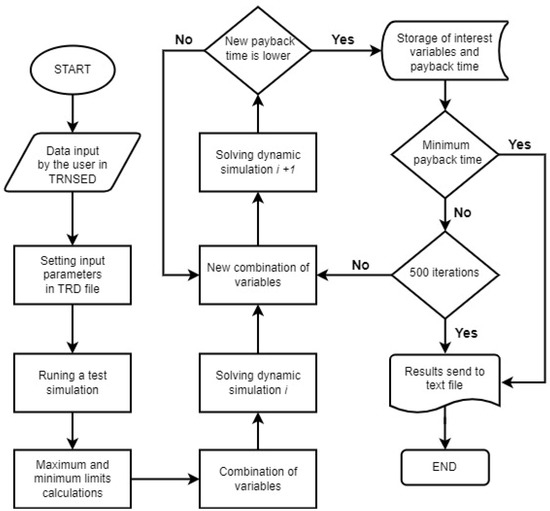
Figure 2.
Algorithm flowchart.
- Data input by the user through the front end;
- Setting all the input parameters into a TRD file;
- Running a test simulation;
- Optimisation process in TRNOPT:
- a.
- Calculating the maximum and minimum limits of total solar collection area, storage tank volume, and heat exchanger’s overall thermal conductance;
- b.
- Generating a viable combination of the variables;
- c.
- Solving the transient simulation on TRNSYS;
- d.
- Generating a new combination of the variables from a particle swarm analysis;
- e.
- Solving the new simulation model in TRNSYS;
- f.
- Determining the lower value resulting from the objective function comparing previous and new combination results;
- g.
- Storing the specific variables of the lowest value resulting from the objective function;
- h.
- Repeating steps b to g until obtaining the minimum payback time or reaching 500 iterations;
- Obtaining a txt data file and extracting the report;
- End of process.
3.4. User Front End
The user front end was developed using the trnsed [31] plugin of TRNSYS. Trnsed allows for defining a front end using a particular programming language to include code in the TRD file previously extracted from the TRNSYS simulation studio. One of the main functions of this code is to call for databases that integrate all the technical and economic information of the solar collectors stored in several DAT files. Further, an additional DAT file contains a catalogue with the TM2 files used to set the weather information for each city. This plugin also provides the possibility to pack the tool without needing a TRNSYS license. Finally, the front end was programmed to set a few values and select others from dropdown menus. Table 6 shows the information requested from the user.

Table 6.
User front-end required information.
All the parameters entered by the user are applied in the TRNSYS simulation model as either inputs or constraints in the component models involved.
4. Case Study
The operation of the tool was verified by contrasting its results with open-access data from a system that operates in Cuernavaca, Morelos, Mexico (18.92° N and 99.23° W) [32]. This system delivers hot water to a mill for the “nixtamalisation” (corn-cooking) process [33]. During nixtamalisation, the corn grains are immersed in an alkaline solution and cooked at 90 °C for up to 45 min. Later, the grains are left to stand in hot water for several hours, then rinsed and ground to obtain the dough used to make “tortillas” and other products related to the basis of Mexican food. This process is generally handmade, so the cooking and resting times in hot water may vary significantly according to the corn grain’s quality and the operator’s experience.
According to [32], the heating system analysed daily delivers hot water between 60 °C and 75 °C throughout the year. The energy requirements of the process are shown in Table 7.

Table 7.
Case study characteristics and requirements [32].
The solar thermal system (installed in 2010) has a direct–continuous scheme, with 12 flat-plate solar collectors, a gross area of 24 m2, and an insulated polyethylene storage tank of 1100 L capacity. This system provides a solar fraction of 60%, with an investment cost of USD 5827 and a payback time of one year, saving 21,466 L/year of fuel [32].
5. Results and Discussion
The case study data were set into the front end of the pre-feasibility assessment tool developed. The available area considered for the solar installation was 50 m2. A solar collector model (certificate number 002/NESO/CP) similar to the one used in the final design of the existing system was selected, with a gross area of 1.8870 m2, a maximum optical efficiency of 0.7270, heat loss coefficient of 5.872 W/m2·K, incidence angle modifier coefficient of 0.2, and a cost per unit of USD 271. In addition, the fuel cost was USD 15/GJ [32], and an operating schedule of 6 h a day, five days per week, was assumed (Monday to Friday from 8 h to 14 h).
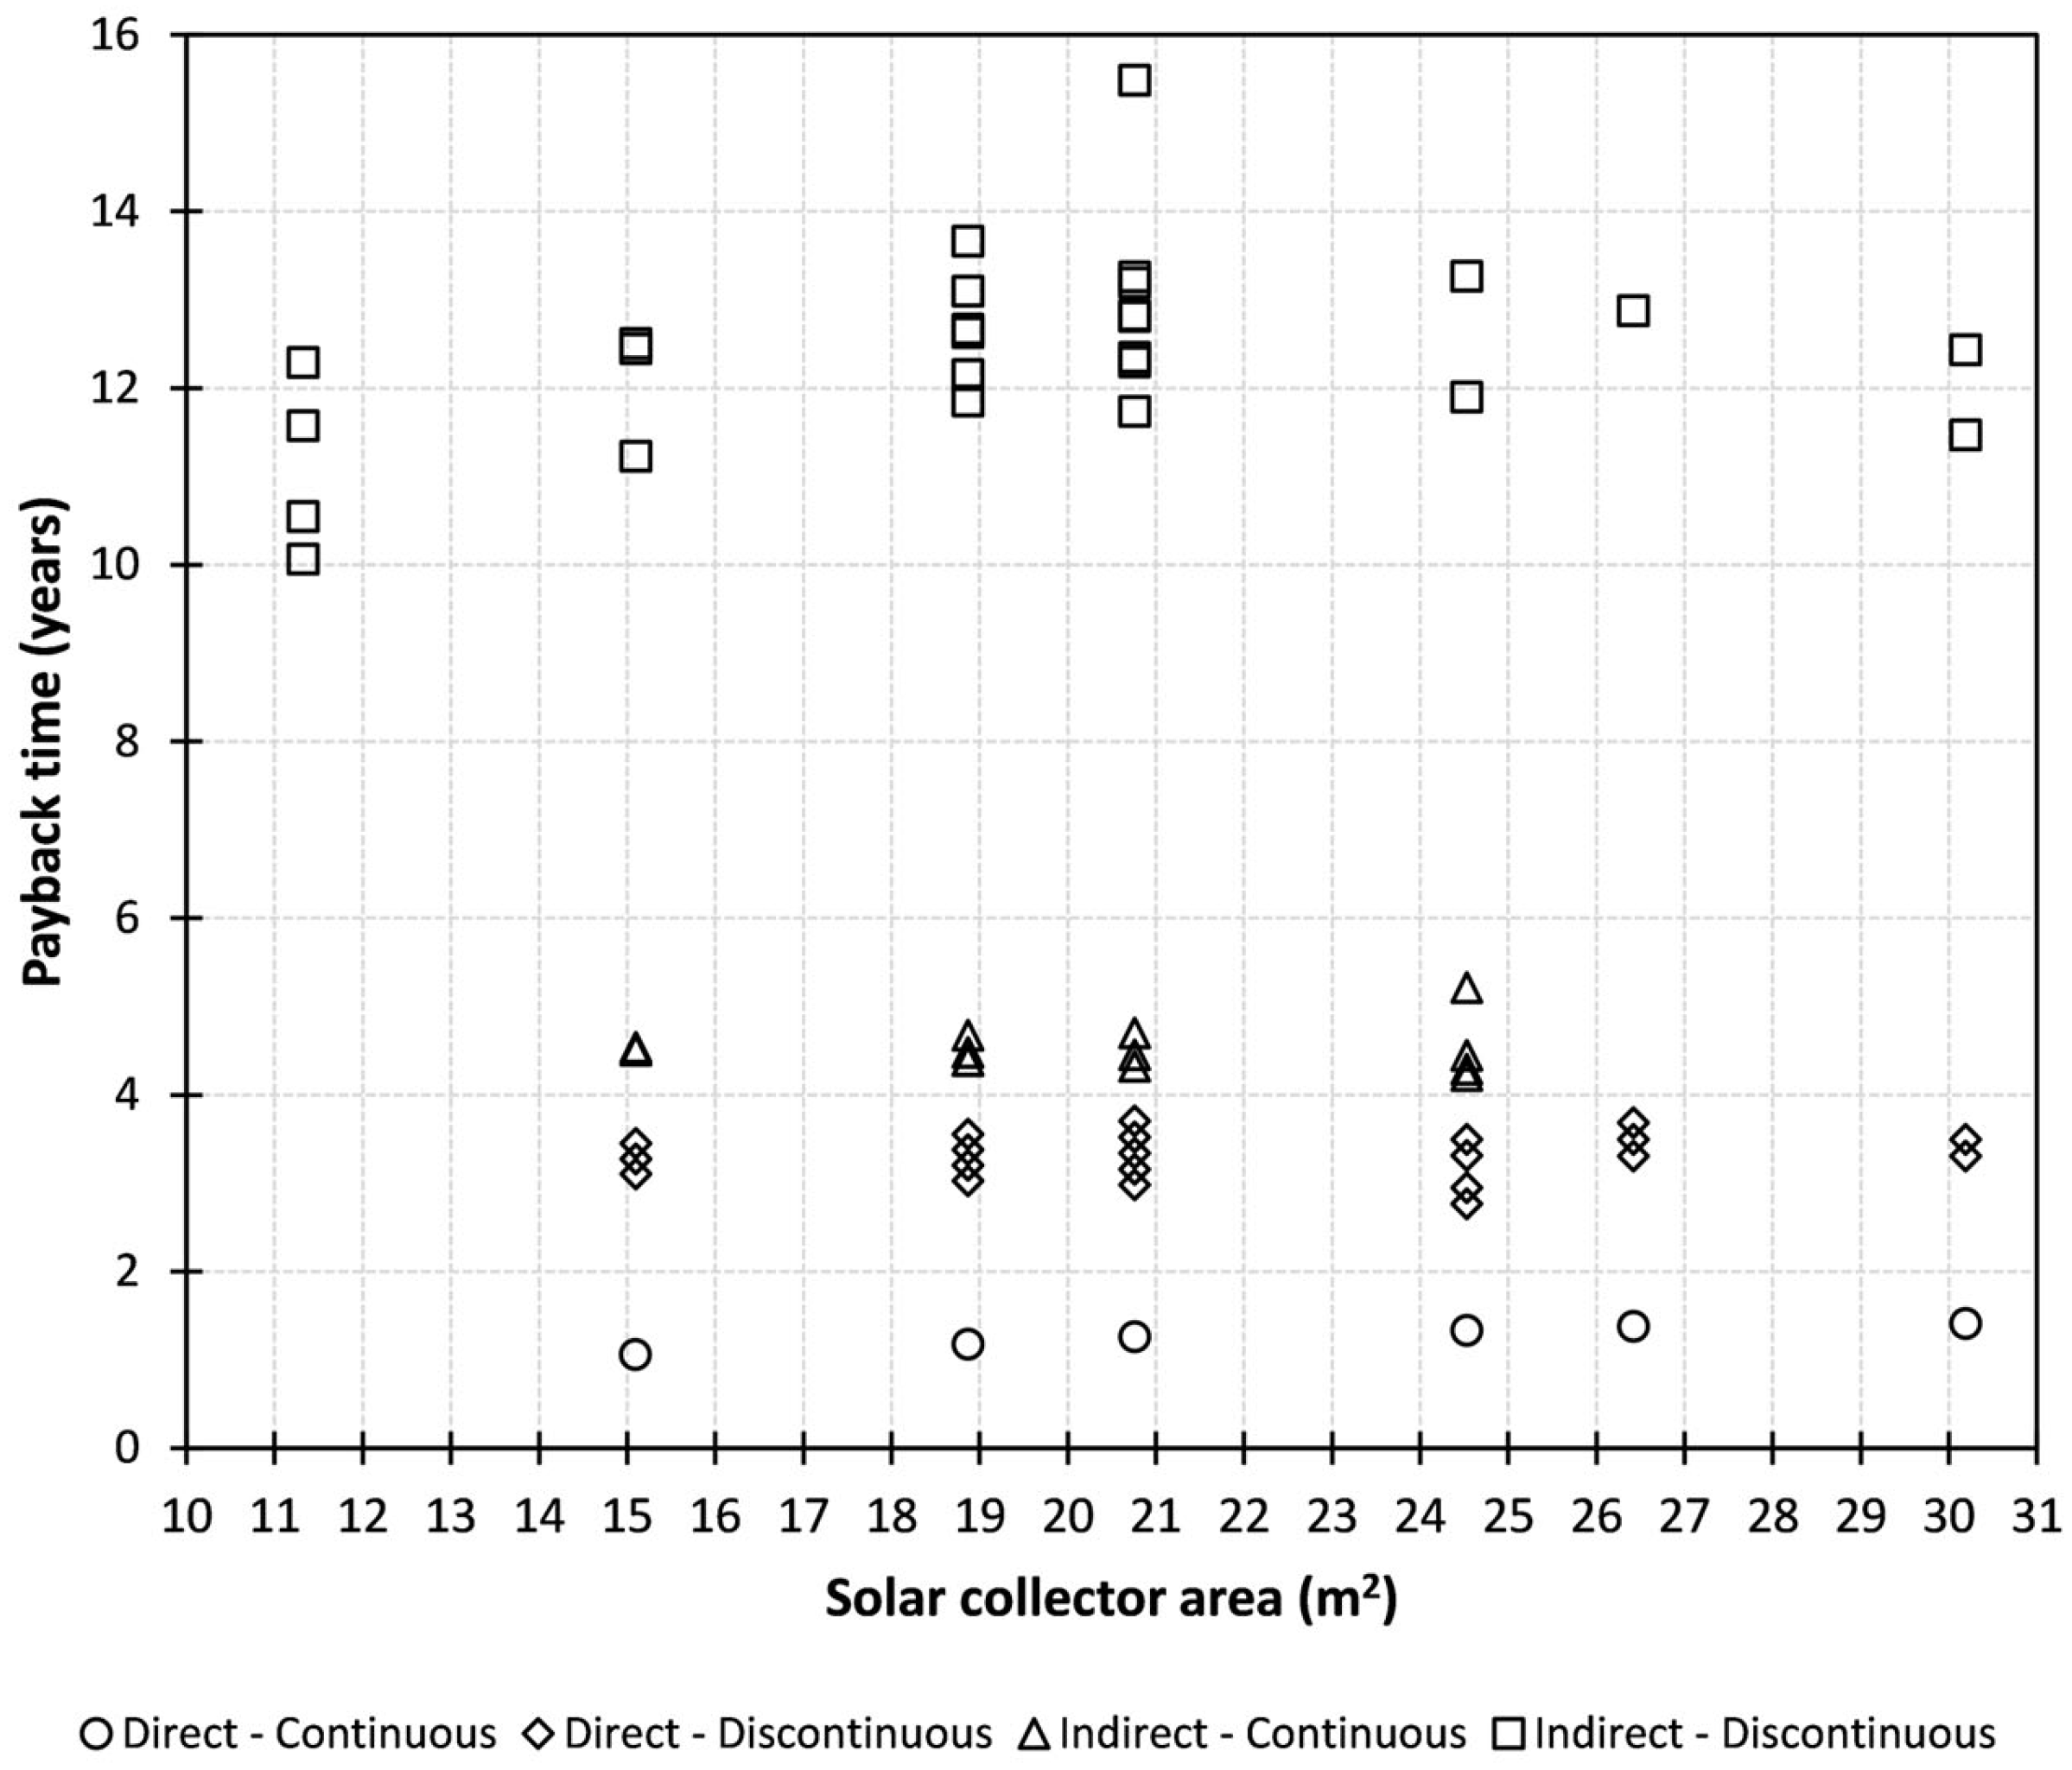
The pre-feasibility assessment tool ran 193 simulations, resulting in 66 combinations of the integration schemes: six direct–continuous, 21 direct–discontinuous, 13 indirect–continuous, and 26 indirect–discontinuous. Figure 3 shows the payback time of the different integration schemes depending on the solar collector area considered.
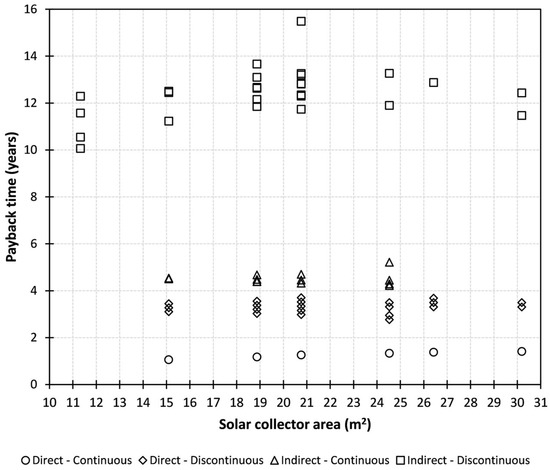
Figure 3.
The payback time of the different integration schemes as a function of the solar collector area.
As shown in Figure 3, the solar collection area required to cover the demand of the case study is between 11.3 m2 and 30.2 m2, corresponding to between 6 and 16 collectors. In addition, all direct integration schemes, continuous and discontinuous, have payback times of less than four years, representing good investment opportunities for the users. Otherwise, the indirect–continuous integration scheme options could be amortised in 4.2 to 5.2 years, whereas, as expected, the indirect–discontinuous schemes were unfeasible for this case study.
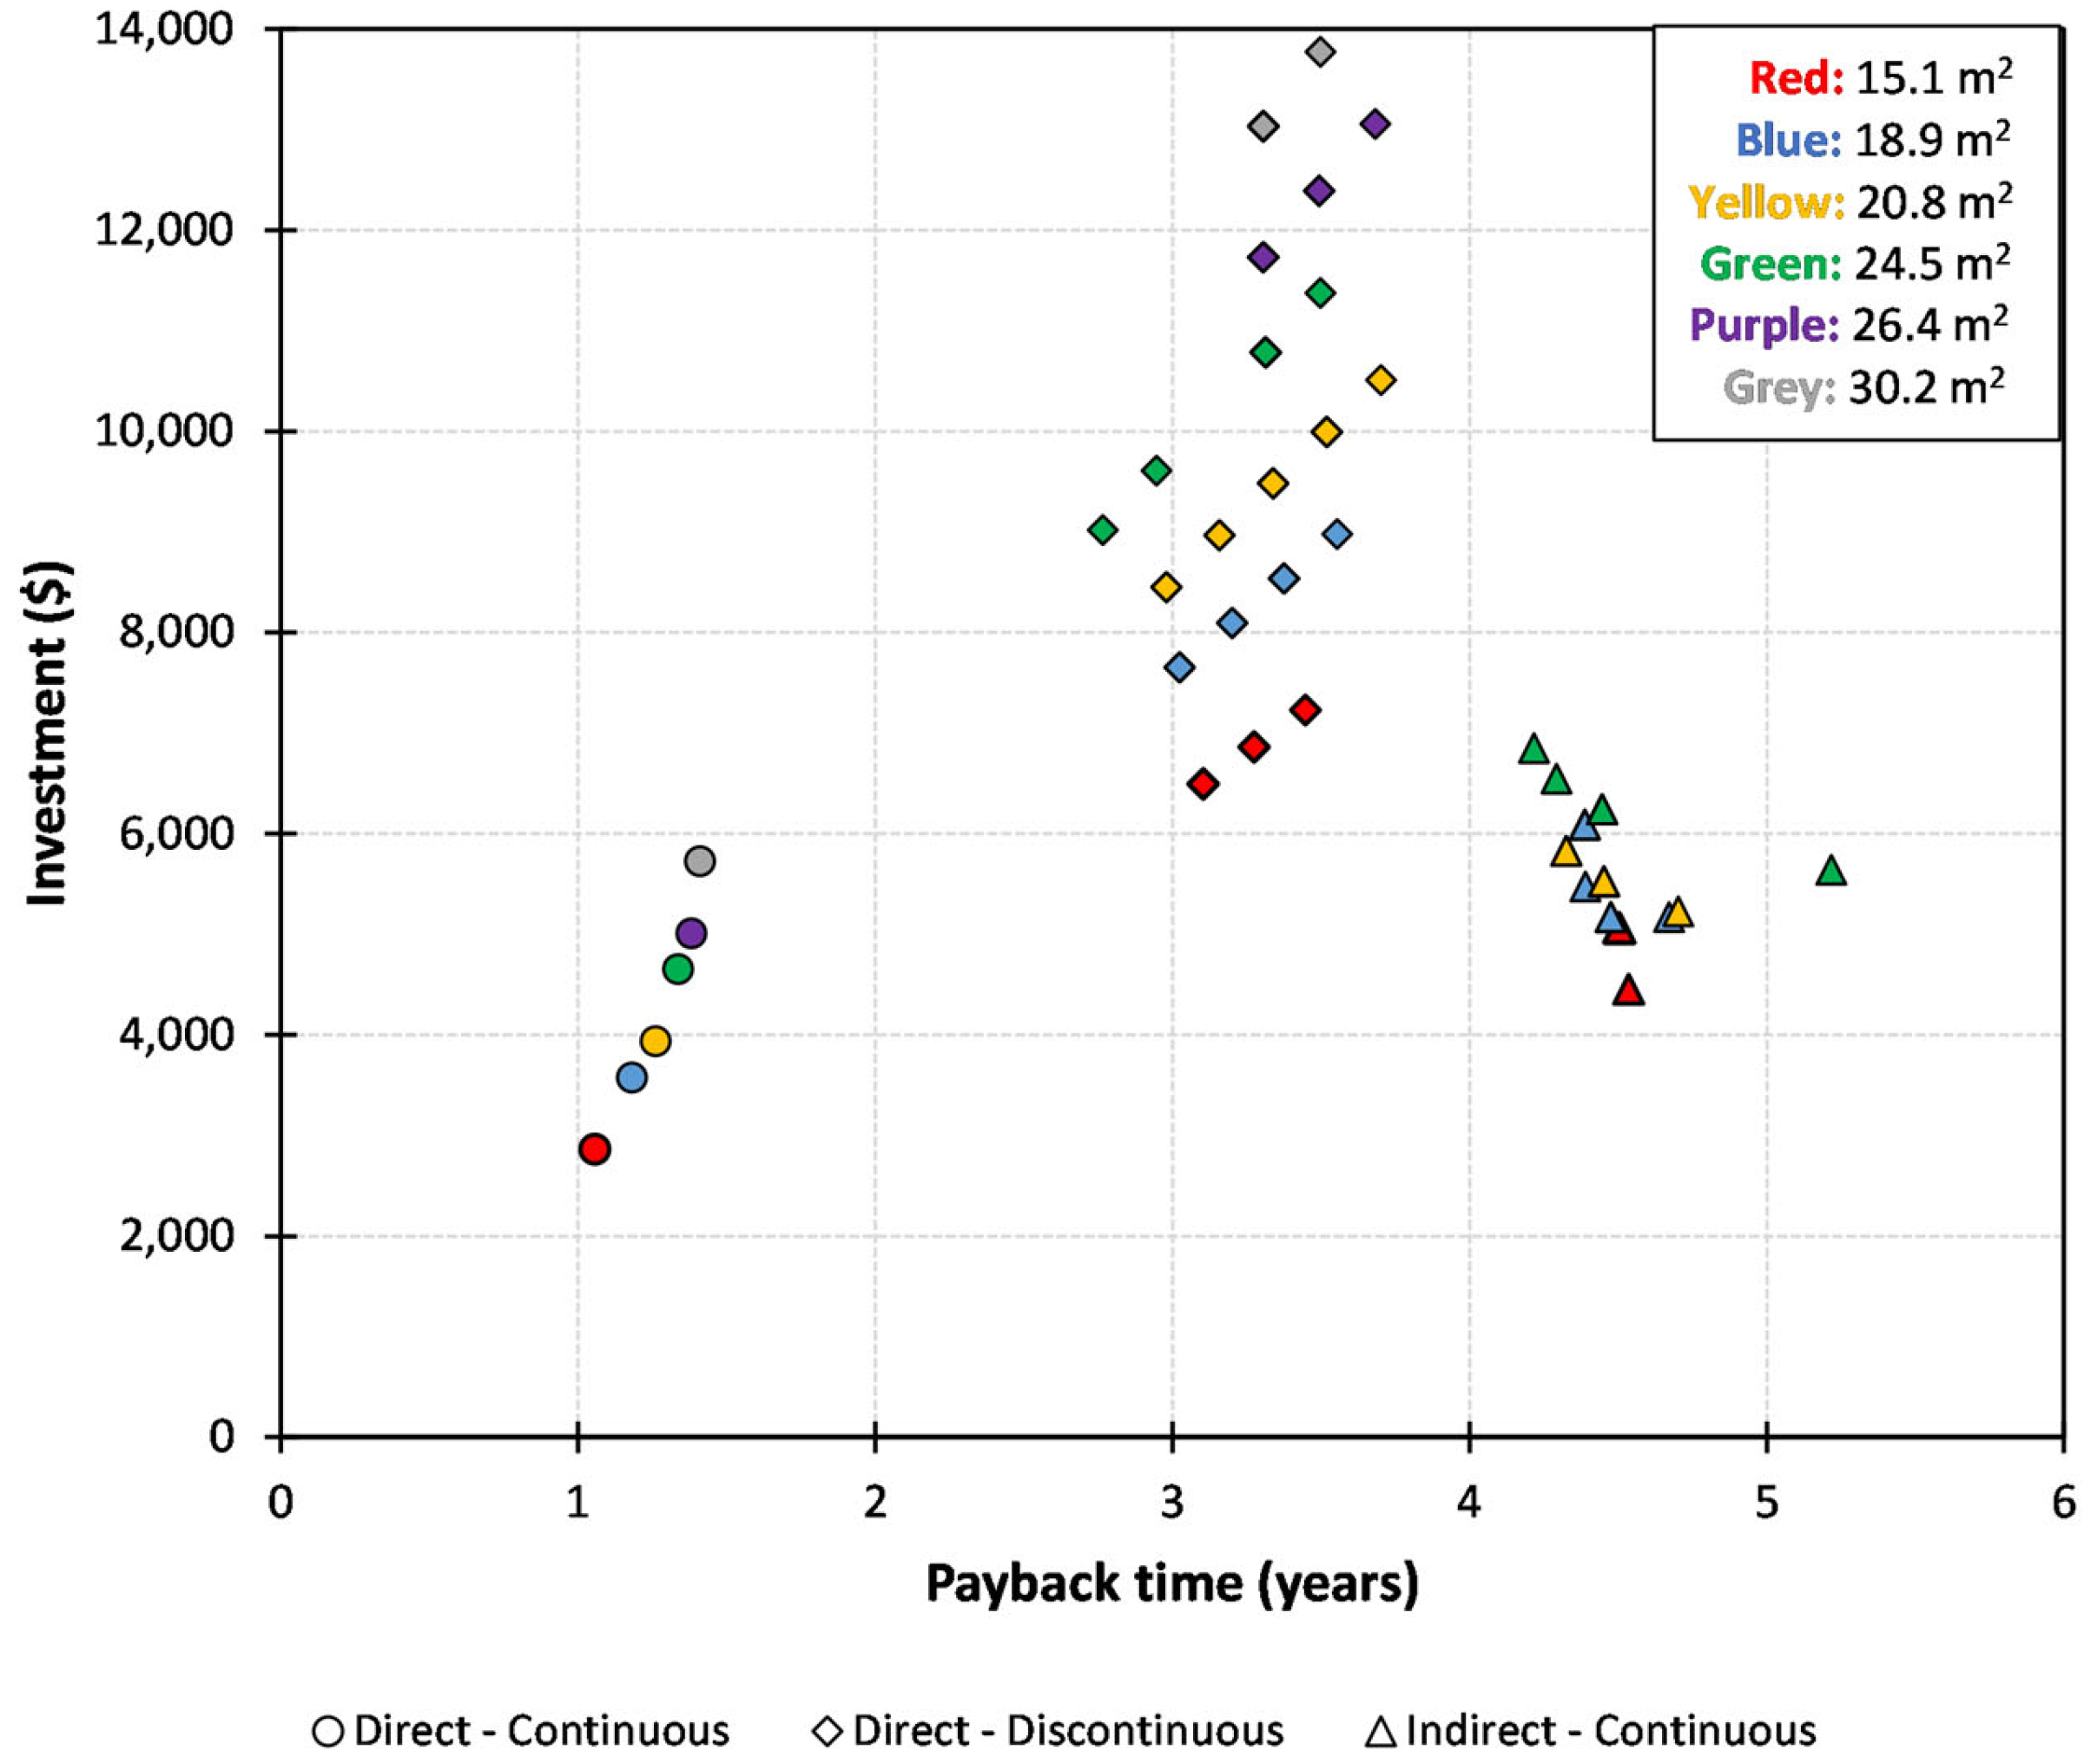
Figure 4 shows the initial investment calculated concerning the payback time and the solar collector area considered for the cases with direct–continuous, direct–discontinuous, and indirect–continuous integration schemes (indirect–discontinuous integration schemes have been discarded considering their large payback time).
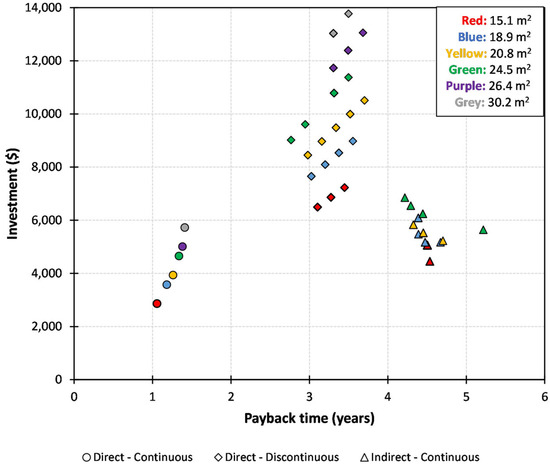
Figure 4.
Relation between the initial investment required and the payback time of three integration schemes, variating the solar collector area.
As shown in Figure 4, both direct integration schemes have attractive payback times but a significant variation in the required investment. The best options from the economic perspective correspond to the direct–continuous integration scheme, since, in addition to payback times between 1.0 and 1.4 years, they require a small investment that fluctuates between USD 2862 and USD 5724.
In general, the variations in the investment are related to the size of the components considered. However, clearly defined areas of the payback time can be identified in Figure 4 for each type of integration. Regarding the influence of the solar collector area, in the direct–discontinuous scheme, it can be seen that, for a constant solar collector area, the relation between investment and payback time is linear with a positive slope, because it depends mainly on the size of the thermal storage tank. On the other hand, in the indirect–continuous scheme, it can be noted that, with the same solar collector area, the relation between the required investment and the payback time is inversely proportional, since having a larger heat exchanger transfers at a higher rate to the load. Therefore, in the analysed case study, selecting this indirect integration scheme would be justified despite the shortest payback time being 4.2 years if, for instance, separating the solar and process water circuits for health safety reasons is required. Unfortunately, this restriction does not exist in Mexico, so this integration scheme should be discarded.
It is worth mentioning that the thermal storage tank is the most expensive component, since it can represent between 37% and 47% of the total investment required in the direct–discontinuous scheme, for which the tank can reach up to USD 6100. In comparison, the indirect–continuous scheme integrates a heat exchanger whose cost represents between 13% and 33% of the total investment.
Table 8 shows the thermal results of the two solar thermal systems with the shortest payback times.

Table 8.
Pre-feasibility results.
As mentioned above, even when the solar fraction is lower than 20%, the most viable option from an economic perspective is a system with a direct–continuous integration scheme, where the solar heat produced is sent instantly to the process. However, this method of solar heat production is recommended when the load’s heat requirements and the availability of solar radiation are simultaneous, and the outlet temperature of the collector array is also lower than that required in the process; therefore, it is only used for preheating.
The second option presented in Table 7 is a system with a direct–discontinuous integration scheme, where a thermal storage device is used as a buffer, even though the outlet temperature of the solar heating system is always lower than that required in the process. In the case study, this would be the most suitable integration scheme, since thermal storage is necessary in cases where the process is discontinuous.
When comparing the results of the direct–discontinuous integration scheme with the data reported from the case study in its promotional file [32], the simulation model matches the required integration scheme, the solar field size, and the volume of the storage tank. However, the initial investment calculated with the pre-feasibility tool is higher by 45%, because the recommended storage tank is made of steel with a porcelain coating (cost of USD 3308) to withstand high temperatures and avoid water contamination due to the degradation of the interior material. On the other hand, the investment is significantly reduced if a polyethylene tank (cost of USD 250), as used in the actual solar installation, is considered. Therefore, the proposed integration scheme’s initial investment differs only by 2.3% from that reported by [32]. In addition, the payback time is reduced to 1.83 years, although this is larger than that reported by [32].
This difference in the payback time may be due to multiple factors. In the simulation, a constant water requirement at 90 °C for six hours was assumed from 8 h to 14 h (for a typical production schedule in corn cooking), implying a relatively low solar fraction of 22.4%. If the requirements or operation schedule were different, a lower payback time and a higher solar fraction would be expected. For example, if the water needed to be kept at 90 °C only during the cooking process (45 min), and the rest of the time, the mixture was left to stand at a lower temperature, or if the actual process had a later starting time, in order to couple the load pattern and the availability of solar radiation, the results would differ.
Otherwise, the results reported by [32] could be influenced by: (1) considering a constant efficiency of the solar collectors to estimate the energy contribution of the solar thermal system (i.e., neglecting the effects of the incidence angle of solar radiation); (2) considering a continuous period over the year that hot water is required, without taking into account the energy wasted on non-working days, or (3) assuming that all the energy produced in the solar field is used in the process.
In cases such as the one under study, where the load is not required continuously throughout the year, an advantage of the pre-feasibility assessment tool developed is that it allows for modelling the load profile required each day through transient simulation, considering the actual intermittent energy requirements. Therefore, a difference in the results obtained with this simulation model regarding what would be calculated with a more simplified sizing model is expected. The differences can occur in size, integration scheme, solar fraction, investment requirement, or payback time.
Therefore, the developed pre-feasibility assessment tool allows users to reliably and quickly model numerous solar integration schemes for each case scenario, considering their specific energy needs and space restrictions. In addition, its availability for non-experienced users can help increase the reliability of solar thermal systems and drive the growth of the industrial application of solar energy.
However, the simulation tool could be strengthened by including more options for integration schemes, locations, components, and new weekly and daily load alternatives, keeping the simplicity of non-experienced users in mind.
6. Conclusions
This research presents a new pre-feasibility assessment tool for industrial or commercial solar thermal systems, combining the complexity of transient simulation with an easy-to-use interface for non-specialised users. The simulation model determines optimised solar integration proposals with a minimum payback time. In addition, the model has a simple front end to obtain valuable and reliable information about the size, cost, and savings of the suggested systems according to their energy needs and space limitations. A lack of these tools makes non-specialised persons more vulnerable to poorly calculated projections commonly offered by vendors. Therefore, the tool can be used by decision makers with an initial interest in exploring the possibilities of installing solar systems in their processes, procuring quick and easy-to-understand economic estimations.
The tool was developed in TRNSYS18 and allowed for the analysis of four solar integration schemes at the supply level (direct–continuous, direct–discontinuous, indirect–continuous, and indirect–discontinuous). The optimisation algorithm was carried out with the TRNOPT complement through particle swarm optimisation. Through the process, variations in the solar field gross area, storage tanks’ volume, and the heat exchanger conductance allow for an analysis of up to 500 possible combinations.
The calculation is restricted to solar applications using liquid working fluids and provides five options for operation schedules, from 6 to 24 continuous hours and 3, 5, or 7 weekly operation days. Furthermore, the available equipment database includes options commercialised in Mexico, which can be applied to 18 main cities. Nevertheless, it is possible to incorporate any typical meteorological year and expand the technical information and components’ costs.
The tool was verified with the reported data from the promotional brochure of an existing facility in Mexico. The system has a direct–discontinuous integration scheme, a solar collection area of 24 m2, and a 1.1 m3 storage tank to cover a 960 GJ/year load. The developed pre-feasibility simulation tool results showed 66 possible combinations of the four integration schemes. A direct–continuous and a direct–discontinuous integration were recommended, with 1.06 and 2.76 years of payback time, respectively. The second proposed integration scheme requires a 24.5 m2 solar collection area and a 1.2 m3 storage tank, similar to the existing facility.
Based on the results of the case study analysed, for the indirect–continuous integration scheme, an inversely proportional trend was determined between the payback time and the initial investment, considering a constant solar collection area. This behaviour is because a smaller heat exchanger overall thermal conductance implies a more economical exchanger. However, its heat transfer capacity limits the energy that can be effectively transferred to the process, so the payback time is short.
It is recommended that further analysis be conducted to validate this tool using experimental data collected from an existing facility. However, this information is difficult to find.
It is envisioned that the developed tool would be a valuable public and free instrument, so industrial users and developers could explore the economic feasibility of solar heat applications in their production processes by obtaining realistic and reliable simulation results. However, this tool is not to be considered a precision simulation tool nor a formal sizing tool due to the great amount of technical and economic assumptions needed to simplify the information requested from the final user. On the other hand, it should be used as a preliminary economic forecast, obtained quickly and easily with basic information, to determine the possibility of implementing solar heat. Therefore, it gives only some possible solar installation schemes that are viable for the analysed cases. If formal dimensioning and design are required, it is necessary to follow additional steps that require certain expertise and specialised software. These steps include performing an energy audit of the process, applying energy-saving measures or heat recovery to reduce consumption, determining the most feasible solar integration point, and carrying out a detailed sizing of the required solar heating system, which is possible thanks to the proper use of transient simulation.
The current design structure of the tool in TRNSYS allows it to expand to be capable of analysing new integration schemes, to include additional equipment, and even optimising using new technical, economic, or environmental objectives. In addition, it could also be easily adapted for other countries considering their climatic, technical, and economic conditions.
This tool can contribute to the development of the Mexican solar thermal market by providing the end user with greater flexibility in the design parameters available compared to the existing tools in Mexico. In general, existing tools have restrictions, such as few or no options for daily operating hours and seasonal operating periods, operating temperatures, a fixed solar fraction, and steady-state calculation, among others.
Author Contributions
Conceptualisation, M.N.-T.; Data curation, N.O.-A.; Formal analysis, N.O.-A.; Investigation, M.N.-T. and F.Á.-C.; Methodology, M.N.-T. and F.Á.-C.; Project administration, M.N.-T. and N.O.-A.; Resources, M.N.-T.; Software, F.Á.-C.; Supervision, N.O.-A.; Validation, F.Á.-C.; Visualisation, N.O.-A.; Writing—original draft, M.N.-T., N.A.R.-M. and N.O.-A.; Writing—review and editing, M.N.-T., N.A.R.-M., C.K.R.-P., I.R.M.-D. and N.O.-A. All authors have read and agreed to the published version of the manuscript.
Funding
This research received no external funding.
Data Availability Statement
The data presented in this study are available on request from the corresponding author.
Acknowledgments
The authors thank CONACYT for financial support through scholarship 731482. In addition, the authors appreciate the help of the engineer Karen Edith Palacio Velasco in collecting the technical and economic information of the included components in the database applied in this work.
Conflicts of Interest
The authors declare no conflict of interest.
Nomenclature
| Heat loss coefficient (W/m2·K) | |
| Temperature dependence of the heat loss coefficient (W/m2·K2) | |
| Gross collector area (m2) | |
| Total solar collection area (m2) | |
| Solar facility available area (m2) | |
| Incidence angle modifier first-order coefficient (dimensionless) | |
| Incidence angle modifier second-order coefficient (dimensionless) | |
| Solar collector cost (USD) | |
| Initial investment (USD) | |
| Annual cost delivered from fuel (USD/year) | |
| Heat exchanger cost (USD) | |
| Storage tank cost (USD) | |
| Ratio of down payment to initial investment (dimensionless) | |
| Total direct normal irradiation over a year (kWh/m2) | |
| Fuel inflation rate (dimensionless) | |
| Irradiance on a tilted plane (W/m2) | |
| Total global horizontal irradiation over a year (kWh/m2) | |
| Heat exchanger (dimensionless) | |
| Discount rate (dimensionless) | |
| Installation cost fraction (dimensionless) | |
| General inflation rate (dimensionless) | |
| Incidence angle modifier (dimensionless) | |
| Life-cycle cost (USD) | |
| Life-cycle savings (USD) | |
| Annual mortgage interest rate (dimensionless) | |
| Test mass flow rate (kg/s·m2) | |
| Ratio of first-year miscellaneous cost to initial investment (dimensionless) | |
| Period of economic analysis (years) | |
| Term of loan (years) | |
| Payback time (years) | |
| Number of solar collectors (dimensionless) | |
| Property tax rate (dimensionless) | |
| Ratio of life-cycle fuel savings for the first-year fuel energy cost (dimensionless) | |
| Ratio of owning cost to initial investment (dimensionless) | |
| Present worth factor (dimensionless) | |
| Ratio of rebate or refund offered on the purchase of the equipment to initial investment (dimensionless) | |
| Ratio of resale value at the end of the period of analysis to initial investment (dimensionless) | |
| Storage tank (dimensionless) | |
| Effective income tax rate (dimensionless) | |
| Temperature (°C) | |
| Storage tank volume (m3) | |
| Heat exchanger overall thermal conductance (W/K) | |
| Instantaneous thermal efficiency (dimensionless) | |
| Peak collector efficiency (dimensionless) | |
| Angle between surface normal and incident radiation (°) | |
| Subscripts | |
| a | Ambient |
| C | Conventional |
| i | Inlet |
| L | Longitudinal |
| o | Outlet |
| S | Solar |
| T | Transverse |
Appendix A

Table A1.
Transverse and longitudinal incidence angle modifiers.
Table A1.
Transverse and longitudinal incidence angle modifiers.
| Certification 10001909 1 | Certification 011-7S524R 2 | PTC Not Certified 3 | ||||
|---|---|---|---|---|---|---|
| Incidence Angle (°) | ||||||
| 10 | 1.02 | 1.00 | 1.00 | 1.00 | 1.00 | 0.873 |
| 20 | 1.07 | 0.99 | 1.04 | 1.00 | 1.02 | 0.778 |
| 30 | 1.17 | 0.97 | 1.13 | 0.99 | 1.08 | 0.523 |
| 40 | 1.30 | 0.95 | 1.27 | 0.98 | 1.17 | 0.465 |
| 50 | 1.43 | 0.91 | 1.42 | 0.95 | 1.33 | 0.150 |
| 60 | 1.43 | 0.83 | 1.44 | 0.88 | - | - |
| 70 | - | 0.68 | 1.20 | 0.74 | - | - |
| 80 | - | - | 0.66 | 0.49 | - | - |
| 90 | - | - | 0.00 | 0.00 | - | - |
1. Evaluated by the Solar Rating and Certification Corporation in accordance with the SRCC OG-100 Certification Program. 2 Evaluated by the TÜV Rheinland Energy GmbH in accordance with the Solar Keymark Certification Program. 3 Evaluated by the Centro de Investigación en Materiales Avanzados in accordance with ISO 9806.
References
- International Renewable Energy Agency (IRENA). Renewable Energy Capacity Highlights. Available online: https://www.irena.org/publications/2021/March/Renewable-Capacity-Statistics-2021 (accessed on 3 March 2023).
- Weiss, W.; Spörk-Dür, M. Solar Heat Worldwide: Global Market Development and Trends in 2020, Detailed Market Figures 2019. Available online: https://www.iea-shc.org/Data/Sites/1/publications/Solar-Heat-Worldwide-2021.pdf (accessed on 3 March 2023).
- Farjana, S.H.; Huda, N.; Mahmud, M.A.P.; Saidur, R. Solar Process Heat in Industrial Systems—A Global Review. Renew. Sustain. Energy Rev. 2018, 82, 2270–2286. [Google Scholar] [CrossRef]
- AEE INTEC. Solar Thermal Plants Database. Available online: http://ship-plants.info/solar-thermal-plants (accessed on 21 February 2023).
- International Renewable Energy Agency (IRENA). Renewable Energy Options for the Industry Sector: Global and Regional Potential Unit 2030. Available online: https://www.irena.org/-/media/Files/IRENA/Agency/Publication/2014/Aug/IRENA_RE_Potential_for_Industry_BP_2015.pdf (accessed on 3 March 2023).
- Bellevrat, E.; West, K. Clean and Efficient Heat for Industry. Available online: https://www.iea.org/commentaries/clean-and-efficient-heat-for-industry (accessed on 3 March 2023).
- International Energy Agency (IEA). Renewables 2021. Analysis and Forecast to 2026. Available online: https://iea.blob.core.windows.net/assets/5ae32253-7409-4f9a-a91d-1493ffb9777a/Renewables2021-Analysisandforecastto2026.pdf (accessed on 3 March 2023).
- Kumar, L.; Ahmed, J.; El Haj Assad, M.; Hasanuzzaman, M. Prospects and Challenges of Solar Thermal for Process Heating: A Comprehensive Review. Energies 2022, 15, 8501. [Google Scholar] [CrossRef]
- Hassine, I.B.; Helmke, A.; Heß, S.; Krummenacher, P.; Bettina, M.; Schmitt, B.; Schnitzer, H. Integration Guidelines. Deliverable B2. Available online: https://task49.iea-shc.org/Data/Sites/1/publications/150218_IEATask49_D_B2_Integration_Guideline-final1.pdf (accessed on 3 March 2023).
- Karki, S.; Haapala, K.R.; Fronk, B.M. Technical and Economic Feasibility of Solar Flat-Plate Collector Thermal Energy Systems for Small and Medium Manufacturers. Appl. Energy 2019, 254, 113649. [Google Scholar] [CrossRef]
- Eddouibi, J.; Abderafi, S.; Vaudreuil, S.; Bounahmidi, T. Dynamic Simulation of Solar-Powered ORC Using Open-Source Tools: A Case Study Combining SAM and Coolprop via Python. Energy 2022, 239, 121935. [Google Scholar] [CrossRef]
- Del Mar Casanovas-Rubio, M.; Armengou, J. Decision-Making Tool for the Optimal Selection of a Domestic Water-Heating System Considering Economic, Environmental and Social Criteria: Application to Barcelona (Spain). Renew. Sustain. Energy Rev. 2018, 91, 741–753. [Google Scholar] [CrossRef]
- Ktistis, P.; Agathokleous, R.A.; Kalogirou, S.A. A Design Tool for a Parabolic Trough Collector System for Industrial Process Heat Based on Dynamic Simulation. Renew. Energy 2022, 183, 502–514. [Google Scholar] [CrossRef]
- Biencinto, M.; González, L.; Valenzuela, L. A Quasi-Dynamic Simulation Model for Direct Steam Generation in Parabolic Troughs Using TRNSYS. Appl. Energy 2016, 161, 133–142. [Google Scholar] [CrossRef]
- Platzer, W. Overview and Description of Simulation Tools for Solar Industrial Process Heat Systems. Deliverable C2. Available online: http://task49.iea-shc.org/data/sites/1/publications/IEA_Task49_Deliverable_C2_OverviewSimulationTools-final-160525.pdf (accessed on 3 March 2023).
- Frasquet, M. SHIPcal: Solar Heat for Industrial Processes Online Calculator. Energy Procedia 2016, 91, 611–619. [Google Scholar] [CrossRef]
- German Solar Association Solar Payback Online Calculator. Available online: https://www.solar-payback.com/calculator/?lang=es (accessed on 21 February 2023).
- Fraunhofer ISE; RENAC. SHIP Feasibility Calculator. Available online: https://energypedia.info/wiki/File:20190301_SHIP_Feasibility_Calculator.xlsx (accessed on 21 February 2023).
- Garcia-Valladares, O. Software Para El Cálculo Técnico-Económico de Sistemas Solares a Convección Forzada Con Base En Las Curvas de Eficiencia Del Captador y El Método F-Chart. Available online: http://www.fordecyt.ier.unam.mx/html/software_calculadora_comercial_industrial_5.html (accessed on 21 February 2023).
- Solar Rating and Certification Corporation. Rating Summary Page. Available online: https://secure.solar-rating.org/Certification/Ratings/RatingsSummaryPage.aspx?type=1 (accessed on 20 February 2022).
- Solar Heat Europe ESTIF Database. Available online: https://solarkeymark.eu/database/ (accessed on 20 February 2023).
- Sociedad Mexicana de Normalización y Certificación S.C. (NORMEX) Normas Mexicanas de Energía Solar. Available online: https://normex.com.mx/normas-mexicanas-de-energia-solar/ (accessed on 19 February 2022).
- Kalogirou, S.A. Solar Energy Engineering: Processes and Systems, 2nd ed.; Academic Press: Cambridge, MA, USA, 2014. [Google Scholar]
- University of Wisconsin. System TRANSYS 18. A Transient Systems Simulation Program, version 18; University of Wisconsin: Madison, WI, USA, 2017. [Google Scholar]
- Lawrence Berkeley National Laboratory GenOpt Generic Optimization Program. Available online: https://simulationresearch.lbl.gov/GO/ (accessed on 20 April 2023).
- TRNSYS TESS Libraries. Available online: http://www.trnsys.com/tess-libraries/ (accessed on 23 February 2023).
- Reindl, D.T.; Beckman, W.A.; Duffie, J.A. Diffuse Fraction Correlations. Sol. Energy 1990, 45, 1–7. [Google Scholar] [CrossRef]
- Meteotest AG Meteonorm, version 8.1.4; Meteotest AG: Bern, Switzerland, 2020.
- Thermal Energy Systems Specialists (TESS). Utility Library Mathematical Reference; TESSLibs 17: Milwaukee, WI, USA, 2012; Volume 12, p. 51. [Google Scholar]
- VDI 3988:2020-04; Solarthermische Prozesswärme (Solar Thermal Process Heat). Verein Deutscher Ingenieure e.V. (VDI)-Gesellschaft Energie und Umwelt (GEU): Düsseldorf, Germany, 2020.
- TRNSYS. TRNSYS Features: Suite of Tools. Available online: http://www.trnsys.com/features/suite-of-tools.php.html (accessed on 23 February 2023).
- Procobre Centro Mexicano de promoción del Cobre, A.C. Casos de Éxito En La Agroindustria El Uso Del Cobre En Los Sistemas Solares de Calentamiento de Agua: Molinos de Nixtamal. Available online: https://www.conuee.gob.mx/transparencia/boletines/CSA/casosdeexito/nixtamal.pdf (accessed on 3 March 2023).
- Guzmán-de-Peña, D.; Trudel, L.; Wogan, G.N. Corn “Nixtamalización” and the Fate of Radiolabelled Aflatoxin B1 in the Tortilla Making Process. Bull. Environ. Contam. Toxicol. 1995, 55, 858–864. [Google Scholar] [CrossRef] [PubMed]
- Bank of Mexico (BANXICO). Serie Histórica Diaria Del Tipo de Cambio Peso-Dólar. Available online: https://www.banxico.org.mx/SieInternet/consultarDirectorioInternetAction.do?sector=6&accion=consultarCuadro&idCuadro=CF373&locale=es (accessed on 21 February 2023).
Disclaimer/Publisher’s Note: The statements, opinions and data contained in all publications are solely those of the individual author(s) and contributor(s) and not of MDPI and/or the editor(s). MDPI and/or the editor(s) disclaim responsibility for any injury to people or property resulting from any ideas, methods, instructions or products referred to in the content. |
© 2023 by the authors. Licensee MDPI, Basel, Switzerland. This article is an open access article distributed under the terms and conditions of the Creative Commons Attribution (CC BY) license (https://creativecommons.org/licenses/by/4.0/).

