Article

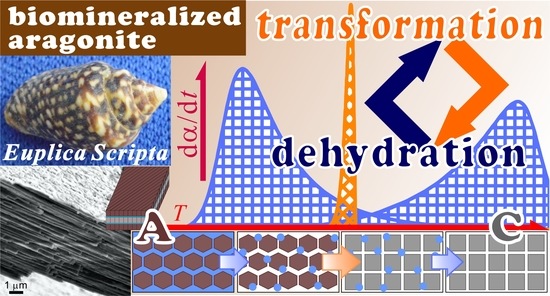
Interplay between Thermally Induced Aragonite–Calcite Transformation and Multistep Dehydration in a Seawater Spiral Shell (Euplica scripta)

Department of Science Education, Division of Educational Sciences, Graduate School of Humanities and Social Sciences, Hiroshima University, 1-1-1 Kagamiyama, Higashi-Hiroshima 739-8524, Japan
*
Author to whom correspondence should be addressed.
Processes 2023, 11(6), 1650; https://doi.org/10.3390/pr11061650
Submission received: 28 March 2023 / Revised: 21 May 2023 / Accepted: 24 May 2023 / Published: 29 May 2023
(This article belongs to the Section Chemical Processes and Systems)

Abstract

:
While heating a seawater spiral shell (Euplica scripta), thermally induced aragonite–calcite (A–C) transformation occurred within the temperature region of multistep thermal dehydration. Here, the kinetic interplay between the A–C transformation and thermal dehydration was studied as a possible cause of the reduction in the A–C transformation temperatures. The kinetics of the A–C transformation was systematically investigated under isothermal conditions by powder X-ray diffractometry and under linear nonisothermal conditions by Fourier transform infrared spectroscopy. The thermal dehydration was characterized as a partially overlapping, three-step process by thermogravimetry–differential thermal analysis coupled with mass spectroscopy for the evolved gases. The A–C transformation occurred in the temperature range of the final part of the second dehydration step and the initial part of the third dehydration step. The kinetics of A–C transformation and thermal dehydration were characterized by contracting geometry-type models, in which the respective transformations were regulated by a constant linear advancement rate and diffusional removal of water vapor, respectively. Based on the kinetic results, the mutual interaction of those thermally induced processes is discussed as a possible cause of the reduction in the A–C transformation temperature.

Graphical Abstract

1. Introduction

Aragonite is one of the most typical phases observed for biomineralized CaCO3 [1]. After heating, aragonite transforms into calcite prior to the thermal decomposition of CaCO3 [2,3,4,5,6,7,8]. In crystallographic terms, the aragonite–calcite (A–C) transformation has been explained by a reorientation of the CO3 group, accompanied by a variation in the distribution of the Ca atom from approximately hexagonal to cubic, close packings [9,10]. In addition, a detectable increase in the unit-cell volume has been observed during heating of aragonite samples [10,11,12,13]. Notably, in biomineralized aragonite, the thermally induced A–C transformation occurs in a lower temperature range, compared with mineral aragonite [5,13,14]. A large deformation of the crystal lattice during A–C transformation has been observed in biomineralized aragonite [15,16,17], in which water vapor is released during A–C transformation [2,3,4,5,6,7,8]. Therefore, the mechanistic and kinetic relationships between thermally induced A–C transformation and dehydration can provide further insight into the thermally induced A–C transformation in biomineralized aragonite to elucidate the reduction in the A–C transformation temperature.
During laboratory synthesis of aragonite using a hydrothermal urea decomposition method, needle-like crystals formed a columnar crystal with a lamellar structure [8]. After heating the columnar aragonite crystals, splitting of the lamellar structure to form a cauliflower-like construction occurred during the A–C transformation. Simultaneously, water vapor was released during the morphological change. Thus, during aragonite construction, water molecules are expected to be trapped in the lamellar structure. A higher order of lamella structures forming a stacking structure of aragonite plates and polymeric materials has been observed in biomineralized aragonite [18,19,20,21]. Thus, thermal dehydration in biomineralized aragonite is expected to occur as a multistep process, accompanied by the decomposition of polymeric materials and release of water molecules included in the lamellar structure, as well as absorbed water. After linearly heating biomineralized aragonite, thermal dehydration occurs as a partially overlapping, multistep process [22,23]. In our previous studies [22,23], the multistep thermal dehydration of coral aragonite and freshwater pearl were kinetically characterized using an advanced kinetic computation of kinetic deconvolution analysis (KDA) [24,25,26,27,28], and the relationships between each thermal dehydration step and the A–C transformation were discussed by comparing the temperature regions of these transformations. However, further detailed kinetic information about A–C transformation is needed for discussing the relationship between the thermal dehydration processes and A–C transformation in a kinetic scheme. Herein, we focus on the kinetics of thermally induced A–C transformation by systematically collecting the kinetic data under isothermal conditions using powder X-ray diffractometry (XRD) and under linear nonisothermal conditions using Fourier transform infrared spectroscopy (FT-IR) using a seawater spiral shell (Euplica scripta). In addition, the multistep thermal dehydration process of the shell was traced using thermogravimetry (TG) and analyzed based on KDA. The interplay of these thermally induced processes is discussed based on the kinetic results.
The biomimetic mineralization process of CaCO3 has been extensively studied for realizing highly functional materials in biominerals [29,30,31,32,33,34,35]. The fundamental studies of biomineralization processes in living organisms and of the specific functionality and reactivity of various biominerals have provided information for promoting biomimetic mineralization studies [36,37,38]. Considering that the mutual relationship between A–C transformation and thermal dehydration examined in this study can be a specific phenomenon attributed to the constructional characteristics and reactivity specific to the biomineral, a detailed understanding of the mechanistic and kinetic features provides fundamental information about the biominerals to be used in studies of biomimetic mineralization, in addition to a physicochemical understanding of A–C transformation.

2. Materials and Methods

2.1. Sample and Characterization

A seawater spiral shell (Euplica scripta), which is commercially available for handicrafts, was used as a sample of biomineralized aragonite (Figure S1 in Supplementary Information). The shells were classified into four categories in reference to the colors—brown, light brown, beige, and white—owing to differences in the degrees of natural blanching. The shells in each color classification were carefully ground using a stainless-steel mortar and pestle and sieved to different particle size fractions. The shell powders in the four different color classifications were characterized by energy dispersive X-ray (EDX) spectroscopy, XRD, FT-IR, and thermogravimetry (TG)/differential thermal analysis (DTA)–mass spectroscopy (MS). For the EDX spectroscopy, a pellet of the sample powders was prepared by mechanical pressing under a pressure of 8 MPa. The pellet was coated with a thin Pt layer by sputtering (JFC-1600, JEOL, Tokyo, Japan; 30 mA, 30 s). The sample surface was observed by scanning electron microscopy (SEM, JSM-6510, JEOL, Tokyo, Japan), and the EDX spectra were recorded using an instrument (x-act, Oxford Instruments, Tokyo, Japan) equipped with an SEM instrument. The XRD patterns were recorded using a diffractometer (RINT 2200V, Rigaku, Tokyo, Japan) by radiating Cu-Kα (40 kV, 20 mA) and scanning 2θ values from 5° to 60° at a scan speed of 4° min−1 within a 0.02° interval. For FT-IR spectroscopy, the shell powders were quantitatively diluted to 10 wt% with KBr powder by mixing precisely weighed shell and KBr powders in an agate mortar with a pestle. The FT-IR spectra for each diluted sample were recorded using a spectrometer (FTIR 8400S, Shimadzu, Kyoto, Japan) with the diffuse reflectance method. Approximately 10 mg of each shell powder sample, weighted into a Pt pan (diameter, 5 mm; depth, 2.5 mm), were subjected to TG/DTA–MS measurements. Using a TG–DTA instrument (TG-8120, Thermoplus2 system, Rigaku, Tokyo, Japan), the sample was heated from room temperature to 1223 K at a heating rate (β) of 5 K min−1 in a stream of dry helium gas at a flow rate (qv) of 200 cm3 min−1. During the TG–DTA measurements, a part of the outlet gas from the reaction chamber was continuously introduced into a quadrupole mass spectrometer (M-200QA, Anelva, Kanagawa, Japan) via a capillary tube (internal diameter, 75 μm; length, 0.7 m) heated at 500 K. The MS spectra of the outlet gas from the TG–DTA instrument were repeatedly recorded without breaks in the m/z range of 10–50 amu (EMSN, 1.0 mA; SEM, 1.0 kV). For the brown shell, cross-sectional surfaces of roughly crushed pieces of the shell and powdered sample particles were observed by SEM after the pieces were coated with a thin Pt layer by sputtering (30 mA, 30 s).

2.2. Investigation of Thermal Behavior

To obtain detailed information about the thermally induced changes, the brown shell powder in a sieved fraction within the range of 90–150 μm was used. The changes in the XRD patterns of the shell powder sample during thermal treatment were tracked using the RINT 2200V diffractometer equipped with a programable heating chamber (PTC-20A, Rigaku, Tokyo, Japan). The sample, fitted to a Pt plate sample holder by gentle pressing, was heated from room temperature to 1123 K at a β of 2 K min−1 in a stream of dry N2 gas at a qv of 100 cm3 min−1, during which isothermal holding sections for 15 min were inserted within a 50 K interval in the temperature range of 323–1123 K. The XRD patterns of the sample were recorded during each isothermal holding section under the same measurement conditions as those applied for the sample characterization at room temperature.
The TG–DTA measurements for the shell powder sample (brown shell; 90–150 μm) weighed in the Pt pan (initial mass (m0), approximately 20.0 mg) were performed using a TG–DTA instrument (STA7300, TA7000 system, Hitachi High Tech, Tokyo, Japan) under different atmospheric conditions in a stream of dry N2 gas or N2–CO2 mixed gas (20%-CO2) at a qv of 300 cm3 min−1. Under both atmospheric conditions, the sample was heated from 303 to 1223 K at a β of 5 K min−1.

2.3. Kinetic Data Measurement for the A–C Transformation

The A–C transformation of the shell powder sample (brown shell, 90–150 μm) at different temperatures was tracked by XRD. In a stream of dry N2 gas (qv = 100 cm3 min−1), the sample press-fitted to the Pt plate was heated to a programed temperature (T = 643, 653, 663, or 673 K) at a β of 10 K min−1, and the temperature was maintained until the transformation was completed, during which XRD measurements were repeated within a 15-min interval of the measurement starting time.
To obtain the heat-treated samples characterized by different conversion fractions (αtr) of A–C transformation, approximately 20 mg of the shell powder in the Pt pan was heated from 303 K to temperatures within the range of 657–707 K at β values of 1, 3, 5, and 10 K min−1 in a stream of N2–CO2 mixed gas (20%-CO2) using a TG–DTA instrument (TG/DTA 220, SII). The thermally treated sample was recovered after naturally cooling to room temperature in the instrument. The heat-treated sample was quantitatively diluted to 10 wt% with KBr. The FT-IR spectra of the heat-treated samples were recorded using an FT-IR 8400S spectrometer under the measurement conditions identical to those applied during the characterization of the original sample.

2.4. Kinetic Data Measurement for the Multistep Thermal Dehydration

The kinetic behavior of multistep thermal dehydration was tracked using TG–DTA measurements (STA7300, TA7000 system, Hitachi High Tech) in a stream of N2–CO2 mixed gas (20%-CO2). The sample (m0 = 20.00 ± 0.04 mg; in a Pt pan) was heated from 303 to 1223 K at β values of 1, 2, 3, 5, 7, and 10 K min−1.

3. Results and Discussion

3.1. Sample Characterization

Irrespective of the shell samples in different color groups, the major component elements were Ca, C, and O, although a detectable trace of Na was observed for all samples (Figure S2). The XRD patterns exhibited diffraction peaks attributed to aragonite (orthorhombic, space group (SG) = Pmcn(62), a = 4.9652, b = 7.9636, c = 5.7484, α = β = γ = 90.000, ICDD PDF 01-075-9982) [39,40] and calcite (trigonal, SG = R-3c(167), a = b = 4.9896, c = 17.0610, α = β = 90.000, γ = 120.000, ICDD PDF 00-047-1743) [41] (Figure S3). The mixed ratio of aragonite and calcite, determined using the Rietveld and reference intensity ratio methods, indicated that the more dilute color sample exhibited a greater content of calcite, as listed in Table S1. The brown shell sample exhibited the greatest content of the aragonite phase (95.3%). The shell samples with different colors exhibited IR absorption peaks attributable to vibration modes of CO32− and O–H [42,43,44] (Figure S4). The presence of water molecules was confirmed by the O–H stretching vibration in the range of 2600–3600 cm−1 and the H–O–H bending vibration at ~1650 cm−1 (Figure S4a). The v4 mode of CO32− appeared as two split absorption peaks at 700 and 713 cm−1, characteristic of the aragonite phase. The other CO32− vibration modes of v2, v1, and v3 were observed at 863, 1082, and 1504 cm−1, respectively. Regarding the two split absorption peaks at 700 and 713 cm−1, the ratio of absorbance of these peaks varied with the shell samples in different color groups, in which the ratio of the peak at 713 cm−1 increased as the shell color was diluted (Figure S4b). This finding can be interpreted in relation to the increase in the content ratio of calcite because the calcite phase does not exbibit the absorption peak at 700 cm−1. The content ratio of aragonite and calcite was determined from the ratio of the area of IR absorption peaks [43,44,45,46,47,48,49] (Figure S5). After the FT-IR spectra were converted to the absorption spectra using the Kubelka–Munk conversion, the specific double peaks with maxima at 700 and 713 cm−1 were deconvoluted using the Lorentzian function (Equation (S1)) (Figure S5a). Thereafter, the content ratio of aragonite and calcite was determined using a calibration curve method with reference to the peak areas attributed to aragonite and calcite (Figure S5b). This procedure was detailed in our previous study [23] and is outlined in the Supplementary Information. The content of aragonite determined from the IR spectra is also listed in Table S1. The content ratios of aragonite determined by XRD and FT-IR spectroscopy were practically identical, and the brown sample exhibited the greatest content of aragonite.
Figures S6 and S7 show the SEM images of the cross-sectional surfaces of the roughly crushed brown shell and the powdered sample particles, respectively. The Euplica scripta shell comprised outer, middle, and inner layers, as generally observed for spiral shells [18,19,20,21]. The middle layer with a thickness of approximately 20 μm had a construction built with plate-like first-order lamella (Figure S6a). The first-order lamella was constructed by the second-order lamella and further by the third-order lamella, which is the basic building block (Figure S6b). A similar construction was observed for the inner layer (Figure S6c,d). In the powdered sample, submicrometer-sized particles generated by crushing adhered to the surface of each particle (Figure S7a). The constructional lamellar structures of the shell were exposed on the surfaces of the main body of the particles (Figure S7b).

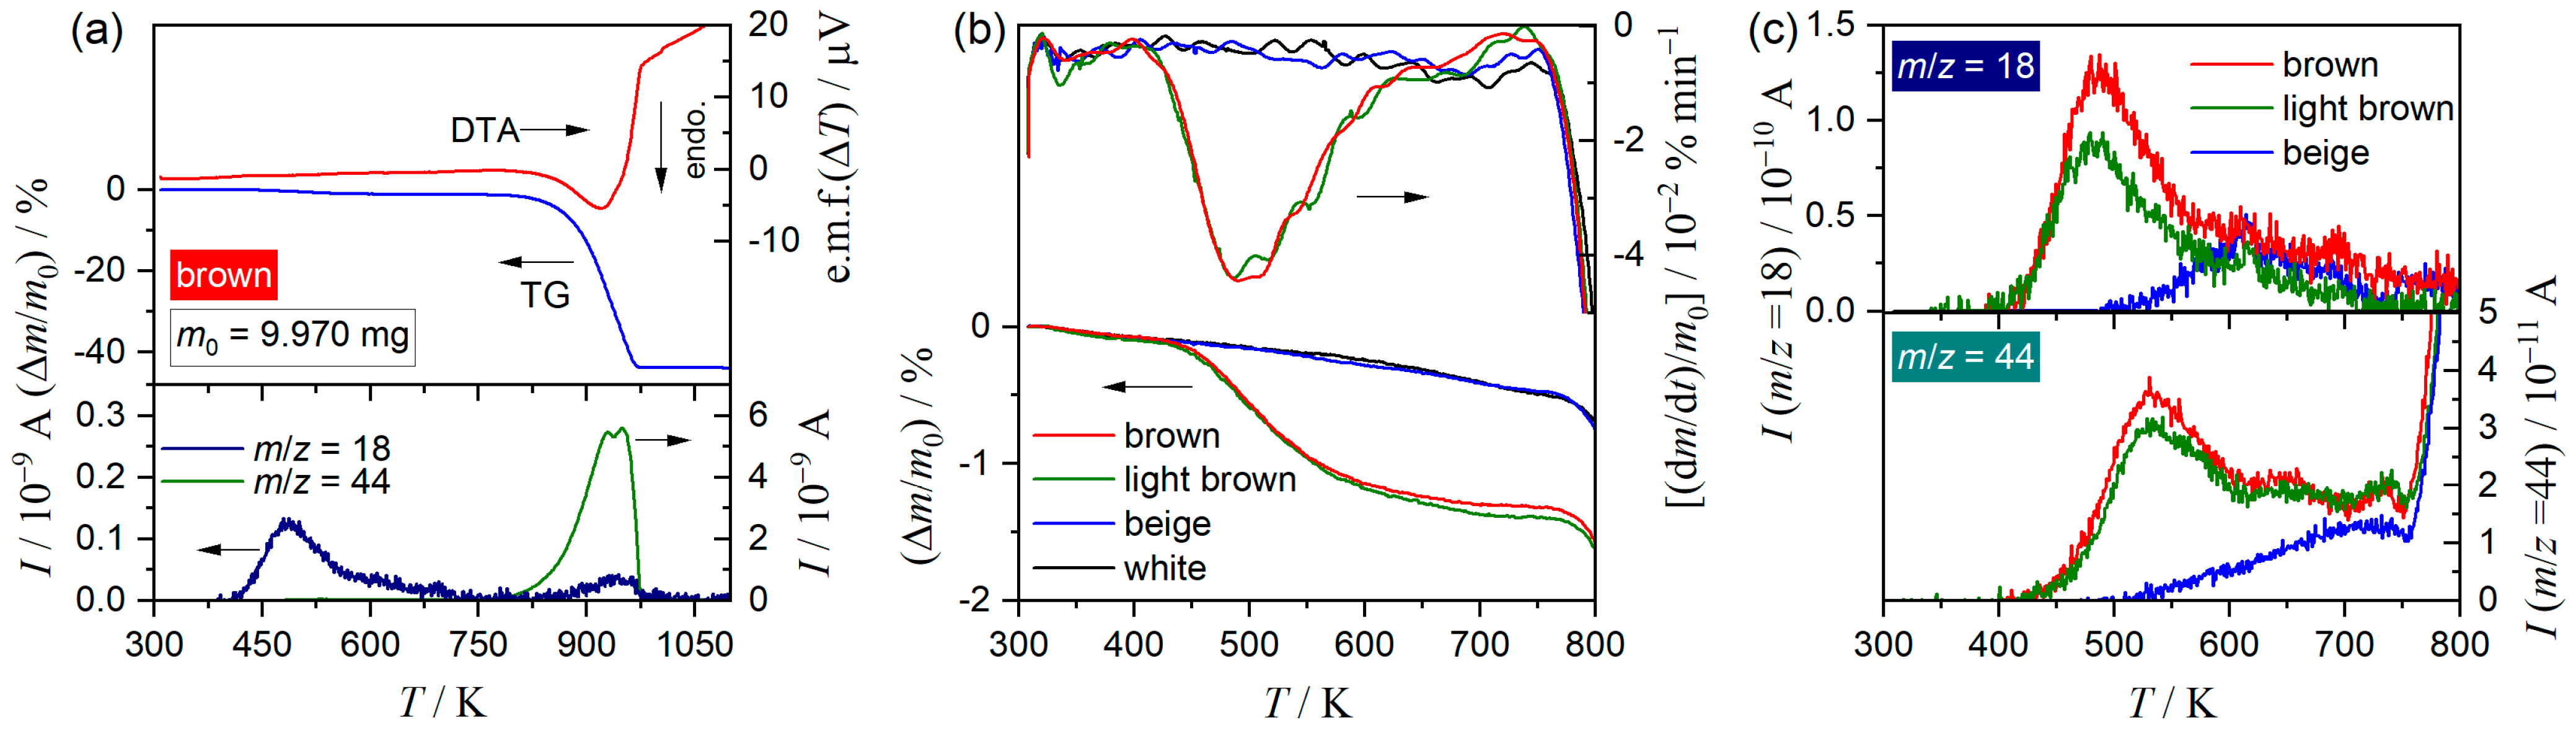
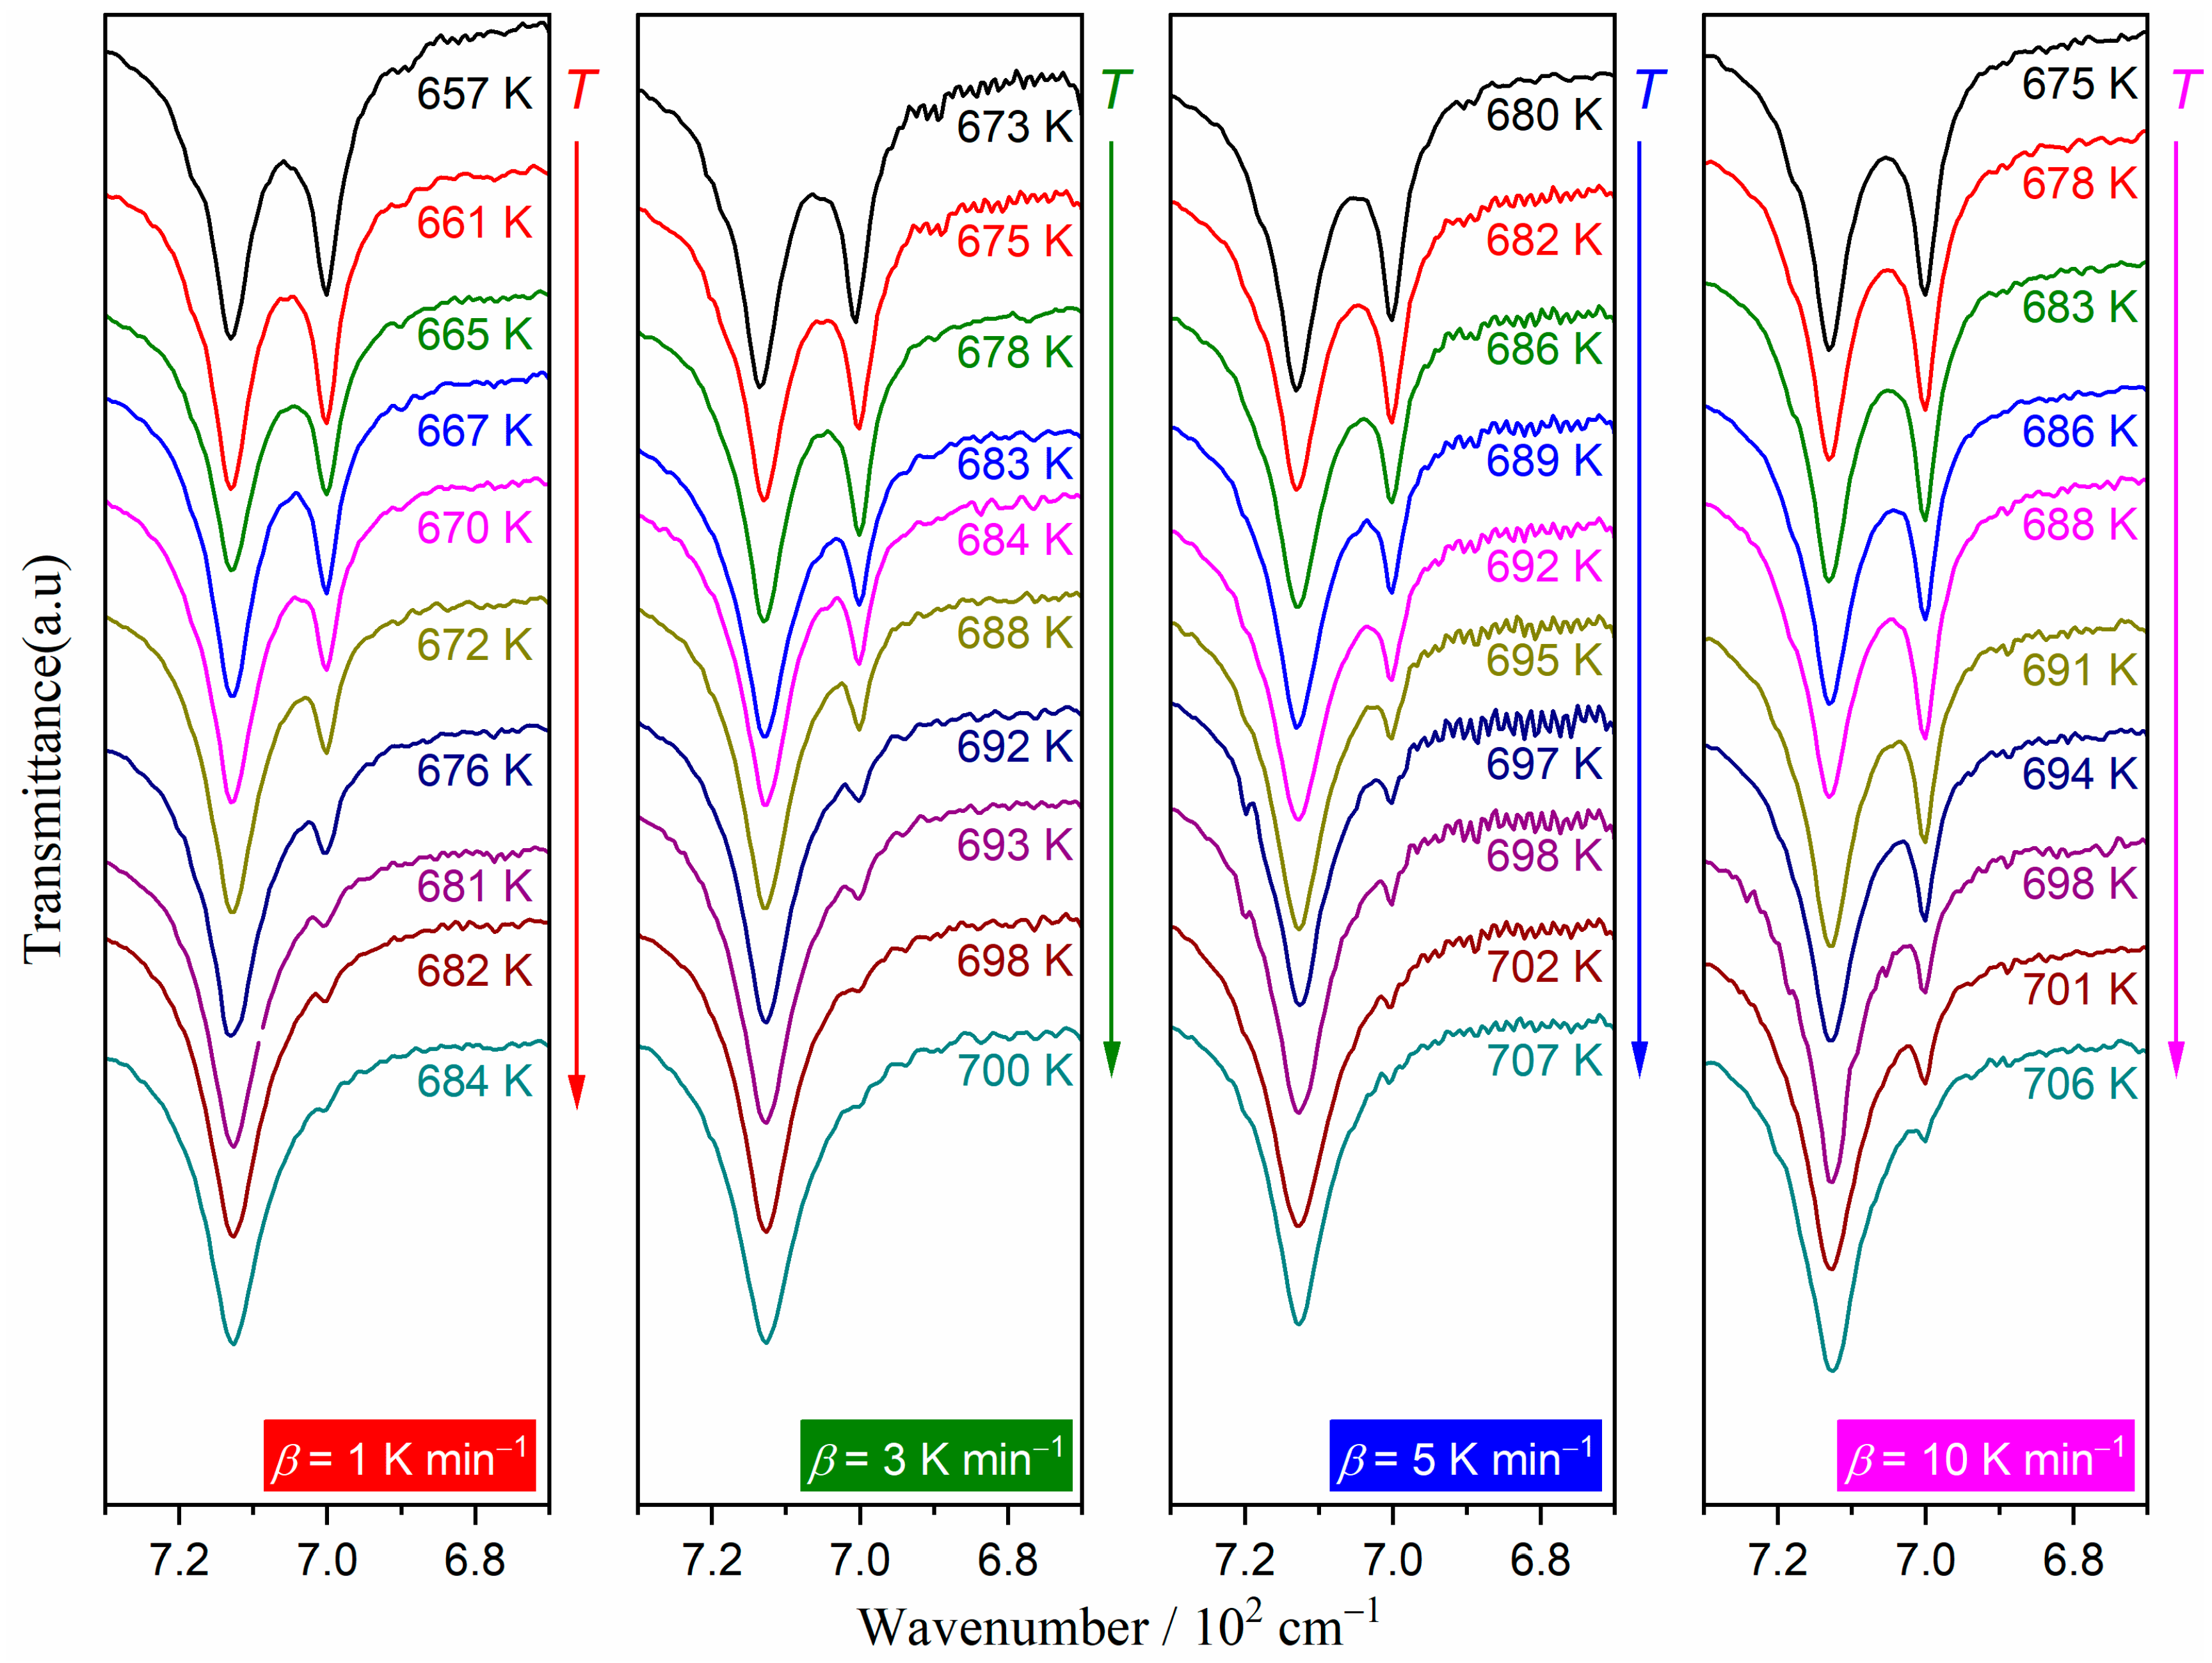
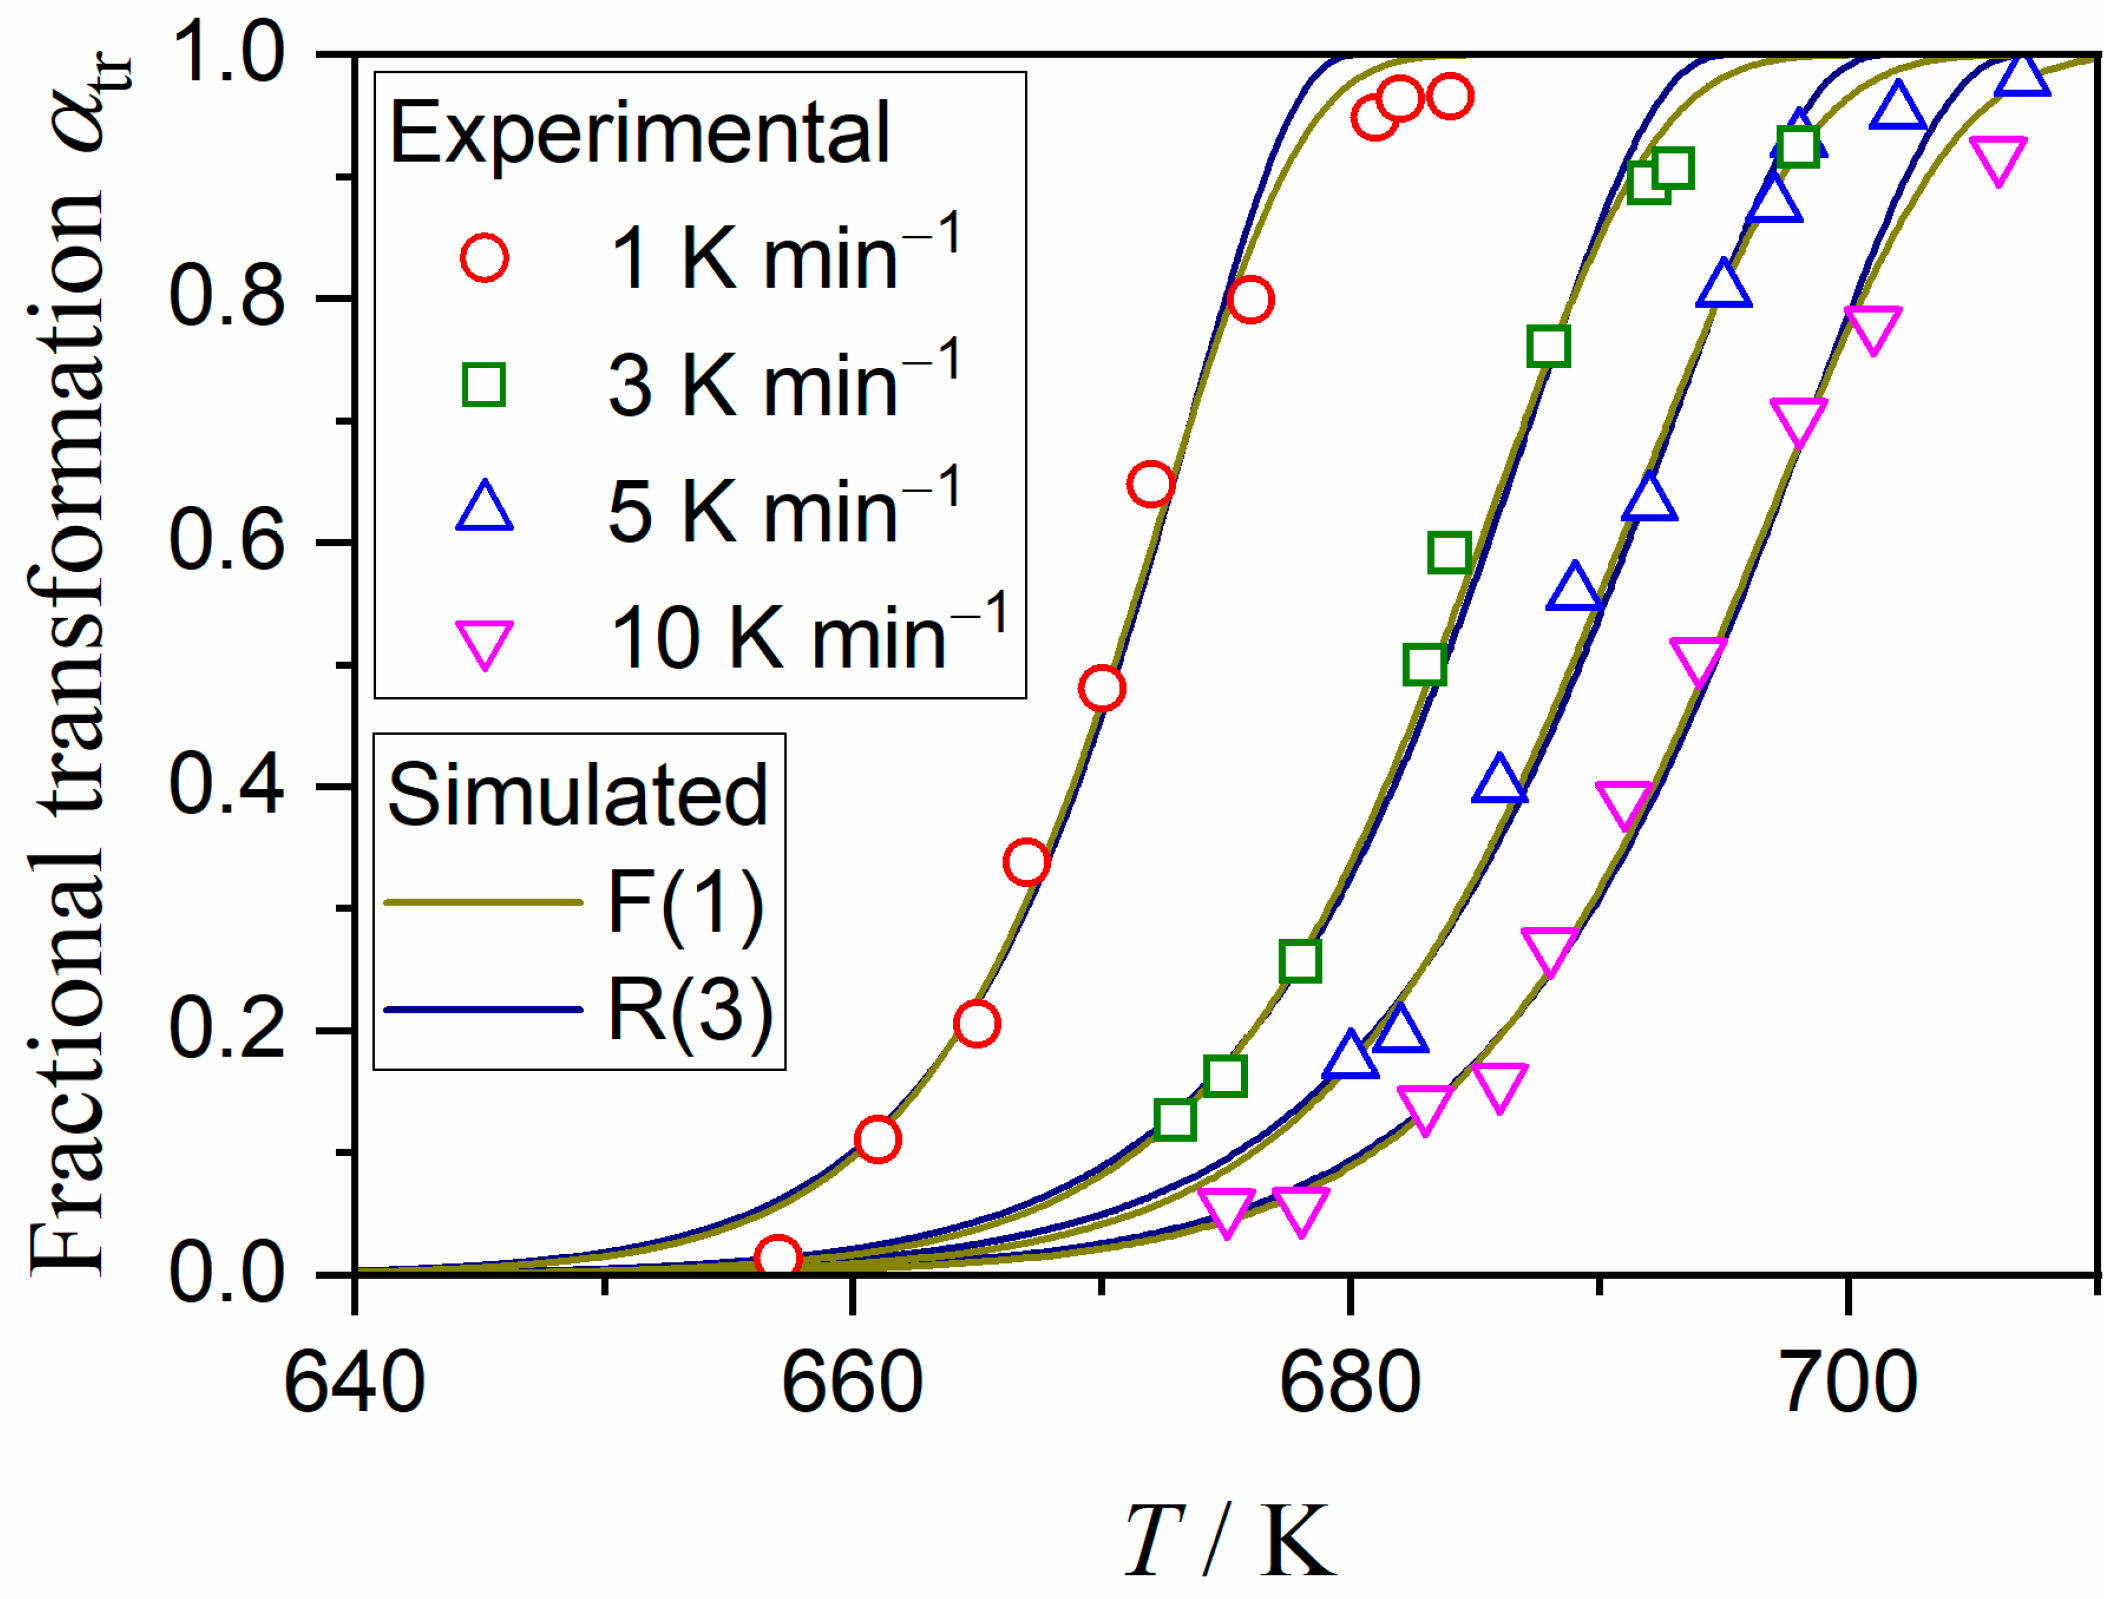
3.2. Thermal Behavior

Figure 1 shows the results of the TG/DTA–MS measurements for the different shell powder samples. As shown for the brown sample, the thermal decomposition of CaCO3 accompanied by the evolution of CO2 was observed as the major mass loss process while heating the samples (Figure 1a). Notably, preliminary to the thermal decomposition of CaCO3, a detectable mass loss accompanied by the evolution of water vapor was observed in the temperature range of 400–800 K. The sample with the deep colors exhibited large mass loss values, owing to preliminary thermal dehydration (Figure 1b). This outcome was confirmed by the large peak area of the MS thermogram for m/z = 18 of the deep-colored samples (Figure 1c). In the deep-colored samples, the major peak of m/z = 18 was accompanied by a small but detectable peak of m/z = 44. Because the temperature region of the thermal dehydration is much lower than the thermal decomposition of CaCO3, the simultaneous evolution of water vapor and CO2 may be attributed to the thermal degradation of component polymeric materials. In our previous study of biomineralized calcite, i.e., avian eggshell [50], similar simultaneous evolution of water vapor and CO2 was observed as a part of preliminary dehydration process occurring prior to the thermal decomposition of calcite, for which the thermal degradation of fibrous protein substances was microscopically confirmed in the corresponding temperature range. It is expected that the degradation of component polymeric materials contributes to a part of the multistep thermal dehydration of the shell samples. It is deduced from the comparisons of the A–C composition and thermal dehydration behavior between differently colored shell samples that the natural whitening resulted from weathering of the shell, leading to the degradation of polymeric material and partial A–C transformation. Therefore, the brown shell, characterized by the least content of calcite and the largest mass loss value during the preliminary dehydration process, was selected for investigating the relationship between the A–C transformation and thermal dehydration.
The changes in the XRD pattern while heating the brown sample powder using the stepwise isothermal heating mode indicated that A–C transformation occurred in the temperature range of 523–723 K (Figure S8), followed by thermal decomposition of calcite to form CaO in the temperature range of 923–1023 K. The temperature range of A–C transformation was covered by the temperature range of the thermal dehydration process, as reported for biomineralized aragonite samples [22,23]. When the sample was heated in a stream of N2–CO2 mixed gas characterized by a high partial pressure of CO2, only the mass loss process, owing to the thermal decomposition of calcite, shifted to high temperatures without detectable changes in the mass loss process of preliminary thermal dehydration (Figure S9). As a result, the temperature ranges of the thermal dehydration and the subsequent thermal decomposition of calcite were experimentally separated, which was desirable for analyzing the kinetics of the thermal dehydration.

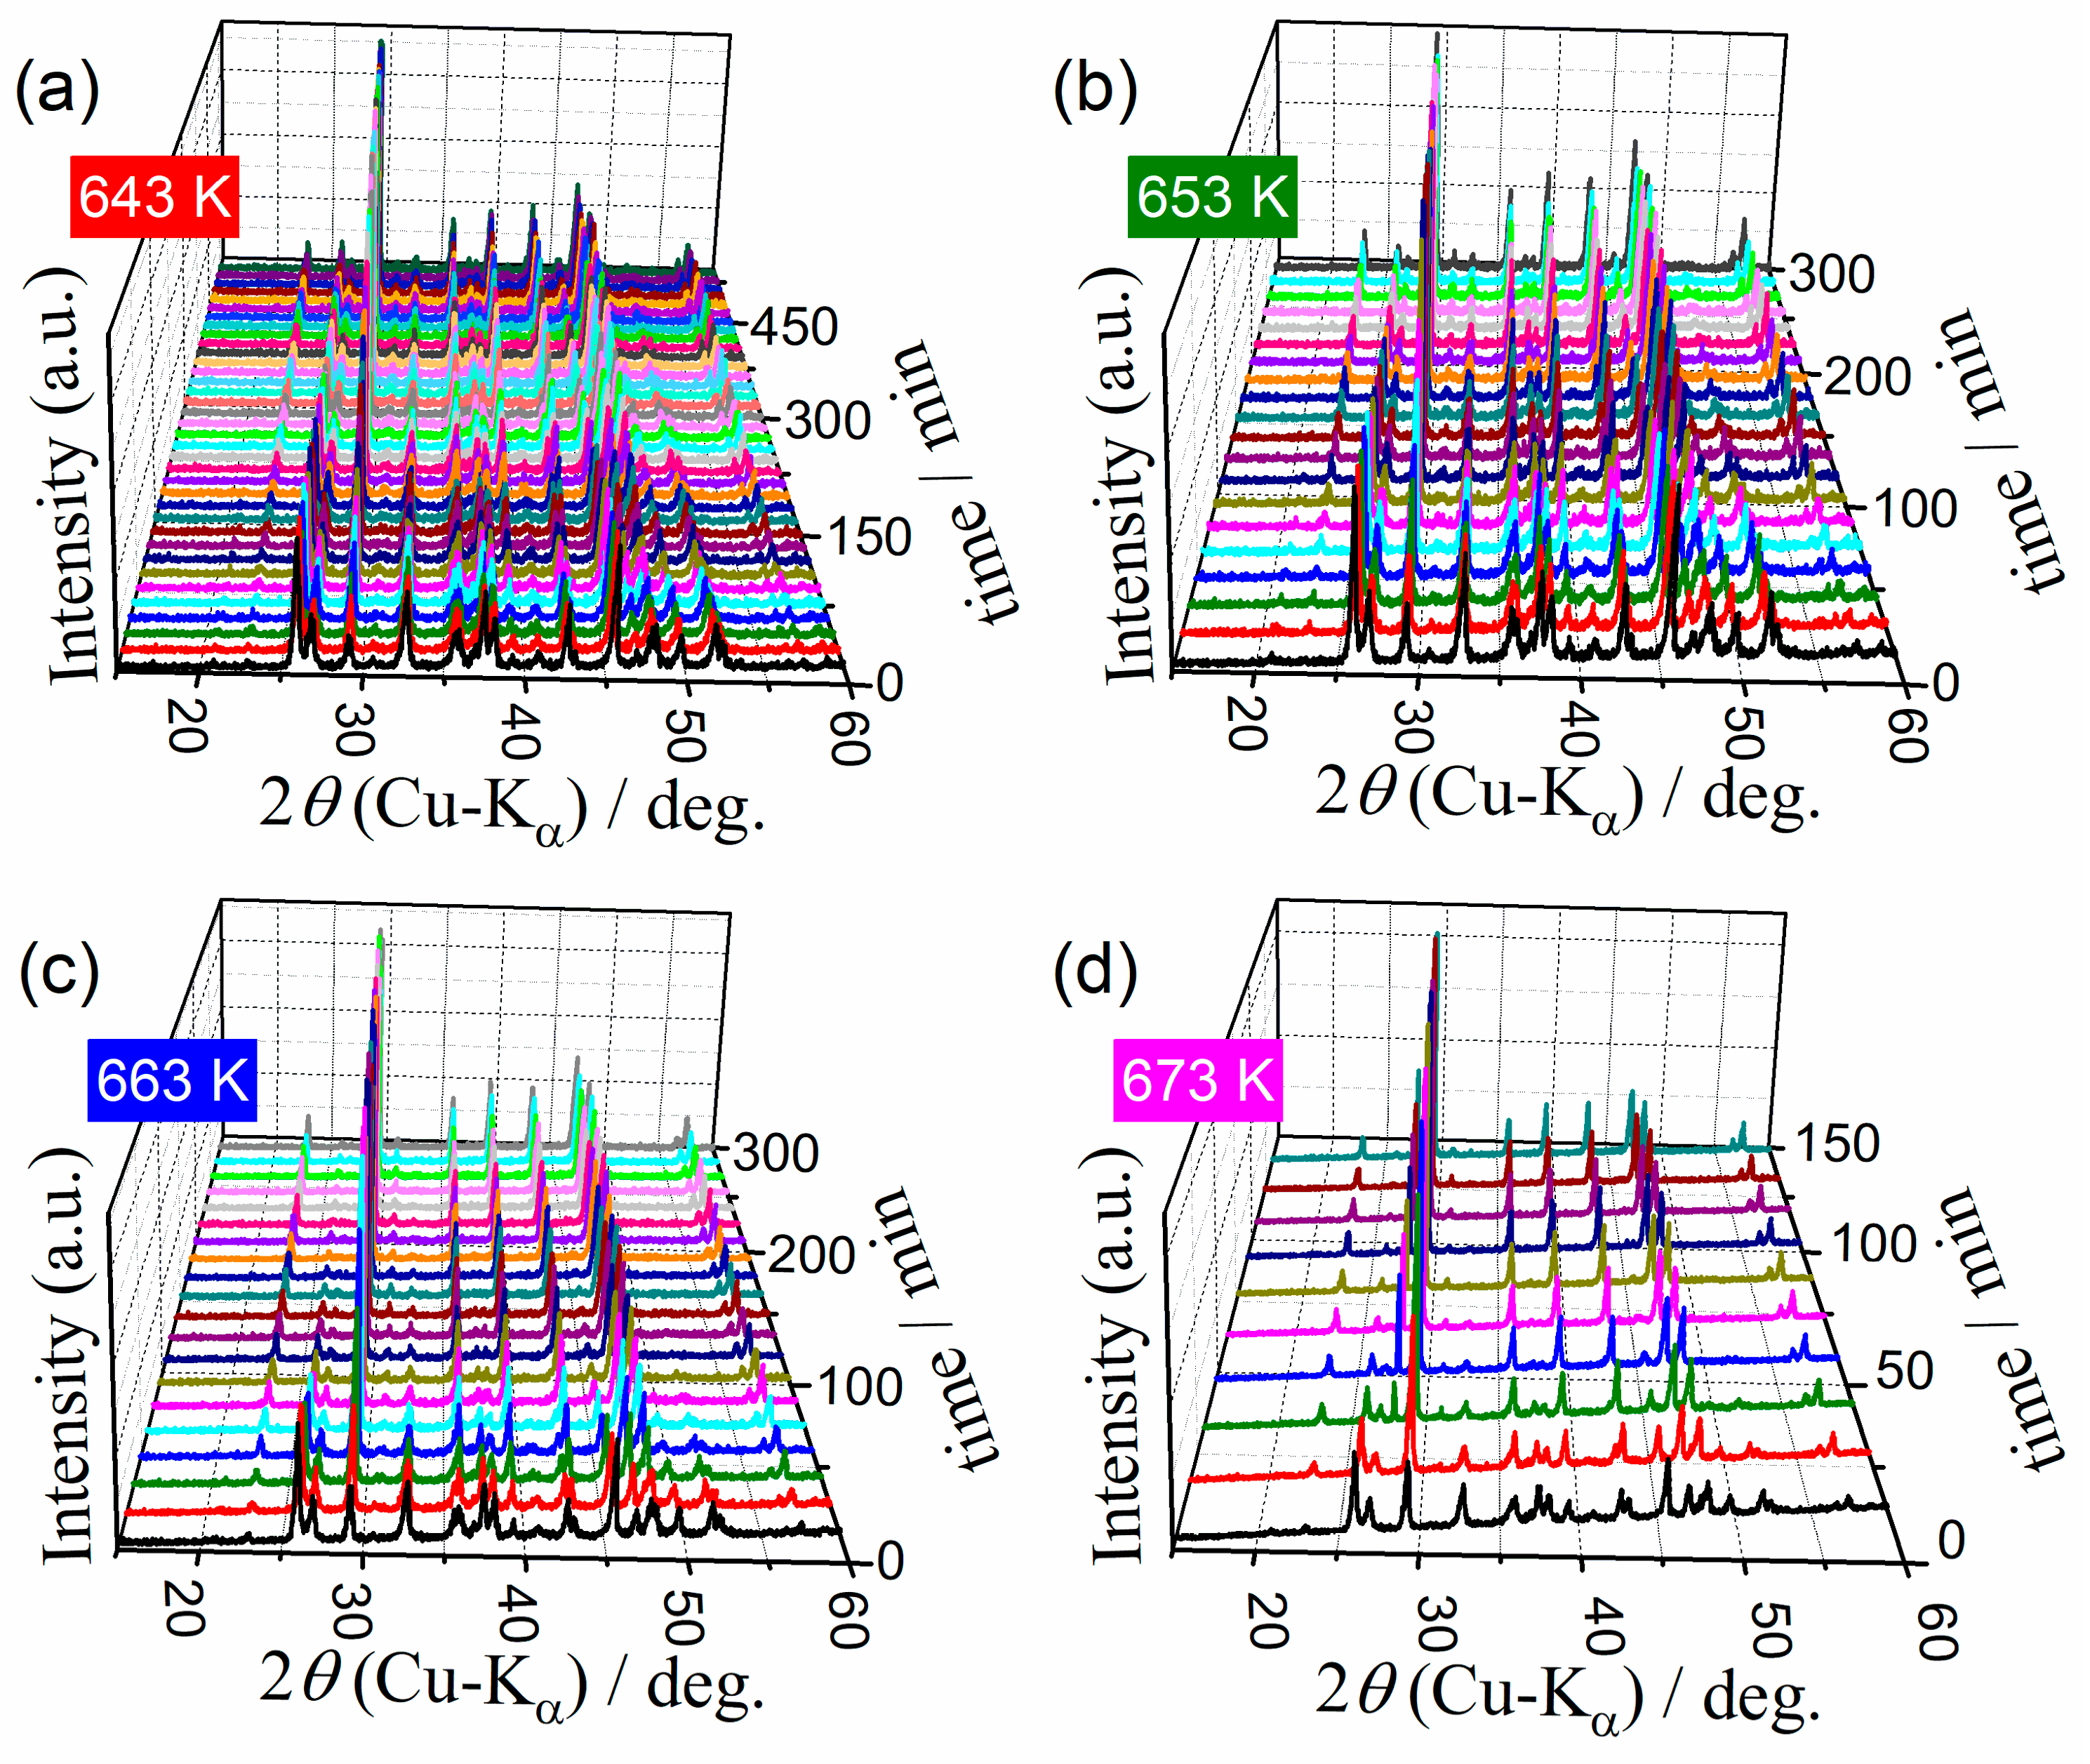
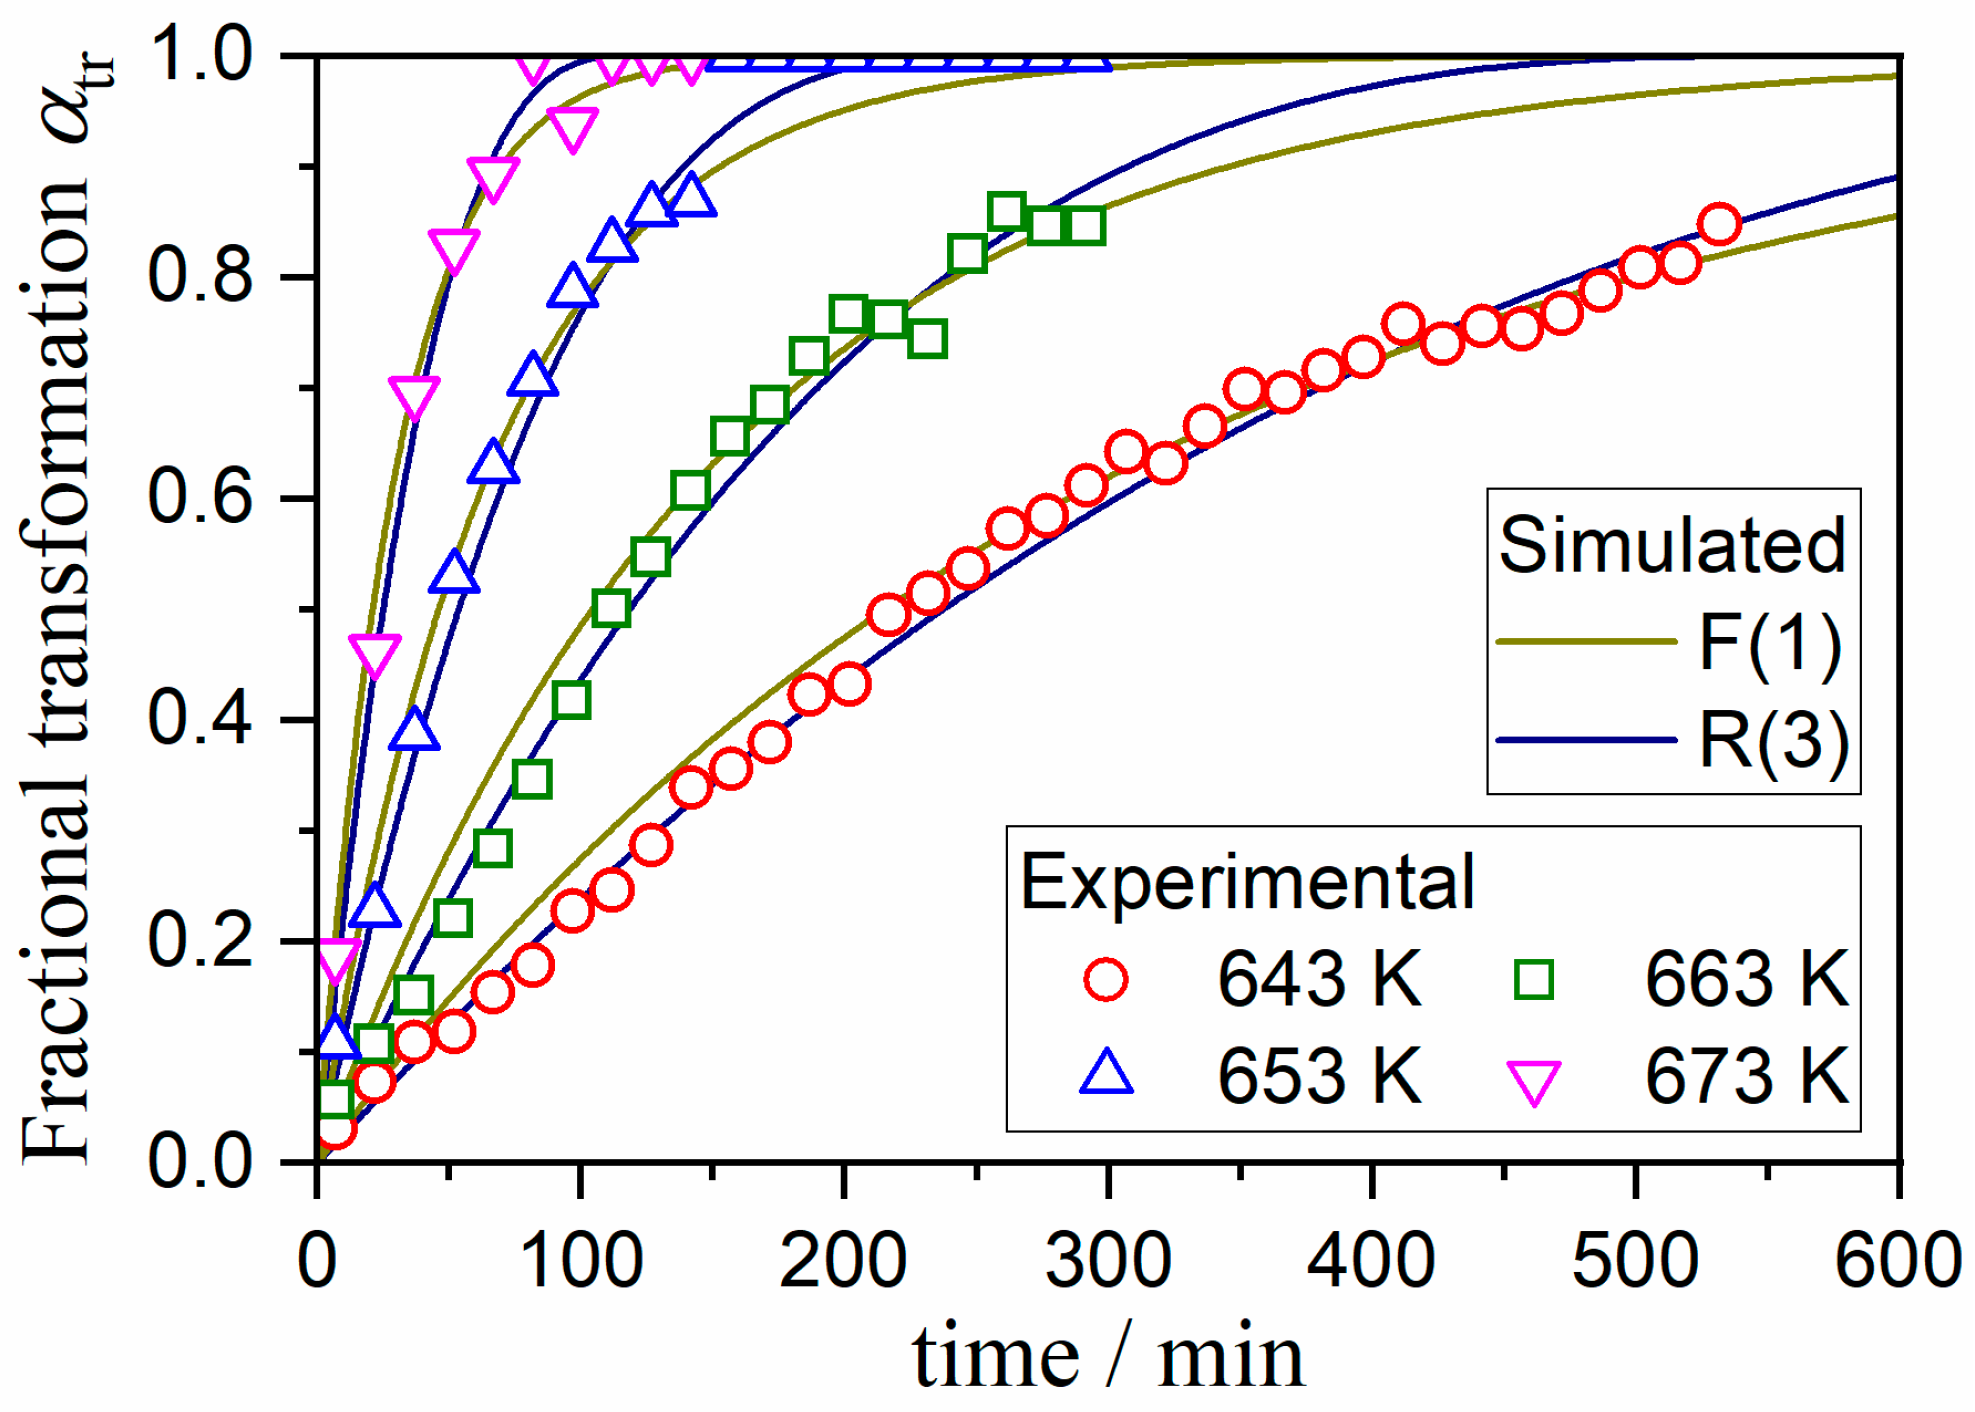
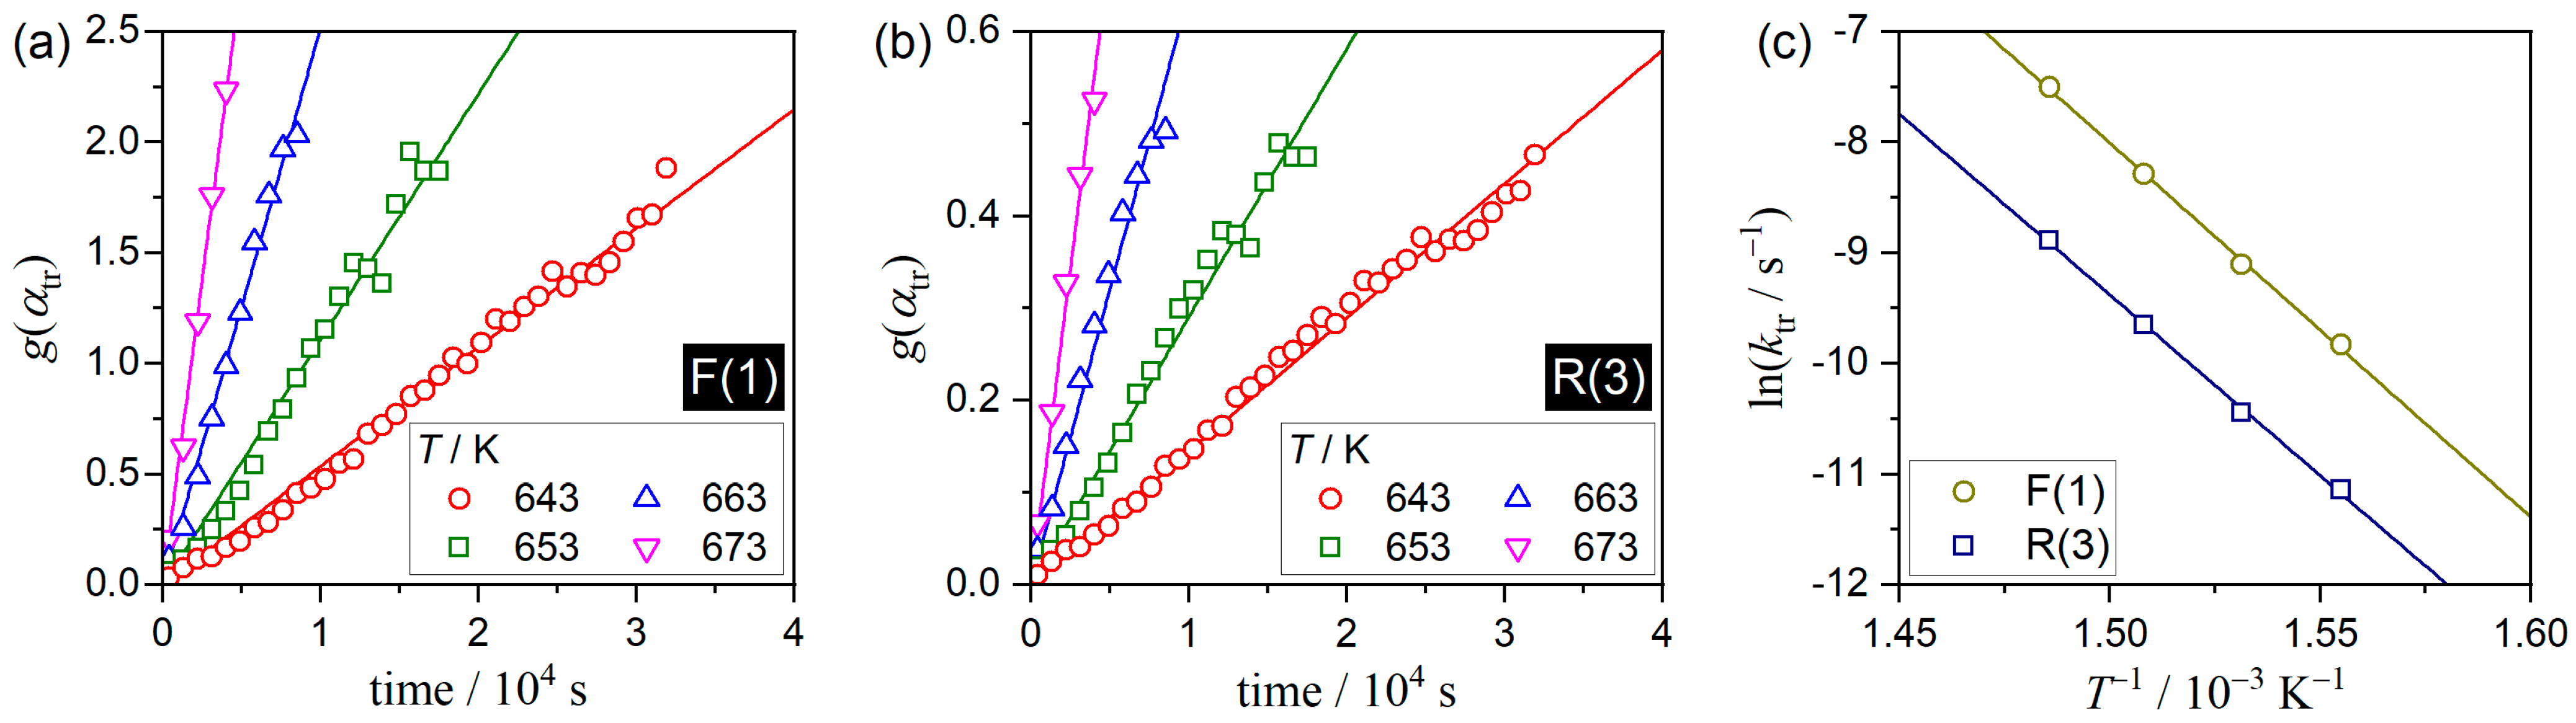
3.3. Kinetics of the A–C Transformation

A–C transformation at different temperatures was traced by XRD (Figure 2). The contents of aragonite and calcite at each duration of isothermal heat treatment were determined by analyzing each XRD pattern, from which the αtr value at each duration was calculated. The αtr versus time plots at different temperatures were used as the kinetic data for A–C transformation (Figure 3). The time-dependent change in the αtr values and its temperature dependence indicated that it was a kinetically controlled process.
The experimentally determined kinetic data (symbols in Figure 3) were analyzed using conventional kinetic calculation procedures for solid-state reactions under isothermal conditions (Figure 4). The rate constant (ktr) for A–C transformation at each temperature was determined by examining the linear correlations of the kinetic model function g(αtr) versus time plots using different g(αtr), as listed in Table S2 [51].
g α t r = k t r t
The most statistically significant linear correlation of the g(αtr) versus t plot was confirmed when the first-order reaction model (F(1): g(αtr) = −ln(1 − αtr)) or the three-dimensional phase boundary controlled reaction (R(3): g(αtr) = 1 − (1 − αtr)1/3) was used, as shown in Figure 4a and b, respectively. The ktr values are listed in Table S3. The Arrhenius-type temperature dependence was applicable to the ktr values (Figure 4c).
ln k t r = l n A t r E a , t r R T ,
where Atr and Ea,tr are the preexponential factor and apparent activation energy for the transformation, respectively, and R is the gas constant. The Arrhenius plots for the ktr values, determined by assuming F(1) and R(3) to be suitable kinetic model functions, exhibited a parallel shift with practically the same slope. The shift was due to the Atr values, which were related to the geometrical constraints assumed in the respective g(αtr). Table 1 summarizes the as-determined Arrhenius parameters. The overall kinetic curves for A–C transformation at each temperature were simulated using these kinetic parameters (Figure 3). The overall kinetic curves based on the R(3) model exhibited a better fit to the experimental data points in comparison with those based on the F(1) model.
Figure 5 shows the FT-IR spectra of the sample preheated to different temperatures at different β values. Irrespective of β, the split peaks at 700 and 713 cm−1 attributable to the v4 mode of CO32− gradually converged to a single peak at 713 cm−1 with an increase in the temperature, exhibiting the transformation from aragonite to calcite. The αtr value of the preheated sample was determined from each spectrum by the quantitative analysis of the peak areas of the split peaks using the calibration curve method, as used for the sample characterization. The changes in the αtr values with preheated temperature were drawn at each β value, as shown in Figure 6.
The series of data points of αtr versus T at each β value in Figure 6 were used as kinetic data in the integral form under linearly increasing temperature conditions. The kinetic data at each β value were analyzed using the Coats and Redfern method [52].
l n g α t r T 2 = l n A t r R β E a , t r 1 2 R T E a , t r E a , t r R T
The statistically significant linear correlation of ln[g(αtr)/T2] versus T−1 was obtained when the F(1) or R(3) model was used as g(αtr), irrespective of the β value (Figure S10). The Arrhenius parameters determined for A–C transformation at each β value are listed in Table S4. As observed for solid-state reactions, the Ea,tr and ln Atr values determined using the Coats and Redfern method decreased with an increase in the β value [53,54,55,56]. In addition, the Ea,tr and ln Atr values at a β value calculated using different kinetic models were different [57,58]. Furthermore, these Ea,tr and ln Atr values at different β values and kinetic models exhibited a linear correlation of ln Atr versus Ea,tr (Figure S11), known as the kinetic compensation effect (KCE) [59,60,61,62,63,64,65,66]. Even so, the kinetic triplets (Ea,tr, ln Atr, g(αtr)) obtained by assuming F(1) and R(3) reproduced the practically identical kinetic curves at each β value, as shown in Figure 6.
The kinetic curves for A–C transformation under isothermal and linear nonisothermal conditions, simulated using the kinetic parameters determined from the changes in the XRD patterns and FT-IR spectra, respectively, were subjected to isoconversional kinetic analysis, as shown in Figure 7. Kinetic analysis was performed based on the differential kinetic equation [51]:
d α t r d t = A t r e x p E a , t r R T f α t r ,
where f(αtr) is the kinetic model function in differential form. The Friedman plots of ln(dαtr/dt) versus T−1 at selected αtr values were separately examined for the transformations under isothermal and linear nonisothermal conditions, according to the logarithmic form of Equation (4) [67]:
l n d α t r d t = l n A t r f α t r E a , t r R T .
In each heating mode, the Friedman plots [67] exhibited statistically significant linear correlations with the correlation coefficients better than −0.99 at different αtr values over 0.01 ≤ αtr ≤ 0.99 (Figure 7a). Graphically, the Friedman plots for A–C transformation under isothermal and linear nonisothermal conditions show a parallel translation, resulting from different sampling conditions. However, the Friedman plots for the transformations under isothermal and linear nonisothermal conditions at a selected αtr value exhibited different slopes and intercepts. This behavior can be interpreted as a typical KCE caused by the different experimental conditions of kinetic data measurements [59,60,61,62,63,64,65,66]. The Ea,tr variation trends were largely different between the transformations under isothermal and linear nonisothermal conditions (Figure 7b). Under isothermal conditions, the constant Ea,tr value of 271.7 ± 0.1 kJ mol−1 was obtained during the reaction, which was the same as the value used for the simulation of the isothermal kinetic curves. Conversely, the Ea,tr values systematically decreased under linear nonisothermal conditions as the transformation proceeded; it rapidly decreased from approximately 440 to 330 kJ mol−1 in the initial stage of the transformation and subsequently decreased gradually to 300 kJ mol−1 at the end of the transformation, with the average Ea,tr value of 312.5 ± 9.1 kJ mol−1 (0.3 ≤ αtr ≤ 0.9). This variation in the Ea,tr values determined by the isoconversional method was attributed to the variation of Ea,tr value depending on β values obtained using the Coats and Redfern method (Figure S10 and Table S4).
The experimental master plots for transformation under isothermal and linear nonisothermal conditions were drawn by calculating the hypothetical reaction rate (dαtr/dθtr) at an infinite temperature using the average Ea,tr values of 271.7 ± 0.1 kJ mol−1 (0.01 ≤ αtr ≤ 0.99) and 312.5 ± 9.1 kJ mol−1 (0.3 ≤ αtr ≤ 0.9), respectively [68,69,70,71,72,73,74,75].
d α t r d θ t r = d α t r d t e x p E a , t r R T = A t r f α t r with θ t r = 0 t e x p E a , t r R T d t ,
where θtr is Ozawa’s generalized time [74,75] for A–C transformation. Under isothermal conditions, the experimental master plot exhibited a deceleration process that fit perfectly using the R(3) model with an Atr value of (1.63 ± 0.01) × 1017 s−1, which was identical to that determined by conventional isothermal kinetic analysis for the XRD data. The experimental master plot for transformation under linear nonisothermal conditions exhibited a completely different shape from that of isothermal transformation, exhibiting the maximum rate midway through the transformation at αtr = 0.42. The experimental master plot was fitted using an empirical kinetic model known as the Šesták–Berggren model (SB(m, n, p)) because of the high flexibility to fit different rate behaviors [76,77,78].
S B m , n , p : f α t r = α m 1 α n l n 1 α p
The experimental master plot was perfectly fitted using SB(0.06, 0.70, 0.33) with the Atr value of (4.24 ± 0.01) × 1021 s−1. Table 2 summarizes the kinetic results obtained by isoconversional kinetic analysis and the subsequent master plot method for simulated kinetic curves under isothermal and linear nonisothermal conditions. The different rate behaviors between the A–C transformations under isothermal and linear nonisothermal conditions, revealed by the experimental master plots, should be interpreted by considering the different sampling conditions for the measurements of kinetic data. Furthermore, Ea,tr and Atr values exhibit mutually dependent variations between the transformations under isothermal and linear nonisothermal conditions along KCE [59,60,61,62,63,64,65,66].

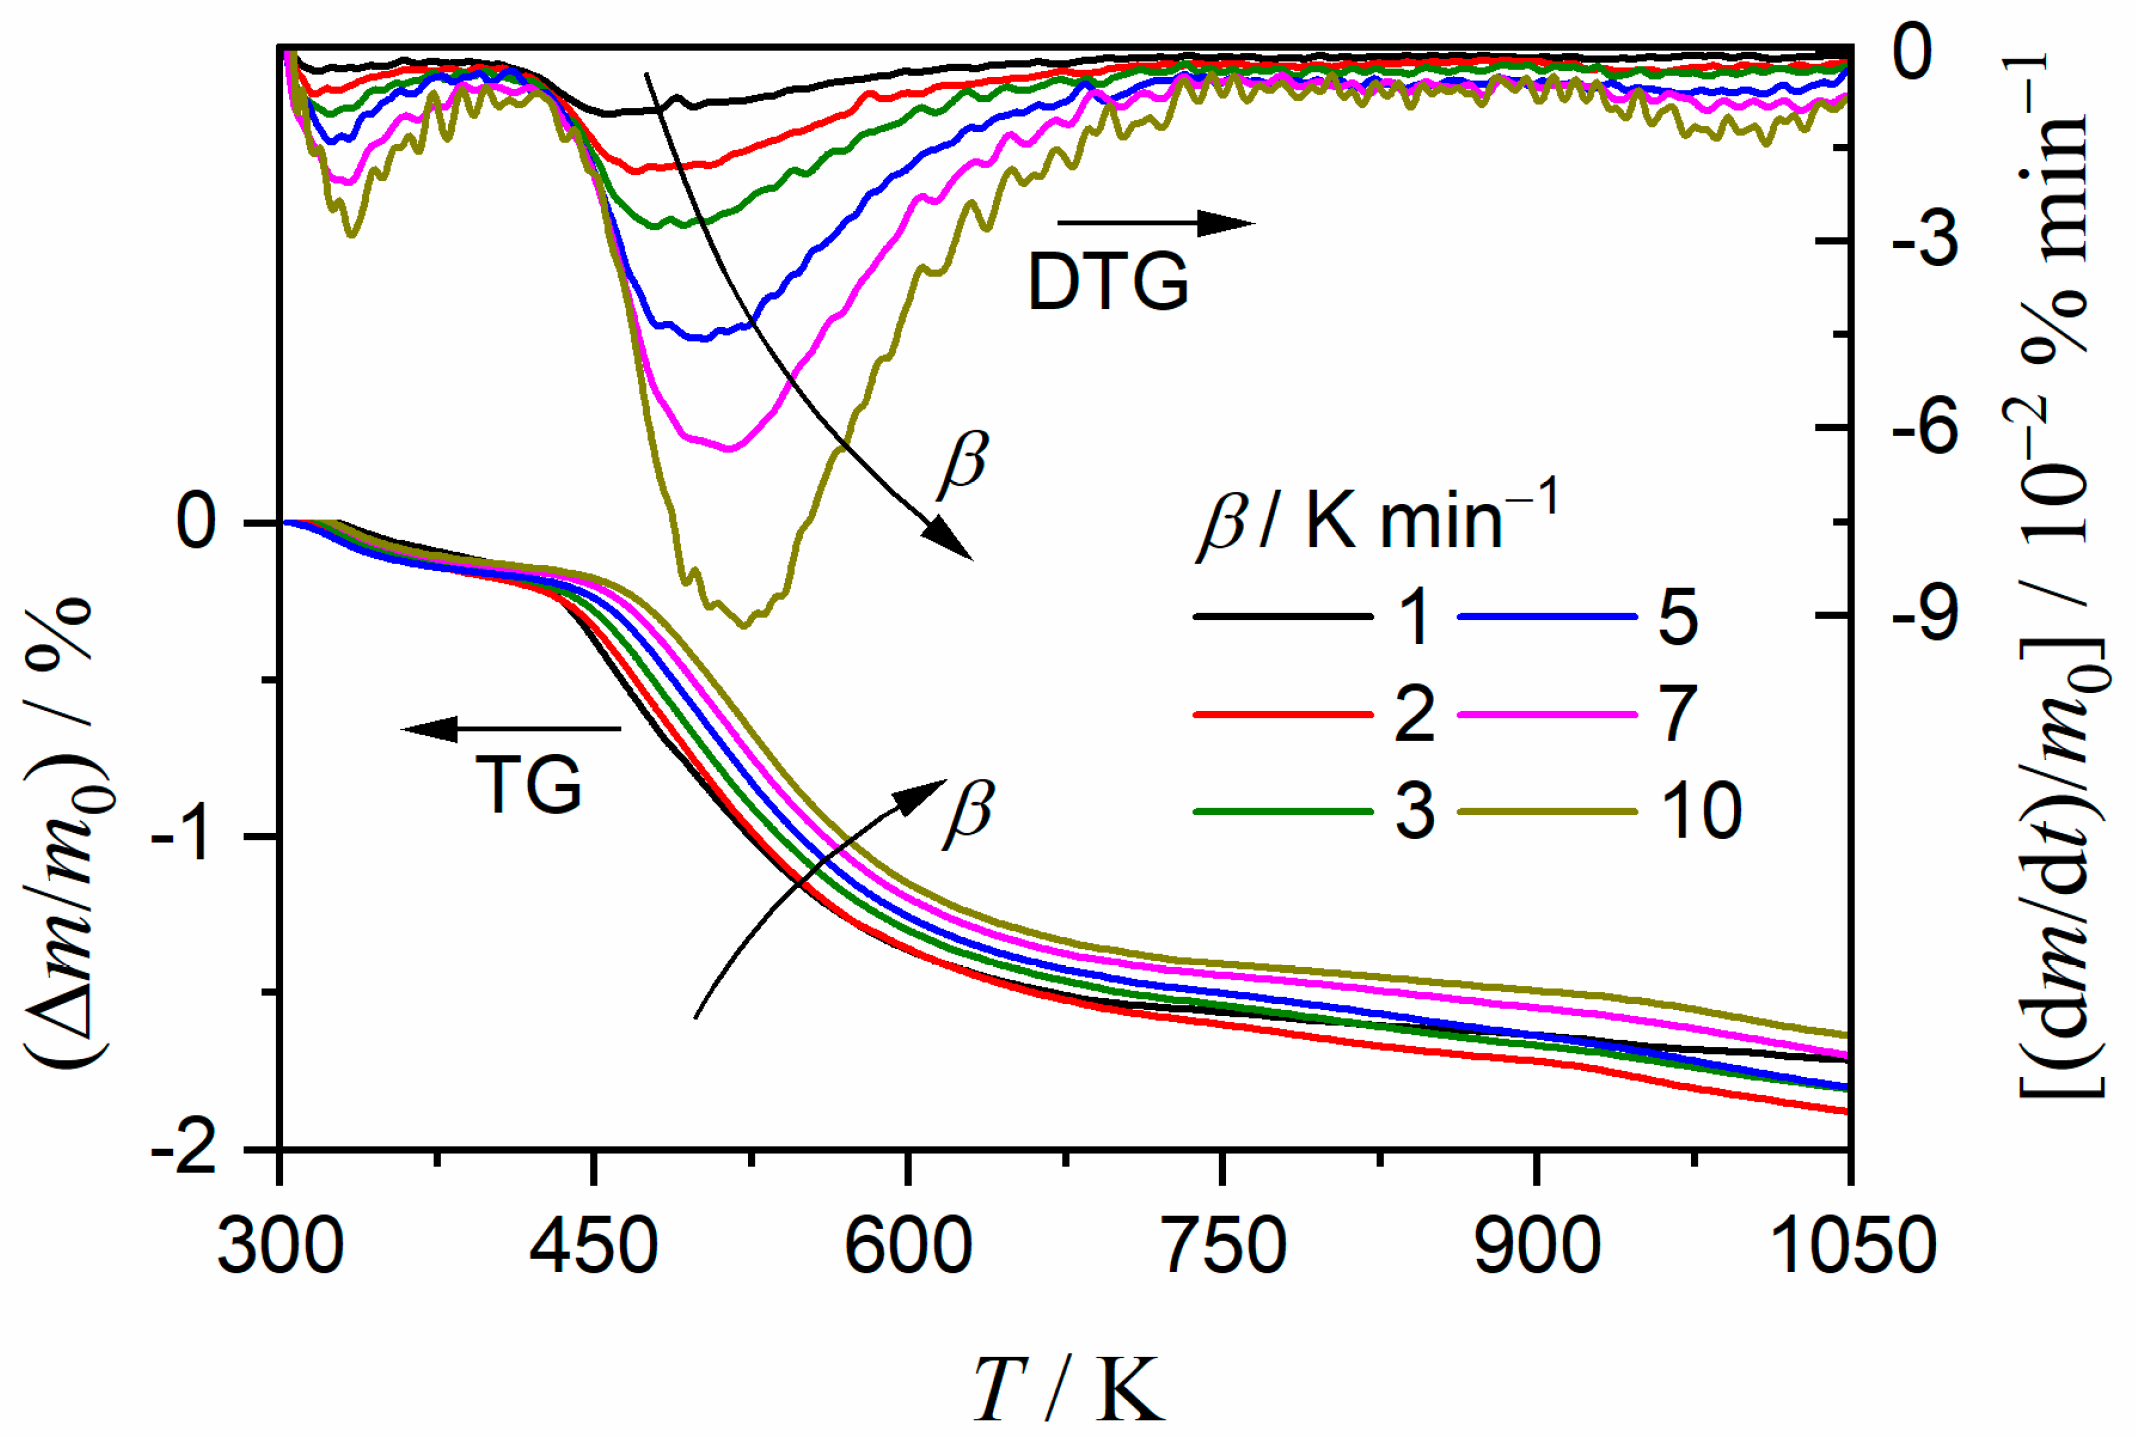
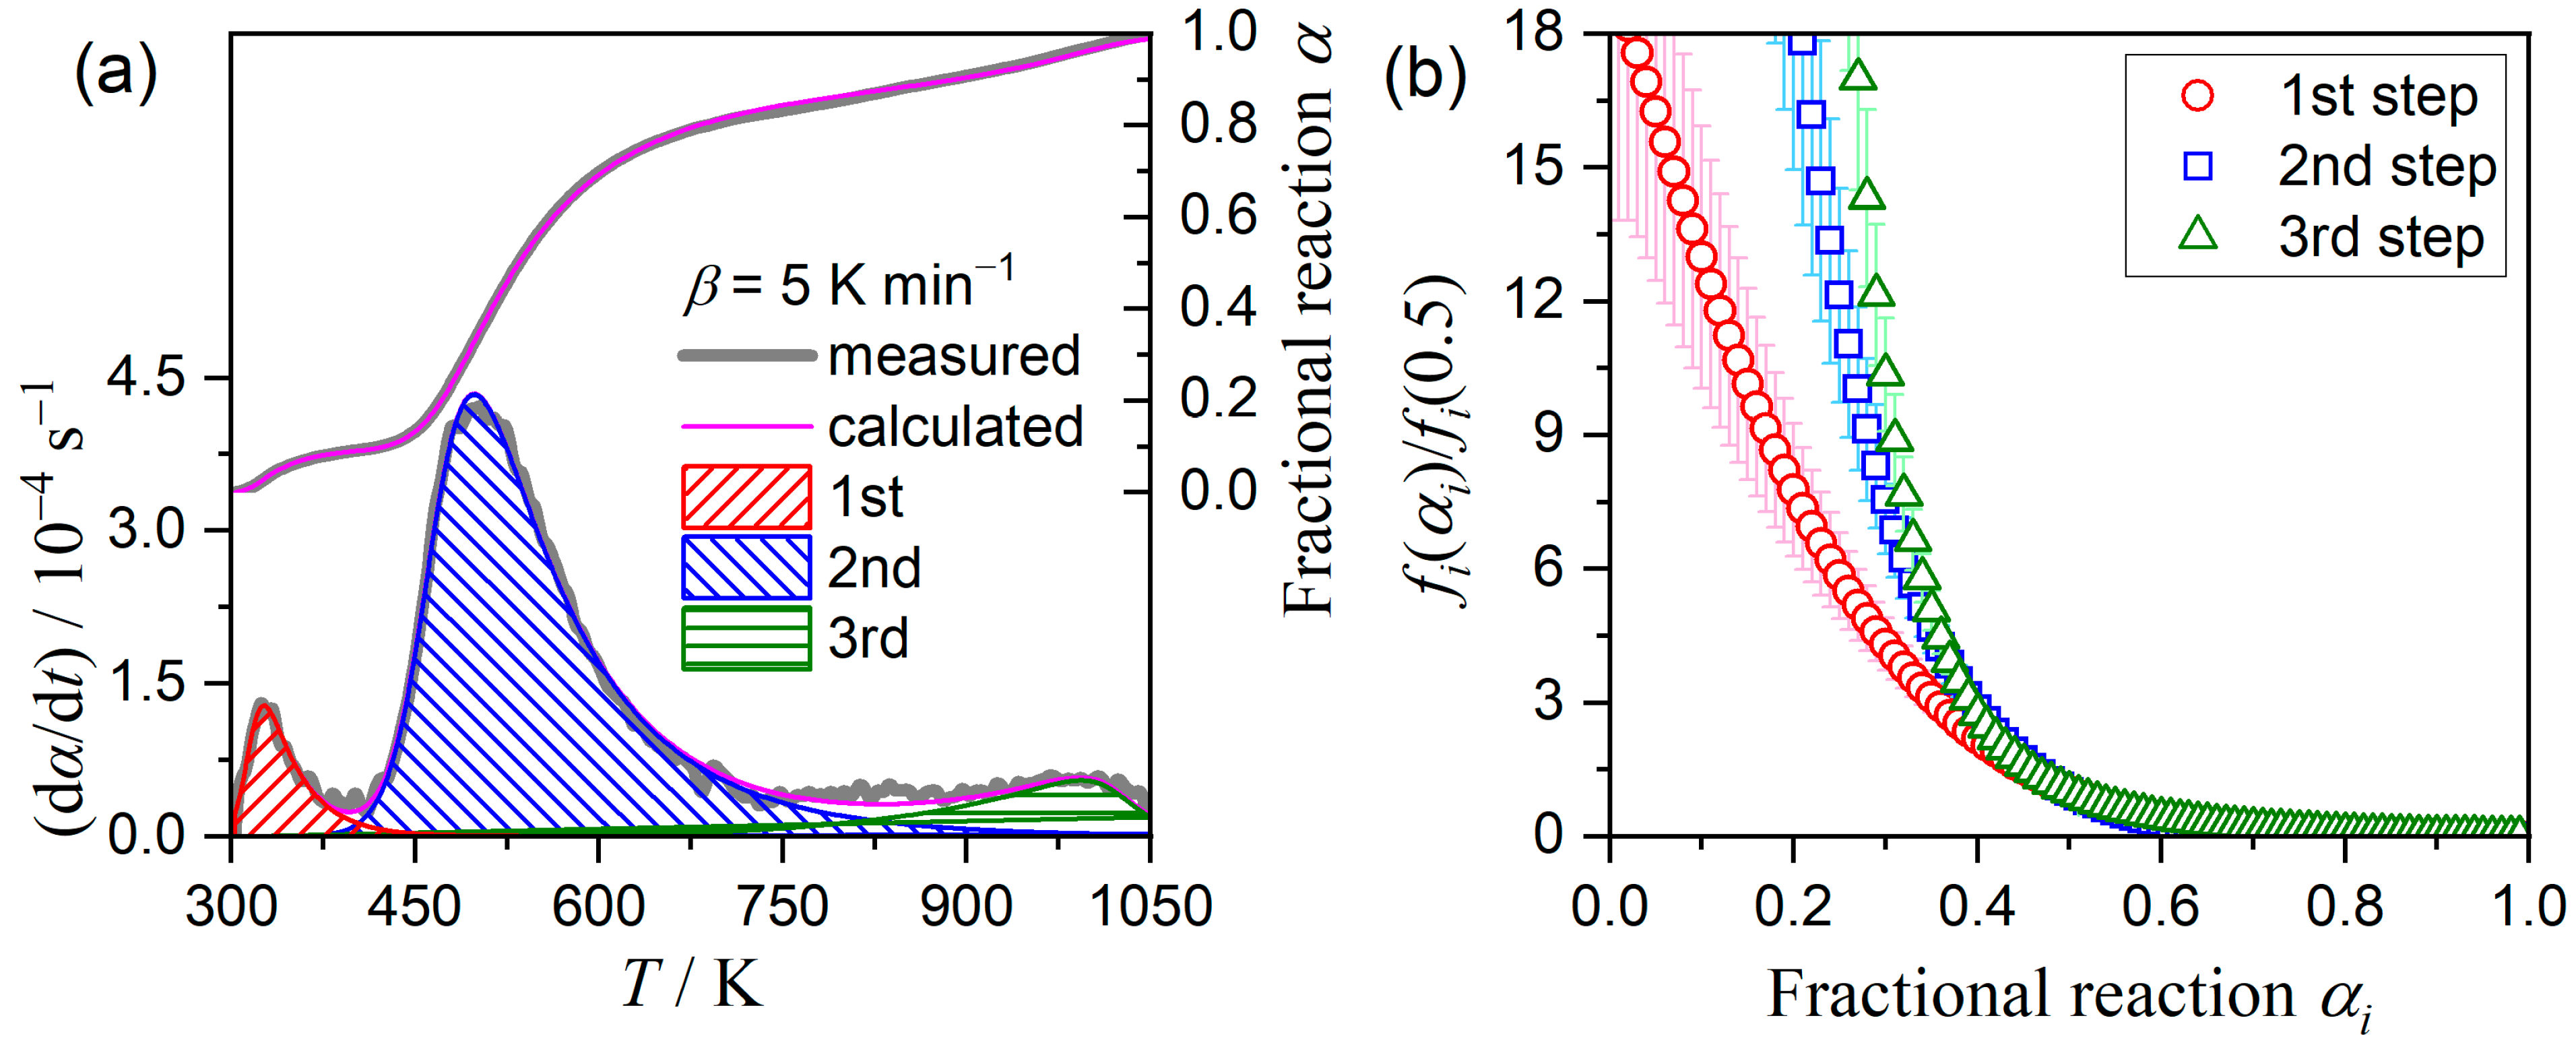
3.4. Kinetics of the Multistep Thermal Dehydration

Figure 8 shows TG–derivative TG (DTG) curves for thermal dehydration of the brown shell powder sample (m0 = 20.00 ± 0.04 mg) recorded at different β values in a stream of N2–CO2 mixed gas (20%-CO2, qv = 300 cm3 min−1). Three distinguishable DTG peaks appeared by partial overlapping. The first mass loss step initiated near room temperature and may be attributed to the dehydration of absorbed water. The major mass loss process in multistep dehydration, observed in the temperature range of 450–700 K (second mass loss step), is the process accompanied by detectable evolution of CO2 and likely originated from thermal degradation of the component polymeric materials. The third mass loss step was observed at temperatures higher than the A–C transformation and probably were due to the evaporation of water molecules trapped in the lamellar structure of aragonite crystals [8]. As a preliminary kinetic estimation, the overall process of thermal dehydration was subjected to formal kinetic analysis based on the isoconversional kinetic relationship (Figure S12). The TG–DTG curves were converted to kinetic curves by normalizing the mass loss value to the fractional reaction (α) with reference to the total mass loss value during the overall thermal dehydration process (Figure S12a). The Friedman plots applied to overall thermal dehydration exhibited variations in their slopes in three ranges of α, corresponding to each DTG peak (Figure S12b). The apparent activation energy (Ea) for thermal dehydration varied among three α ranges of α ≤ 0.15, 0.15 ≤ α ≤ 0.8, and 0.8 ≤ α (Figure S12c). Therefore, the feature of the DTG curves and apparent results of the Friedman plots supported the partially overlapping three-step reaction for thermal dehydration.
To separate the overlapping reaction steps, an empirical analysis of the DTG peak deconvolution using a statistical function (Fi(t)) was performed [25,26,27,28,79,80].
d m d t = i = 1 N F i t ,
where N is the total number of peaks, and i is the reaction step. After testing the mathematical deconvolution analysis (MDA) using available functions, the logistic power peak function (Equation (S4)) was selected as a suitable Fi(t) for multistep thermal dehydration. From the MDA results, the contributions (ci) of each reaction step were estimated from the area of the deconvoluted peaks, and the kinetic curves at different β values for each reaction step were obtained. The kinetic curves for each reaction step were formally analyzed using the Friedman plot and subsequent master plot method. The MDA results and subsequent formal kinetic analysis for each reaction step are detailed in the Supplementary Information (Figures S13–S17, Table S5).
When the multistep process comprised the kinetically independent reaction steps, the overall kinetics was expressed by a cumulative kinetic equation [24,25,26,27,28].
d α d t = i = 1 N c i A i e x p E a , i R T f i α i with i = 1 N c i = 1 and i = 1 N c i α i = α ,
where αi is the fractional reaction of each reaction’s step i. Based on the cumulative kinetic equation with SB(m, n, p) for fi(αi), the preliminary determined kinetic parameters via MDA and the subsequent formal kinetic analysis (Table S5) were optimized through nonlinear least-squares analysis to minimize the square sum (F) of the residue when fitting the overall experimental kinetic curve using the curve calculated according to Equation (9) [24,25,26,27,28].
F = j = 1 M d α d t e x p , j d α d t c a l , j 2 ,
where M is the total number of data points in an experimental kinetic curve. The kinetic calculation based on Equation (9) is called as KDA. Figure 9 shows the results of KDA for multistep thermal dehydration. Statistically significant fits were achieved as the partial overlapping of three reaction steps via KDA irrespective of the experimental kinetic curves at different β values (Figure 9a), and the optimized kinetic parameters for each reaction step did not change among the results for the different β values. Table 3 lists the optimized kinetic parameters for each reaction step, averaged over the values determined for different β values. Although the kinetic exponents in SB(m, n, p) exhibited unrealistic values that were not expected for the simple physico-geometrical reaction models, the kinetic features expressed by the optimized kinetic exponents were graphically interpreted as the diffusion-controlled-type processes with a contracting-geometry scheme irrespective of the reaction step because each process was characterized by the deceleration process with a concave shape in fi(αi)/fi(0.5) versus αi plots (Figure 9b).

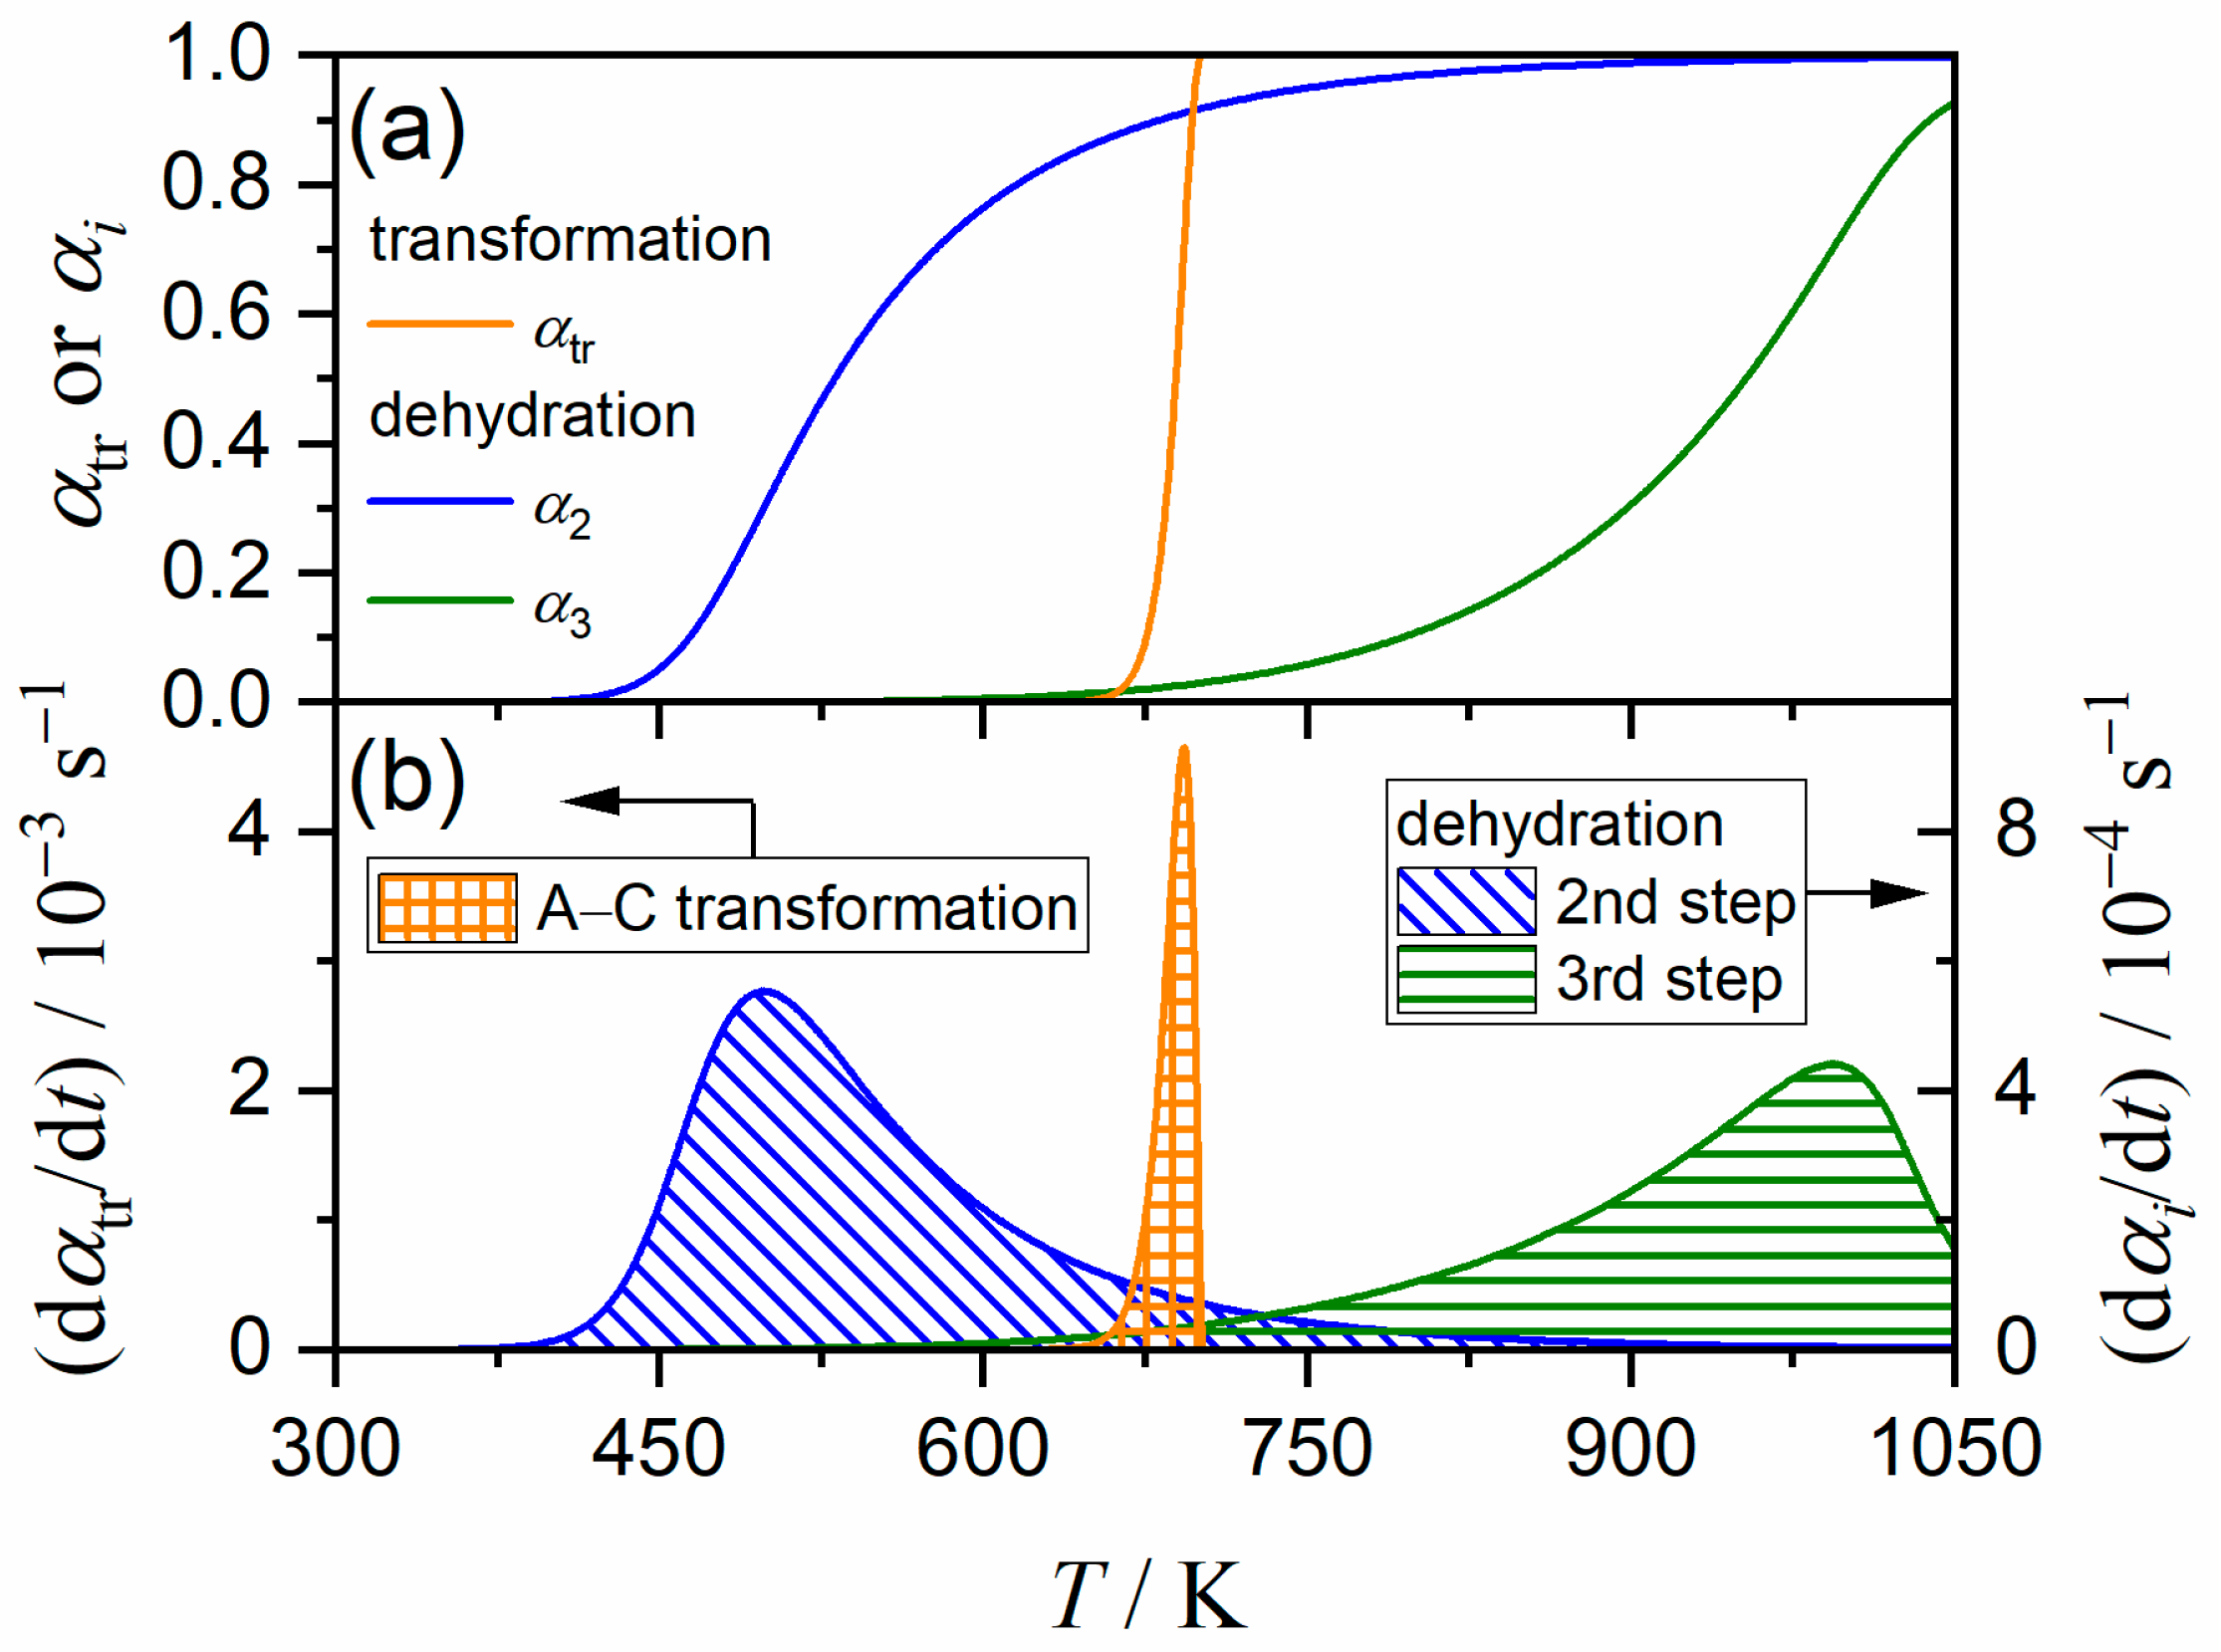
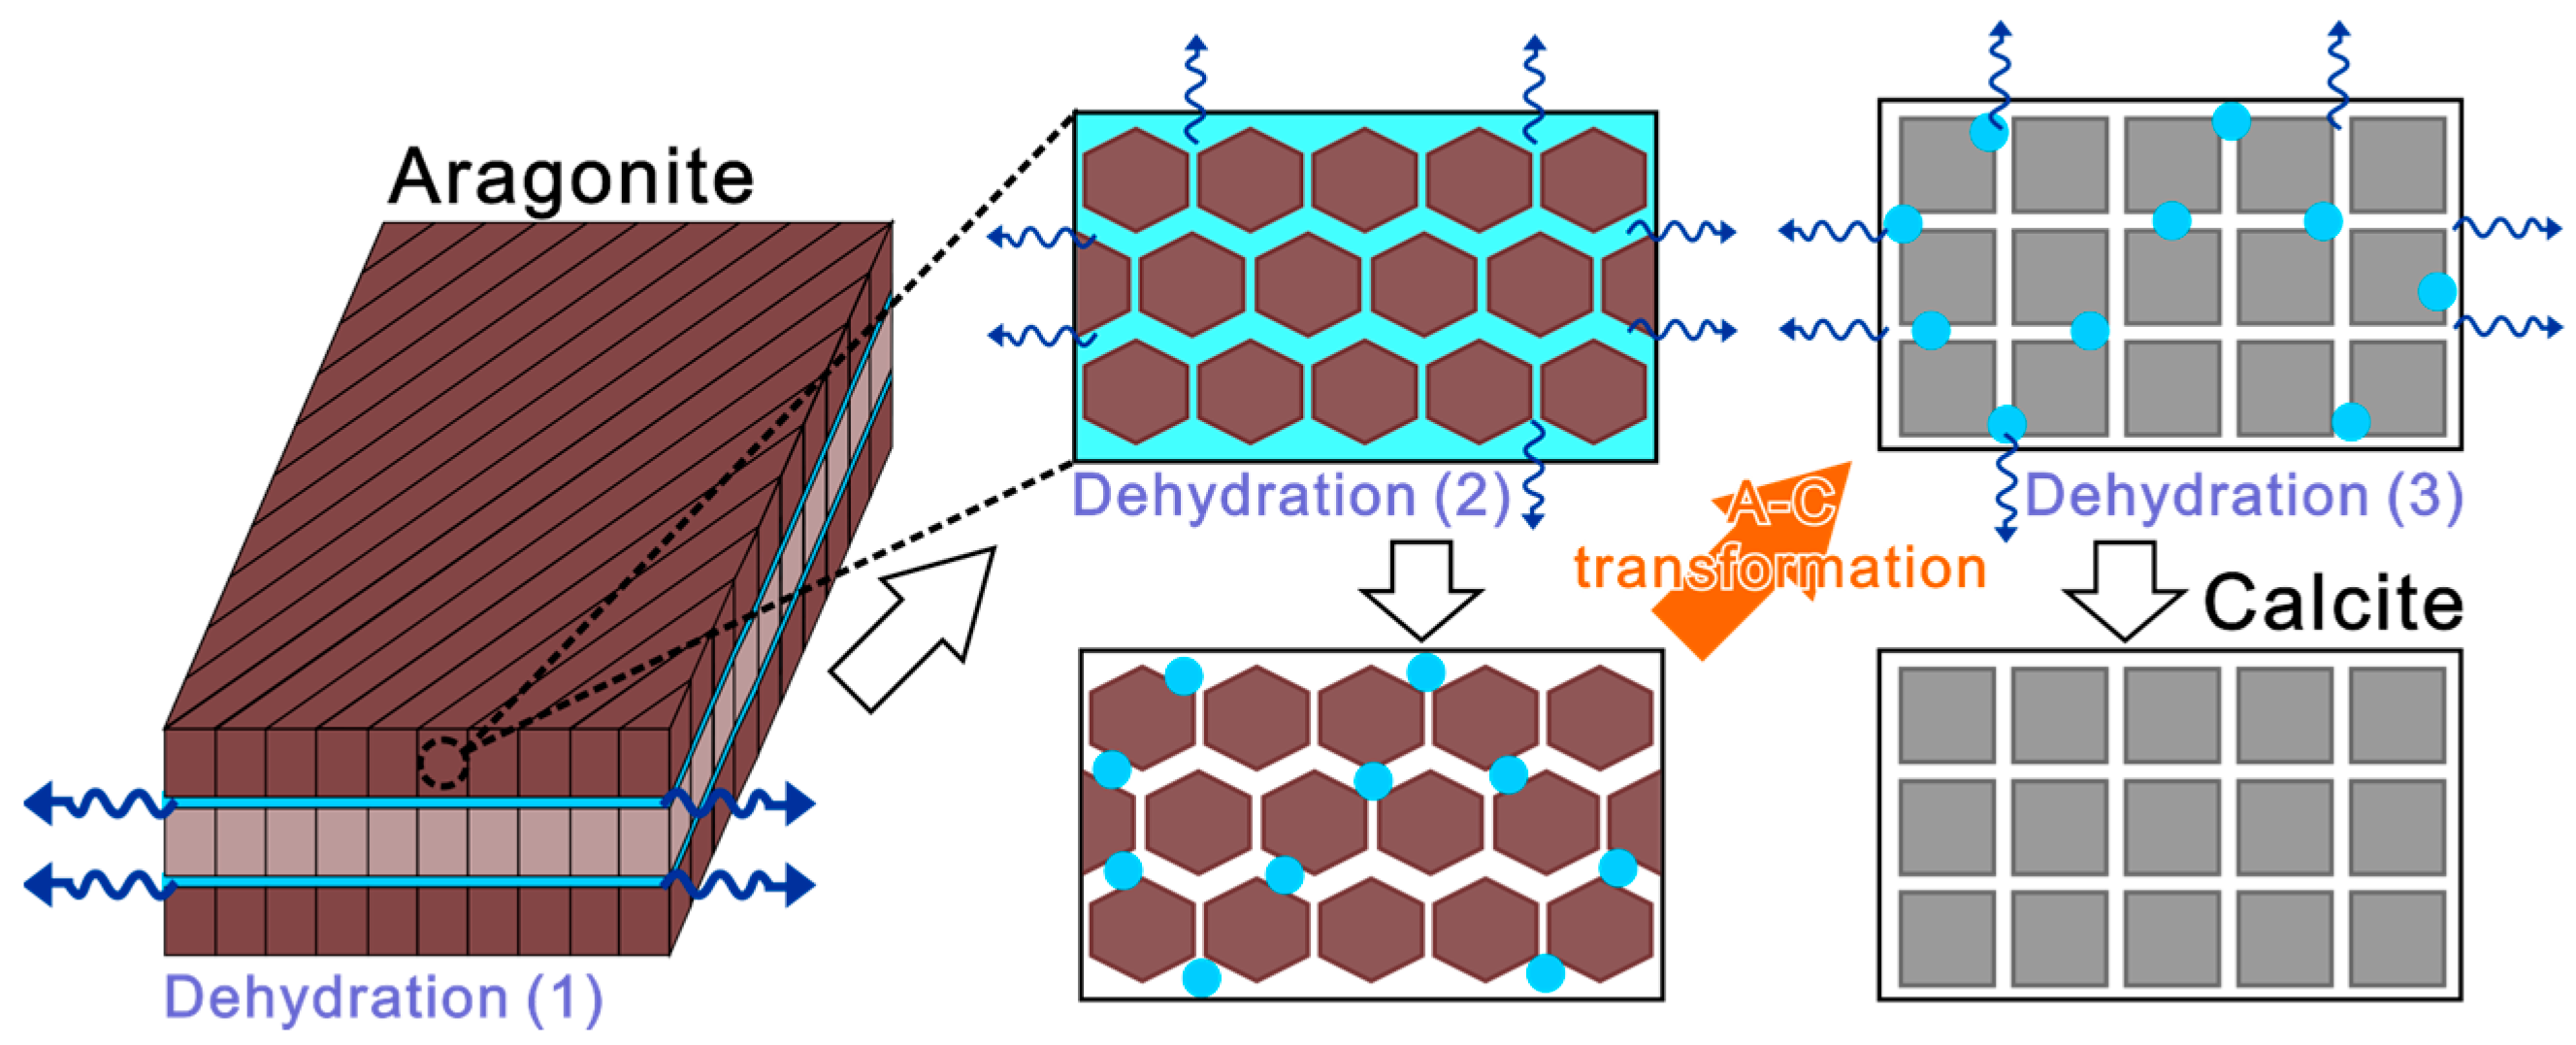
3.5. Kinetic Relationship between A–C Transformation and Multistep Thermal Dehydration

Figure 10 compares the kinetic curves the A–C transformation and the component reaction steps of thermal dehydration, simulated for the processes at a fixed β of 5 K min−1. The first dehydration step was positioned at a considerably lower temperature than the temperature region of A–C transformation, and the contribution was limited, i.e., c1 = 0.10. Therefore, a direct correlation between A–C transformation and the first dehydration step was not expected. A–C transformation occurred at the final stage of the second dehydration step and the initial stage of the third dehydration step. The relationships of the processes along the temperature coordinate empirically showed that the second dehydration step triggered A–C transformation, which resembles the crystallization of hydrated amorphous compounds, such as hydrated ZnO2 and TiO2 [81,82]. Conversely, A–C transformation triggered the third dehydration step, in which liberated water molecules accompanied by A–C transformation were removed through diffusion in the third dehydration step.
A simple physico-geometrical model of the interrelationship between A–C transformation and thermal dehydration in biomineralized aragonite was proposed, as shown in Figure 11. Stacks of aragonite plates were the common architecture of many biomineralized aragonites, in which the plate comprised aragonite crystals with lamellar structures and stacked with polymeric materials [18,19,20,21]. Multistep thermal dehydration initiated by the evaporation of absorbed water with c1 = 0.10. The second dehydration step was the major process in multistep thermal dehydration with c2 = 0.77, which is attributed to thermal degradation of polymeric materials positioned between aragonite crystals. Thermal degradation of polymeric materials can produce the space for the volume increase in aragonite crystals [10,11,12]. A–C transformation of the biomineralized aragonite occurred at a low temperature, compared with that of mineral aragonite [5,13,14]. The spaces produced by thermal degradation of polymeric materials can allow for a volume increase in the aragonite unit cell and A–C transformation. In addition, there are still water molecules trapped in the aragonite crystals, which is later released during the third dehydration step with c3 = 0.13. The possible increase in the internal pressure of aragonite crystal construction with increasing temperature due to the trapped water can be an alternative cause promoting A–C transformation. The water molecules trapped in the aragonite crystal construction were released by A–C transformation and removed via diffusion. All component thermal dehydration steps were constrained by the geometry of the aragonite constructions. Thus, it was expected that A–C transformation in biomineralized aragonite could not occur in a manner of random nucleation and growth across the bulk because the formation of the reactive sites for A–C transformation were geometrically constrained in a contacting-geometry scheme.

4. Conclusions

A–C transformation of biomineralized aragonite originated from a seawater spiral shell (Euplica scripta), occurring in a temperature range of 650–710 K when it was linearly heated. The temperature region of A–C transformation was covered by multistep thermal dehydration. The mutual relationship between A–C transformation and thermal dehydration was investigated by revealing the kinetic features of these two phenomena. The rate of A–C transformation exhibited significant temperature dependence; therefore, the process was analyzed as a kinetic process via formal kinetic calculation procedures based on the kinetic data obtained using high-temperature XRD under isothermal conditions at different temperatures and using FT-IR spectroscopy for a series of samples thermally treated under linear nonisothermal conditions at different β values. Under isothermal and linear nonisothermal conditions, the overall kinetic behavior of A–C transformation was described using a kinetic model of the contracting geometry type. The Ea,tr values were determined to be 271.7 ± 0.1 and 312.5 ± 9.1 kJ mol−1 under isothermal and linear nonisothermal conditions, respectively. Thermal dehydration was characterized as a partially overlapping three-step process under linear nonisothermal conditions. The first to third mass loss steps were interpreted as attributable to dehydration of absorbed water, degradation of the component polymeric materials, and release of trapped water in the aragonite crystal construction, respectively. All component reaction steps of multistep thermal dehydration exhibited diffusion controlled kinetic behaviors constrained by the contracting geometry with Ea values of 114.9 ± 1.6, 129.1 ± 1.0, and 339.1 ± 4.0 kJ mol−1 for the first to third mass loss steps, respectively. A–C transformation occurred in the reaction tail of the second thermal dehydration step and the initial stage of the third thermal dehydration step. The cause-and-effect relationship between A–C transformation and thermal dehydration was expected from similar geometrical constraints and described by a simple physico-geometrical model as follows. The second reaction step of thermal dehydration, characterized as a major dehydration process with the largest contribution to overall thermal dehydration and attributed to thermal degradation of the component polymeric materials, produced a space required for the expansion of the aragonite crystal lattice and subsequent A–C transformation. Conversely, the A–C transformation and subsequent crystal growth of calcite promoted the release of trapped water molecules, occurring during the third reaction step of thermal dehydration. Considered that a similar kinetic relationship between A–C transformation and thermal dehydration has been observed for different biomineralized aragonites, the mutually dependent phenomena should be considered a cause of the variation in the temperature region of A–C transformation among different aragonite materials.

Supplementary Materials

The following supporting information can be downloaded at: https://www.mdpi.com/article/10.3390/pr11061650/s1, S1. Sample characterization (Figures S1–S7; Table S1); S2. Thermal behavior (Figures S8 and S9); S3. Kinetics of A–C transformation (Figures S10 and S11; Tables S2–S4); S4. Kinetics of multistep thermal dehydration (Figures S12–S17; Table S5).

Author Contributions

Conceptualization, N.K.; methodology, N.K.; software, N.K.; validation, N.K.; formal analysis, T.T.; investigation, T.T.; writing—original draft preparation, T.T. and N.K.; writing—review and editing, T.T. and N.K.; visualization, T.T. and N.K.; supervision, N.K.; project administration, N.K.; funding acquisition, N.K. All authors have read and agreed to the published version of the manuscript.

Funding

This research was funded by JSPS KAKENHI, grant numbers 19K02708, 22H01011, and 22K02946.

Data Availability Statement

Data are available on request.

Conflicts of Interest

The authors declare no conflict of interest.

References

  1. Mann, S. Biomineralization: Principles and Concepts in Bioinorganic Materials Chemistry; Oxford University Press: Oxford, UK, 2001. [Google Scholar]
  2. Fujinuki, T.; Igarashi, T. On the water in the hexacollara. J. Jpn. Assoc. Mineral. Petrol. Econ. Geol. 1969, 62, 1–17. [Google Scholar] [CrossRef]
  3. Yoshioka, S.; Kitano, Y. Transformation of aragonite to calcite through heating. Geochem. J. 1985, 19, 245–249. [Google Scholar] [CrossRef]
  4. Baumer, A.; Ganteaume, M.; Bernat, M. Variations de la teneur en eau des coraux lors de la transformation aragonite → calcite. Thermochim. Acta 1993, 221, 255–262. [Google Scholar] [CrossRef]
  5. Passe-Coutrin, N.; N’Guyen, P.; Pelmard, R.; Ouensanga, A.; Bouchon, C. Water desorption and aragonite—Calcite phase transition in scleractinian corals skeletons. Thermochim. Acta 1995, 265, 135–140. [Google Scholar] [CrossRef]
  6. Ganteaume, M.; Baumer, A.; Lapraz, D.; Iacconi, P.; Bokilo, J.-E.; Bernat, M.; Zahra, C. La transformation aragonite-calcite dans les coraux fossiles. relation avec la thermoluminescence. Thermochim. Acta 1990, 170, 121–137. [Google Scholar] [CrossRef]
  7. Perić, J.; Vučak, M.; Krstulović, R.; Brečević, L.; Kralj, D. Phase transformation of calcium carbonate polymorphs. Thermochim. Acta 1996, 277, 175–186. [Google Scholar] [CrossRef]
  8. Koga, N.; Kasahara, D.; Kimura, T. Aragonite Crystal Growth and Solid-State Aragonite–Calcite Transformation: A Physico–Geometrical Relationship via Thermal Dehydration of Included Water. Cryst. Growth Des. 2013, 13, 2238–2246. [Google Scholar] [CrossRef]
  9. Dasgupta, D.R. The oriented transformation of aragonite into calcite. Mineral. Mag. J. Mineral. Soc. 1964, 33, 924–928. [Google Scholar] [CrossRef]
  10. Antao, S.M.; Hassan, I. Temperature dependence of the structural parameters in the transformation of aragonite to calcite, as determined from in situ synchrotron powder X-ray-diffraction data. Can. Mineral. 2010, 48, 1225–1236. [Google Scholar] [CrossRef]
  11. Kôzu, S.; Kani, K. Thermal expansion of aragonite and its atomic displacements by transformation into calcite between 450 °C and 490 °C in air, I. Proc. Imp. Acad. 1934, 10, 222–225. [Google Scholar] [CrossRef]
  12. Lucas, A.; Mouallem-Bahout, M.; Carel, C.; Gaudé, J.; Matecki, M. Thermal expansion of synthetic aragonite condensed review of elastic properties. J. Solid State Chem. 1999, 146, 73–78. [Google Scholar] [CrossRef]
  13. Parker, J.E.; Thompson, S.P.; Lennie, A.R.; Potter, J.; Tang, C.C. A study of the aragonite-calcite transformation using Raman spectroscopy, synchrotron powder diffraction and scanning electron microscopy. CrystEngComm 2010, 12, 1590–1599. [Google Scholar] [CrossRef]
  14. Irigaray, J.L.; Oudadesse, H.; El Fadl, H.; Sauvage, T.; Thomas, G.; Vernay, A.M. Effet de la temperature sur la structure cristalline d’un biocorail. J. Therm. Anal. 1993, 39, 3–14. [Google Scholar] [CrossRef]
  15. Zolotoyabko, E.; Pokroy, B. Biomineralization of calcium carbonate: Structural aspects. CrystEngComm 2007, 9, 1156–1161. [Google Scholar] [CrossRef]
  16. Pokroy, B.; Fitch, A.N.; Lee, P.L.; Quintana, J.P.; Caspi, E.N.; Zolotoyabko, E. Anisotropic lattice distortions in the mollusk-made aragonite: A widespread phenomenon. J. Struct. Biol. 2006, 153, 145–150. [Google Scholar] [CrossRef] [PubMed]
  17. Pokroy, B.; Quintana, J.P.; Caspi, E.N.; Berner, A.; Zolotoyabko, E. Anisotropic lattice distortions in biogenic aragonite. Nat. Mater. 2004, 3, 900–902. [Google Scholar] [CrossRef] [PubMed]
  18. Kamat, S.; Su, X.; Ballarini, R.; Heuer, A.H. Structural basis for the fracture toughness of the shell of the conch Strombus gigas. Nature 2000, 405, 1036–1040. [Google Scholar] [CrossRef]
  19. Ji, H.-M.; Jiang, Y.; Yang, W.; Zhang, G.-P.; Li, X.-W. Biological self-arrangement of fiber like aragonite and its effect on mechanical behavior of Veined rapa whelk shell. J. Am. Ceram. Soc. 2015, 98, 3319–3325. [Google Scholar] [CrossRef]
  20. Pokroy, B.; Zolotoyabko, E. Microstructure of natural plywood-like ceramics: A study by high-resolution electron microscopy and energy-variable X-ray diffraction. J. Mater. Chem. 2003, 13, 682–688. [Google Scholar] [CrossRef]
  21. Pavat, C.; Zanella-Cléon, I.; Becchi, M.; Medakovic, D.; Luquet, G.; Guichard, N.; Alcaraz, G.; Dommergues, J.L.; Serpentini, A.; Lebel, J.M.; et al. The shell matrix of the pulmonate land snail Helix aspersa maxima. Comp. Biochem. Physiol. Part B Biochem. Mol. Biol. 2012, 161, 303–314. [Google Scholar] [CrossRef]
  22. Koga, N.; Nishikawa, K. Mutual relationship between solid-state aragonite–calcite transformation and thermal dehydration of included water in coral aragonite. Cryst. Growth Des. 2014, 14, 879–887. [Google Scholar] [CrossRef]
  23. Tone, T.; Koga, N. Thermally induced aragonite-calcite transformation in freshwater pearl: A mutual relation with the thermal dehydration of included water. ACS Omega 2021, 6, 13904–13914. [Google Scholar] [CrossRef] [PubMed]
  24. Sánchez-Jiménez, P.E.; Perejón, A.; Criado, J.M.; Diánez, M.J.; Pérez-Maqueda, L.A. Kinetic model for thermal dehydrochlorination of poly(vinyl chloride). Polymer 2010, 51, 3998–4007. [Google Scholar] [CrossRef]
  25. Koga, N.; Goshi, Y.; Yamada, S.; Pérez-Maqueda, L.A. Kinetic approach to partially overlapped thermal decomposition processes. J. Therm. Anal. Calorim. 2013, 111, 1463–1474. [Google Scholar] [CrossRef]
  26. Koga, N. Physico-Geometric Approach to the Kinetics of Overlapping Solid-State Reactions. In Handbook of Thermal Analysis and Calorimetry, 2nd ed.; Vyazovkin, S., Koga, N., Schick, C., Eds.; Elsevier: Amsterdam, The Netherlands, 2018; Volume 6, pp. 213–251. [Google Scholar]
  27. Vyazovkin, S.; Burnham, A.K.; Favergeon, L.; Koga, N.; Moukhina, E.; Perez-Maqueda, L.A.; Sbirrazzuoli, N. ICTAC Kinetics Committee recommendations for analysis of multi-step kinetics. Thermochim. Acta 2020, 689, 178597. [Google Scholar] [CrossRef]
  28. Koga, N.; Vyazovkin, S.; Burnham, A.K.; Favergeon, L.; Muravyev, N.V.; Pérez-Maqueda, L.A.; Saggese, C.; Sánchez-Jiménez, P.E. ICTAC Kinetics Committee recommendations for analysis of thermal decomposition kinetics. Thermochim. Acta 2023, 719, 179384. [Google Scholar] [CrossRef]
  29. Sugiyama, S.; Takasaki, M.; Oaki, Y.; Imai, H. Strained calcite crystals from amorphous calcium carbonate containing an organic molecule. CrystEngComm 2020, 22, 7054–7058. [Google Scholar] [CrossRef]
  30. Zhou, L.; Wang, G.; Du, J.; Zhao, Q.; Pei, X. 1,1′-Ferrocenedicarboxylic acid/tetrahydrofuran induced precipitation of calcium carbonate with a multi-level structure in water. CrystEngComm 2021, 23, 7206–7211. [Google Scholar] [CrossRef]
  31. Nagai, Y.; Oaki, Y.; Imai, H. Artificial mineral films similar to biogenic calcareous shells: Oriented calcite nanorods on a self-standing polymer sheet. CrystEngComm 2018, 20, 1656–1661. [Google Scholar] [CrossRef]
  32. Buljan Meić, I.; Kontrec, J.; Domazet Jurašin, D.; Njegić Džakula, B.; Štajner, L.; Lyons, D.M.; Dutour Sikirić, M.; Kralj, D. Comparative study of calcium carbonates and calcium phosphates precipitation in model systems mimicking the inorganic environment for biomineralization. Cryst. Growth Des. 2017, 17, 1103–1117. [Google Scholar] [CrossRef]
  33. Morse, J.W.; Arvidson, R.S.; Luttge, A. Calcium carbonate formation and dissolution. Chem. Rev. 2007, 107, 342–381. [Google Scholar] [CrossRef] [PubMed]
  34. Meldrum, F.C.; Colfen, H. Controlling mineral morphologies and structures in biological and synthetic systems. Chem. Rev. 2008, 108, 4332–4432. [Google Scholar] [CrossRef] [PubMed]
  35. Sommerdijk, N.A.; de With, G. Biomimetic CaCO3 mineralization using designer molecules and interfaces. Chem. Rev. 2008, 108, 4499–4550. [Google Scholar] [CrossRef] [PubMed]
  36. Sugiura, M.; Yasumoto, K.; Iijima, M.; Oaki, Y.; Imai, H. Morphological study of fibrous aragonite in the skeletal framework of a stony coral. CrystEngComm 2021, 23, 3693–3700. [Google Scholar] [CrossRef]
  37. Nakajima, K.; Suzuki, M.; Nagai, Y.; Izumida, K.; Oaki, Y.; Toyofuku, T.; Bijma, J.; Nehrke, G.; Raitzsch, M.; Tani, K.; et al. Hierarchical textures on aragonitic shells of the hyaline radial foraminifer Hoeglundina elegans. CrystEngComm 2017, 19, 7191–7196. [Google Scholar] [CrossRef]
  38. Feng, X.; Zhang, G. New insights into the spatial confinement mechanism of nucleation of biogenic aragonite crystals from bivalve nacre. CrystEngComm 2020, 22, 6596–6602. [Google Scholar] [CrossRef]
  39. De Villie, J.P.R. Crystal structures of aragonite, strontianite, and witherite. Am. Mineral. 1971, 56, 758–767. [Google Scholar]
  40. Caspi, E.N.; Pokroy, B.; Lee, P.L.; Quintana, J.P.; Zolotoyabko, E. On the structure of aragonite. Acta Crystallogr. B 2005, 61, 129–132. [Google Scholar] [CrossRef]
  41. Markgraf, S.A.; Reeder, R.J. High-temperature structure refinements of calcite and magnesite. Am. Mineral. 1985, 70, 590–600. [Google Scholar]
  42. Andersen, F.; Brecevic, L. Infrared spectra of amorphous and crystalline calcium carbonates. Acta Chem. Scand. 1991, 45, 1018–1024. [Google Scholar] [CrossRef]
  43. Vagenas, N.V.; Gatsouli, A.; Kontoyannis, C.G. Quantitative analysis of synthetic calcium carbonate polymorphs using FT-IR spectroscopy. Talanta 2003, 59, 831–836. [Google Scholar] [CrossRef] [PubMed]
  44. De Lorenzi Pezzolo, A. The shell seeker: What is the quantity of shell in the Lido di Venezia Sand? A calibration DRIFTS experiment. J. Chem. Educ. 2011, 88, 1298–1303. [Google Scholar] [CrossRef]
  45. Loftus, E.; Rogers, K.; Lee-Thorp, J. A simple method to establish calcite:aragonite ratios in archaeological mollusc shells. J. Quat. Sci. 2015, 30, 731–735. [Google Scholar] [CrossRef]
  46. De Lorenzi Pezzolo, A. An exercise on calibration: DRIFTS study of binary mixtures of calcite and dolomite with partially overlapping spectral features. J. Chem. Educ. 2013, 90, 118–122. [Google Scholar] [CrossRef]
  47. Toffolo, M.; Regev, L.; Dubernet, S.; Lefrais, Y.; Boaretto, E. FTIR-based crystallinity assessment of aragonite–calcite mixtures in archaeological lime binders altered by diagenesis. Minerals 2019, 9, 121. [Google Scholar] [CrossRef]
  48. Compere, E.L.; Bates, J.M. Determination of calcite: Aragonite ratios in mollusc shells by infrared spectra. Limnol. Oceanogr. 1973, 18, 326–331. [Google Scholar] [CrossRef]
  49. Xyla, A.G.; Koutsoukos, P.G. Quantitative analysis of calcium carbonate polymorphs by infrared spectroscopy. J. Chem. Soc. Faraday Trans. 1 1989, 85, 3165–3172. [Google Scholar] [CrossRef]
  50. Tsuboi, Y.; Koga, N. Thermal decomposition of biomineralized calcium carbonate: Correlation between the thermal behavior and structural characteristics of avian eggshell. ACS Sustain. Chem. Eng. 2018, 6, 5283–5295. [Google Scholar] [CrossRef]
  51. Koga, N.; Šesták, J.; Simon, P. Some fundamental and historical aspects of phenomenological kinetics in the solid state studied by thermal analysis. In Thermal Analysis of Micro, Nano- and Non-Crystalline Materials; Šesták, J., Simon, P., Eds.; Springer: Dordrecht, The Netherlands, 2013; pp. 1–28. [Google Scholar]
  52. Coats, A.W.; Redfern, J.P. Kinetic parameters from thermogravimetric data. Nature 1964, 201, 68–69. [Google Scholar] [CrossRef]
  53. Tanaka, H.; Koga, N. Kinetics of the thermal decompositions of MC2O4 to MCO3 (M = Ca, Sr and Ba). J. Therm. Anal. 1987, 32, 1521–1529. [Google Scholar] [CrossRef]
  54. Koga, N.; Tanaka, H. Kinetics of Thermal Decomposition of MCO3 to MO (M = Ca, Sr and Ba). J. Therm. Anal. 1988, 34, 177–188. [Google Scholar] [CrossRef]
  55. Tanaka, H.; Koga, N. Kinetics of the thermal dehydration of potassium copper(II) chloride dihydrate. J. Phys. Chem. 1988, 92, 7023–7029. [Google Scholar] [CrossRef]
  56. Koga, N.; Tanaka, H. Kinetics and mechanisms of the thermal dehydration of Li2SO4·H2O. J. Phys. Chem. 1989, 93, 7793–7798. [Google Scholar] [CrossRef]
  57. Criado, J.M.; Gonzalez, M. The method of calculation of kinetic parameters as a possible cause of apparent compensation effects. Thermochim. Acta 1981, 46, 201–207. [Google Scholar] [CrossRef]
  58. Koga, N.; Šesták, J.; Málek, J. Distortion of the Arrhenius Parameters by the Inappropriate Kinetic-Model Function. Thermochim. Acta 1991, 188, 333–336. [Google Scholar] [CrossRef]
  59. Koga, N.; Tanaka, H. A Kinetic compensation effect established for the thermal decomposition of a solid. J. Therm. Anal. 1991, 37, 347–363. [Google Scholar] [CrossRef]
  60. Koga, N.; Šesták, J. Kinetic compensation effect as a mathematical consequence of the exponential rate constant. Thermochim. Acta 1991, 182, 201–208. [Google Scholar] [CrossRef]
  61. Koga, N.; Šesták, J. Further aspects of the kinetic compensation effect. J. Therm. Anal. 1991, 37, 1103–1108. [Google Scholar] [CrossRef]
  62. Koga, N. A review of the mutual dependence of Arrhenius parameters evaluated by the thermoanalytical study of solid-state reactions: The kinetic compensation effect. Thermochim. Acta 1994, 244, 1–20. [Google Scholar] [CrossRef]
  63. Galwey, A.K.; Mortimer, M. Compensation effects and compensation defects in kinetic and mechanistic interpretations of heterogeneous chemical reactions. Int. J. Chem. Kinet. 2006, 38, 464–473. [Google Scholar] [CrossRef]
  64. Barrie, P.J. The mathematical origins of the kinetic compensation effect: 1. The effect of random experimental errors. Phys. Chem. Chem. Phys. 2012, 14, 318–326. [Google Scholar] [CrossRef]
  65. Barrie, P.J. The mathematical origins of the kinetic compensation effect: 2. The effect of systematic errors. Phys. Chem. Chem. Phys. 2012, 14, 327–336. [Google Scholar] [CrossRef]
  66. Xu, D.; Chai, M.; Dong, Z.; Rahman, M.M.; Yu, X.; Cai, J. Kinetic compensation effect in logistic distributed activation energy model for lignocellulosic biomass pyrolysis. Bioresour. Technol. 2018, 265, 139–145. [Google Scholar] [CrossRef]
  67. Friedman, H.L. Kinetics of thermal degradation of char-forming plastics from thermogravimetry. Application to a phenolic plastic. J. Polym. Sci. Part C 1964, 6, 183–195. [Google Scholar] [CrossRef]
  68. Ozawa, T. Kinetic analysis of derivative curves in thermal analysis. J. Therm. Anal. 1970, 2, 301–324. [Google Scholar] [CrossRef]
  69. Ozawa, T. Applicability of Friedman plot. J. Therm. Anal. 1986, 31, 547–551. [Google Scholar] [CrossRef]
  70. Málek, J. The kinetic analysis of non-isothermal data. Thermochim. Acta 1992, 200, 257–269. [Google Scholar] [CrossRef]
  71. Koga, N. Kinetic analysis of thermoanalytical data by extrapolating to infinite temperature. Thermochim. Acta 1995, 258, 145–159. [Google Scholar] [CrossRef]
  72. Gotor, F.J.; Criado, J.M.; Málek, J.; Koga, N. Kinetic analysis of solid-state reactions: The universality of master plots for analyzing isothermal and nonisothermal experiments. J. Phys. Chem. A 2000, 104, 10777–10782. [Google Scholar] [CrossRef]
  73. Criado, J.M.; Pérez-Maqueda, L.A.; Gotor, F.J.; Málek, J.; Koga, N. A unified theory for the kinetic analysis of solid state reactions under any thermal pathway. J. Therm. Anal. Calorim. 2003, 72, 901–906. [Google Scholar] [CrossRef]
  74. Ozawa, T. A new method of analyzing thermogravimetric data. Bull. Chem. Soc. Jpn. 1965, 38, 1881–1886. [Google Scholar] [CrossRef]
  75. Ozawa, T. Non-isothermal kinetics and generalized time. Thermochim. Acta 1986, 100, 109–118. [Google Scholar] [CrossRef]
  76. Šesták, J.; Berggren, G. Study of the kinetics of the mechanism of solid-state reactions at increasing temperatures. Thermochim. Acta 1971, 3, 1–12. [Google Scholar] [CrossRef]
  77. Šesták, J. Diagnostic limits of phenomenological kinetic models introducing the accommodation function. J. Therm. Anal. 1990, 36, 1997–2007. [Google Scholar] [CrossRef]
  78. Šesták, J. Rationale and fallacy of thermoanalytical kinetic patterns. J. Therm. Anal. Calorim. 2011, 110, 5–16. [Google Scholar] [CrossRef]
  79. Perejón, A.; Sánchez-Jiménez, P.E.; Criado, J.M.; Pérez-Maqueda, L.A. Kinetic analysis of complex solid-state reactions. A new deconvolution procedure. J. Phys. Chem. B 2011, 115, 1780–1791. [Google Scholar] [CrossRef] [PubMed]
  80. Svoboda, R.; Málek, J. Applicability of Fraser–Suzuki function in kinetic analysis of complex crystallization processes. J. Therm. Anal. Calorim. 2013, 111, 1045–1056. [Google Scholar] [CrossRef]
  81. Tatsuoka, T.; Koga, N. Effect of atmospheric water vapor on the thermally induced crystallization in zirconia gel. J. Am. Ceram. Soc. 2012, 95, 557–564. [Google Scholar] [CrossRef]
  82. Mansour, S.A. Non-isothermal crystallization kinetics of nano-sized amorphous TiO2 prepared by facile sonochemical hydrolysis route. Ceram. Int. 2019, 45, 2893–2898. [Google Scholar] [CrossRef]
Figure 1. TG/DTA–MS results for the shell powder samples (m0 = 10.01 ± 0.04 mg) with different color groups recorded at a β of 5 K min−1 in a stream of He gas (qv = 200 cm3 min−1): (a) TG–DTA curves and MS thermograms for m/z = 18 (H2O+) and m/z = 44 (CO2+) of the brown shell powder sample; (b) comparison of TG–derivative TG (DTG) curves in the temperature range of water vapor evolution among the different shell powder samples; and (c) comparison of MS thermograms for m/z = 18 and 44 among different shell powder samples.
Processes 11 01650 g001
Figure 2. Changes in the XRD patterns of the sample with the duration of the isothermal heat treatments at different temperatures in a stream of dry N2 gas (qv = 100 cm3 min−1): (a) 643; (b) 653; (c) 663; and (d) 673 K.
Processes 11 01650 g002
Figure 3. Plots of αtr versus time for A–C transformation under isothermal conditions at different temperatures. The symbols and lines are experimentally determined data points and overall kinetic curves simulated using the results of the kinetic analysis, respectively.
Processes 11 01650 g003
Figure 4. Kinetic analysis of A–C transformation under isothermal conditions: (a) g(αtr) versus t plots using F(1); (b) g(αtr) versus t plots using R(3); and (c) Arrhenius plots.
Processes 11 01650 g004
Figure 5. FT-IR spectra of the brown shell powder sample preheated to different temperatures in the TG–DTA instrument at different β values in a stream of N2–CO2 mixed gas (20%-CO2).
Processes 11 01650 g005
Figure 6. Plots of αtr versus temperature for A–C transformation under linear nonisothermal conditions at different β values. The symbols and lines are experimentally determined data points and overall kinetic curves simulated using the results of kinetic analysis, respectively.
Processes 11 01650 g006
Figure 7. Kinetic analysis of the simulated kinetic data for A–C transformation under isothermal and linear nonisothermal conditions: (a) Friedman plots at αtr = 0.5; (b) Ea,tr values at different αtr values; and (c) experimental master plots of (dαtr/dθtr) versus αtr.
Processes 11 01650 g007
Figure 8. TG–DTG curves for thermal dehydration of the brown shell powder sample (m0 = 20.00 ± 0.04 mg), recorded at different β values in a stream of N2–CO2 mixed gas (20%-CO2, qv = 300 cm3 min−1).
Processes 11 01650 g008
Figure 9. KDA results for multistep thermal dehydration: (a) a typical result of curve fitting; and (b) fi(αi)/fi(0.5) versus αi plots for each reaction step.
Processes 11 01650 g009
Figure 10. Relationship of the kinetic curves between A–C transformation and multistep thermal dehydration, simulated for the processes at a fixed β of 5 K min−1 using the kinetic parameters determined in this study: (a) αtr and αi versus T and (b) (dαtr/dt) and (dαi/dt) versus T.
Processes 11 01650 g010
Figure 11. A model of the interrelationship of the A–C transformation and the multistep thermal dehydration.
Processes 11 01650 g011
Table 1. The Arrhenius parameters for the A–C transformation under isothermal conditions.
g(αtr)Ea,tr/kJ mol−1ln(Atr/s−1)γ a
F(1)281.1 ± 6.642.7 ± 1.30.9994
R(3)271.7 ± 6.939.6 ± 1.30.9993
a Correlation coefficient of the linear regression analysis of the Arrhenius plot.
Table 2. Kinetic parameters for the A–C transformation under isothermal and linear nonisothermal conditions.
Heating ConditionEa,tr
/kJ mol−1
Atr/s−1f(αtr)R2, a
Isothermal271.7 ± 0.1(1.63 ± 0.01) × 1017R(2.99 ± 0.01)>0.9999
Nonisothermal312.5 ± 9.1(4.24 ± 0.01) × 1021SB(0.06 ± 0.01, 0.70 ± 0.01, 0.33 ± 0.01)>0.9999
a Determination coefficient of the nonlinear least-squares analysis for fitting the experimental master plot using f(αtr).
Table 3. Optimized kinetic parameters for multistep thermal dehydration (determination coefficient R2 = 0.9968 ± 0.0017).
iciEa,i/kJ mol−1Ai/s−1 f i α i = α i m i 1 α i n i l n 1 α i p i
minipi
10.10 ± 0.01114.9 ± 1.6(1.47 ± 0.07) × 10165.84 ± 0.721.85 ± 0.14−5.80 ± 0.67
20.77 ± 0.02129.1 ± 1.0(8.19 ± 0.40) × 10109.25 ± 0.760.73 ± 0.23−9.80 ± 0.66
30.13 ± 0.01339.1 ± 4.0(1.55 ± 0.01) × 1013−28.85 ± 2.128.55 ± 0.9020.71 ± 2.05
Disclaimer/Publisher’s Note: The statements, opinions and data contained in all publications are solely those of the individual author(s) and contributor(s) and not of MDPI and/or the editor(s). MDPI and/or the editor(s) disclaim responsibility for any injury to people or property resulting from any ideas, methods, instructions or products referred to in the content.

