Abstract
The landfill barriers effectively prevented the migration of high-concentration pollutants, such as NH4+ and Na+, from the landfills to the surrounding environment. However, due to the high hydraulic head inside the landfill compared to the surrounding environment, NH4+ and Na+ can migrate towards the outside of the landfill barrier with the infiltrating solution, potentially causing harm to the surrounding environment. To address this, saturated mixed soil column samples made of bentonite and Shanghai clay, with bentonite contents of 3% and 10%, were used in this study. Permeability coefficients of the column samples in solutions are obtained by using permeation tests, and using NaCl and NH4Cl solutions with concentrations of 37.4 mmol/L and 74.8 mmol/L, respectively. The concentration-depth result of the column samples after permeation tests was determined using Inductively Coupled Plasma Atomic Emission Spectroscopy (ICP-AES) and Ion Chromatography (ICS-1100). Numerical simulations are used to investigate the effect of downstream solute concentration of the barriers on upstream solute concentration, dry density, and bentonite content of the barriers. The results indicate that the permeability coefficient of the soil column samples exposed to NH4Cl solution is greater than that of samples exposed to NaCl solution. This can be attributed to the stronger cation exchange of montmorillonite for NH4+, resulting in less swelling of the bentonite and more micro-pores, leading to an increase in the permeability coefficient. The concentration of Na+ is higher than that of NH4+ at the same depth of the column samples, indicating that Na+ has a higher migration rate in the column sample. This could be attributed to the relatively fast diffusion of Na+ on the surface of the bentonite and larger hydration radius of Na+. According to the simulation results, the recommended values for the bentonite clay mixed-soil barrier wall are as follows in this study: a thickness of 43 cm, a dry density of 1.5 g/cm3, and a bentonite content of 5%.
1. Introduction
The safety of landfills has received increasing attention from scholars around the world. Landfilling is the most common method of waste disposal because it is simple, cheap and efficient [1,2]. Leachate production in landfills poses significant environmental and human health risks [3,4]. To protect the environment from leachate, bentonite barriers have been studied by many scholars [5,6,7]. However, the effect of the barrier is not permanent and it is weakened by the effect of cations in the landfill leachate.
It has been determined that Na+ and NH4+ are the most prevalent cations among the polluting cations present in leachate [8]. Benson et al. [9] performed a statistical examination of the composition of leachates derived from coal waste residues in different regions within the United States, and the results revealed that Na+ constitutes to the primary cations in the leachate. Lou et al. [10] reported that the concentration of NH4+ in landfill leachate reached a maximum of approximately 4000 mg/L within 1–2 years after operation of the landfill. The concentration remained at a high range of 500 mg/L to 2000 mg/L over time [11]. Zhan et al. [12] assessed the extent of vertical migration for leachate pollutants, and reported that the maximum concentration of Na+ at the bottom of the landfill was up to 6000 mg/L. The Na+ and NH4+ with a high concentration will migrate from landfill to groundwater due to a concentration gradient, and the retention property of the bentonite barrier will be weakened, resulting in environment pollution around landfill [13,14]. In addition, the head in landfill leachate is generally higher than that in groundwater, leading to a gradient-driven convection of cations from the leachate to groundwater. Na+ and NH4+ is easily migratable in convection, resulting in environmental pollution.
Bentonite is considered as a potential backfill material for landfill due to low permeability and adsorbability [2,15]. Many studies have been performed with respect to various properties of bentonite or bentonite-based materials, such as bentonite barriers [2,16,17]. This composite barrier has exhibited a strong barrier effect for protecting the environment by preventing cations on the leachate from migration [7]. In fact, the migration of cations in barriers is a coupled process of multiple mechanisms, such as convection, chemical adsorption and diffusion [17,18,19,20]. Studying these behaviors in isolation, such as convection, chemical adsorption and diffusion, may not accurately reflect the actual “movement” of cations in landfill barriers. The concentration-depth result obtained from column tests may provide more direct conclusions for designing impermeability measures in landfills [21].
Moreover, numerical simulation has been demonstrated as an effective method to optimize the parameters of groundwater contamination based on data of indoor experiments [14,22,23]. It overcomes not only the problem of singularity in parameters derived from analytical solutions, but also the time consumption caused by the low permeability of bentonite in experiments. This method provides the possibility for a prediction of contaminant concentrations in the future and at greater depths, and it can also be used to achieve parameter optimization for pollution control of cations in landfills [22].
In this study, mixed-soil columns were produced by blending 3% and 10% bentonite with Shanghai clay, which was used to simulate barriers in landfills. According to the study of Lou et al. [10], the concentration of NH4Cl used in this study was determined; the concentration of NH4Cl in the leachate after 2 years of landfill closure was 4000 mg/L, and the concentration of NaCl was the same according to the control variable method and the conversion unit was 74.80 mmol/L. The saturated soil columns were subsequently permeated with NH4Cl and NaCl solutions with concentrations of 37.4 mmol/L and 74.8 mmol/L, respectively. This study investigated the migration behavior of Na+ and NH4+ in soil columns by analyzing the permeability coefficient and the concentration-depth result obtained from column tests. The feasibility of numerical simulation was evaluated by comparing the numerical results with the column tests data. A numerical model was established to investigate the effects of wall thickness, upstream solute concentration, and bentonite content on the downstream solute concentration for the barrier, and to assess the efficiency of the isolation wall in intercepting landfill pollutants.
2. Materials and Methods
2.1. Materials
The bentonite used in this study was taken from the raw materials of Geosynthetic Clay Liner (GCL), mainly composed of montmorillonite accounting for 45.8%, and partly of kaolinite and feldspar, as shown in Table 1. The clay samples used in this study were collected from Shanghai, China and appeared black or gray. Some basic physical properties of the bentonite and Shanghai clay were tested according to ASTM D4318-10 standard, as shown in Table 2.

Table 1.
Main Components of Bentonite.
Table 2.
Basic physical properties of bentonite and Shanghai clay.
NaCl and NH4Cl solutions were obtained from Sinopharm Chemical Reagent Co., Ltd., (Shanghai, China) with a purity of analytical grade (AR 99.5%). The NaCl solution and NH4Cl solution were diluted to concentrations of 37.40 mmol/L and 74.80 mmol/L, respectively, based on the residual concentrations of Na+ and NH4+ in the leachate of the landfill site [10].
2.2. Column Test
To prepare the mixed soil sample, the bentonite and Shanghai clay were first dried at 105 °C for 24 h. The two materials were then mixed together in accordance with the provided ratio specified in Table 3. Table 3 presents the experimental solutions and related variables with Group No. 1 serving as the blank control. The mixed-soil samples were saturated with deionized water and then soaked for 24 h at room temperature and atmospheric pressure until the liquid limit had reached 1.5 times. Figure 1 shows the column test Apparatus with a height of 200 mm and an inner diameter of 80 mm; the mixed soil was filled into column test Apparatus for consolidation and drainage. After applying 1 kPa of pre-stress to ensure close contact between the sample, base, and top cover, the sample was loaded along the following path: 12.5 kPa–25 kPa–50 kPa–100 kPa–200 kPa–300 kPa–400 kPa–800 kPa. Permeation tests were conducted under a constant hydraulic head of 400 kPa. The weight of the effluent was measured using an electronic balance, and the time at which the balance readings began to change was recorded as the start time. The volume of effluent collected at different times was calculated by mass/density (q = m/ρ). The instantaneous flow rate q versus time t curve was plotted, and the test was terminated when the slope of the q-t curve no longer changed. The steady-state permeation flow rate Q and permeability coefficient k were calculated using Equations (1) and (2).
where Q is the permeation flow (cm3/s), q is the instantaneous flow rate (cm3), t is the time for recording (s), k is the hydraulic conductivity (cm/s), A is the cross-sectional area of the sample (cm2), L is the height of the sample (cm), and Δh is the head difference (cm).
Table 3.
The experimental solution and related variables.
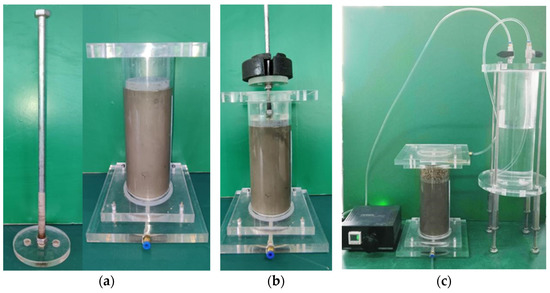
Figure 1.
Column test Apparatus. (a) Pressure rod and pressure chamber. (b) Column sample consolidation drainage. (c) The schematic apparatus used for the column test.
After the permeation test, the column sample was sliced at 2 cm, 4 cm, 6 cm, 8 cm, 10 cm, 12 cm, and 14 cm from the top with each slice having a thickness of 1 cm. Each slice was then divided into two equal parts along its diameter. One part was used to measure the pore water content of the sample using the oven-drying method, while the other part was subjected to oscillating centrifugation to obtain the supernatant. The concentration of Na+ and NH4+ in the supernatant was measured using Inductively Coupled Plasma-Atomic Emission Spectrometer (ICP-AES) and Ion Chromatography System (ICS-1100), respectively. The concentration of Na+ and NH4+ in the pore solution of the column sample was then calculated using Equation (3).
where C is the solute concentration in the pore solution of the slice sample; C’ is the solute concentration measured in the supernatant; ρ is the density of DI water, which is taken as 1g/cm3; V is the volume of DI water added, which was 150 mL in this study; and Δm is the quality difference of slice samples before and after drying.
3. Results and Discussion
Table 4 shows the permeability coefficients k of column samples exposed to salt solution. Figure 2 shows the relationship between q and t, Q can be calculated using q and t. Experimental groups 1–5 in Figure 2 correspond to experimental groups 1–5 in Table 3 and Table 5, respectively. The results show that under the same bentonite content, the permeability coefficient of the soil column is the largest in NH4Cl solution, reaching 1.5 × 10⁻⁷ cm × s−1, followed by NaCl solution, while the permeability coefficient in DI water is the smallest. This indicates that NH4+ has increased the water flow channel in the soil column in NH4Cl solution, which may be due to the effect of NH4+ on the interlayer spacing of montmorillonite. It is well known that montmorillonite has a structure of double electric layer (DDL) with a negative charged surface [24]. The NH4+ has a smaller hydration radius than the Na+ [25], allowing the interlayer of montmorillonite to be accommodated with more NH4+ than the Na+. Cations with smaller hydrated radius are allowed to approach negatively charged mineral surfaces more closely [26]. In addition, according to the cation exchange sequence proposed by Ye et al. [27] and Xiang et al. [28]: NH4+ > Ca2+ > Mg2+ > K+ > Na+, the NH4+ has a higher tendency to exchange other cations (such as Ca2+, Mg2+, K+) in the interlayer of montmorillonite, reducing the electrostatic repulsion in the montmorillonite interlayer and resulting in a reduction of the DDL thickness [29,30,31]. This leads to a decrease in the swelling of the bentonite [32,33], allowing more pores for the solution to pass through, resulting in a larger permeability coefficient for the soil column in NH4Cl solution [15,34,35]. The permeability coefficient of the soil column in NH4Cl solution is found to be higher at higher solution concentrations, confirming the above statement. However, the increase in bentonite content results in a reduction of the permeability coefficient due to a decrease in pore size caused by more montmorillonite participating in hydration expansion, thereby blocking water flow channels.
Table 4.
The permeability coefficients k of column samples exposed to salt solution.
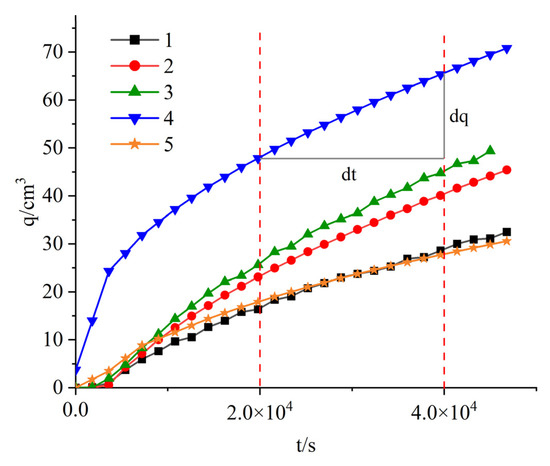
Figure 2.
The time-dependent permeation curve of column samples exposed to DI water, NaCl solution and NH4Cl solution with different concentration.
Table 5.
Model parameters.
The concentration-depth result in column samples provides valuable information on the migration of solutes, including convection, diffusion, and adsorption. Figure 3 shows the charge of solute concentration for saturated column samples in NaCl and NH4Cl solution. It can be observed that when the column sample with 3% content of bentonite is permeated by a 74.8 mmol/L NaCl and NH4Cl solution, respectively, the concentration of solutes in the column sample decreases with the increase of the permeation path. Additionally, all concentrations are lower than the initial concentration when reaching the permeation equilibrium. Notably, Na+ exhibits a higher migration rate compared to NH4+. For instance, at a depth of 6 cm, the Na+ concentration is 22.6 mmol/L, while that of NH4+ is 17.97 mmol/L. This indicates that Na+ has a higher migration rate than NH4+ in the column sample.
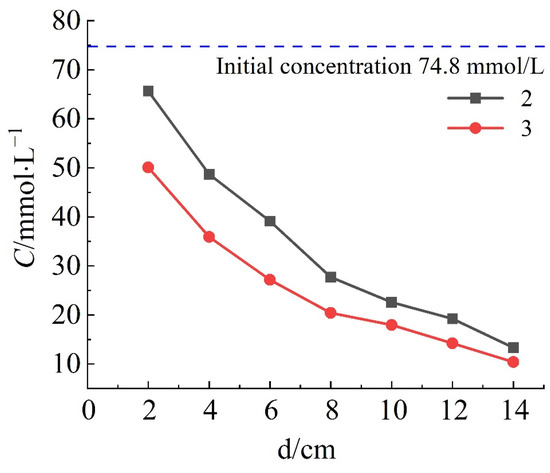
Figure 3.
Concentration−depth result of saturated column samples.
According to permeation tests, NH4+ exhibits a greater convective rate compared to Na+, indicating that when excluding convective effects, the migration rate of Na+ in the column sample is relatively high. This phenomenon may be attributed to the relatively fast diffusion of Na+ [37,38,39], resulting in a distribution further away from the surface of the bentonite [40]. Consequently, the negative charge on the bentonite surface has a weaker attraction to Na+, enabling it to migrate more easily downstream with the pore solution. Furthermore, the strong hydration of Na+ and its larger hydration radius make it challenging for Na+ to permeate into the interlayer space of the montmorillonite [41]. This behavior may cause Na+ to bypass the interlayer space of the montmorillonite and migrate with the pore solution, while NH4+ enters and remains in the interlayer space of the montmorillonite. Consequently, the concentration of Na+ is greater than that of NH4+ at the same depth.
4. Numerical Simulation
4.1. Numerical Model
In this study, the modules of porous media and groundwater flow, and chemical substance transport were used to simulate the migration behavior of solutes in a saturated soil column. The model was a cylindrical shape with a diameter of 8 cm, a height of 15 cm and the time unit was in hours (h). The model is divided into 22,035 domain elements, 1800 boundary elements, and 136 edge elements, as shown in Figure 4. The Darcy’s law physics field and the porous medium dilute species transport physics field were coupled and applied to the column model. The top boundary of model can be considered as the constant water head boundary condition, and the lower boundary is regarded as a flow-field outlet, and the boundaries around of the model are set as no-flux boundaries (the flux of physical quantities is zero at the boundary). The initial condition for solute concentration at the upper boundary is 74.8 mmol/L, and the initial condition for solute concentration in the pore fluid of the column model is 0 mmol/L.
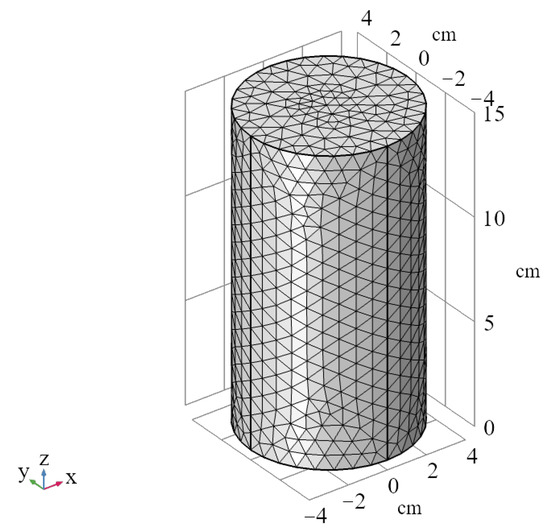
Figure 4.
The models of the column sample.
4.2. Physical Equation and Parameters
Darcy’s law is an empirical relationship that describes the function between the velocity of water in saturated soil, pressure gradient, fluid viscosity, and porous medium structure. It is applicable to the flow of fluid through a porous medium under pressure. Fick’s first law is a fundamental diffusion law that describes the movement of molecules from regions of high concentration to regions of low concentration [42]. Therefore, Darcy’s law and Fick’s first law can be applied to the migration of solutes in the soil column experiment in this study. By applying Darcy’s law and Fick’s first law, the migration behavior of solutes within bentonite barriers while under the influence of hydraulic pressure and concentration gradients can be comprehensively investigated, which is essential for designing effective landfill barriers.
According to Darcy’s law, the fundamental physical governing equation for fluid flow considering both porous media properties and fluid properties was obtained and expressed as Equation (4). According to Fick’s first law, which is usually represented mathematically as Equation (5), the migration behavior of solutes in the barrier due to concentration gradient was studied. The diffusion coefficient D was obtained by fitting Equation (6).
where K is the permeability (m2) of the porous media, which reflects the resistance of fluid passing through the porous media, μ is the dynamic viscosity (Pa·s) of the fluid, which is generally related to temperature, ρ is the density (kg/cm3) of the fluid, n is the porosity of the soil column, g is the acceleration due to gravity (m/s2), ∇D is the unit vector of the acceleration due to gravity, J is the flux, D is the diffusion coefficient (m2/s), and ∇C is the concentration gradient (mmol/L). The diffusion coefficient D was calculated by fitting Equation (6). In Equation (6), Δm is the change in the mass (g) of solutes in the filtrate.
The other parameters of this study were obtained through unit tests, as shown in Table 5. The dry density ρd of the column sample was tested according to the GB/T 50123-2019 standard, and the porosity n of the sample was calculated based on its void ratio e. The permeability K was calculated based on the hydraulic conductivity k and dynamic viscosity μ of water. The dynamic viscosity μ of water is a fundamental physical property, which was measured in this study to be 1.01 × 10⁻³ Pa∙s at room temperature (20 ℃).
4.3. Simulation Results
Figure 5 shows the fitting curve of the concentration-depth curve for the saturated column sample, while Figure 6 shows the simulated concentration distribution of the column sample. In the soil column model, the fitted result of group 2 is better; the value of R2 in fitted curve for group 2 is 0.94, and that of group 3 is 1.92. The solute concentration decreases with increasing depth, indicating the solute becoming trapped within the soil column sample. Furthermore, the Na+ concentration is higher than NH4+ concentration at the same depth, as Na+ diffuses faster. The fitting curve of the simulation results shows consistent trends with the experimental data, indicating the migration of NaCl and NH4Cl solutions in the saturated soil column sample follows the physical field of Darcy’s law and the physical field of sparse mass transfer in porous media. The numerical model can be further optimized to provide reasonable solutions for impermeability under different working conditions, and provide corresponding references to improve engineering efficiency.
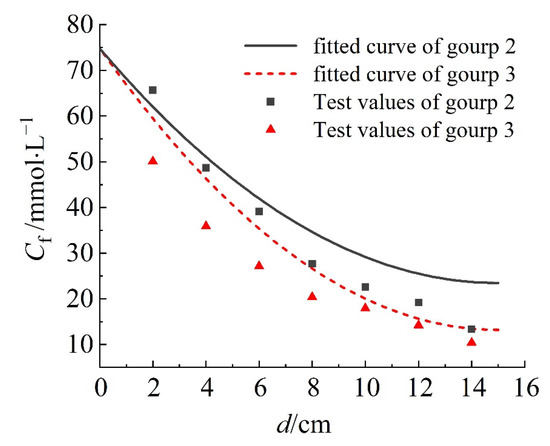
Figure 5.
Fitted curves of concentration−depth result of the saturated column samples.
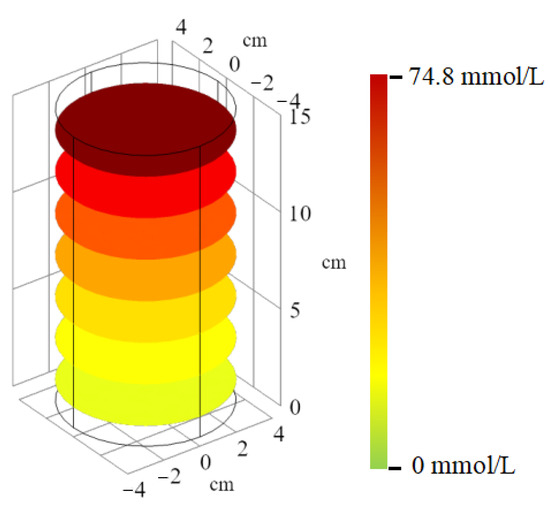
Figure 6.
Concentration distribution of column sample according to color representation.
4.4. Barrier Behavior of the Landfill
By comparing the results of numerical simulations with test data, it was found that the numerical simulation results were consistent with the trends observed in the tests, thus validating the correctness of the model. Based on this, this method was promoted and applied to predict the pollutant interception behavior of landfill barriers. The impacts of barrier thickness, dry density of mixed soil, and bentonite content on the barrier behavior are explored, which allows for comparisons and evaluations with industry standards and provides reasonable recommendations for the design of the barriers.
The barrier model was discretized into 28,666 domain elements, 3002 boundary elements, and 254 edge elements. The barrier model is a semi-infinite body with a thickness (D) of 30 cm and a depth (h) of 100 cm, as shown in Figure 7. The two lateral boundaries of the barrier model simulate the leachate in the landfill and the groundwater, respectively. For the leachate boundary, the top of the barrier is set to a depth of 0.2 m below the leachate level with an initial concentration of 74.8 mmol/L and a hydraulic head of 2 m. For the groundwater boundary, the top of the barrier is set to a depth of 0.4 m below the groundwater level. The flow direction is from leachate to groundwater, and the initial concentration of the pore fluid in the barrier is 0 mmol/L.
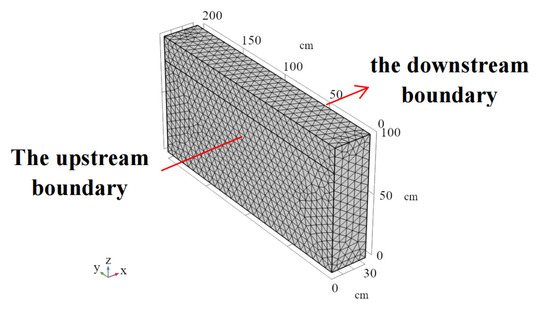
Figure 7.
The models of the landfill barrier.
Figure 8 shows the solute concentration-depth result (a) and the isoconcentration image (b) of the barrier model. It can be clearly observed from the model image that the isoconcentration lines are not horizontal, due to the effect of gravity on the solute, which tends to aggregate downwards during lateral migration, resulting in higher solute concentrations at greater depths of the barrier. When the solute concentration of the barrier reaches about 62.5 mmol/L, the concentration-depth curve changed slowly, indicating that the pollutant interception capacity of the barrier had reached saturation and the solute would breakthrough and permeate out of the barrier.
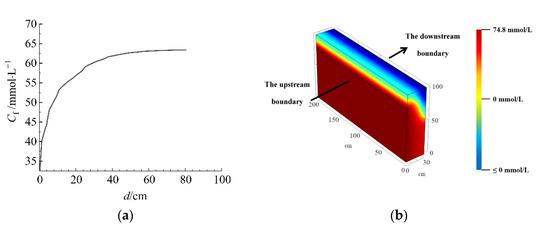
Figure 8.
The solute concentration−depth result (a) and the isoconcentration image (b) of the barrier model.
Figure 9 shows the relationship between solute concentration at the downstream boundary of the barrier and the thickness of barrier. The model parameters are set based on the most unfavorable conditions with a dry density of 1.3 g/cm3 for the mixed soil in the barrier and a bentonite content of 3%. The solute concentration in downstream decreases linearly with increasing barrier thickness. According to the Technical Code for Geotechnical Engineering of Municipal Solid Waste Sanitary Landfills, the concentration of pollutants at the downstream boundary of the barrier is 10% that of the upstream boundary (value of 7.48 mmol/L) as the failure criterion; the barrier thickness should be greater than 43 cm to meet the requirement.
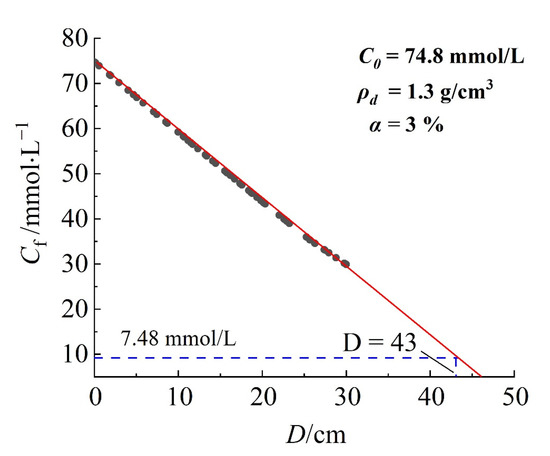
Figure 9.
The relationship between solute concentration at the downstream boundary of the barrier and the thickness of the barrier.
The relationship between the concentration of solute at the downstream boundary and the dry density of the barrier is shown in Figure 10. As the dry density of the barrier increases, the concentration of solute at the downstream boundary gradually decreases. The slow change in solute concentration at the downstream boundary was presented as the dry density reaches 1.7 g/cm3. This may be related to the reduction of pores caused by the increase of dry density, resulting in narrower water channels and a decreased efficiency of solute migration by convection. According to the Technical Code for Geotechnical Engineering of Municipal Solid Waste Sanitary Landfills, the dry density of the barrier wall should be 1.5 g/cm3, taking into account both economic benefits and construction difficulties.
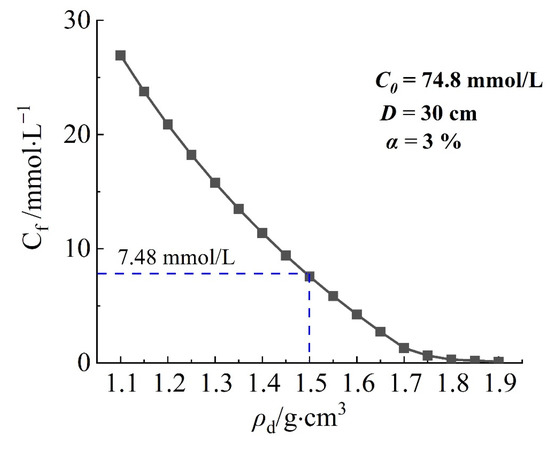
Figure 10.
The relationship between the concentration of solute at the downstream boundary and the dry density of the barrier.
Figure 11 shows the relationship between the concentration of solute at the downstream boundary and the content of bentonite in the barrier. In this study, the concentration of solute at the downstream boundary decreased with the increase of bentonite content, which presented a linear relationship. This is because the increase of montmorillonite provides more adsorption sites for Na+ and NH4+, and the denser expansion of bentonite reduces the internal water channels, resulting in the weakening of solute migration due to convection. If the downstream concentration is considered to reach 10% of the upstream concentration, the recommended content of bentonite is around 5%. Similarly, He et al. [22] found that a mixed-soil sample with 5% bentonite content can meet the requirement of the permeability coefficient (<10−7 cm/s) for the mixed-soil barriers that are exposed to the common heavy metal in landfill.
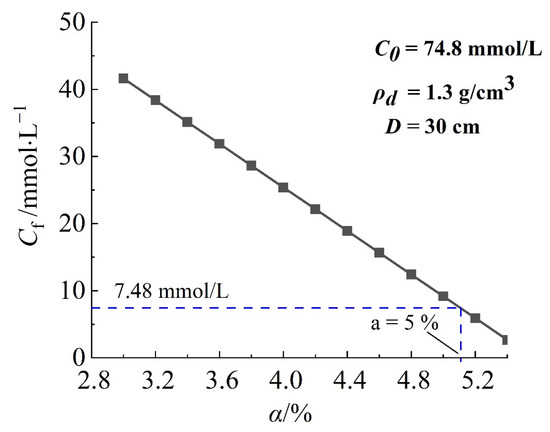
Figure 11.
The relationship between the concentration of solute at the downstream boundary and the content of bentonite in the barrier.
Therefore, under the most unfavorable conditions of this study, according to the design recommendation of the Technical Code for Geotechnical Engineering of Municipal Solid Waste Sanitary Landfills, the barrier should have a thickness of 43 cm, a dry density of 1.5 g/cm3, and a bentonite content of 5%. In the practice of engineering, parameter adjustment and optimization design of the landfill barriers can be carried out according to the types of pollutants, service life, and reference norms.
5. Conclusions
This study investigated the migration behavior of Na+ and NH4+ in landfill barriers using column tests. A numerical model was developed to fit the concentration-depth result obtained from the column tests, which verified the feasibility of the numerical simulation. Furthermore, offering practical recommendations and suggestions for designing landfill barriers.
The soil column samples with 3% bentonite content were permeated with 74.8 mmol/L NaCl or NH4Cl solution. The permeability coefficient of the column samples exposed to NaCl solution was 1.36 × 10⁻⁷ cm × s−1, while the coefficient exposed to NH4Cl solution was 1.5 × 10⁻⁷ cm × s−1. This indicates that the convective velocity of NH4+ in the column sample is greater than that of Na+. This is attributed to the smaller hydration radius of NH4+, which allows it to pass through more pores with the solution. Additionally, the stronger cation exchange of montmorillonite with NH4+ results in a lower swelling of bentonite and the appearance of more micropores.
Moreover, the concentration of Na+ at the same depth in the column specimen was found to be higher compared to the concentration of NH4+, indicating a higher migration rate of Na+ in the specimen than that of NH4+. This could be attributed to the relatively fast diffusion of Na+ on the surface of the bentonite, resulting in a weakened electrostatic attraction to the negative charge. Additionally, the larger hydration radius of Na+ causes it to bypass the interlayer space of the montmorillonite and migrate with the pore solution.
Darcy’s law can be used to model the transfer of these substances through the porous media. The physical field of dilute substance transfer in porous media can also be utilized to describe the transport of these ions. The recommended values for the design of the barrier wall are as follows: thickness of 43 cm, dry density of 1.5 g/cm3, and bentonite content of 5%, according to the Technical Code for Geotechnical Engineering of Municipal Solid Waste Sanitary Landfills.
Author Contributions
Conceptualization, W.S.; methodology, G.X.; validation, Y.T.; writing—original draft preparation, Q.T.; writing—review and editing, W.S. All authors have read and agreed to the published version of the manuscript.
Funding
This research was funded by the National Natural Science Foundation of China grant number [41977214, 41572284] and Hubei Key Laboratory of Disaster Prevention and Mitigation (China Three Gorges University) [2022KJZ01]. And The APC was funded by [41977214].
Data Availability Statement
Due to privacy or ethical restrictions, the original data cannot be made publicly available. However, we have provided detailed information regarding the sources of the data and the methods used for data collection in the Materials and Methods section. For any further inquiries regarding the data used in this study, please contact the email “TQTtang@163.com”.
Acknowledgments
We would like to express our sincere gratitude to all those who have contributed to the completion of this research.
Conflicts of Interest
The authors declare no conflict of interest.
References
- Ololade, O.O.; Mavimbela, S.; Oke, S.A.; Makhadi, R. Impact of Leachate from Northern Landfill Site in Bloemfontein on Water and Soil Quality: Implications for Water and Food Security. Sustainability 2019, 11, 4238. [Google Scholar] [CrossRef]
- Huang, X.; Li, J.S.; Xue, Q.; Chen, Z.; Du, Y.j.; Wan, Y.; Liu, L.; Poon, C.S. Use of self-hardening slurry for trench cutoff wall: A review. Constr. Build. Mater. 2021, 286, 122959. [Google Scholar] [CrossRef]
- Zheng, M.; Li, S.; Dong, Q.; Huang, X.; Liu, Y. Effect of blending landfill leachate with activated sludge on the domestic wastewater treatment process. Environ. Sci. Water Res. Technol. 2019, 5, 268–276. [Google Scholar] [CrossRef]
- Xu, Y.; Dong, L.; Nai, C.X.; Liu, Y.Q.; Huang, Q.F.; Li, W.S.; Liu, J.C. Buffering distance between hazardous waste landfill and water supply wells in a shallow aquifer. J. Clean. Prod. 2019, 211, 1180–1189. [Google Scholar] [CrossRef]
- Tang, Q.; Gu, F.; Zhang, Y.; Zhang, Y.; Mo, J. Impact of biological clogging on the barrier performance of landfill liners. J. Environ. Manag. 2018, 222, 44–53. [Google Scholar] [CrossRef]
- Baltrūnas, V.; Slavinskienė, G.; Karmaza, B.; Pukelytė, V. Effectiveness of a Modern Landfill Liner System in Controlling Groundwater Quality of an Open Hydrogeological System, Se Lithuania. J. Environ. Eng. Landsc. Manag. 2020, 28, 174–182. [Google Scholar] [CrossRef]
- Sheng, H.; Ren, Y.; Huang, M.; Zhang, Z.; Lan, J.; Liu, X. Vertical Expansion Stability of an Existing Landfill: A Case Study of a Landfill in Xi’an, China. Adv. Civ. Eng. 2021, 2021, 5574238. [Google Scholar] [CrossRef]
- Venkatesh Reddy, C.; Shekhar Rao, D.; Kalamdhad, A.S. Statistical modelling and assessment of landfill leachate emission from fresh municipal solid waste: A laboratory-scale anaerobic landfill simulation reactor study. Waste Manag. Res. 2020, 38, 1161–1175. [Google Scholar] [CrossRef] [PubMed]
- Benson, C.; Chen, J.; Edil, T. Engineering Properties of Geosynthetic Clay Liners Permeated With Coal Combustion Product Leachates; Electric Power Research Institute: Palo Alto, CA, USA, 2014. [Google Scholar]
- Lou, Z.Y.; Chai, X.L.; Zhao, Y.C.; Song, Y.; Li, X.; Liu, Z.Y. Leachate composition changes over time: Data from the Laogang Landfill in Shanghai. Acta Sci. Circumstantiae 2007, 27, 987–992. [Google Scholar]
- Gupta, A.; Paulraj, R. Leachate composition and toxicity assessment: An integrated approach correlating physicochemical parameters and toxicity of leachates from MSW landfill in Delhi. Environ. Technol 2017, 38, 1599–1605. [Google Scholar] [CrossRef]
- Zhan, T.L.; Guan, C.; Xie, H.J.; Chen, Y.M. Vertical migration of leachate pollutants in clayey soils beneath an uncontrolled landfill at Huainan, China: A field and theoretical investigation. Sci. Total Environ. 2014, 470–471, 290–298. [Google Scholar] [CrossRef] [PubMed]
- He, Y.; Chen, Y.G.; Ye, W.M. Equilibrium, kinetic, and thermodynamic studies of adsorption of Sr(II) from aqueous solution onto GMZ bentonite. Environ. Earth Sci. 2016, 75, 807. [Google Scholar] [CrossRef]
- He, Y.; Li, B.B.; Zhang, K.N.; Li, Z.; Chen, Y.G.; Ye, W.M. Experimental and numerical study on heavy metal contaminant migration and retention behavior of engineered barrier in tailings pond. Environ. Pollut 2019, 252, 1010–1018. [Google Scholar] [CrossRef]
- Liu, J.; Song, S.; Cao, X.; Meng, Q.; Pu, H.; Wang, Y.; Liu, J. Determination of full-scale pore size distribution of Gaomiaozi bentonite and its permeability prediction. J. Rock Mech. Geotech. Eng. 2020, 12, 403–413. [Google Scholar] [CrossRef]
- Seiphoori, A.; Laloui, L.; Ferrari, A.; Hassan, M.; Khushefati, W.H. Water retention and swelling behaviour of granular bentonites for application in Geosynthetic Clay Liner (GCL) systems. Soils Found. 2016, 56, 449–459. [Google Scholar] [CrossRef]
- Xu, H.; Zhu, W.; Qian, X.; Wang, S.; Fan, X. Studies on hydraulic conductivity and compressibility of backfills for soil-bentonite cutoff walls. Appl. Clay Sci. 2016, 132–133, 326–335. [Google Scholar] [CrossRef]
- Bouchelaghem, F. Multi-scale Study of Pollutant Transport and Uptake in Compacted Bentonite. Math. Geosci. 2018, 50, 495–523. [Google Scholar] [CrossRef]
- Wu, Q.; Wang, J. A Thermo-Hydro-Mechanical Coupling Analysis for the Contaminant Transport in a Bentonite Barrier with Variable Saturation. Water 2020, 12, 3114. [Google Scholar] [CrossRef]
- Malusis, M.A.; Barlow, L.C. Comparison of Laboratory and Field Measurements of Backfill Hydraulic Conductivity for a Large-Scale Soil-Bentonite Cutoff Wall. J. Geotech. Geoenviron. Eng. 2020, 146, 04020070. [Google Scholar] [CrossRef]
- Kim, J.Y.; Edil, T.B.; Park, J.K. Effective porosity and seepage velocity in column tests on compacted clay. J. Geotech. Geoenviron. Eng. 1997, 123, 1135–1142. [Google Scholar] [CrossRef]
- He, Y.; Hu, G.; Wu, D.Y.; Zhu, K.F.; Zhang, K.N. Contaminant migration and the retention behavior of a laterite-bentonite mixture engineered barrier in a landfill. J. Environ. Manag. 2022, 304, 114338. [Google Scholar] [CrossRef] [PubMed]
- Villar, M.V. Infiltration tests on a granite/bentonite mixture: Influence of water salinity. Appl. Clay Sci. 2006, 31, 96–109. [Google Scholar] [CrossRef]
- Wireko, C.; Zainab, B.; Tian, K.; Abichou, T. Effect of specimen preparation on the swell index of bentonite-polymer GCLs. Geotext. Geomembr. 2020, 48, 875–885. [Google Scholar] [CrossRef]
- Jorgensen, T.C.; Weatherley, L.R. Ammonia removal from wastewater by ion exchange in the presence of organic contaminants. Water Res. 2003, 37, 1723–1728. [Google Scholar] [CrossRef]
- Eide Helle, T.; Aagaard, P.; Nordal, S.; Long, M.; Bazin, S. A geochemical, mineralogical and geotechnical characterization of the low plastic, highly sensitive glaciomarine clay at Dragvoll, Norway. AIMS Geosci. 2019, 5, 704–722. [Google Scholar] [CrossRef]
- Ye, W.M.; Zhang, F.; Chen, Y.G.; Chen, B.; Cui, Y.J. Influences of salt solutions and salinization-desalinization processes on the volume change of compacted GMZ01 bentonite. Eng. Geol. 2017, 222, 140–145. [Google Scholar] [CrossRef]
- Xiang, G.; Ye, W.; Xu, Y.; Jalal, F.E. Swelling deformation of Na-bentonite in solutions containing different cations. Eng. Geol. 2020, 277, 105757. [Google Scholar] [CrossRef]
- Gautier, M.; Muller, F.; Le Forestier, L.; Beny, J.M.; Guegan, R. NH4-smectite: Characterization, hydration properties and hydro mechanical behaviour. Appl. Clay Sci. 2010, 49, 247–254. [Google Scholar] [CrossRef]
- Zhu, C.M.; Ye, W.M.; Chen, Y.G.; Chen, B.; Cui, Y.J. Influence of salt solutions on the swelling pressure and hydraulic conductivity of compacted GMZ01 bentonite. Eng. Geol. 2013, 166, 74–80. [Google Scholar] [CrossRef]
- Chen, Y.G.; Jia, L.Y.; Li, Q.; Ye, W.M.; Cui, Y.J.; Chen, B. Swelling deformation of compacted GMZ bentonite experiencing chemical cycles of sodium-calcium exchange and salinization-desalinization effect. Appl. Clay Sci. 2017, 141, 55–63. [Google Scholar] [CrossRef]
- Xiao, G.; Xu, G.; Wei, T.; Zeng, J.; Liu, W.; Zhang, L. The Effect of Cu (II) on Swelling and Shrinkage Characteristics of Sodium Bentonite in Landfills. Appl. Sci. 2021, 11, 3881. [Google Scholar] [CrossRef]
- Zhang, R.; Wang, X.; Sun, Y.; Zhang, J.; Hu, W.; Du, W.; Chen, G. Preparation and performance of ammonium-malic salts as shale swelling inhibitor and a mechanism study. Inorg. Nano Met. Chem. 2020, 50, 1027–1031. [Google Scholar] [CrossRef]
- Sun, W.J.; Liu, C.; Yang, D.; Sun, D.A. Evaluation of hydro-mechano-chemical behaviour of bentonite-sand mixtures. J. Rock Mech. Geotech. Eng. 2022, 14, 637–652. [Google Scholar] [CrossRef]
- Setz, M.C.; Tian, K.; Benson, C.H.; Bradshaw, S.L. Effect of ammonium on the hydraulic conductivity of geosynthetic clay liners. Geotext. Geomembr. 2017, 45, 665–673. [Google Scholar] [CrossRef]
- Lou, X.H. Research on mechanism of heavy metals migration in unsaturated soils. Master’s Thesis, Shanghai University, Shanghai, China, 2019. [Google Scholar]
- Bourg, I.C.; Sposito, G.; Bourg, A.C.M. Modeling the diffusion of Na+ in compacted water-saturated Na-bentonite as a function of pore water ionic strength. Appl. Geochem. 2008, 23, 3635–3641. [Google Scholar] [CrossRef]
- Medved, I.; Černý, R. Modeling of radionuclide transport in porous media: A review of recent studies. J. Nucl. Mater. 2019, 526, 151765. [Google Scholar] [CrossRef]
- Glaus, M.A.; Birgersson, M.; Karnland, O.; Van Loon, L.R. Seeming steady-state uphill diffusion of 22Na+ in compacted montmorillonite. Environ. Sci. Technol. 2013, 47, 11522–11527. [Google Scholar] [CrossRef]
- Molera, M.; Eriksen, T. Diffusion of 22Na+, 85Sr2+, 134Cs+ and 57Co2+ in bentonite clay compacted to different densities: Experiments and modeling. Radiochim. Acta 2002, 90, 753–760. [Google Scholar] [CrossRef]
- Melkior, T.; Gaucher, E.C.; Brouard, C.; Yahiaoui, S.; Thoby, D.; Clinard, C.; Ferrage, E.; Guyonnet, D.; Tournassat, C.; Coelho, D. Na+ and HTO diffusion in compacted bentonite: Effect of surface chemistry and related texture. J. Hydrol. 2009, 370, 9–20. [Google Scholar] [CrossRef]
- Tanaka, S. Bentonite barrier performance affected by precipitation of secondary minerals: Diffusivities of water and iodide ions in the presence of calcium carbonate. Appl. Geochem. 2022, 146, 105448. [Google Scholar] [CrossRef]
Disclaimer/Publisher’s Note: The statements, opinions and data contained in all publications are solely those of the individual author(s) and contributor(s) and not of MDPI and/or the editor(s). MDPI and/or the editor(s) disclaim responsibility for any injury to people or property resulting from any ideas, methods, instructions or products referred to in the content. |
© 2023 by the authors. Licensee MDPI, Basel, Switzerland. This article is an open access article distributed under the terms and conditions of the Creative Commons Attribution (CC BY) license (https://creativecommons.org/licenses/by/4.0/).