Abstract
This work considers the stabilization of a high-order system with time delay; an observer–predictor scheme is designed to estimate an internal signal of the system that is not available for measurement: this internal signal is the output before being delayed. By using the estimated signal, it is possible to design a controller for the delay-free system. The key point to carrying out this estimation strategy is to obtain conditions assuring that the estimated signal converges to the internal variable of the system. A necessary and sufficient condition to achieve an appropriate convergence in the proposed observer–predictor scheme is given. In addition, an analysis of the disturbance rejection and robustness with respect to the delay term is provided. The correct functioning of this scheme is verified through an example.
1. Introduction
Time delay systems are often found in dynamic processes. It is well known that when the delay is small enough in comparison with the dynamics of the process, it can be neglected. However, if this is not the case, a careful design of the control stage becomes necessary. Systems with a delay are common in different fields of application, for example, in chemical processes [1], satellite communications [2], hydraulic systems [3], economic systems [4] and technological processes, such as remote operation [5,6]. From the control point of view, linear delayed systems pose a challenge because when closing the control loop, the delay term is located in the denominator of the transfer function. As a consequence, the characteristic equation has an infinite number of roots.
Numerous works have addressed the control of delayed systems in continuous time; for example, some authors propose representing the delay as a rational function by using Taylor, Bessel, or Padé approximations [7,8,9]. Others propose strategies based on classical controllers such as Proportional (P), Proportional-Derivative (PD), Proportional-Integral (PI), and Proportional-Integral-Derivative (PID); see, for example, [1,10,11,12,13].
On the other hand, when a digital control is implemented, the process to be controlled should be discretized. In the particular case of a discretization by using a zero-order hold (ZOH) of the delayed system, the delay term yields n poles at the origin, where n is an integer and must satisfy , where T is the sampling period and is the time delay. This approach allows designing a digital controller using any classical technique in the discrete domain (for instance, P, PD, PI, or PID controllers). However, some robustness problems can occur when the delay of the system differs from the model. Another way to use a discrete model of the system, as mentioned above, is to perform a discrete analysis of the transfer function together with the controller by leading the sampling time in the analysis (or equivalently ) to get stability conditions in continuous time [14,15].
From a different perspective, the control of the delayed system has been treated by using the well-known Smith Predictor (PS) [16]. This strategy estimates a signal before being delayed, and later this estimated signal is used to apply the control to the delay-free system. However, the main limitation of this strategy is that it only allows the treatment of stable systems. Therefore, numerous modifications have been developed in the structure of the PS. Some modifications of the PS for unstable systems with delay are presented by [17,18,19,20,21,22,23]. Recently, in [24], an observer–predictor is presented for the case of one, two, and even three unstable poles with time delay. In particular, the stabilization for a system with one unstable pole, several stable poles, and time delay, the same kind of plant as that analyzed in the present work, is discussed. Stability conditions with respect to the time delay are given based on the use of an observer–predictor scheme and a PID-type controller.
In this work, an observer–predictor control scheme for high-order delayed systems with an unstable pole and several stable poles is proposed. For the convergence of the observer–predictor, a special injection scheme is considered, which is discretized, and later the stability condition of the system in continuous time is obtained under the consideration of a sampling period , with (or equivalently when ).
Special attention is given to the case of a delayed unstable second order (one stable and one unstable pole) because it is a system commonly treated in the literature [21,25,26,27]. Later, the proposed control strategy is generalized to high-order unstable systems with delay. The proposal presented here improves the size of the delay that can be controlled compared to some related works found in the literature, such as [14,24,27,28]. It is important to highlight that the observer–predictor structure proposed in the present work allows stabilizing the kind of systems previously mentioned with a larger delay than the observer–predictor control proposed in [11,24]. This improvement is achieved due to the fact that the new proposed observer–predictor in the present work has a different structure, as well as the fact that it has two free parameters for the design of the observer. Moreover, necessary and sufficient conditions are presented for the proposal in contrast with some strategies found in the literature, where necessary and/or sufficient conditions are not derived [19,29].
This paper is organized as follows. Section 2 describes the kind of system to be studied. In Section 3, the necessary preliminary results are shown; these results will be used later in the main results of this paper. Section 4 presents the main results, that is, the estimation strategy and the design of the control strategy. In Section 5, the step tracking and step disturbance rejection of the proposed scheme is analyzed. In Section 6, a robustness analysis with respect to uncertainty in the time delay is presented. In Section 7, three simulation examples implemented in Matlab-Simulink software illustrate the performance of the proposed strategy and finally, conclusions are presented in Section 8.
2. The Class of Systems
Consider the class of linear Single-Input Single-Output (SISO) system with input/output delay given with
where
Let us define the product as with , and . with . and are the input and output signals respectively, is the constant known delay, is the position of the unstable pole, , for ; is the gain of the system and is the delay-free transfer function. Note that in system (1) only real poles are considered.
A traditional control strategy based on a unitary feedback output of the form,
produces a closed-loop system given by,
where the term located in the denominator of the transfer function in Equation (4) leads to a system with an infinite number of poles and, therefore, the stability analysis is complicated to carry out, and the design of the controller should be carefully analyzed.
3. Preliminary Results
Next, the stability condition for the system (1) using a PID controller is given.
Lemma 1
([11]). Consider the system given in (1), the PID type controller given by
and a control law with as a new input reference. Then, there exist , , and such that the closed-loop system is stable if and only if .
Lemma 2.
Proof.
This result is a particular case of Lemma 1, by considering a delay term equal to zero. □
In this paper, it is assumed that system (1) can be stabilized using a PID controller for , i.e., the condition given in Lemma 2 is satisfied.
4. Main Results
Before providing the estimation strategy, a result that establishes the stability conditions for the injection scheme shown in Figure 1 is presented. This result will be used later in the proof of the convergence of the proposed observer.

Figure 1.
Proposed injection scheme.
Lemma 3.
Proof.
The proof of this lemma is presented in Appendix A. □
For future reference, consider a state space representation of the system (1) with , given as
Therefore, a closed-loop state space representation (related to the closed-loop transfer function (6)) considering of the output injection shown in Figure 1 can be written as
On the other hand, consider a state space representation of the system (1) with considering given with
Thus, by using (9), a closed-loop state space representation of the closed-loop transfer function (6) or equivalently the output injection shown in Figure 1 can be written as
Remark 1.
The parameters of the injection scheme depicted in Lemma 3 are presented in the following result.
Corollary 1.
Proof.
The proof of this corollary is presented in Appendix B. □
4.1. Estimation Strategy
The proposed observer–predictor scheme for system (1) is presented in Figure 2. The following results present the convergence conditions for two cases:
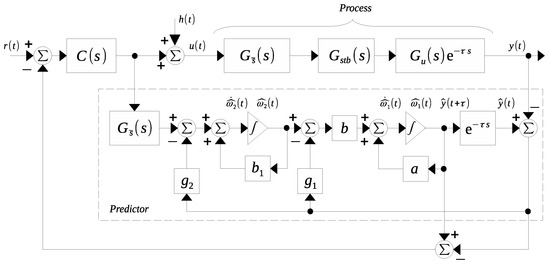
Figure 2.
Proposed observer–predictor scheme.
- (i)
- unstable delayed second order ().
- (ii)
- unstable delayed higher order ( with ).
A state space representation of system (1) considering is given with
Theorem 1.
Proof.
Defining the prediction error as , where and the estimate of the output error as , it is possible to describe the behavior of the dynamic error signal error ,
Whether as in (16) depends on the stability of the dynamics depicted by (16). Notice that if the dynamic error (16) is stable and the initial conditions of the error are different from zero, the corresponding trajectories of the error as . In this way, consider now a state-space realization of the system given by (8). It is clear that the stability condition for system (8) given in Lemma 3 (see Remark 1) is the same as the prediction error given in (16) since both systems have equivalent dynamic behaviors. Therefore, the condition for the convergence of the observer is . □
Now, to extend these results about the design of the observer to a more general class of systems, consider an unstable delayed higher order system given by (1) ( with ) with its state space representation given by
where , , , and .
The following result presents how to extend the result of the proposed observer scheme in Theorem 1 to a system given by (1).
Theorem 2.
Proof.
The proof of this theorem is similar to the proof of Theorem 1. Define the prediction errors as , where , , and the estimate of the output error as . Then, the behavior of the dynamic error signal is described by
4.2. Controller Design
Previously, the convergence of the prediction stage was ensured. Thus, designing the controller based on the estimated variables is possible. Therefore, in what follows, the stability conditions based on the observer for the closed-loop system are stated.
Theorem 3.
Proof.
The adequate convergence of the observer is provided by Theorems 1 and 2: for systems (13) or (17), respectively. Additionally, by using the separation principle for linear observers, a controller can be designed by using the estimated variable as if the variable were taken from the original system. Therefore, a PID controller stabilizing the transfer function without delay, , for both cases (13) or (17) can be found (see Lemma 2). Therefore the most restrictive condition between the convergence and control stages is the convergence stage, from which the conclusion of the theorem follows. □
4.3. Improved Stability Conditions
Considering a partition of the time delay, it is possible to improve the stability conditions for some cases, [14]. In this way, the result presented in the previous sections can be improved as follows. Consider the system (1) with the time delay partition given by,
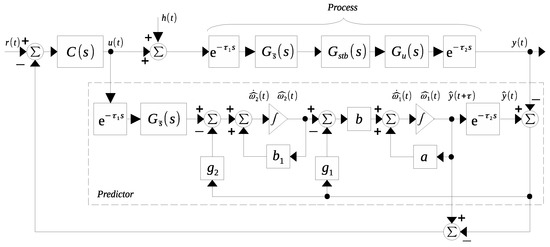
Figure 3.
Proposed observer–predictor scheme for longer delays.
Lemma 4.
Proof.
Note that Theorem 1 can be applied directly to a system with delayed input since the convergence of the observer is not affected by adding the delay term to the observer stage shown in Figure 3. That is, there are gains and such that if and only if . Invoking the principle of separation for linear observers, and based on the adequate convergence of , Lemma 1 can be applied considering the estimated signal to the design of the control stage. That is, there exists a control of type PID that stabilizes the system with the delay if and only if . Therefore, it can be concluded that the original time delay limit is . □
Corollary 2.
Proof.
Theorem 1 can be applied directly to the observer of Figure 3 since the convergence of the observer is not affected by the delayed input . Thus, there are gains and such that if and only if . Taking into account the principle of separation for linear observers and based on the convergence of , Lemma 1 can be applied to the control stage by considering the estimated signal . Then, there is a PID type control that stabilizes the plant with a delay if and only if . Therefore, it can be concluded that the original delay time limit is . □
Remark 2.
Since, in Lemma 4, the size of the delays and is bounded in the same proportion by convergence and control conditions, it is suggested to set the partition as and . For the case of Corollary 2, it is suggested to set the delay partition as since the proportion of the bounds in convergence and control conditions is different.
5. Disturbance Rejection and Tracking Reference
The control strategy for disturbance rejection and tracking reference is analyzed in this section. Note that once an adequate estimation is achieved, there can be proposed any control strategy for the delay-free system (1) (Theorem 3) or with a part of the time-delay (Lemma 4 and Corollary 2). To make the controlled system follow references and reject disturbances, both step types, the following PID control is used,
where , , and are the tuning parameters of the controller.
The control parameters in (22) are obtained considering the system (Theorem 3), using a root locus diagram for . It is recommended to locate the controller’s zeros in the left half-plane to ensure the existence of a region of stability. The control parameters can be obtained by using the root locus analysis and considering a damping factor of as a specification performance of the delay-free process transfer function.
5.1. Tracking Reference
The following result guarantees that the controller is able to generate a response allowing reference tracking.
Lemma 5.
5.2. Disturbance Rejection
The following result addresses the problem of rejecting disturbances.
Lemma 6.
Proof.
The transfer function in Figure 2 is
By applying the final value theorem to (25), one obtains
This shows that the scheme shown in Figure 2 is able to reject step-type disturbances. □
Note that the design of the controller involved in the control strategy developed in Theorem 3 is carried out by using the delay-free system . However, in the proposals of Lemma 4 and Corollary 2, the controller must be carried out considering the delayed system . Therefore, for the latter case, the parameters of the PID controller corresponding to can be calculated using results related to Lemma 1. Furthermore, reference tracking and disturbance rejection issues, both of the step type, can be proven for the control strategies proposed in Lemma 4 and Corollary 2 by using a similar development as that presented in the proofs of Lemmas 5 and 6.
6. Robustness with Respect to Uncertainty in the Time Delay
In practice, a control strategy that provides stability with respect to the uncertainties of the model is desired. In this section, uncertainty with respect to the time delay is considered for the proposed control strategy.
Following [30], the robustness properties of the control strategy with respect to the time delay are analyzed. For this purpose, let us consider a characteristic quasi-polynomial of the form
where its stability properties are established as a function of the delay times and . Using the results presented in [30], it is possible to give a general framework for our particular case. Let T be the set of all points such that (Equation (27)) has at least one zero on the imaginary axis. Any is known as a crossing point, and T is the collection of all stability crossing curves. Consider now system (1) and the proposed scheme shown in Figure 2 with and given by (22), being the delay time at the observer, and being the delay time of the process. The closed-loop characteristic equation is given by
with
,
,
.
Note that the characteristic Equation (28) has form (27), so it is possible to identify the regions of such that is stable. Figure 4 shows a numerical example of the stable region for the characteristic Equation (28). This figure illustrates the interval of values such that the proposed observer-based controller remains stable for a nominal delay at the observer stage.
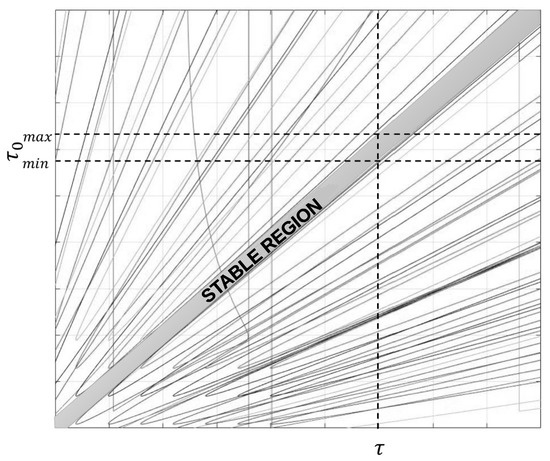
Figure 4.
Stability region for and for the characteristic Equation (28).
7. Simulation Results
7.1. Example 1
Consider the following system with delay, which corresponds to an unstable chemical reactor reported in [22],
In [22], a generalized predictor (GP) scheme is presented. The prefilters used in [22] are given by , , and which are derived from , , and , respectively, by considering a sampling time .
The GP scheme has performed better than many previous approaches, so the observer–predictor scheme presented in this work is compared with the GP scheme. For this example, , , and are the parameters of the process. Thus, using the observer–predictor scheme presented in this work, it is possible to stabilize the process given by (29) due to the condition of Theorem 1 being satisfied. Using the Corollary 1, the value is chosen; this value guarantees the estimation of the signal of interest. Additionally, to improve the output response, a two-degree-of-freedom controller is used, which is defined by where , with , , , , and .
For the simulation, a step-type input of amplitude 1, initial conditions for the plant state of and a perturbation acting at are considered. Figure 5 shows the output response of both strategies considering white noise effects; it is observed that both strategies show a stable, steady-state output. It is also important to note that the scheme proposed in this work improves the time to reach a steady state and shows better performance with respect to disturbance rejection.
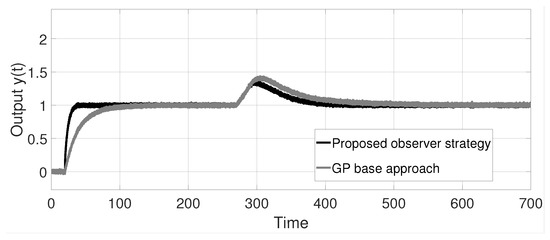
Figure 5.
System output response with perturbation of example 1.
In Figure 6, the behavior of the strategy reported in [22] and the proposed observer–predictor scheme under uncertainties in the plant are shown; the uncertainty is set at the unstable pole of the system with of its nominal value.
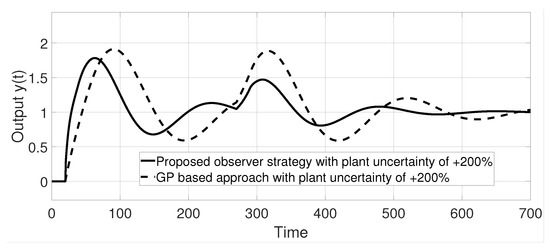
Figure 6.
System output response with uncertainty in the plant of example 1.
Finally, Table 1 presents the evaluation results for different performance indicators: the integral quadratic error criterion (ISE), the integral of quadratic error multiplied by time (ITSE), the integral absolute error (IAE), and the integral of absolute error multiplied by time (ITAE). It is observed that the results of the quantitative evaluation of the strategy proposed in this work have better results in the performance indexes ITSE and ITAE for the control action and in the performance indexes ISE, ITSE, and ITAE for the output signal (nominal values) with respect to the work presented in [22]. For simulations where uncertainties in the plant are considered, the evaluation results show that the proposed observer–predictor scheme performance indexes ITSE, IAE, and ITAE are better in the control action ; likewise, for the output signal it is observed that in all the performance indexes, the proposed strategy presents minor error magnitude with respect to [22].

Table 1.
Comparative table of quantitative evaluation of the two strategies of example 1.
On the other hand, Figure 7 shows the output responses of the proposed observer–predictor scheme and the Filtered Smith Predictor reported in [23] with its respective parameters given by , , and . It is observed that under non-zero initial conditions, the output response of the strategy presented in [23] is unstable, while the response of the observer–proposed scheme is stable.
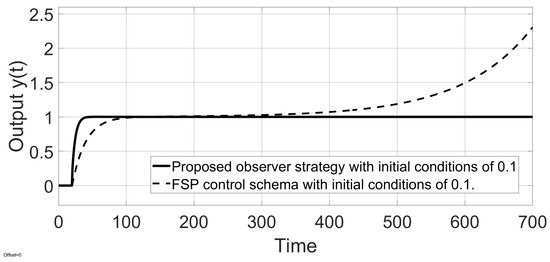
Figure 7.
System output response with uncertainty in the plant of example 1.
7.2. Example 2
Consider the unstable process with delay given by
For this example, , , , and are the parameters of the process. Thus, by substituting and in condition of Theorem 1, we obtain
This means that the maximal delay-time size allowed by the proposed control strategy is , and since the delay time of the process () is less than this bound, therefore the proposed control strategy can stabilize this process. Then, Corollary 1 can be used to obtain the values of and . For the simulation, and are used. Further, for the simulation experiment, the parameters of the control given by (22) are chosen as , , and . An initial condition of 0.1 is used for each of the plant states. A step input reference, , with an amplitude 5, is set. Figure 8 shows the behavior of the estimation error, and we see that in the steady state.
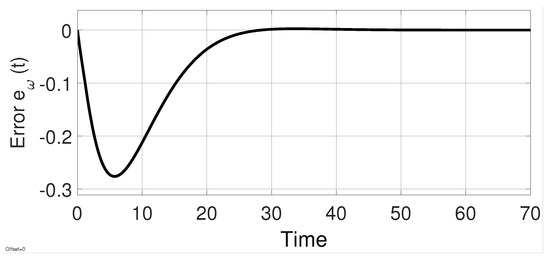
Figure 8.
Convergence of the estimated signal from example 2.
To test the robustness with respect to uncertainty in the delay time, the analysis presented in Section 6 is used. The interval of time delays that guarantees closed-loop stability is given by where the nominal value of the delay is . This is shown in Figure 9. Figure 10 shows the response of the system to uncertainties in the model parameters, and it can be seen that the system is stable with a parameter greater than of its nominal value of the unstable pole. Figure 11 shows the response in which the tracking of the steady state reference can be observed. Likewise, it shows that the system is robust to some uncertainty with respect to the nominal delay ().
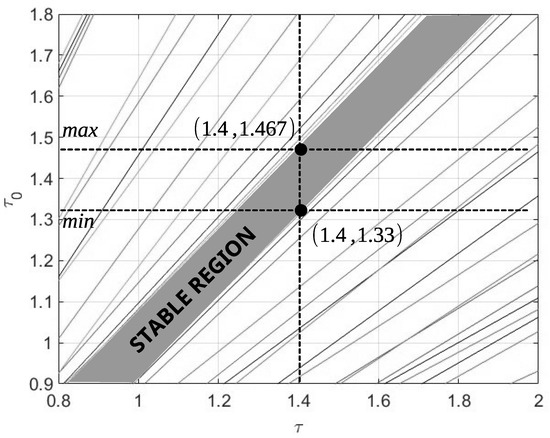
Figure 9.
Stability region for and for example 2.
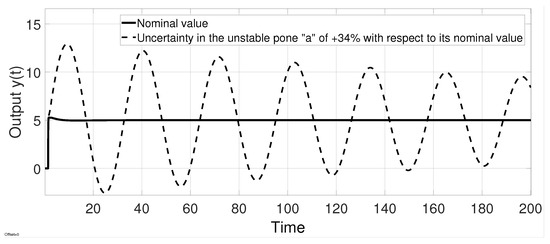
Figure 10.
Output response to plant uncertainty in example 2.
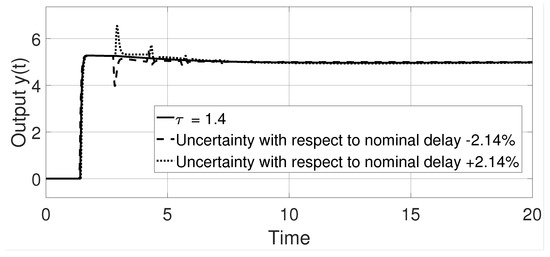
Figure 11.
Output response in example 2.
Finally, Figure 12 shows the output response when white noise effects are considered at the output. In this figure, it can be observed that system stability prevails in the face of such effects.
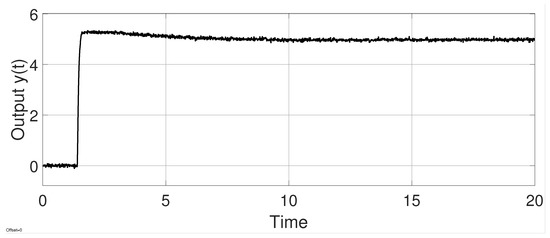
Figure 12.
Output response to noise effects of example 2.
7.3. Example 3
Consider the unstable high-order system with delay previously studied in [19],
In [19], an Active Disturbance Rejection Control (ADRC) is presented with a two-degree of freedom scheme. The proposed control and observer gains for the ADRC are and . Likewise for the two-degree of freedom strategy, the controller and are proposed.
On the other hand, for this example, , , , , and are the parameters of the process. Considering the observer–predictor presented in this paper, the stability condition given in Theorem 3 is , which is satisfied. Using Corollary 1, we calculate the values of and . In this example, the values of and are used. For the control given by Equation (22), the parameters used are , , and .
Additionally, in order to achieve a better response, a two-degree of freedom controller of PID type [31] defined by is considered, where , with , , , , and .
For the simulation, a unitary step input reference and a perturbation of the actuators at 40 s is used. The output response of the control scheme proposed in [19] and the output response of the observer–predictor scheme presented in this work are shown in Figure 13 to noise effects. It can be seen that in the presence of a perturbation acting at 40 s, both strategies allow perturbation rejection and reference tracking. It is important to highlight that in [19], necessary and sufficient conditions are not provided to stabilize systems with time delay, while in the observer–predictor presented in this work, it is possible to control the system of example 2 with a delay .
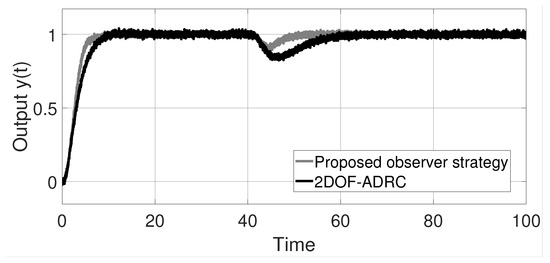
Figure 13.
Output response to noise effects of example 3.
Figure 14 shows the output response under an uncertainty in the delay . It can be seen that with a delay uncertainty of , both strategies still have a stable output response. However, at a delay uncertainty of , it can be seen in Figure 15 that the strategy presented in [19] is no longer stable, while the proposed observer–predictor scheme preserves a stable response. Figure 16 shows the control signal response under an uncertainty in the delay .
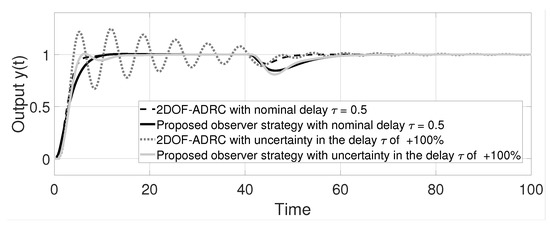
Figure 14.
Stable system output response with time delay uncertainty of example 3.
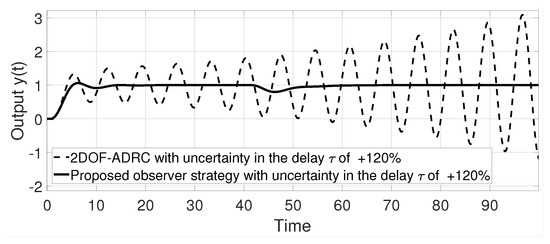
Figure 15.
Output response of example 3.
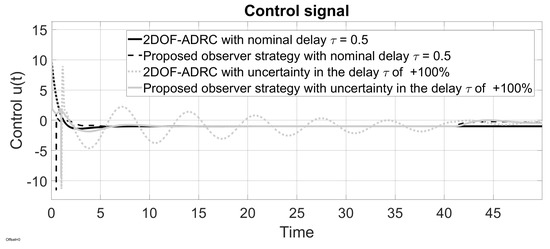
Figure 16.
Control response of example 3.
Finally, Table 2 shows the evaluation results for different performance indices. It can be observed that the observer–predictor scheme presented in this work has better performance indexes in the ITSE, IAE, and ITAE for the control action and ISE, ITSE, IAE, and ITAE indexes for the output signal (nominal case) with respect to the work reported in [19]. When a delay-time uncertainty is considered in the system, the proposed observer–predictor scheme has better performance indexes ITSE, IAE, and ITAE in the control action and the indexes ISE, ITSE, IAE, and ITAE for the output signal with respect to the work presented in [19].

Table 2.
Comparative table of quantitative evaluation of the two strategies of example 3.
7.4. Practical Contributions
In this section, we highlight some of the major practical contributions of the proposed control strategy developed in this work.
- When theoretical results (such as those provided in the present manuscript) are taken in order to implement real-practical experiments, it is very important to know quickly if the theoretical proposed control strategy can be used for solving the stability problem or not. In this way, providing necessary and sufficient conditions for the existence of the stabilizing control strategy allows one to obtain this information immediately by making simple computations of the stated conditions. This facilitates the task of the control design for the engineers, in contrast with control strategies that are developed under heuristic methods or just present necessary or sufficient conditions.
- In general, the time-delays phenomenon due to measurement of variables, material transportation, or teleoperation complicates the design of control strategies, however in the particular case when the size of time-delay is greater than the dominant dynamic of the system, the control design has an additional degree of complexity. This is because, under this situation, the time delay has greater adverse effects than the behavior of the controlled system when the delay time is small. As an example of this problem, there are many proposed control strategies [11,24] that are well performed for a “small” time delay, but these control strategies cannot be used for controlling systems with large delay terms. This problem is illustrated and partially solved in the new version of the work; see Example 3 (Figure 15). Therefore, in this work, it is possible to control systems with greater delay size with respect to previously reported works ([11,24]). For example, in [17], the maximum size of the delay is for a second order delayed system, in the present work, this bound is , i.e., the double of the previous delay size. This practical advantage allows the controlling of a greater variety of systems, ensuring closed-loop stability.
- In practice, a control strategy that provides stability with respect to the uncertainties of the model is desired. These problems arise mainly from model mismatching. In this way, analytical robustness with respect to time delay is developed in Section 6. Additionally, the proposed control strategy has been evaluated via simulations on face-to-model mismatching of the process, obtaining positive results such as the preservation of closed-loop stability under the adverse mentioned condition.
- Many industrial solutions (such as chemical engineering applications) require the regulation problem, which consists in keeping a variable at a desired value even in the presence of disturbances. In this way, the capability of a control system for tracking desired step-references and disturbance rejection is essential for solving the regulation problem. Thus, the results provided in Section 5 are related to this issue and illustrated in numerical simulations.
- The control action and the output measurable variable performances are qualitative and quantitatively evaluated using a numerical simulation; the control action can be seen as the spent energy of the control stage to achieve the stabilization of the process, which is a very important issue from a practical viewpoint.
8. Conclusions
Dynamic systems with relatively large delays with respect to the dynamics of the system are tackled in this work. A control proposal based on a delay predictor (observer) scheme is presented. A fundamental part of this work focuses on achieving the convergence of the observer–predictor scheme. The approaches used in the study allow the obtaining of necessary and sufficient conditions for the convergence of the scheme presented. Using this scheme, it is possible to control systems with longer delays than those treated in previous works [11,24].
For example, in the [11] the maximum limit on the size of the delay is for a second order delayed system. In the present work, it is possible to exceed the aforementioned delay limit, reaching up to : as can be seen, the allowable size in the present proposal surpasses the previous condition by a factor of two. A similar improvement is achieved for high-order delayed plants. Finally, some results concerning tracking the reference in the steady state and the rejection of disturbances, both of the step types, are presented and validated via numerical simulations.
Author Contributions
Conceptualization, J.F.M.-R., L.A.B.-B. and A.U.-C.; methodology, J.F.M.-R., L.A.B.-B. and A.U.-C.; formal analysis, J.F.M.-R. and B.D.M.-C.; validation, R.J.V.-G. All authors have read and agreed to the published version of the manuscript.
Funding
This research received no external funding.
Data Availability Statement
Not applicable.
Conflicts of Interest
The authors declare no conflict of interest.
Appendix A. Proof of Lemma 4
Proof. Sufficiency. Let us consider the discrete model of (1) including a zero order hold and a sampling period with n∈ and the output injection strategy described by Figure A1 (or its equivalent in Figure A2). Then,
with and .

Figure A1.
Discretized injection scheme.

Figure A2.
Equivalent of the discretized injection scheme.
Under the assumption that has stable poles (previously assumed) and, as a consequence, also , the stability of (A1) only depends on the transfer function . In this way, the characteristic equation of is given by
This lemma can be proved by showing that all the roots of Equation (A2) are inside the unit circle if and only if when , or equivalently when .
The general idea of the proof is presented below. Later, a formal analysis using a root locus approach is presented.
Let us take , for simplicity and without loss of generality, in the analysis. Then, in the following steps, consider the root locus diagram generated by the characteristic Equation (A2).
Step 1. Assume and . When varies from zero towards positive values, poles located at the origin move towards infinity: one pole moves in the direction of a breaking point located at the real axis, and the pole located at also moves from right to left on the real axis in the direction of to the breaking point, and for some values of , the trajectory enters the stability region (unit circle). These trajectories are depicted in Figure A3. In Figure A3, the gray points in the trajectories indicate the location of the roots for a specific value of , denoted by . Notice that the pole on the right real axis () does not move since has no influence on this pole.
Step 2. With and variable. This step is explained by using Figure A4 when varies from zero towards positive values, the pole located at is involved in the locus of the roots, which moves from left to the right on the real axis, causing a breaking point with the relocated pole (originally the pole outside the unit circle) in step one. Note that under these circumstances, a breaking point inside the unit circle is obtained. Gray points in the trajectories in Figure A4 indicate the location of the roots for a specific value of , denoted by .
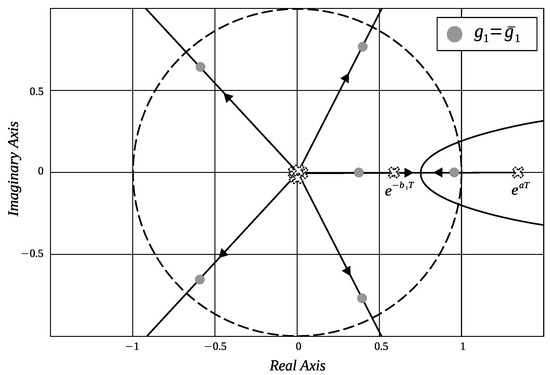
Figure A3.
LGR with .
The facts depicted in Steps 1 and 2 suggest that it is possible to obtain and such that all the roots of the locus are inside the unit circle and therefore the discrete injection scheme shown in Figure A2 is stable.
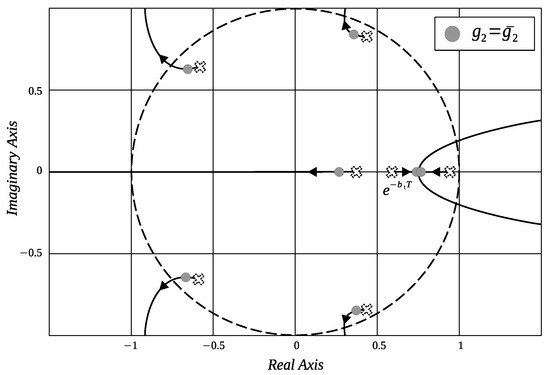
Figure A4.
LGR with .
Now, considering the previous developments, the breakpoint derived from the aforementioned analysis is calculated. Consider Step 2, where a breaking point is located in the real axis between the pole located at and the relocated pole that was moved into the unit circle in Step 1. Then, to achieve closed-loop stability, the breaking point should be inside the unit circle. Then, the location of the breaking point is calculated. This can be done by solving for from Equation (A1), and then its derivative is
The breakpoint of interest is obtained by calculating the roots of Equation (A3). Indeed, the breaking point of interest is one of the roots of the polynomial (A3). These roots are analyzed by considering that the parameter is variable. This allows studying the behavior of the roots of (A3) through a root locus diagram. Note that this root locus diagram does not depict the movement of the roots of the closed-loop injection scheme but the movement of the breaking points related to the system. Then, it is possible to associate a fictitious closed-loop system with Equation (A3). Let us consider an open loop system given by
With proportional action, , it is possible to obtain the closed-loop system given by
Then, in this new fictitious system (A5), it is possible to analyze the behavior of the breaking points. Taking into consideration an analysis of the locus of the roots for the system (A4) with as a variable parameter, Figure A5 shows that there exists a breaking point between the pole located within the unit circle and the pole located outside.
The location of the breaking point is obtained by solving for from the characteristic polynomial Equation (A5) and its corresponding derivative, provided by
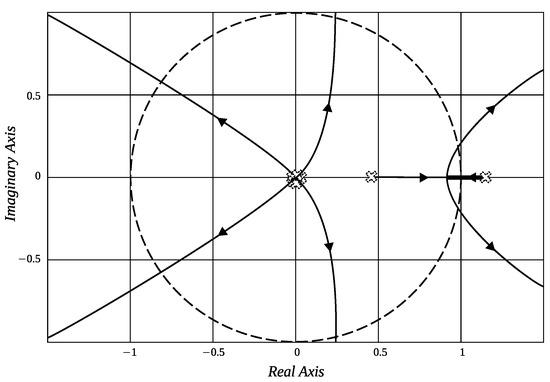
Figure A5.
LGR of the system (A5) by varying .
One of the roots of (A6), defining the behavior of the breaking point of interest, is given by
In order to get closed-loop stability in the scheme shown in Figure 1, the breakpoints derived from the fictitious system (A1) should be within the unit circle. Now, this issue is analyzed and ensured.
It is important to note that the approach used in this proof guarantee that the breakpoint falls within the unit circle when , or equivalently . This is with the intention of obtaining the stability conditions of the continuous time injection scheme shown in Figure 1. Therefore, we can obtain
From (A8), the breaking point is at the limit of stability. The key point is to determine if the breakpoint (A8) tends to one from the left or from the right. Note that when the limit of the Equation (A8) tends to 1 from the left, then the system has the breaking point within the unit circle, and therefore there is a stability region.
Let us assume that the condition in the limit (A8). This implies that the breaking point of interest is within the unit circle, and there exists a region of stability. Finally, to end the proof, it is important to demonstrate that roots of (A2) lie inside the unit circle assuming the condition . Then, considering the continuous case (, or equivalently, when ) for the characteristic Equation (A2), one obtains,
It is important to note that while two poles are close to , poles lie close to the point inside the unit circle.
Necessity.
Let us consider the open-loop transfer function,
with unstable poles. Then the closed-loop system (with ) is stable only if the polynomial has its roots in the open left half-plane (LHP), where m is the degree of .
Proof.
Let us consider the existence of stabilizing parameters and for the injection scheme. Consider a system (A10) with , , , , , and . Then has the same characteristic equation as (6). Thus, the stability of the injection scheme of Figure 1 implies that has stable roots. Then, the stability condition for the second-order polynomial implies that is a necessary stability condition for the injection scheme. □
Appendix B. Proof of Corollary 1
Assume that the stability condition of Lemma 3 is satisfied, i.e., . Then, in order to ensure the stability of the system (1) with the injection scheme presented in Figure 1, it is required to obtain the values of the parameters and of the system (A1). First, the value of is calculated. Consider a root locus of the fictitious system (A4) together with the proportional action (this can be seen in Figure A4), where the parameter that varies is . Since varies from zero to positive values, the roots move in such a way that there is a breakpoint between the pole located inside the unit circle and the pole located outside it, which is calculated in Equation (A7). Extending the analysis to the continuous case, in this case, the breaking point tends to one from the left, as can be seen in Equation (A8). Therefore, it is possible to obtain the value of by solving for in the characteristic equation of the fictitious system (A5) taking and . This procedure can be carried out as follows. First, the value of is given by
taking , one obtains
and taking the , it is found that
Since , the value of with the trajectories and/or poles inside of the unit circle has to be greater than this value, therefore the lower bound of is set as
for some .
Finally, to obtain the parameter , a similar procedure is performed. Consider a diagram of the locus of the roots associated with the closed-loop system (A1). It is possible to obtain the value of the parameter by solving for from the characteristic equation of the system (A1) taking and by applying . The procedure is developed as follows. First, the value of is
with ,
and considering , one obtains
Performing the same analysis as that used to obtain , the value of is given by
for some .
References
- Liu, T.; Zhang, W.; Gu, D. Analytical design of two-degree-of-freedom control scheme for open-loop unstable processes with time delay. J. Process. Control 2005, 15, 559–572. [Google Scholar] [CrossRef]
- Hernández, R.R.L. Análisis del Método MFSP (Múltiple Frames into Single Packet) para Contrarrestar Los Retardos en Los Sistemas Satelitales en Transmisión de Voip. 2009. Available online: https://bibdigital.epn.edu.ec/handle/15000/1908 (accessed on 16 April 2023).
- Romero-Galván, G. Análisis de Estabilidad Robusta para Sistemas Dinámicos con Retardo; Universidad Autónoma de Nuevo León: San Nicolás de los Garza, Mexico, 1997. [Google Scholar]
- Niculescu, S.I. Delay Effect on Stability: A Robust Control Approach; Springer: Cham, Switzerland, 2001. [Google Scholar]
- Delgado, D.C.; Rivera, J.L. Performance Study of Distributed Power Control Algorithms under Time-Delays and Measurement Uncertainty. IEEE Lat. Am. Trans. 2013, 11, 690–697. [Google Scholar] [CrossRef]
- Ailon, A.; Gil, M.I. Stability analysis of a rigid robot with output-based controller and time delay. Syst. Control Lett. 2000, 40, 31–35. [Google Scholar] [CrossRef]
- Gouaisbaut, F.; Peaucelle, D. Stability of Time-Delay Systems with Non-Small Delay. In Proceedings of the 45th IEEE Conference on Decision and Control, San Diego, CA, USA, 13–15 December 2006. [Google Scholar]
- Lizárraga Lizárraga, M.A. Approximation of Systems with Delay. Master’s Thesis, Centro de Investigación Científica y de Educación Superior de Ensenada, Baja, CA, USA, 2018; p. 68. [Google Scholar]
- Marquez-Rubio, J.F.; Pimentel-Medina, V.M.; Del Muro-Cuéllar, B.; Novella-Rodrıguez, D. Obtención de los parámetros de un observador de estados propuesto para sistemas con retardo. In Proceedings of the Congreso Nacional de Control Automático (AMCA), Puebla, Mexico, 23–25 October 2019. [Google Scholar]
- Silvia, G.J.; Bhattacharyya, S.P. PID Controller for Time-Delay Systems; Birkhuser: Boston, MA, USA, 2005. [Google Scholar]
- Lee, S.C.; Wang, Q.-G.; Xiang, C. Stabilization of all-pole unstable delay processes by simple controllers. J. Process. Control 2010, 20, 235–239. [Google Scholar] [CrossRef]
- So, G.-B. Design of Linear PID Controller for Pure Integrating Systems with Time Delay Using Direct Synthesis Method. Processes 2022, 10, 831. [Google Scholar] [CrossRef]
- Wu, Z.; Li, D.; Xue, Y. A New PID Controller Design with Constraints on Relative Delay Margin for First-Order Plus Dead-Time Systems. Processes 2019, 7, 713. [Google Scholar] [CrossRef]
- del-Muro-Cuéllar, B.; Márquez-Rubio, J.F.; Velasco-Villa, M.; de Jesús Álvarez-Ramírez, J. On the control of unstable first order linear systems with large time lag: Observer based approach. Eur. J. Control 2012, 18, 439–451. [Google Scholar] [CrossRef]
- Barragan-Bonilla, L.A.; Márquez-Rubio, J.F.; Del Muro Cuéllar, B.; Vázquez-Guerra, R.J.; Martínez, C. Observer-based control for high order delayed systems with an unstable pole and a pole at the origin. Asian J. Control 2023, 25, 1759–1774. [Google Scholar] [CrossRef]
- Smith, J.M. Close Control of Loops with Dead Time. Chem. Eng. Prog. 1957, 53, 217–219. [Google Scholar]
- Normey-Rico, J.E.; Camacho, E.F. Simple Robust Dead-Time Compensator for First-Order plus Dead-Time Unstable Processes. Ind. Eng. Chem. Res. 2008, 47, 4784–4790. [Google Scholar] [CrossRef]
- Rao, A.S.; Chidambaram, M. Enhanced Smith Predictor for Unstable Processes with Time Delay. Ind. Eng. Chem. Res. 2005, 44, 8291–8299. [Google Scholar] [CrossRef]
- Fu, C.; Tan, W. Control of unstable processes with time delays via ADRC. ISA Trans. 2017, 71, 530–541. [Google Scholar] [CrossRef]
- Xie, L.; Shieh, L.-S.; Tsai, J.; Guo, S.-M.; Dunn, A. Digital Redesign of Analog Smith Predictor for Systems with Long Input Time Delays. J. Frankl. Inst. 2017, 354, 5797–5812. [Google Scholar] [CrossRef]
- İçmez, Y.; Can, M.S. Smith Predictor Controller Design Using the Direct Synthesis Method for Unstable Second-Order and Time-Delay Systems. Processes 2023, 11, 941. [Google Scholar] [CrossRef]
- Albertos, P.; García, P. Robust control design for long time-delay systems. J. Process Control 2009, 19, 1640–1648. [Google Scholar] [CrossRef]
- Rico, N.; Elias, J.; Fernández Camacho, E. Unified approach for robust dead-time compensator design. J. Process. Control 2009, 19, 38–47. [Google Scholar] [CrossRef]
- Cruz-Díaz, C.; del-Muro-Cuéllar, B.; Duchén-Sánchez, G.; Márquez-Rubio, J.; Velasco-Villa, M. Observer-Based PID Control Strategy for the Stabilization of Delayed High Order Systems with up to Three Unstable Poles. Mathematics 2022, 10, 1399. [Google Scholar] [CrossRef]
- Wang, Q.-G.; Cheng, X.; Lu, X. Stabilization of second-order unstable delay processes by pid controllers. IFAC Proc. Vol. 2006, 39, 19–24. [Google Scholar] [CrossRef]
- Seer, Q.H.; Nandong, J. Stabilization and PID tuning algorithms for second-order unstable processes with time-delays. ISA Trans. 2017, 67, 233–245. [Google Scholar] [CrossRef]
- Xiang, C.; Wang, Q.; Lu, X.F.; Nguyen, L.; Lee, T.R. Stabilization of second-order unstable delay processes by simple controllers. J. Process. Control 2007, 17, 675–682. [Google Scholar] [CrossRef]
- Márquez-Rubio, J.; del-Muro-Cuéllar, B.; Villa, M.; Ramírez, J. An improved sufficient condition for stabilisation of unstable first-order processes by observer-state feedback. Int. J. Control 2015, 88, 403–412. [Google Scholar] [CrossRef]
- Sanz, R.; García, P.; Albertos, P. A generalized smith predictor for unstable time-delay SISO systems. ISA Trans. 2017, 72, 197–204. [Google Scholar] [CrossRef] [PubMed]
- Gu, K.; Niculescu, S.; Chen, J. On stability crossing curves for general systems with two delays. J. Math. Anal. Appl. 2005, 311, 231–253. [Google Scholar] [CrossRef]
- Åström, K.J.; Hägglund, T. PID Controllers: Theory, Design, and Tuning; ISA—The Instrumentation, Systems and Automation Society: Pittsburgh, PA, USA, 1995. [Google Scholar]
Disclaimer/Publisher’s Note: The statements, opinions and data contained in all publications are solely those of the individual author(s) and contributor(s) and not of MDPI and/or the editor(s). MDPI and/or the editor(s) disclaim responsibility for any injury to people or property resulting from any ideas, methods, instructions or products referred to in the content. |
© 2023 by the authors. Licensee MDPI, Basel, Switzerland. This article is an open access article distributed under the terms and conditions of the Creative Commons Attribution (CC BY) license (https://creativecommons.org/licenses/by/4.0/).