Article

Multi-Dimensional Value Evaluation of Energy Storage Systems in New Power System Based on Multi-Criteria Decision-Making

1
State Grid Gansu Electric Power Company, Lanzhou 730030, China
2
State Grid Gansu Electric Power Research Institute, Lanzhou 730070, China
3
State Key Laboratory of Alternate Electrical Power System with Renewable Energy Sources, North China Electric Power University, Beijing 102206, China
*
Author to whom correspondence should be addressed.
Processes 2023, 11(5), 1565; https://doi.org/10.3390/pr11051565
Submission received: 20 April 2023 / Revised: 12 May 2023 / Accepted: 18 May 2023 / Published: 20 May 2023
(This article belongs to the Special Issue Application of Energy Storage Systems in Smart Grids)

Abstract

:
The power sector may reduce carbon emissions and reach carbon neutrality by accelerating the energy transition and lowering its reliance on fossil fuels. However, there are limitations on the new power system’s ability to operate safely and steadily due to the randomness, volatility, and intermittent nature of renewable energy supply. The key to solving this issue is to harness the flexible resources that energy storage systems (ESSs) represent; however, ESSs have more than a value for providing system flexibility. Thus, this study suggested a flexible, technical, economic, and environmental value index system based on multi-criteria decision-making models for evaluating the multi-dimensional value of ESSs. First, the objective and subjective weights are obtained using the CRITIC model and best–worst method; then, the weights are combined using the minimum relative entropy model. The complete values of five typical ESSs are then evaluated using the TOPSIS model. Three scenarios that reflect the traits of the new power system are then created and analyzed. The outcome demonstrates the following: (1) as the new power system continues to grow, the value of ESSs’ flexibility has become ever more crucial; (2) as the need for system flexibility increases, the value of electrochemical ESSs gradually manifests.

1. Introduction

China, one of the major contributors to global greenhouse gas emissions, has pledged to meet its peak carbon emissions by 2030 and to work toward becoming carbon neutral by 2060 [1]. As the main source of carbon emissions, about 40% of China’s total emissions of carbon dioxide are produced by the power industry [2]. Therefore, building a new power system with renewable energy as the main body is a crucial step and measure for China to take in order to reach its carbon neutrality target.
However, the need for regulation capacity in the new power system is gradually growing as a result of the randomness, volatility, and intermittent nature of renewable energy generation [3]. The gap in system regulation capacity is widening as a result of the installed scale of traditional regulation resources with high carbon attributes. In order to contribute to the balance of the power system, more novel flexible regulation resources are required, such as energy storage systems (ESSs) with low carbon properties, big regulation ranges, quick regulation speeds, and long duration [
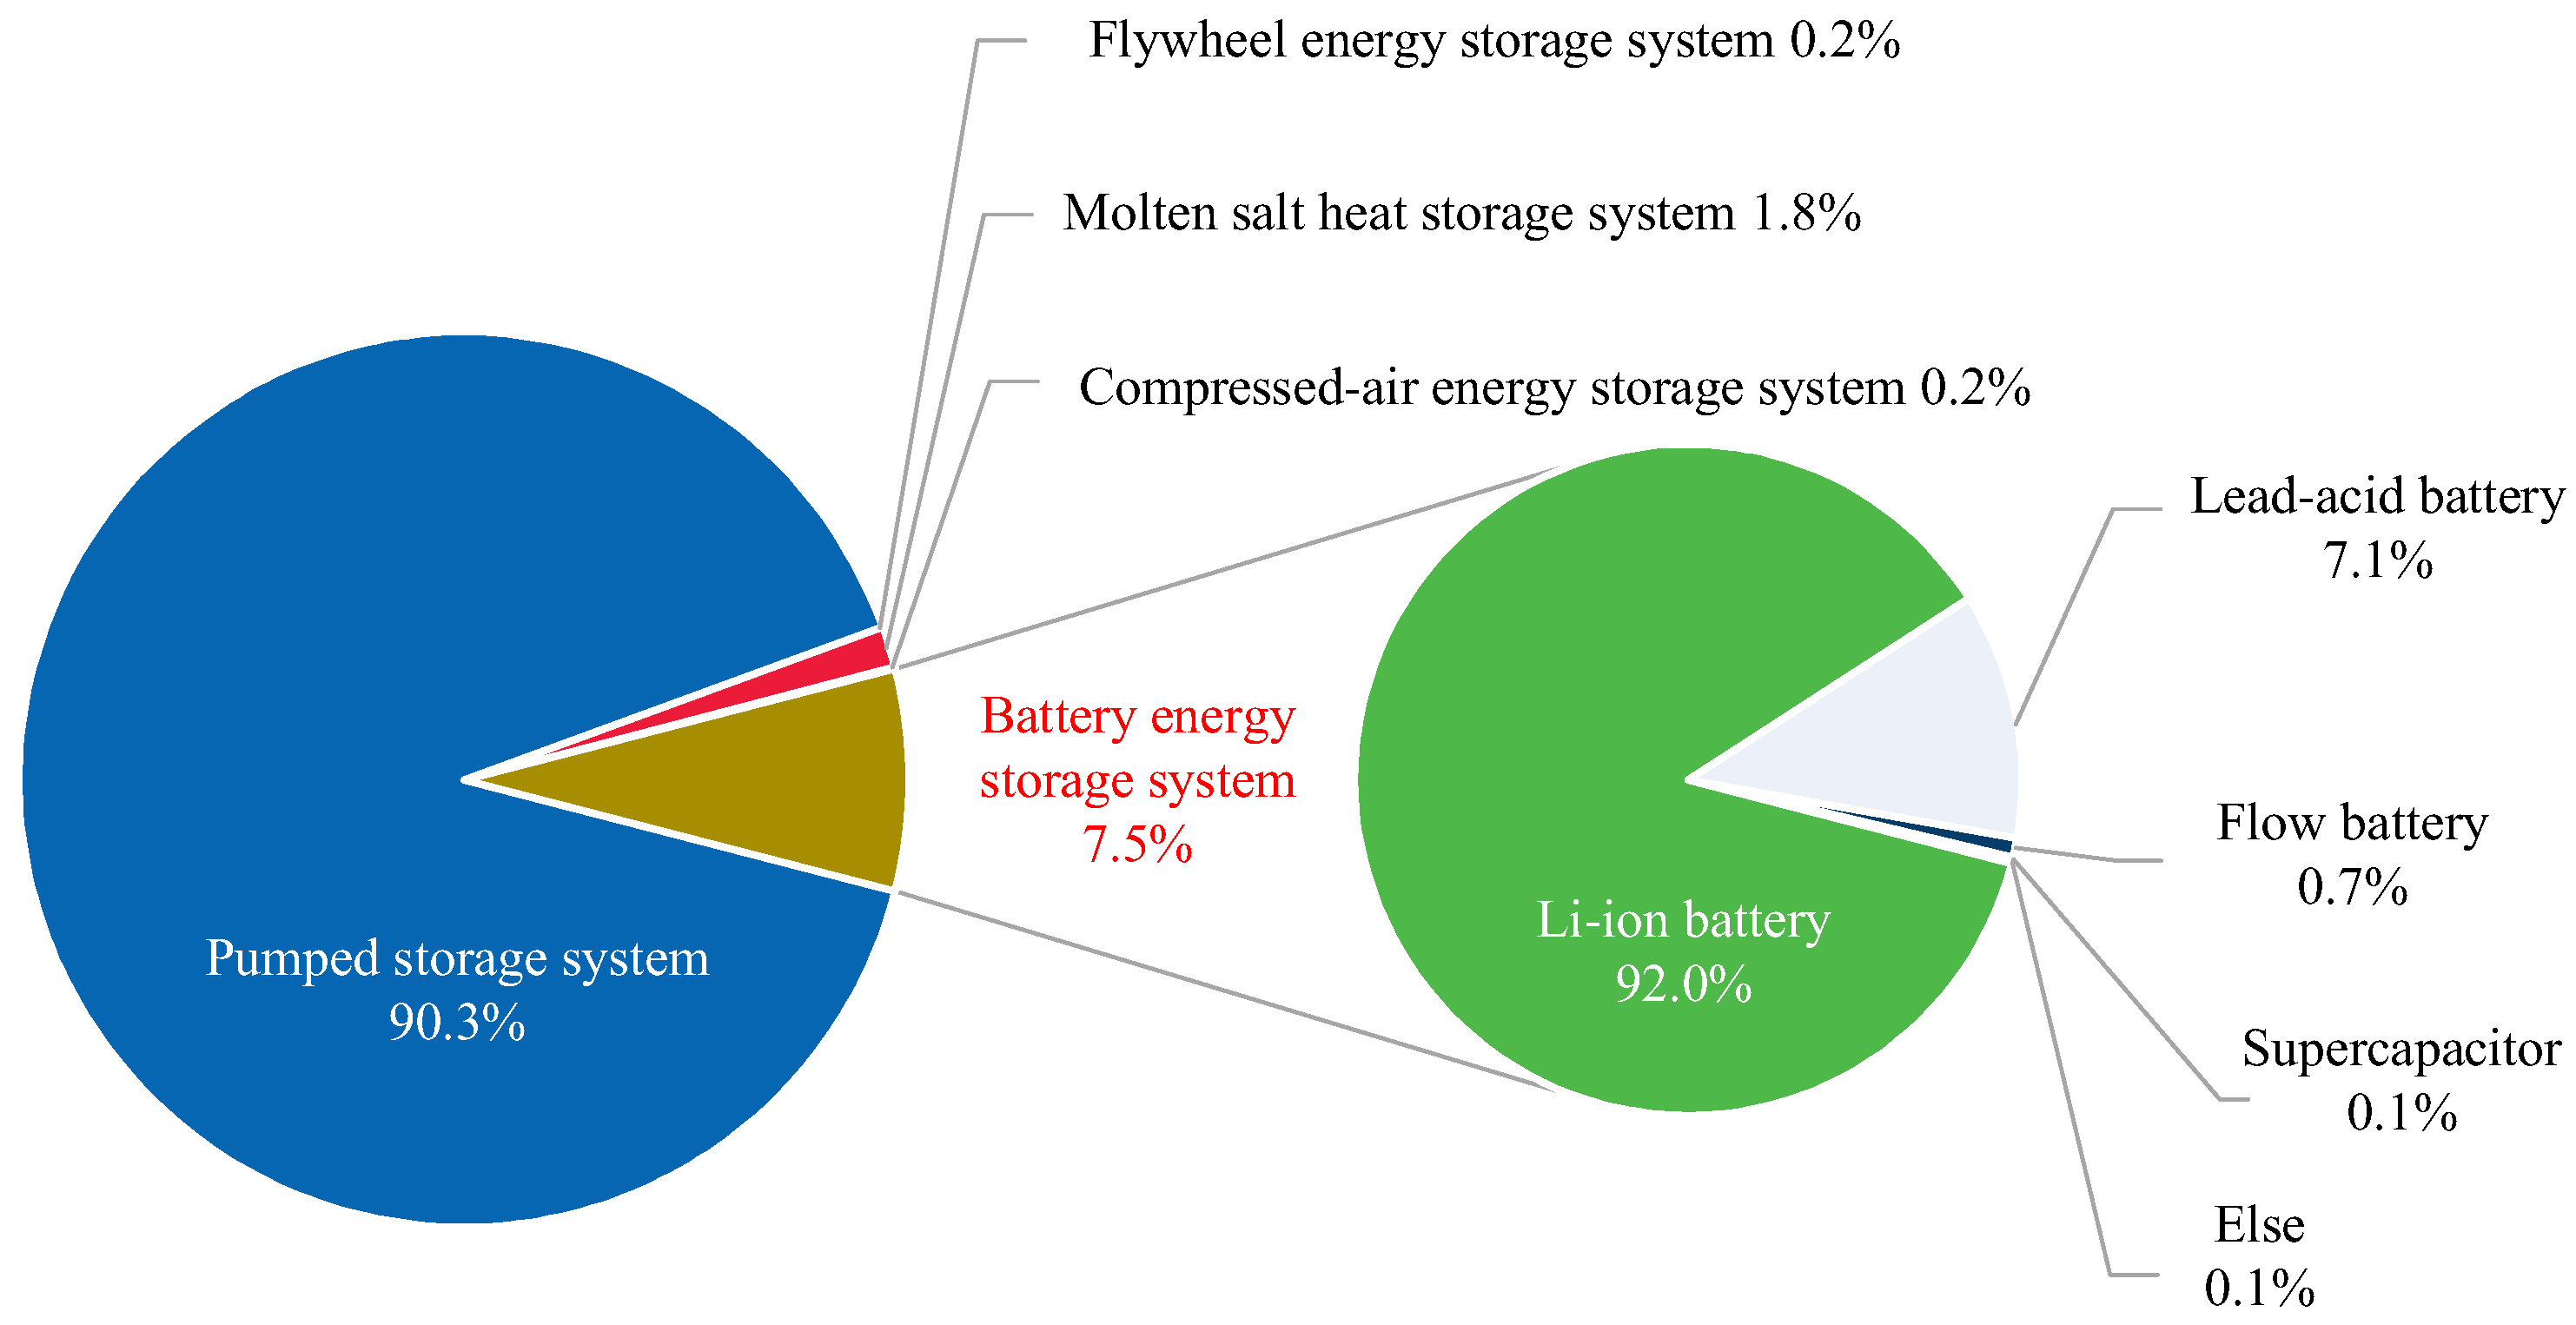
4]. By 2020, China’s installed ESSs’ capacity totaled 35.1 million kilowatts, accounting for 18.5% of the global ESSs’ installed capacity. In China, the battery energy storage system (BESS) is the second-largest ESS, followed by the pumped storage system (PSS), which accounts for 90.3% of all ESSs usage (DOE Global Energy Storage Database: https://sandia.gov/ess-ssl/gesdb/public/ (accessed on 14 March 2023)). Figure 1 depicts the classification and installed capacity of China’s ESSs in 2021.
Scholars have long been interested in the research on ESSs, which includes topics such as location planning [5], capacity planning [6], and optimal operation [7]. However, an increasing number of researchers have discovered that the conventional cost-oriented ESSs study primarily examines financial gains and does not provide a thorough examination of the multidimensional value of ESSs [8]. As a result, some researchers study ESSs from a value-driven perspective. From the standpoint of environmental value, ESSs can successfully lower the system’s carbon dioxide emissions [9], improve the utilization efficiency of clean energy [10], and increase the utilization rate of intelligent environment-friendly equipment [11]. From the perspective of economic value, ESSs can help realize peak-valley arbitrage [12] and lessen the system’s energy loss by storing electric energy during the valley period and releasing it during the peak period [13]. Additionally, the ESS’s capacity for charging and discharging can ensure the power system’s instantaneous power quality [14] and power balance [15]. This adds a great deal of flexibility to the power system. The aforementioned research, however, mostly focuses on the single value of ESSs or the optimization of pursuing a small number of goals, making it impossible to fully assess the multi-dimensional worth of ESS.
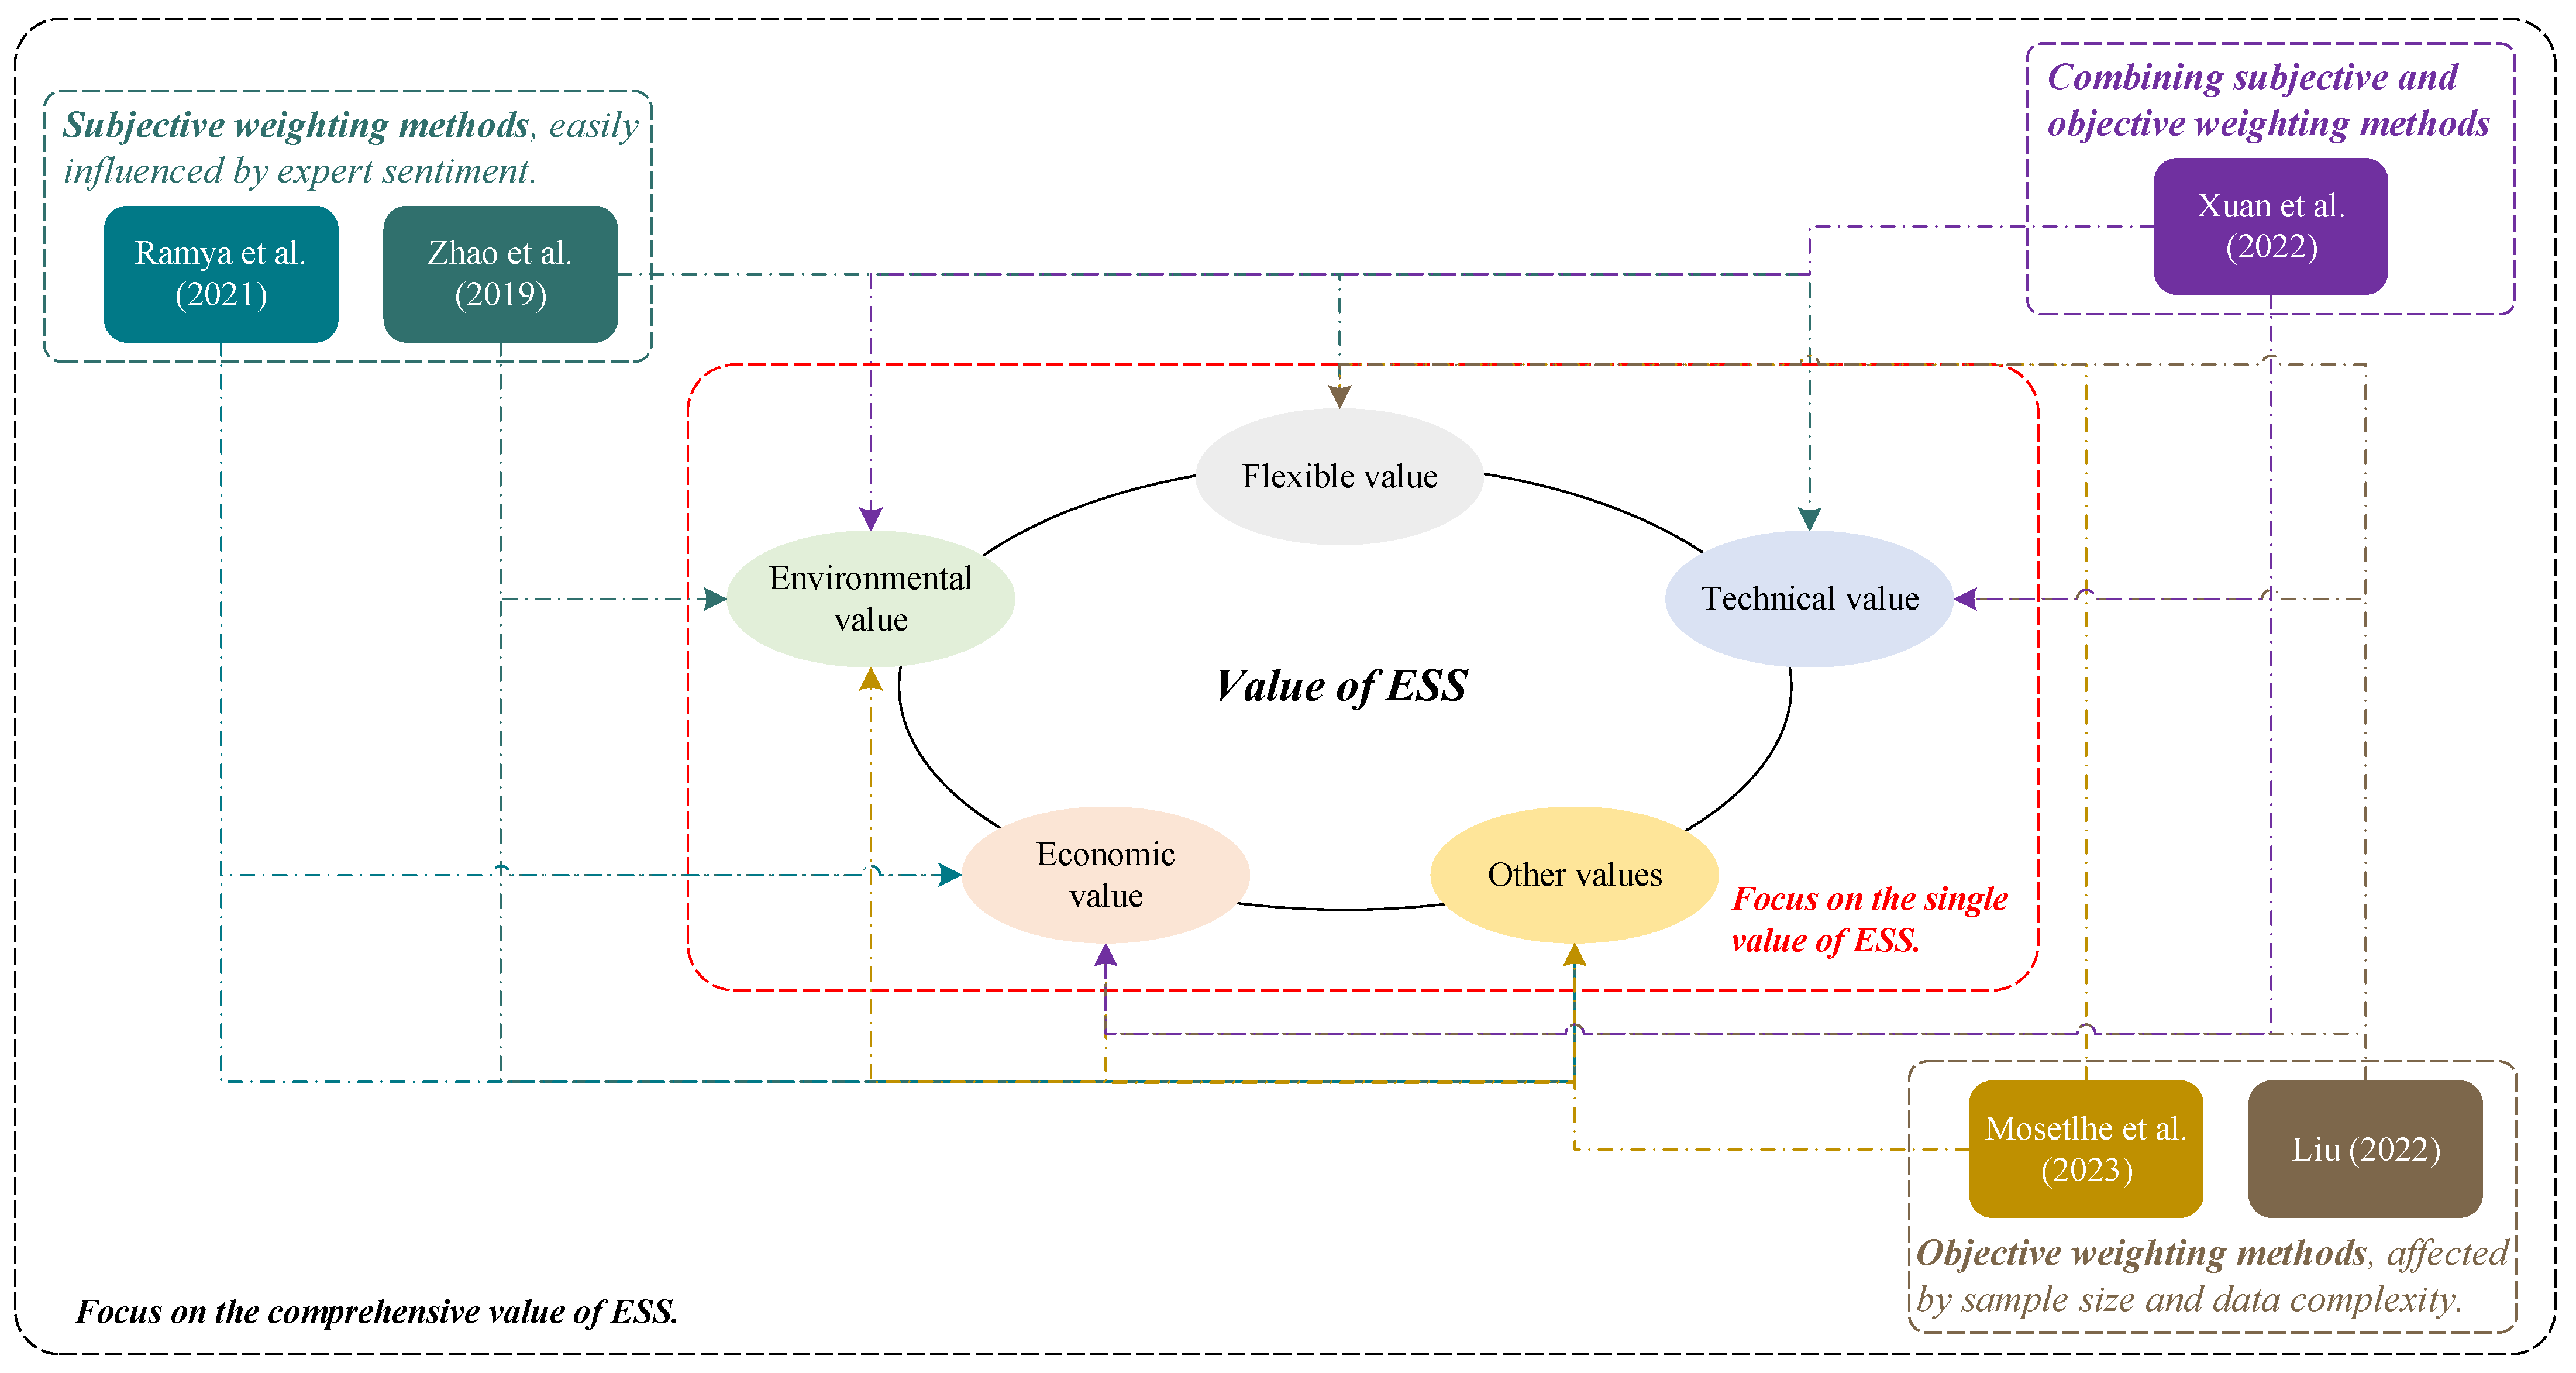
Some researchers developed multi-criteria decision-making (MCDM) models to assess, thoroughly and methodically, the multi-dimensional value of ESSs in order to address the aforementioned issues. Zhao et al. [16] proposed a comprehensive evaluation strategy for the value of BESS based on the best–worst method (BWM) and fuzzy cumulative prospect theory (CPT). The result shows that the Li-ion battery overperforms the other types of BESSs. Ramya et al. [17] determined the best thermal ESS through the step-wise weight assessment ratio analysis (SWARA) and weighted aggregated sum product assessment (WASPAS). Through the constructed five-dimensional value evaluation model, the results show that the latent-heat ESS has the best performance. However, the methods used in the above literature are subjective weighting methods, which means that the results are easily affected by the subjective emotions of experts. Therefore, some scholars have introduced objective weighting methods. Mosetlhe et al. [18] adopted the Heuristic weighting model and TOPSIS–VIKOR approach to assessing the comprehensive value of PSS. Liu [19] used the entropy weight method (EWM) and gray relational analysis model (GRA) to evaluate the ESS based on the Internet of Things (IoT). However, the objective weighting method has higher requirements for sample size and data richness. Considering the differentiated characteristics of the above weighting methods, some scholars attempt to combine the two types of weighting methods. Xuan et al. [20] used the analytic hierarchy process (AHP) and information entropy method (IEM) to evaluate the values of ESSs in the integrated energy system. However, the AHP method used is complicated and has too many index comparisons, which will decrease the computation efficiency [21]. The indicators for comprehensive evaluation of ESSs’ value based on MCDM in the above literature are shown in Table 1, and the review of the above literature is shown in Figure 2.
The need for flexible resources such as ESSs in the new power system is growing as a result of the extensive integration of renewable energy sources. For increasing the effectiveness of energy usage, lowering economic losses, and maintaining the safe and stable operation of the power system, it is crucial to investigate the multi-dimensional value of ESSs. The three key features of this paper’s innovation and contribution are as follows:
(1)
In this study, a multi-dimensional value evaluation index system for ESSs is constructed from the viewpoints of flexible value, technological value, economic value, and environmental value. It is more thorough and comprehensive than the previous studies on the single value of ESS. In addition, various innovative metrics are taken into consideration, including response time and wind power curtailment rate.
(2)
Due to the different characteristics of the subject and object weighting methods, utilizing just one type of procedure for weighting can lead to unjustifiable indicator weights. The combined weighting method built on criteria importance though intercriteria correlation, best–worst method, and minimum relative entropy (CRITIC–BWM–MRE) that is suggested in this paper can avoid the subjective nature of subjective weighting methods and the onerous constraints of objective weighting methods on the data, leading to more reasonable weighting outcomes;
(3)
Previous studies have mostly relied on static analysis of a specific scenario to determine the overall value evaluation of energy storage. The positioning and demand of ESSs in power systems vary significantly depending on the scenario. In this paper, three scenarios that represent the various phases of the development of the new power system are designed. For each scenario, study and comparison are conducted to determine the overall value of various types of ESSs;
This paper is organized as follows. The introduction is elaborated in Section 1 and the multi-dimensional value evaluation index system for ESSs is constructed in Section 2. Section 3 mainly introduces the method applied in this paper and Section 4 presents the empirical analysis. The conclusion is presented in Section 5.

2. Multi-Dimensional Value Evaluation Index System for ESSs

A multi-dimensional value evaluation index system for ESSs is used to assess the comprehensive value of the system from four perspectives: flexible value, technical value, economic value, and environmental value. The indicators and instructions are as follows.
Flexible value
The main benefit of the ESS, which may be viewed as a flexible resource, is that it gives the system some regulatory capabilities that can be used to solve problems such as the generation deviation of renewable energy sources and frequent unit breakdowns. Response time (C1) and response capability (C2) are chosen as the two indicators for assessing the flexibility of ESSs [22], of which the response capability can be expressed as follows:
R C E S S = t = 1 T ( min { r c t , s r r t } ) ,
where R C E S S represents the response capability of ESS, r c t represents the rated capacity of the ESS at time t , and s r r t represents the system regulation requirements at time t . In this paper, s r r t is approximated as the regulatory demand caused by bias in renewable energy generation prediction.
Technical value
While the flexible value concentrates on the function of the ESS in the power system, the technical value highlights the technical and material properties of the ESS itself. Power density (C3) and energy density (C4) are the main technical characteristic indicators of ESSs [23]. Whereas the former relates to the quantity of energy stored per unit weight of the device; the latter denotes the pace at which a unit-weight device discharges its stored energy. Energy conversion efficiency (C5) is another important element that reflects the technological worth of ESS.
Economic value
Another important thing to consider is the economic value of the ESS in addition to its flexibility value and technical value. In other words, even if ESSs have strong technical response characteristics and flexibility, they nonetheless need to have a relatively lower cost. Thus, unit power cost (C6) and cycle life (C7) are chosen to present the economic value of the ESS [24].
Environmental value
When renewable energy generation exceeds expectations and is prone to waste. The ESS can store this portion of electricity, thereby reducing wind power abandonment rates (using wind power as an example), Hence, the wind power curtailment rate (C8) is chosen to present the environmental value of the ESS [25].
The multi-dimensional value evaluation index system for ESSs is shown in Figure 3.
Considering that all the indicators selected are quantitative, both objective and subjective weighting methods can be applied in this paper. If qualitative indicators exist, only subjective weighting methods can be used.

3. Methodology

3.1. Indicator Weighting Model

3.1.1. CRITIC Method

Among all the objective weighing techniques, the coefficient of variation (CV) approach and the entropy weight method (EWM) are commonly used due to their simple operation and few steps. The CV method’s foundation, however, is that each indicator is equally significant, which is illogical [26]. The EWM cannot take into account index correlation because it requires the indicators to follow the normal distribution [27]. As opposed to the aforementioned subjective weighting models, CRITIC proposed by Diakoulaki in 1995 fully takes into account the comparative strength and conflict of indicators, which is more reasonable and superior [28,29]. The steps are as follows:
Step 1: Initial decision matrix construction and normalization.
Suppose that there are n evaluation subjects and p evaluation indicators. Then, the initial decision matrix can be expressed as X = ( x 11 x 1 p x n 1 x n p ) .
For performance-type indicators (the larger the better), the indicators can be normalized by Equation (2):
x i j = x j x min x max x min .
For cost-type indicators (the smaller the better), the indicators can be normalized by Equation (3):
x i j = x max x j x max x min .
Step 2: Calculate the indicator variability.
Commonly, the standard deviation is used to represent the fluctuation of the internal values of each indicator. The larger the standard deviation, the greater the indicator variability and the higher the indicator weights. The standard deviation can be expressed as follows:
S j = i = 1 n ( x i j x ¯ j ) 2 n 1 ,
where S j represents the standard deviation of the j -th indicator, and x ¯ j represents the mean value of the j -th indicator, which can be calculated by Equation (5):
x ¯ j = 1 n i = 1 n x i j .
Step 3: Calculate the indicator conflict.
The correlation coefficient is used to represent the correlation between indicators. The stronger the correlation with other indicators, the less conflicting the indicator is with other indicators. Meanwhile, the indicator weight is lower. The correlation coefficient can be expressed as follows:
r ( x , y ) = cov ( x , y ) σ x σ y = i = 1 n ( x i x ¯ ) ( y i y ¯ ) i = 1 n ( x i x ¯ ) 2 i = 1 n ( y i y ¯ ) 2 .
Then, the indicator conflict can be expressed as follows:
R j = i = 1 n ( 1 r i j ) ,
where R j represents the indicator conflict.
Step 4: Calculate the information content.
The information content of the j -th indicator can be expressed as follows:
C j = S j × R j ,
where C j represents the information content.
Step 5: Calculate the indicator weights.
The object weight of the j -th indicator can be expressed as follows:
W j = C j j = 1 p C j ,
where W j represents the object weight of the j -th indicator.

3.1.2. Best–Worst Method

The subjective weighting method AHP can decompose complex decision-making problems into multiple independent levels, and it is widely used in many fields. However, due to insufficient consideration of the correlation between indicators [30] and the uncertainty of expert decision-making [31], some scholars have proposed some improved algorithms, such as fuzzy AHP and analytic network process (ANP). However, the above improvements still retain the characteristics of n ( n 1 ) / 2 comparisons of the traditional AHP model.
In 2015, Rezaei [21] first proposed the BWM model, which can improve the computation efficiency of indicator weighting (the BWM model only needs 2 n 3 comparisons). The core principle of BWM is to determine the optimal and worst indicators and compare the importance of each indicator with the optimal and worst indicators [32]. The steps of BWM are as follows:
Step 1: Determine the best indicator and worst indicator.
Several experts and scholars engaged in related field research are invited to form an expert group. Each expert should determine the best and worst indicators of the above eight indicators { c 1 , c 2 , , c n } , of which the best indicator c B means the most important indicator and the worst indicator c W represents the most unimportant indicator.
Step 2: Construct the indicator importance comparison vector.
Compare the best indicator c B with other indicators c j , and use the numbers 1–9 to represent the importance between c B and other indicators c j , of which 1 means that the importance of c B is equal to c j , and 9 means that c B is much more important than c j . Then, the “Best-to-Others” importance comparison vector A B can be constructed as Equation (10):
A B = ( a B 1 , a B 2 , , a B n ) .
Similarly, the “Others-to-Worst” importance comparison vector A W can be constructed as Equation (11):
A W = ( a 1 W , a 2 W , , a n w ) .
Step 3: Obtain the optimal weights of indicators.
According to Ref. [33], the objective function is constructed to minimize the maximum absolute differences, as in Equation (12):
m i n m a x j { | w B w j a B j | , | w j w w a j W | }   s . t . { j w j = 1 w j 0 , j = 1 , 2 n .
Equation (12) can be further converted into Equation (13):
m i n ξ s . t .   { | w B w j a B j | ξ | w j w W a j W | ξ j w j = 1 w j 0 , j = 1 , 2 n .

3.1.3. Weight Combination Method Based on Minimum Relative Entropy

It is required to combine the two weights on the basis of obtaining objective weight and subjective weight. It is simple to disregard the model’s importance preference if the two are just arithmetic means [34]. As a result, the final weight in this study is determined using the MRE weight fusion method. The MRE model can be expressed as follows:
min F = j = 1 p [ W ( j ) ln W ( j ) W 1 ( j ) ] + j = 1 p [ W ( j ) ln W ( j ) W 2 ( j ) ] ,
where W 1 ( j ) represents the indicator weight determined by CRITIC method, W 2 ( j ) represents the indicator weight determined by BWM method, and W ( j ) represents the combination weight of indicators.
The Equation (14) can be converted into Equation (15) as follows:
W ( j ) = [ W 1 ( j ) W 2 ( j ) ] 0.5 j = 1 p [ W 1 ( j ) W 2 ( j ) ] 0.5 .

3.2. Comprehensive Evaluation Method

The two primary categories of comprehensive evaluation techniques are single scheme rating and multi scheme ranking. This work primarily focuses on the value comparison of several ESS, which is more appropriate in the latter case and excludes the use of techniques such as matter element extension. Hence, the TOPSIS model proposed by Hwang and Yoon in 1981 is adopted in this paper, which can rank the comprehensive value of different ESS. The steps of TOPSIS are as follows:
Step 1: Calculate the Euclidean distance between the evaluated object and the ideal solution.
Suppose the ideal solution { x 1 + , x 2 + , , x p + } and anti-ideal solution { x 1 , x 2 , , x p } . Then, the Euclidean distance between the evaluated object and the ideal solution can be expressed as follows:
y i + = j = 1 p w j ( x i j x j + ) 2 .
Step 2: Calculate the Euclidean distance between the evaluated object and the anti-ideal solution.
The Euclidean distance between the evaluated object and the anti-ideal solution can be expressed as follows:
y i - = j = 1 p w j ( x i j x j - ) 2 .
Step 3: Calculate the evaluation results. The lager the results, the higher value of the ESS.
C i = y i y i + + y i

4. Empirical Analysis

4.1. Scenario Setting

The building of new power systems faces significant difficulties due to the intermittent nature of renewable energy sources. The growth of renewable energy can be separated into three stages based on the various rates of penetration [35]. Accordingly, three ESS application scenarios are created based on these three steps, as shown in Table 2.
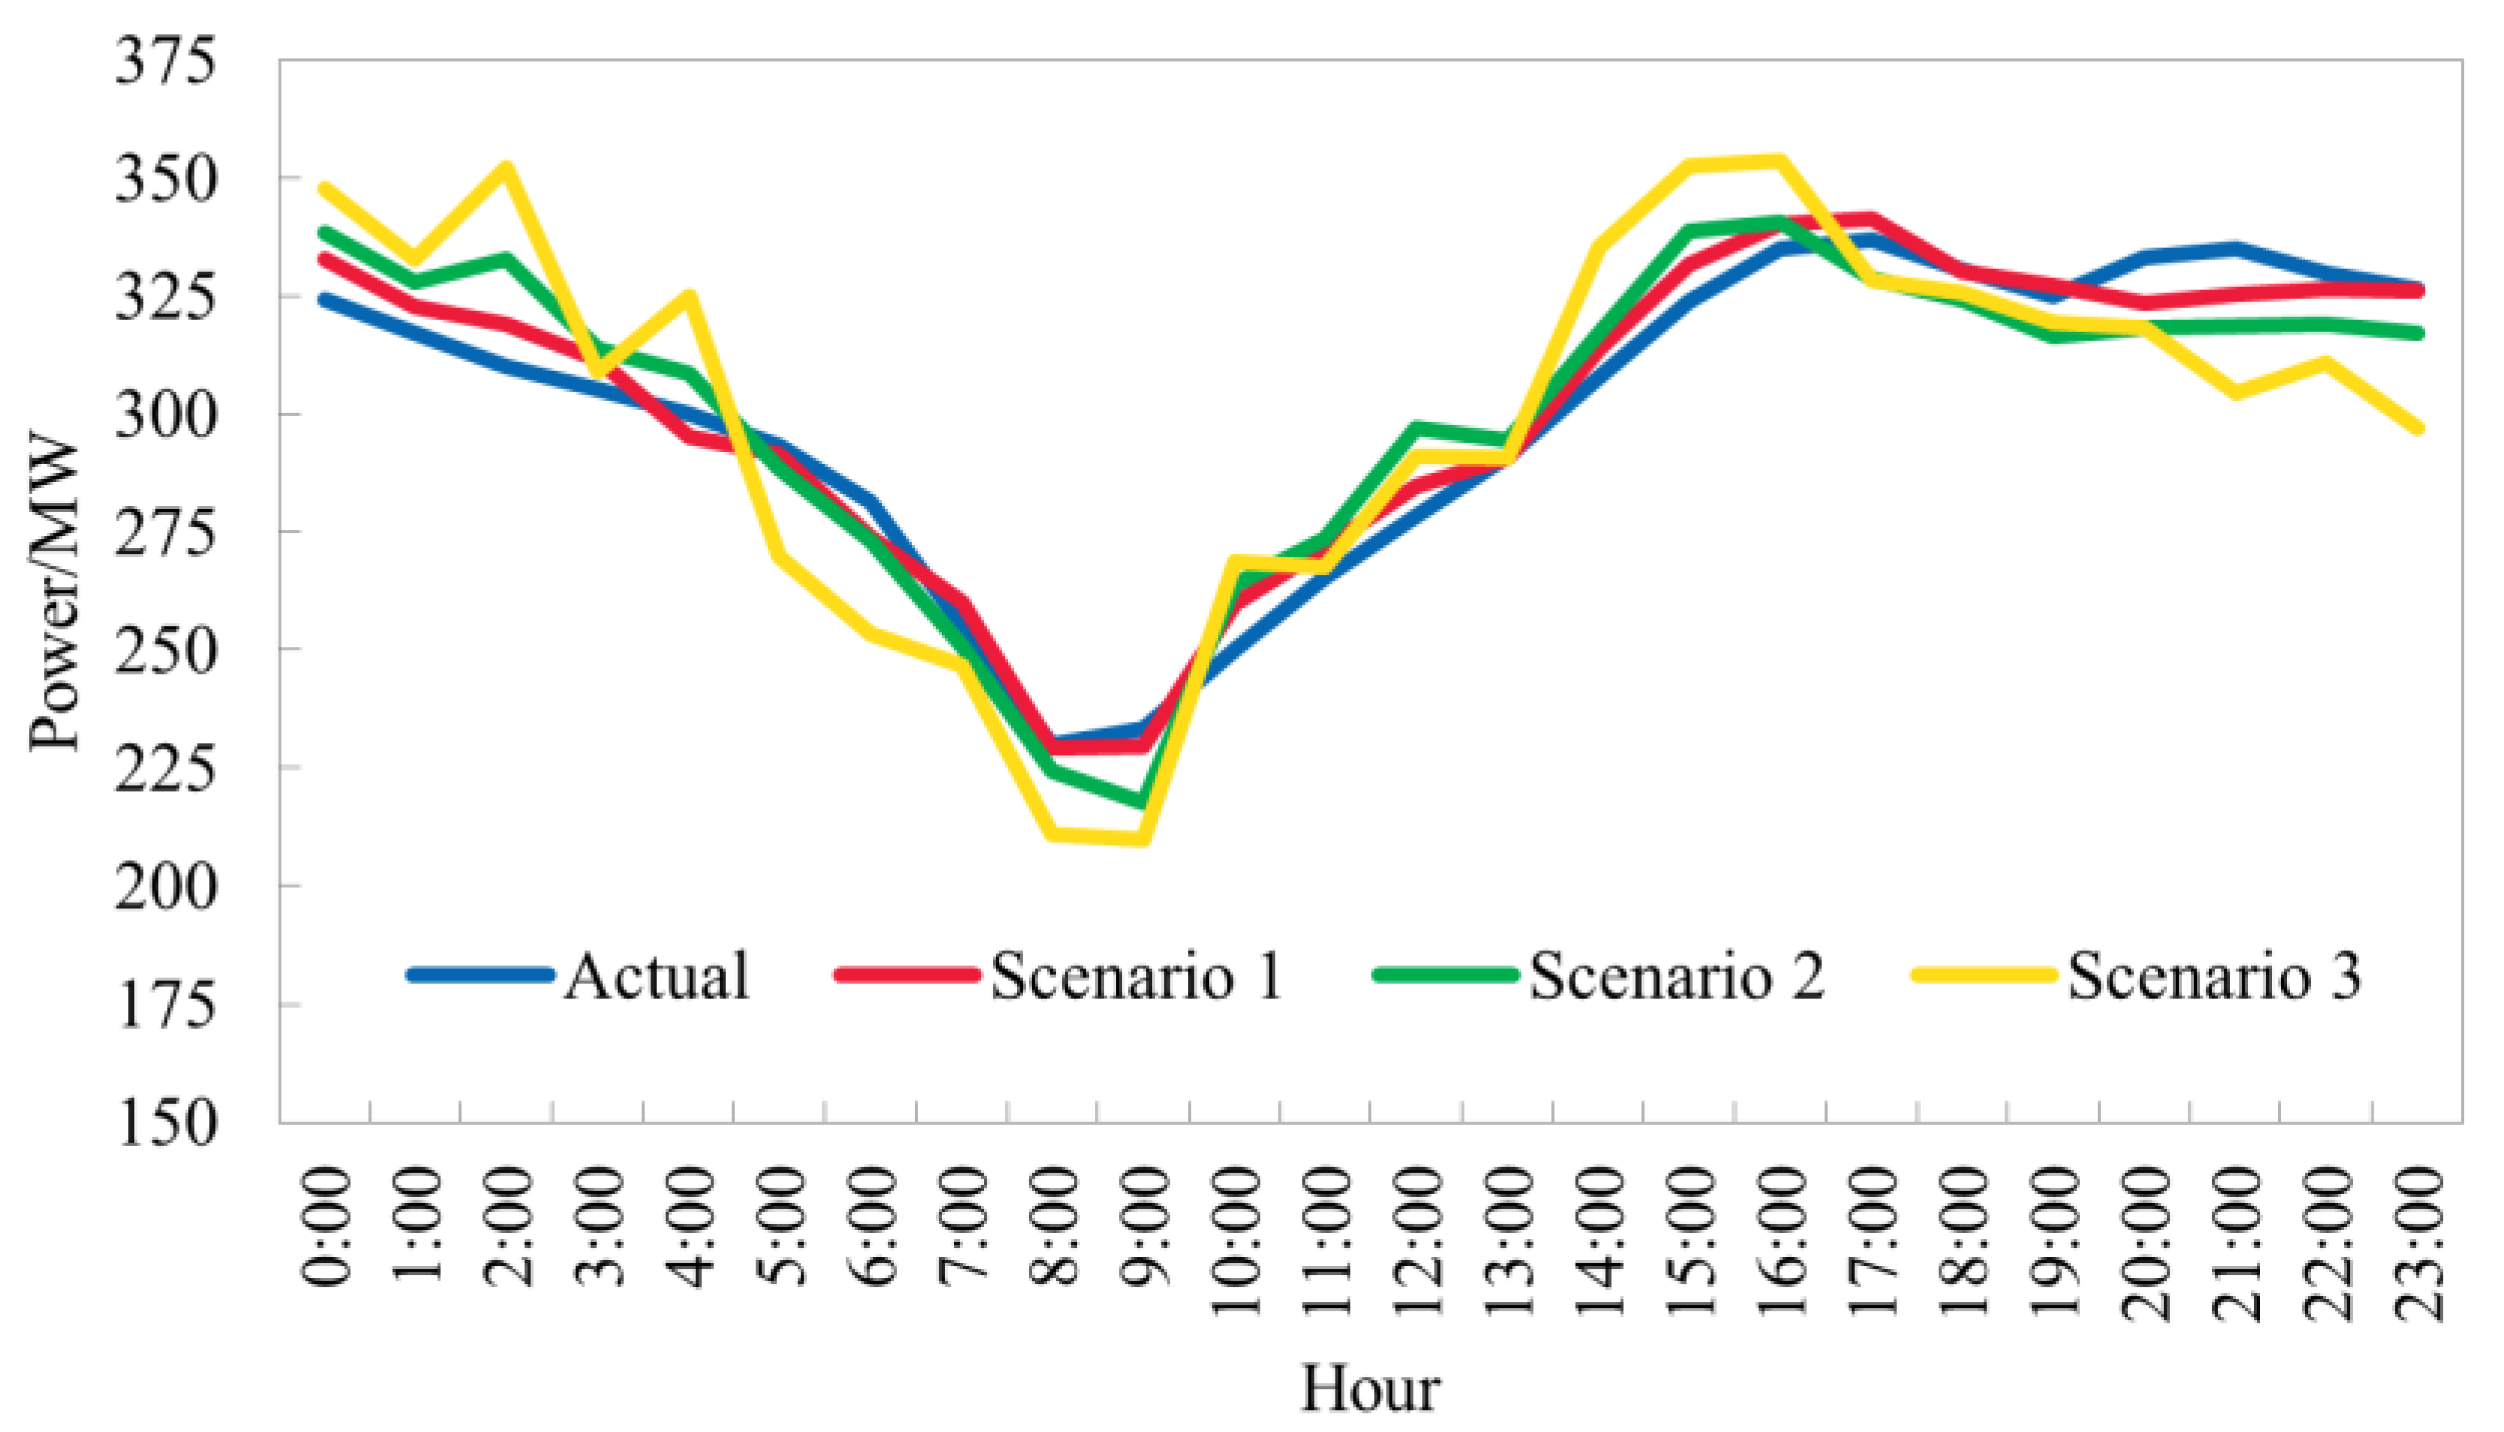
Different scenarios have drastically variable levels of renewable energy permeability, which has an impact on the flexibility requirements of the system. However, the three situations discussed in this research cannot be supported by enough genuine cases due to data restrictions. To this end, we converted various possibilities of the penetration of renewable energy into various scenarios of the generation prediction errors of renewable energy. In other words, we think that the forecast error is low and the system’s requirement for flexibility is low when the penetration rate of renewable energy is low. The prediction inaccuracy will increase and the system’s requirement for flexibility will rise when the penetration rate of renewable energy is high. Figure 4 displays the expected generation for the three scenarios along with the actual power generation curve of a certain wind farm.
According to Figure 4, the three scenarios’ respective mean absolute percentage errors (MAPE) for the prediction of wind power generation are 1.73%, 3.51%, and 6.07%. The demand intervals for system regulation in three scenarios are [0.29,9.83], [3.03,16.60], and [0.50,42.13], respectively.
This study is mostly focused on flywheel, supercapacitor, flow battery, lead–acid battery, and Li-ion battery energy storage systems due to the enormous capacity and high site selection requirements of pumped storage systems and compressed-air energy storage systems.

4.2. Multi-Dimensional Value Evaluation of ESSs in Scenario 1

4.2.1. Objective Weight Determination

The initial decision matrix is constructed as Table 3.
Then, the normalized decision matrix can be expressed as in Table 4.
Then, the variability, conflict, information content, and weights of the indicators can be calculated by Equations (4)–(9), as shown in Table 5.
According to Table 5, energy conversion efficiency (C5) is regarded as the most important indicator for evaluating the comprehensive value of ESSs, followed by the response capability (C2), wind power curtailment rate (C8), and cycle life (C7). While the differences are not statistically significant, the weights of these three indicators are essentially between 0.8 and 0.9.

4.2.2. Subjective Weight Determination

We have invited five experts to create an expert panel, as stated in Section 3.1.2. The expert group is made up of employees from energy storage operators, power grid firms, and academics working on relevant projects from institutions. The multi-dimensional value evaluation index system for ESSs’ best and worst indicators is first discovered, as illustrated in Table 6.
The “Best-to-Others” importance comparison vector A B and the “Others-to-Worst” importance comparison vector A W can be constructed as follows:
A B = ( 4 5 2 3 1 3 6 7 4 4 3 3 1 2 6 5 4 5 3 3 2 1 4 6 4 4 2 2 1 3 5 6 4 4 3 3 2 1 6 5 ) A W = ( 4 3 6 5 7 5 2 1 3 3 4 4 6 5 1 2 3 2 4 4 5 6 3 1 3 3 5 5 6 4 2 1 3 3 4 4 5 6 1 2 )
Then, the indicator weights determined by the expert group are calculated by the BWM model, as shown in Table 7.
As shown in Table 7, the indicator weight ranking is C5 > C6 > C3 > C4 > C1 > C2 > C7 > C8. Similar to the objective weights determined by CRITIC, the energy conversion efficiency (C5) and unit power cost (C6) are considered the most important indicators.

4.2.3. Weight Combination and Comprehensive Value Evaluation

According to the MRE introduced in Section 3.1.3, the combined weights of indicators are shown in Table 8.
Then, the multi-dimensional value of each ESS is evaluated by the TOPSIS model, as shown in Figure 5.
As shown in Figure 5, the ranking of multi-dimensional value of each ESS is as follows: flywheel > supercapacitor > Li-ion battery > lead–acid battery > flow battery. The reason for this phenomenon is the high energy conversion efficiency of flywheel and supercapacitor ESSs. In contrast, although the flow battery performs better in response capability and wind power curtailment rate, the weights of these two indicators are relatively lower (i.e., 0.0820 and 0.0662).

4.3. Multi-Dimensional Value Evaluation of ESSs in Scenario 2

4.3.1. Objective Weight Determination

The initial decision matrix is constructed as in Table 9.
Then, the normalized decision matrix is expressed as Table 10.
Then, the variability, conflict, information content, and weights of the indicators can be calculated via Equations (4)–(9), as shown in Table 11.
According to Table 11, energy conversion efficiency (C5) is regarded as the most important indicator for evaluating the comprehensive value of ESSs, followed by the response capability (C2), wind power curtailment rate (C8), and cycle life (C7). This result is basically the same as the one in Scenario 1.

4.3.2. Subjective Weight Determination

The best and worst indicators of the multi-dimensional value evaluation index system for ESSs are first obtained, as shown in Table 12.
The “Best-to-Others” importance comparison vector A B and the “Others-to-Worst” importance comparison vector A W can be constructed as follows:
A B = ( 2 1 3 4 3 4 5 6 2 1 5 5 3 4 6 6 2 2 4 4 3 1 5 6 3 1 3 3 2 4 6 5 3 2 4 4 1 2 4 5 )   A W = ( 5 6 4 3 4 3 2 1 5 6 2 2 4 3 1 1 5 5 3 3 4 6 2 1 4 6 4 4 5 3 1 2 3 4 2 2 5 4 2 1 )
Then, the indicator weights determined by the expert group are calculated by the BWM model, as shown in Table 13.
As shown in Table 13, the indicator weight ranking is C2 > C5 > C1 > C6 > C3 > C4 > C7 > C8. Different from the objective weights determined by CRITIC, the response capability (C2) and energy conversion efficiency (C5) are considered the most important indicators.

4.3.3. Weight Combination and Comprehensive Value Evaluation

According to the MRE introduced in Section 3.1.3, the combined weights of indicators are shown in Table 14.
Then, the multi-dimensional value of each ESS is evaluated by the TOPSIS model, as shown in Figure 6.
As shown in Figure 6, the ranking of multi-dimensional value of each ESS is as follows: flywheel > supercapacitor > Li-ion battery > lead–acid battery > flow battery, which is the same as the one of Scenario 1.

4.4. Multi-Dimensional Value Evaluation of ESSs in Scenario 3

4.4.1. Objective Weight Determination

The initial decision matrix is constructed as Table 15.
Then, the normalized decision matrix can be expressed as Table 16.
Then, the variability, conflict, information content, and weights of the indicators can be calculated by Equations (4)–(9), as shown in Table 17.
According to Table 17, the energy density (C4) is considered the most important indicator for evaluating the comprehensive value of ESSs, followed by the response capability (C2), cycle life (C7), and wind power curtailment rate (C8). While the weights of these three indicators are basically around 0.10, and the difference is not significant.

4.4.2. Subjective Weight Determination

The best and worst indicators of the multi-dimensional value evaluation index system for ESSs are first obtained, as shown in Table 18.
The “Best-to-Others” importance comparison vector A B and the “Others-to-Worst” importance comparison vector A W can be constructed as follows:
A B = ( 2 1 5 6 3 4 7 5 2 1 5 5 3 4 6 5 1 2 5 5 5 3 6 4 2 1 5 5 3 4 6 4 2 1 5 5 4 3 6 5 ) A W = ( 6 7 3 2 5 4 1 3 5 6 2 2 4 3 1 2 6 5 2 2 2 4 1 3 5 6 2 2 4 3 1 3 5 6 2 2 3 4 1 2 )
Then, the indicator weights determined by the expert group are calculated by the BWM model, as shown in Table 19.
As shown in Table 19, the indicator weight ranking is C2 > C1 > C5 > C6 > C8 > C3 > C4 > C7. Different from the objective weights determined by CRITIC, the response capability (C2) and response time (C1) are considered the most important indicators.

4.4.3. Weight Combination and Comprehensive Value Evaluation

According to the MRE introduced in Section 3.1.3, the combined weights of indicators are shown in Table 20.
Then, the multi-dimensional value of each ESS is evaluated by the TOPSIS model, as shown in Figure 7.
As shown in Figure 7, the ranking of multi-dimensional value of each ESS is as follows: supercapacitor > flywheel > Li-ion battery > flow battery > lead–acid battery.

4.5. Discussion of the Results in Three Scenarios

The final indicator weights under three scenarios are summarized in Table 21.
Due to the fewer renewable energy installations in the early stages of the development of the new power system (Scenario 1), the need for system flexibility is relatively low. At this point, the technical and economic values of the ESSs, particularly the quest for improved energy conversion efficiency and lower unit power generation costs, are of greater importance to specialists. In Scenario 2, the flexible value of ESSs has progressively become obvious, and the significance of the flexibility value has further expanded, along with the gradual development in the installed scale of renewable energy sources. The response capacity and response time now rank third and fourth in importance. In the later stage of the development of the new power system (Scenario 3), renewable power sources have become the main power generation entity. Therefore, experts believe that flexibility value is a key indicator reflecting the core value of ESSs at this stage.
The comprehensive value of different ESSs under three scenarios is summarized in Table 22.
It is important to note that there is only a negligible overall difference between Scenario 1 and Scenario 2 in terms of the comprehensive value rankings of the five ESSs. The resemblance between Scenario 1 and Scenario 2 could be the cause of this. Specifically, there is a difference in the penetration of renewable energy between Scenario 1 and Scenario 2, which is almost 20%, and between Scenario 2 and Scenario 3, which is roughly 35%. As a result, between Scenario 1 and Scenario 2, the difference in the renewable energy prediction error is approximately 1.78%, while between Scenario 2 and Scenario 3, the difference in the renewable energy prediction error is 2.56%.
The magnitude of prediction error directly affects the flexibility requirements of the system, indirectly resulting in different flexibility utilities of various ESS. In Scenario 1, the flexibility capacity that the flow battery can provide is the same as lead–acid and Li-ion batteries, while the lack of value in other aspects results in its overall value ranking last among various alternative solutions. The flow battery’s flexible capacity in Scenario 2 is 26.32% more than that of the other two battery kinds, but other parts of its value have not changed all that much; therefore, its total value ranking has not changed. The situation radically changes in Scenario 3, where flexibility is significantly essential. The flow battery’s flexibility capacity outperforms the flexibility capacities of the other two types of batteries by about 112.80%, directly raising the flow battery’s overall value rating of the battery by two levels.
However, given the rising demand for power system flexibility, flow batteries with greater capacities are more valuable than the other two battery ESS. Additionally, the value gap between conventional mechanical and electrical ESSs and electrochemical ESSs has shrunk even more. This implies that the electrochemical ESSs will play a greater role in the advancement of power systems in the future.

4.6. Model Comparison and Sensitivity Analysis

4.6.1. Model Comparison

To verify the effectiveness of the combined weighting method proposed in this article, a comparison was made with using a single weighting method. Due to the design of multiple scenarios in this paper, the workload of model comparison for all scenarios is significant. Therefore, scenario 3 is taken as an example. Each comparative model is shown in Table 23, and the comprehensive value of different ESSs by each model under Scenario 3 is shown in Table 24.
The comprehensive value of the flywheel and supercapacitor, which are relevant to each of the three types of models, scores reasonably high among the five ESSs, as shown in Table 24. However, there are variances in each ESS’s comprehensive value depending on the model. Flywheel, supercapacitor, and Li-ion battery perform significantly well in terms of energy density (C4), energy conversion efficiency (C5), and unit power cost (C6), which contributes to their overall high-value rating. Despite the fact that the flow battery performs well in terms of response capability (C2) and wind power curtailment rate (C8), their respective weights of 0.0978 and 0.1025 make them significantly less important than other indicators. The ranking of each ESS significantly changed when BWM is used for indicator weighting. In particular, even though the comprehensive values of the flywheel and supercapacitor are still good, the gap between the comprehensive values of the flow battery and their two components has greatly shrunk as a result of decision-makers’ understanding of the significance of the response capability (C2) indicator. The final scores and ranks of the comprehensive values of each ESS are more logical following weight fusion.

4.6.2. Sensitivity Analysis

Further sensitivity analysis is required, which can confirm the logic of the suggested model and has the potential to be widely promoted and applied [36,37]. Sensitivity analysis typically focuses on two key areas: first, assessing the effects of changes in indicator value; second, assessing the effects of changes in indicator weight on evaluation outcomes [
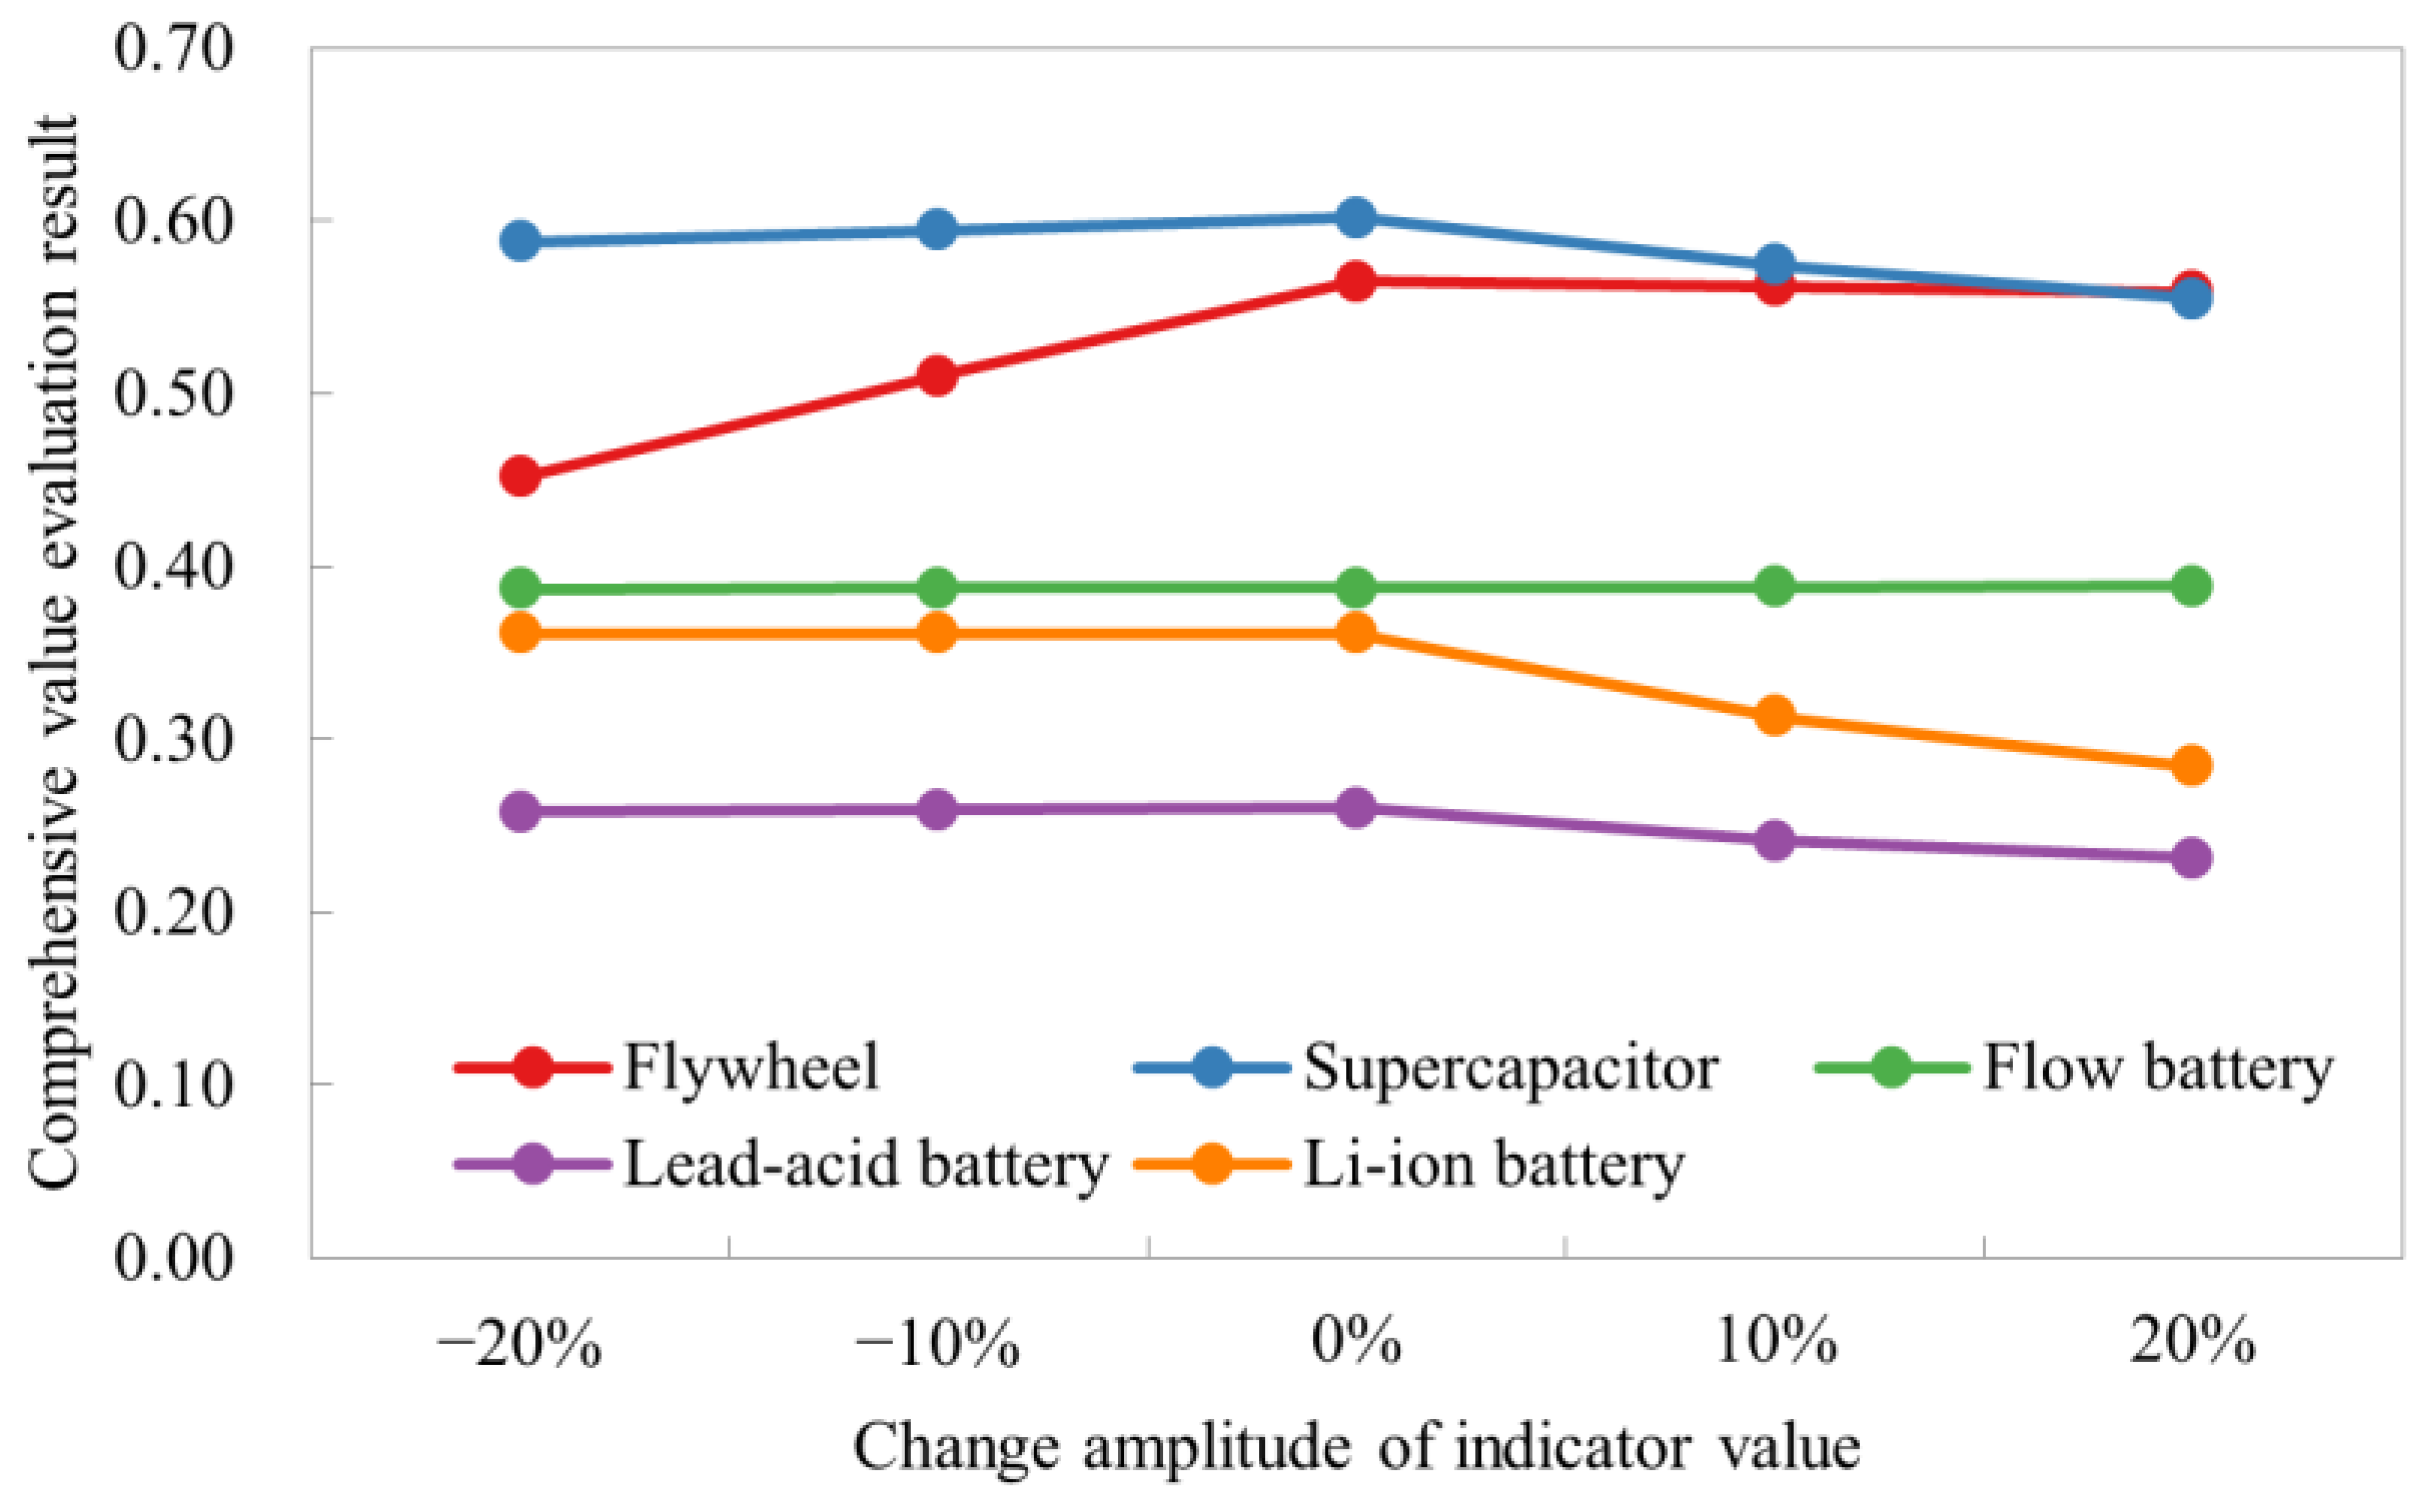
38]. Similarly, we perform a sensitivity analysis using Scenario 3 as the reference case. By modifying the flywheel ESS’s performance across all metrics, we may evaluate the changes in the comprehensive value of each ESS. Figure 8 displays the result.
Figure 8 illustrates how little the performance of the flywheel and flow battery has altered when the flywheel’s index value rises. The performances of the other three types of ESSs, however, exhibit a definite declining tendency. In addition, the evaluation results of the flywheel comprehensive value demonstrate a considerable fall when the values of several flywheel indicators decline, although the other ESSs are not significantly impacted.
Similarly, we will adjust the weights of each indicator to determine the changes in the comprehensive value of each ESS. Taking the C2 indicator as an example, Figure 9 shows the impact of the C2 indicator weight changes on the comprehensive value evaluation results of each ESS (note that the weights of other indicators change synchronously to ensure that the sum of all indicator weights remains 1).
According to Figure 9, while the performances of the other three types of ESSs have dramatically altered, the overall value of lead–acid and lithium-ion batteries appears not to have changed much. Particularly, the comprehensive value of liquid flow batteries rises as the C2 index weight increases, whereas the comprehensive values of flywheels and supercapacitors fall as the C2 index weight rises.

5. Conclusions

A crucial step for China in achieving the carbon neutrality climate change target is the construction of a new power system with renewable energy as its core component. One of the most effective ways to deal with the randomness and instability of renewable energy generation is to use flexible resources, such as ESSs. It is of great significance to discover and evaluate the multidimensional value of ESSs. So, using several criteria for decision-making, this research constructs a multi-dimensional value evaluation model of ESSs. The following conclusions can be drawn:
(1)
There are distinct variances in indicator weights among various scenarios as a result of the differing emphasis on ESS value in each scenario. With the stages of development of new power systems, the significance of the flexibility value represented by response time (C1) and response capacity (C2), in particular, gradually grows;
(2)
The overall value gap between electrochemical ESSs and conventional ESSs is gradually closing due to the ongoing development of new power systems. When the demand for system flexibility is strong, flow battery ESSs with a bigger capacity can perform better than lead–acid and Li-ion battery ESSs.
The computational time is increased even though a more creative combination weighting method is used in this paper. In an upcoming study, we will look into better weighting methodologies in more detail. Due to data restrictions, this report only focuses on five common ESS, but we plan to broaden the research’s coverage in the future.

Author Contributions

Conceptualization, C.S. and B.W.; resources, W.L.; data curation, Y.Y.; writing—original draft preparation, Y.Z.; supervision, Z.W. All authors have read and agreed to the published version of the manuscript.

Funding

This research was funded by the State Grid Gansu Electric Power Company Science and Technology Project “Research on Energy Storage Participation in Marketization Trading Mechanism Based on New Power Systems” (52272222000H).

Data Availability Statement

Not applicable.

Acknowledgments

The authors are grateful to the editor and anonymous reviewers for their work.

Conflicts of Interest

The authors declare no conflict of interest.

References

  1. Zhao, Y.; Su, Q.; Li, B.; Zhang, Y.; Wang, X.; Zhao, H.; Guo, S. Have those countries declaring “zero carbon” or “carbon neutral” climate goals achieved carbon emissions-economic growth decoupling? J. Clean. Prod. 2022, 363, 132450. [Google Scholar] [CrossRef]
  2. Zhao, Y.; Zhou, Z.; Zhang, K.; Huo, Y.; Sun, D.; Zhao, H.; Sun, J.; Guo, S. Research on spillover effect between carbon market and electricity market: Evidence from Northern Europe. Energy 2023, 263, 126107. [Google Scholar] [CrossRef]
  3. Lu, M.; Guan, J.; Wu, H.; Chen, H.; Gu, W.; Wu, Y.; Ling, C.; Zhang, L. Day-ahead optimal dispatching of multi-source power system. Renew. Energy 2022, 183, 435–446. [Google Scholar] [CrossRef]
  4. Wang, S.; Li, F.; Zhang, G.; Yin, C. Analysis of energy storage demand for peak shaving and frequency regulation of power systems with high penetration of renewable energy. Energy 2023, 267, 126586. [Google Scholar] [CrossRef]
  5. Ouchani, F.; Jbaihi, O.; Merrouni, A.; Ghennioui, A.; Maaroufi, M. Geographic Information System-based Multi-Criteria Decision-Making analysis for assessing prospective locations of Pumped Hydro Energy Storage plants in Morocco: Towards efficient management of variable renewables. J. Energy Storage 2022, 55, 105751. [Google Scholar] [CrossRef]
  6. Li, Q.; Li, Z.; Zhang, Z.; Tao, Y.; Bian, R. Energy storage capacity optimization strategy for combined wind storage system. Energy Rep. 2022, 8, 247–252. [Google Scholar] [CrossRef]
  7. Ebrahimi, A.; Ziabasharhagh, M. Introducing a novel control algorithm and scheduling procedure for optimal operation of energy storage systems. Energy 2022, 252, 123991. [Google Scholar] [CrossRef]
  8. Zhang, T.; Ma, Y.; Wu, Y.; Yi, Q. Optimization configuration and application value assessment modeling of hybrid energy storage in the new power system with multi-flexible resources coupling. J. Energy Storage 2023, 62, 106876. [Google Scholar] [CrossRef]
  9. Nikitin, A.; Deymi-Dashtebayaz, M.; Baranov, I.; Sami, S.; Nikitina, V.; Abadi, M.K.; Rumiantceva, O. Energy, exergy, economic and environmental (4E) analysis using a renewable multi-generation system in a near-zero energy building with hot water and hydrogen storage systems. J. Energy Storage 2023, 62, 106794. [Google Scholar] [CrossRef]
  10. Wu, F.; Gao, R.; Li, C.; Liu, J. A comprehensive evaluation of wind-PV-salt cavern-hydrogen energy storage and utilization system: A case study in Qianjiang salt cavern, China. Energy Convers. Manag. 2023, 277, 116633. [Google Scholar] [CrossRef]
  11. Yang, Y.; Hou, J.; Bian, X.; Cai, J.; Huang, J.; Gui, J. Comprehensive Evaluation of Flexible Resources for High Penetration of Renewable Energy Sources Integrated to the Distribution Network. Distrib. Util. 2021, 38, 68–76. [Google Scholar]
  12. Feng, L.; Zhang, X.; Li, C.; Li, X.; Li, B.; Ding, J.; Zhang, C.; Qiu, H.; Xu, Y.; Chen, H. Optimization analysis of energy storage application based on electricity price arbitrage and ancillary services. J. Energy Storage 2022, 55, 105508. [Google Scholar] [CrossRef]
  13. Zhang, Y.; Lin, F.; Liu, Z.; Lin, Y.; Yang, K. Energy and exergy performance evaluation of a novel low-temperature physical energy storage system consisting of compressed CO2 energy storage and Kalina cycle. J. Energy Storage 2023, 60, 106605. [Google Scholar] [CrossRef]
  14. Zhu, C.; Wang, L.; Huang, J.; Cheng, H.; Hou, G.; Zhang, S.; Liu, H. Feasibility analysis of PV and energy storage system integration for flexible distribution networks: A moment-based distributionally robust approach. Energy Rep. 2023, 9, 89–98. [Google Scholar] [CrossRef]
  15. Numan, A.; Baig, M.; Yousif, M. Reliability evaluation of energy storage systems combined with other grid flexibility options: A review. J. Energy Storage 2023, 63, 107022. [Google Scholar]
  16. Zhao, H.; Guo, S.; Zhao, H. Comprehensive assessment for battery energy storage systems based on fuzzy-MCDM considering risk preferences. Energy 2019, 168, 450–461. [Google Scholar] [CrossRef]
  17. Ramya, L.; Narayanamoorthy, S.; Kalaiselvan, S.; Kureethara, J.; Annapoorani, V.; Kang, D. A Congruent Approach to Normal Wiggly Interval-Valued Hesitant Pythagorean Fuzzy Set for Thermal Energy Storage Technique Selection Applications. Int. J. Fuzzy Syst. 2021, 23, 1581–1599. [Google Scholar] [CrossRef]
  18. Mosetlhe, T.; Babatunde, O.; Yusuff, A.; Ayodele, T.; Ogunjuyigbe, A. A MCDM approach for selection of microgrid configuration for rural water pumping system. Energy Rep. 2023, 9, 922–929. [Google Scholar] [CrossRef]
  19. Liu, J. The analysis of innovative design and evaluation of energy storage system based on Internet of Things. J. Supercomput. 2022, 78, 1624–1641. [Google Scholar] [CrossRef]
  20. Xuan, K.; Hao, Y.; Liang, Z.; Zhang, J. Research on the evaluation of distributed integrated energy system using improved analytic hierarchy process-information entropy method. Energy Sources Part A Recovery Util. Environ. Eff. 2022, 44, 10071–10093. [Google Scholar] [CrossRef]
  21. Rezaei, J. Best-worst multi-criteria decision-making method. Omega 2015, 53, 49–57. [Google Scholar] [CrossRef]
  22. Palizban, O.; Kauhaniemi, K. Energy storage systems in modern grids-Matrix of technologies and applications. J. Energy Storage 2016, 6, 248–259. [Google Scholar] [CrossRef]
  23. Hemmati, R.; Saboori, H. Emergence of hybrid energy storage systems in renewable energy and transport applications—A review. Renew. Sustain. Energy Rev. 2016, 65, 11–23. [Google Scholar] [CrossRef]
  24. Faisal, M.; Hannan, M.; Ker, P.; Hussain, A.; Bin Mansor, M.; Blaabjerg, F. Review of Energy Storage System Technologies in Microgrid Applications: Issues and Challenges. IEEE Access 2018, 6, 35143–35164. [Google Scholar] [CrossRef]
  25. Keyvani, B.; Flynn, D. Coordinated investment in wind-rich regions using dynamic line rating, energy storage and distributed static series compensation to facilitate congestion management. IET Renew. Power Gener. 2022, 16, 1882–1896. [Google Scholar] [CrossRef]
  26. Tang, S.; Zhou, Z.; Hu, C.; Zhao, F.; Cao, Y. A New Evidential Reasoning Rule-Based Safety Assessment Method with Sensor Reliability for Complex Systems. IEEE Trans. Cybern. 2022, 52, 4027–4038. [Google Scholar] [CrossRef]
  27. Chen, P. Effects of the entropy weight on TOPSIS. Expert Syst. Appl. 2021, 168, 114186. [Google Scholar] [CrossRef]
  28. Xu, C.; Ke, Y.; Li, Y.; Chu, H.; Wu, Y. Data-driven configuration optimization of an off-grid wind/PV/hydrogen system based on modified NSGA-II and CRITIC-TOPSIS. Energy Convers. Manag. 2020, 215, 112892. [Google Scholar] [CrossRef]
  29. Lu, J.; Zhang, S.; Wu, J.; Wei, Y. Copras method for multiple attribute group decision making under picture fuzzy environment and their application to green supplier selection. Technol. Econ. Dev. Econ. 2021, 27, 369–385. [Google Scholar] [CrossRef]
  30. Yadav, R.; Lee, H. Ranking and selection of dental restorative composite materials using FAHP-FTOPSIS technique: An application of multi criteria decision making technique. J. Mech. Behav. Biomed. Mater. 2022, 132, 105298. [Google Scholar] [CrossRef]
  31. Lan, L.; Hien, D.; Thong, N.; Smarandache, F.; Giang, T. An ANP-TOPSIS model for tourist destination choice problems under Temporal Neutrosophic environment. Appl. Soft Comput. 2023, 136, 110146. [Google Scholar] [CrossRef]
  32. Zhang, Y.; Zhao, H.; Li, B.; Zhao, Y.; Qi, Z. Research on credit rating and risk measurement of electricity retailers based on Bayesian Best Worst Method-Cloud Model and improved Credit Metrics model in China’s power market. Energy 2022, 252, 124088. [Google Scholar] [CrossRef]
  33. Zhang, Z.; Lin, S.; Ye, Y.; Xu, Z.; Zhao, Y.; Zhao, H.; Sun, J. A Hybrid MCDM Model for Evaluating the Market-Oriented Business Regulatory Risk of Power Grid Enterprises Based on the Bayesian Best-Worst Method and MARCOS Approach. Energies 2022, 15, 2978. [Google Scholar] [CrossRef]
  34. Jin, F.; Pei, L.; Chen, H.; Zhou, L. Interval-valued intuitionistic fuzzy continuous weighted entropy and its application to multi-criteria fuzzy group decision making. Knowl.-Based Syst. 2014, 59, 132–141. [Google Scholar] [CrossRef]
  35. Zhuo, Z.; Zhang, N.; Xie, X.; Li, H.; Kang, C. Key Technologies and Developing Challenges of Power System with High Proportion of Renewable Energy. Autom. Electr. Power Syst. 2021, 45, 171–191. [Google Scholar]
  36. Dagtekin, Y.; Kaya, S.; Besli, N. Distributed energy system selection for a commercial building by using Multi Criteria Decision Making methods. Int. J. Hydrogen Energy 2022, 47, 36672–36692. [Google Scholar] [CrossRef]
  37. Guerrero-Liquet, G.; Ovideo-Casado, S.; Sánchez-Lozano, J.; García-Cascales, M.; Prior, J.; Urbina, A. Determination of the Optimal Size of Photovoltaic Systems by Using Multi-Criteria Decision-Making Methods. Sustainability 2018, 10, 4594. [Google Scholar] [CrossRef]
  38. Simanaviciene, R.; Ustinovichius, L. Sensitivity Analysis for Multiple Criteria Decision Making Methods: TOPSIS and SAW. Procedia Soc. Behav. Sci. 2010, 2, 7743–7744. [Google Scholar] [CrossRef]
Figure 1. The classification and installed capacity of China’s ESSs in 2021.
Processes 11 01565 g001
Figure 2. The literature review of the ESSs’ value evaluation [16,17,18,19,20].
Processes 11 01565 g002
Figure 3. The multi-dimensional value evaluation index system for ESSs.
Processes 11 01565 g003
Figure 4. The actual and predicted wind power generation in three scenarios.
Processes 11 01565 g004
Figure 5. The multi-dimensional value of each ESS (Scenario 1).
Processes 11 01565 g005
Figure 6. The multi-dimensional value of each ESS (Scenario 2).
Processes 11 01565 g006
Figure 7. The multi-dimensional value of each ESS (Scenario 3).
Processes 11 01565 g007
Figure 8. The sensitivity analysis on the value of indicators.
Processes 11 01565 g008
Figure 9. The sensitivity analysis on the weight of indicators.
Processes 11 01565 g009
Table 1. The indicators for comprehensive evaluation of ESSs’ value based on MCDM.
IndicatorsReferences
Zhao et al. [16]Ramya et al. [17]Mosetlhe et al. [18]Liu [19]Xuan et al. [20]
Capacity
Charge and discharge
Cycle life
Energy utilization (including density, efficiency, and intensity)
Safety
Cost (including investment, storage, equipment, and operation)
Profit
Emission reduction (including CO2, NOx, SO2)
Delay of power gird construction
Reduction of system reserve capacity
System complexity
Note: √ indicates that the literature includes the corresponding indicator.
Table 2. Scenario setting.
ScenarioRenewable Energy Development StagePenetration Rates
Scenario 1Medium proportion penetration stage10~30%
Scenario 2High proportion penetration stage30~50%
Scenario 3Extremely high permeation stage50~100%
Table 3. The initial decision matrix (Scenario 1).
Type of ESSC1C2C3C4C5C6C7C8
Flywheel2091.4415003090100021,0002.91
Supercapacitor2031.8650001590180050,0008.69
Flow battery60124.311400306011,00012,0000
Lead–acid battery60124.31805075360020000
Li-ion battery60124.313152009024,00010,0000
Table 4. The normalized decision matrix (Scenario 1).
Type of ESSC1C2C3C4C5C6C7C8
Flywheel1.000.640.290.081.001.000.400.67
Supercapacitor1.000.001.000.001.000.971.000.00
Flow battery0.001.000.270.080.000.570.211.00
Lead–acid battery0.001.000.000.190.500.890.001.00
Li-ion battery0.001.000.051.001.000.000.171.00
Table 5. The variability, conflict, information content, and weights of the indicators (Scenario 1).
IndicatorVariabilityConflictInformation ContentWeightRank
C10.48991.98900.97440.12194
C20.38961.68290.65560.08208
C30.35852.09610.75140.09405
C40.36983.41731.26370.15813
C50.40004.25501.70200.21291
C60.37473.47301.30140.16282
C70.34661.96150.67990.08516
C80.38881.70960.66470.08327
Table 6. The best and worst indicators determined by the expert group (Scenario 1).
ExpertBest IndicatorWorst Indicator
1C5C8
2C5C7
3C6C8
4C5C8
5C6C7
Table 7. The indicator weights determined by the expert group based on the BWM (Scenario 1).
ExpertIndicator Weight
C1C2C3C4C5C6C7C8
10.09180.07340.18350.12230.30950.12230.06120.0360
20.08790.08790.11730.11730.30150.17590.04190.0704
30.08790.07040.11730.11730.17590.30150.08790.0419
40.08310.08310.16610.16610.28480.11080.06650.0396
50.08790.08790.11730.11730.17590.30150.04190.0704
Average0.08770.08050.14030.12810.24950.20240.05990.0517
Table 8. The combination indicator weights (Scenario 1).
IndicatorC1C2C3C4C5C6C7C8
Weights0.10440.08200.11590.14360.23260.18320.07200.0662
Table 9. The initial decision matrix (Scenario 2).
Type of ESSC1C2C3C4C5C6C7C8
Flywheel20117.5615003090100021,0001.11
Supercapacitor2036.0050001590180050,0001.67
Flow battery60251.311400306011,00012,0000.00
Lead–acid battery60198.95805075360020000.48
Li-ion battery60198.953152009024,00010,0000.48
Table 10. The normalized decision matrix (Scenario 2).
Type of ESSC1C2C3C4C5C6C7C8
Flywheel1.000.380.290.081.001.000.400.34
Supercapacitor1.000.001.000.001.000.971.000.00
Flow battery0.001.000.270.080.000.570.211.00
Lead–acid battery0.000.760.000.190.500.890.000.71
Li-ion battery0.000.760.051.001.000.000.170.71
Table 11. The variability, conflict, information content, and weights of the indicators (Scenario 2).
IndicatorVariabilityConflictInformation ContentWeightRank
C10.48991.87390.91800.11534
C20.35091.75870.61720.07758
C30.35852.41160.86450.10865
C40.36983.66931.35680.17052
C50.40003.80451.52180.19121
C60.37473.45151.29340.16253
C70.34662.17160.75270.09466
C80.34751.82760.63520.07987
Table 12. The best and worst indicators determined by the expert group (Scenario 2).
ExpertBest IndicatorWorst Indicator
1C2C8
2C2C8
3C6C8
4C2C7
5C5C8
Table 13. The indicator weights determined by the expert group based on the BWM (Scenario 2).
ExpertIndicator Weight
C1C2C3C4C5C6C7C8
10.17590.30150.11730.08790.11730.08790.07040.0419
20.19040.32640.07620.07620.12690.09520.04530.0635
30.16610.16610.08310.08310.11080.28480.06650.0396
40.11390.29290.11390.11390.17090.08540.04070.0683
50.10710.16060.08030.08030.28220.16060.08030.0487
Average0.15070.24950.09420.08830.16160.14280.06060.0524
Table 14. The combination indicator weights (Scenario 2).
IndicatorC1C2C3C4C5C6C7C8
Weights0.13690.14440.10500.12740.18250.15810.07860.0671
Table 15. The initial decision matrix (Scenario 3).
Type of ESSC1C2C3C4C5C6C7C8
Flywheel20111.6115003090100021,0002.32
Supercapacitor2035.0050001590180050,0002.80
Flow battery60434.53140030601100012,0000.00
Lead–acid battery60204.20805075360020001.70
Li-ion battery60204.20315200902400010,0001.70
Table 16. The normalized decision matrix (Scenario 3).
Type of ESSC1C2C3C4C5C6C7C8
Flywheel1.000.190.290.081.001.000.400.17
Supercapacitor1.000.001.000.001.000.971.000.00
Flow battery0.001.000.270.080.000.570.211.00
Lead–acid battery0.000.420.000.190.500.890.000.40
Li-ion battery0.000.420.051.001.000.000.170.40
Table 17. The variability, conflict, information content, and weights of the indicators (Scenario 3).
IndicatorVariabilityConflictInformation ContentWeightRank
C10.48992.18461.07020.11515
C20.33592.70910.91000.09788
C30.35853.01201.07980.11614
C40.36984.21561.55890.16761
C50.40003.49831.39930.15042
C60.37473.73111.39810.15033
C70.34662.68650.93120.10017
C80.33812.82090.95370.10256
Table 18. The best and worst indicators determined by the expert group (Scenario 3).
ExpertBest IndicatorWorst Indicator
1C2C7
2C2C7
3C1C7
4C2C7
5C2C7
Table 19. The indicator weights determined by the expert group based on the BWM (Scenario 3).
ExpertIndicator Weight
C1C2C3C4C5C6C7C8
10.19300.32540.07720.06430.12860.09650.03780.0772
20.18800.32230.07520.07520.12530.09400.04480.0752
30.32230.18800.07520.07520.07520.12530.04480.0940
40.18450.31630.07380.07380.12300.09230.04390.0923
50.18800.32230.07520.07520.09400.12530.04480.0752
Average0.21520.29490.07530.07270.10920.10670.04320.0828
Table 20. The combination indicator weights (Scenario 3).
IndicatorC1C2C3C4C5C6C7C8
Weights0.16670.18000.09910.11700.13580.13420.06970.0976
Table 21. The final indicator weights under three scenarios.
IndicatorWeight in Scenario 1RankWeight in Scenario 2RankWeight in Scenario 3Rank
C10.104450.136940.16672
C20.082060.144430.18001
C30.115940.105060.09916
C40.143630.127450.11705
C50.232610.182510.13583
C60.183220.158120.13424
C70.072070.078670.06978
C80.066280.067180.09767
Table 22. The comprehensive value of different ESSs under three scenarios.
IndicatorValue in Scenario 1RankValue in Scenario 2RankValue in Scenario 3Rank
Flywheel0.730210.657610.56512
Supercapacitor0.704920.657320.60171
Flow battery0.268850.327550.38773
Lead–acid battery0.443840.384840.26025
Li-ion battery0.543930.483230.36134
Table 23. The comparison models of the value evaluation for ESS.
NumberDescription
Model 1CRITIC + TOPSIS (objective wights)
Model 2BWM + TOPSIS (subjective weights)
Model 3CRITIC + BWM + MRE + TOPSIS (proposed in this paper)
Table 24. The comprehensive value of different ESSs by each model under Scenario 3.
IndicatorModel 1RankModel 2RankModel 3Rank
Flywheel0.547620.556710.56512
Supercapacitor0.628110.546220.60171
Flow battery0.318740.469930.38773
Lead–acid battery0.261850.250250.26025
Li-ion battery0.410030.312340.36134
Disclaimer/Publisher’s Note: The statements, opinions and data contained in all publications are solely those of the individual author(s) and contributor(s) and not of MDPI and/or the editor(s). MDPI and/or the editor(s) disclaim responsibility for any injury to people or property resulting from any ideas, methods, instructions or products referred to in the content.

