Article

Performance and Bacteria Communities of a Full-Scale Constructed Wetland Treating the Secondary Effluent after Multi-Years’ Operation

1
State Key Laboratory of Pollution Control & Resource Reuse, School of Environment, School of Life Science, Nanjing University, Nanjing 210046, China
2
PowerChina Huadong Engineering Corporation Limited, Hangzhou 311122, China
3
Central Plains Environmental Protection Co., LCD, Zhengzhou 450000, China
4
Nanjing University Ecology Research Institute of Changshu (NJUecoRICH), Changshu 215500, China
*
Authors to whom correspondence should be addressed.
Processes 2023, 11(5), 1469; https://doi.org/10.3390/pr11051469
Submission received: 3 April 2023 / Revised: 7 May 2023 / Accepted: 10 May 2023 / Published: 12 May 2023
(This article belongs to the Special Issue Advances in Remediation of Contaminated Sites: Volume II)

Abstract

:
Constructed wetlands (CWs) had been widely used to treat the tailwater from sewage treatment plants. However, the enduring effectiveness of CWs was still unclear. Therefore, this study aimed to investigate the chemical oxygen demand (COD), ammonia nitrogen (NH4+-N), and total phosphorus (TP) removal efficiencies (RE) of the Hongze CW (HZ-CW) after multi-years’ operation. The average COD RE were 7.6% and 15.14% in the 4th and 5th year, respectively. The NH4+-N RE was 78.33% and 46.04% in the 4th and 5th year, respectively, while the TP RE remained high at 66.86% and 64.68%. The high-throughput sequencing analysis revealed that the bacterial community of HZ-CW at the end of the 5th year exhibited a substantial abundance and diversity, and Proteobacteria and Bacteroidota were the dominant phyla with a relative abundance of 33.75–71.8% and 11.28–24.53% in different zones of HZ-CW. Ammonia oxidizing organisms (AOMs) presented much higher relative abundance (0.43–0.79%) in aerated pond (AP) and four free water surface flow CWs (FWS1–FWS4) than those of anammox bacteria, indicating the dominant role of nitrification in NH4+-N removal.

1. Introduction

Constructed wetlands (CWs) are a well-known and widely recognized solution, due to their good operation performance [1,2], cost-effectiveness [3], and ability to withstand impact loads [4,5,6,7]. This technology is capable of treating various types of wastewater, including agricultural wastewater, industrial effluent, polluted river water, and domestic sewage [8,9,10,11]. Currently, there is an increase in the application of CWs for the treatment of effluent from sewage treatment plants (STPs) driven by the increasingly stringent environmental protection measures in China [12,13]. In fact, in 2018, Jiangsu Province of China even proposed that “tail-water from STPs need to undergo ecological purification by CWs before being discharged into the surface water system”.
The analysis of the operational effectiveness of tail-water CWs had observed a steady increase in conjunction with the rise in their application cases. It has been found that CWs exhibited high removal efficiencies for ammonia nitrogen (NH4+-N), chemical oxygen demand (COD) and total phosphorus (TP) [4,14]. Wu et al. conducted an extensive follow-up study for two and a half years on the tail-water from a wastewater treatment plant that was treated by a large-scale vertical-flow CW [4]. It was discovered that the average removal efficiencies for COD and NH4+-N by the CW were 53% and 72%, respectively. Additionally, the study highlighted that there was a significant positive correlation between inflow loads and treatment performance. Song et al. findings indicated that CWs exhibited effective removal efficiencies for NH4+-N, COD, and TP, with initial operation yielding percentages of 56.33%, 55.64% and 88.44%, respectively [3]. Zhu et al. have carried out a detailed 14-month follow-up investigation into the performance of a large-scale vertical-flow CWs treating wastewater treatment plant tail-water, taking into account seasonal variations [15]. The results of their study revealed that the comprehensive removal rates of COD, NH4+-N, and TP were 40.05%, 45.47%, and 62.55%, respectively. Notably, there was no significant seasonal difference in TP removal. An issue prevalent amongst these studies is the limited scope of their research phase, which largely focuses on the initial period of CWs establishment, and the lack of analysis on the long-term effectiveness of CWs after years of operation. However, it should be noted that the performance of CWs changes over time due to substrate blockage, saturation of adsorption capacity, decomposition and release of accumulated organic matter, and an increase in microbial diversity and abundance [16,17]. The tracking studies on the CWs’ performance are few, which limits people’s comprehensive understanding of them and is not conducive to their optimization and upgrading. Numerous studies have demonstrated that microbial processes serve as the primary pollutant removal pathway, prompting researchers to investigate microorganisms within CWs [15,18]. Zhu et al. discovered a considerable variety of microbial communities within the integrated vertical flow CW, with Proteobacteria, Planctomycetes, Bacteroidetes, and Acidobacteria emerging as the primary strains. Among these, the ratios of nitrifying bacteria, denitrifying bacteria, and anammox bacteria were calculated to fall within the range of 0.28–0.31%, 1.83–1.92%, and 0.34–0.40%, respectively; denitrification and anammox were identified as the core mechanisms for nitrogen removal [15]. Furthermore, Zhang et al. determined that anammox bacteria played a critical role in vertical flow CWs’ nitrogen removal. Consequently, the functional properties of microbial communities in surface-flow CWs, including their specific microbial populations, require explicit exploration [18].
In this study, we focused on the performance and microbial communities of a full-scale surface-flow CW treating the secondary effluent after multi-years’ operation. The objectives of this study were: (1) to assess the long-term removal efficiency of a large-scale surface-flow CW in removing pollutants such as COD, NH4+-N, and TP, as well as identifying seasonal variations; (2) to analyze the distribution of the bacterial communities in the CWs, with a particular focus on identifying functional microorganisms.

2. Materials and Methods

2.1. Site Description

The HZ-CW is located in the Hongze District of Jiangsu Province, East China, covering an expansive 55.58 × 10⁴ m2. This system was thoughtfully designed and comprises an aerated pond (AP), a facultative pond (FP), four free-water surface flow CW (FWS), and an ecological pond (EP) (Figure 1). The hydraulic retention times (HRT) of the system elements are 6.7 d, 4.1 d, 3.4 d, and 2.5 d for AP, FP, FWSs, and EP, respectively. The influent water for this system is taken from a sewage treatment plant and has a daily flow rate of 4 × 10⁴ m3. Emergent aquatic plants, specifically Phragmites australis (Cav.) Trin. Ex Steud., Typha Orientalis Presl, and Thalia dealbata Fraser, were deliberately selected for their extensive root systems and high biomass yields. For a more comprehensive understanding of the system’s setup and management approach, reference Song and Liu’s work [3].

2.2. Water Quality Monitoring

The HZ-CW’s inlet and outlet water quality were continuously monitored using an online detector from Nanjing Gangneng, China. The monitored parameters encompassed dissolved oxygen (DO), NH4+-N, COD, and TP. Hourly water samples were collected and analyzed while the average data for monitoring points in the HZ-CW were computed every 10 days.

2.3. Microorganism Sampling and Analysis

The bacterial communities in AP, FP, FWSs, and EP were analyzed at the end of the 5th year. Substrate samples of each processing zone were collected, and stored in the icebox during delivery to the laboratory. The substrate samples were collected from the surface layer (0~5 cm) at the bottom of each zone. Three sites were selected in each zone, and three samples were collected from each site and then the samples from the same site were combined for testing. The genomic DNA was extracted and further investigated according to Li et al. [19].

2.4. Data Analysis

The removal efficiency (RE) of pollutants was calculated using the percentage removal rate for each parameter as follows:
RE   ( % ) = InC EffC InC × 100
where InC and EffC are the influent and effluent concentrations (mg L−1), respectively. Mean (±s.d.) values were also calculated. Seasonal (spring: March–May; summer: June–August; autumn: September–November; winter: December–February) effects for contaminants removal were investigated using one-way analysis of variance (ANOVA). t-tests were used to compare parameters between the influent and the effluent. Nonparametric tests were used for non-normal distribution data. In addition, Tukey’s b-test was used to determine the significance of differences among seasons, with two-sided p < 0.05 taken to indicate significance. All analyses were conducted using SPSS 22.0 (IBM Corp., Armonk, NY, USA).

3. Results and Discussion

3.1. The Performance of HZ-CW after Years Operation

3.1.1. The DO Variations

DO can influence the pollutant removal efficiencies of CWs [20,21,22]. Therefore, the influent and effluent DO concentrations of HZ-CW in the 4th, 5th, and 1st year (n = 36 for each year) were investigated and presented in Figure 2. As shown in Figure 2, the average influent concentration (InC) of DO in the 4th and 5th years were 3.08 and 1.82 mg L−1, respectively (n = 36 for each year), both higher than that in the 1st year (the average DO was 1.4 mg L−1). Conversely, the average DO EffC of 5.62 and 3.34 mg L−1 in the 4th and 5th years were lower than the average of 6.23 mg L−1 observed in the 1st year. The low DO EffC in the 5th year might be caused by the aging of solar aerators. Furthermore, the average DO EffC in summer and autumn of the 4th and 5th years was lower than those in spring and winter, which was partly associated with the low solubility and rapid consumption of DO in the high temperature.

3.1.2. The Performance for COD Removal

As shown in Figure 3a, the EffC of COD in the 4th and 5th years were 35.99 ± 8.65 mg L−1 and 24.09 ± 6.90 mg L−1, both meeting the effluent requirement for COD (≤40 mg L−1). t-tests revealed that InC and EffC of COD in both the 4th and 5th year presented a significant difference (p < 0.01). Compared to the 1st year (55.64%), the average COD RE declined in the 4th (7.60%) (n = 36) and 5th year (15.14%) (n = 36) (Figure 3c) and the average RE per season in the 4th and 5th year were lower than that in the 1st year (Figure 3b). One-way ANOVA showed that there was a significant difference in RE between the 4th~5th year and the 1st year (p < 0.05). Zhu et al. [15] and Zhang et al. [18] have shown that both full-scale integrated vertical-flow CWs and surface-flow CWs were able to achieve COD RE of 40.05% and 53%, respectively, when treating secondary effluent, which was comparable to the COD removal rate in 1st year of the study. These results demonstrated the effectiveness of CWs in COD removal, irrespective of the types of CWs, especially in the initial years of operation. However, the COD RE of the HZ-CW decreased significantly in the 4th and 5th years of operation. According to previous studies, the COD removal efficiency of CWs showed a significant positive correlation with the influent. In this study, the average COD InC in the 4th and 5th years were 43.93 ± 16.20 mg L−1 and 32.79 ± 17.05 mg L−1, markedly lower than that in the 1st year (64.59 ± 27.57 mg L−1), which was likely to be the dominant factor contributing to the COD RE decline in the 4th and 5th years. As shown in Figure 3a, the COD EffC reached lower than 40 mg L−1, despite exceeding an influent COD concentration of 100 mg L−1 in the 5th year of operation, indicating HZ-CW still boasted strong COD removal capabilities. These results further support the notion that the decline of influent COD load was the primary driver for the decrease in COD RE.
The One-way ANOVA also presented that the COD RE among seasons in the 1st year, 4th year, and 5th year showed no significant differences (p > 0.05) (Figure 3b). However, these findings differed from those studies by Zhu et al., who found that COD RE in winter was lower than in summer due to decreased microbial degradation capacity [15]. In fact, the removal of COD in CWs involves various mechanisms including precipitation, filtration, adsorption, and microbial degradation [23,24,25]. Temperature is believed to have a greater impact on microbial degradation, and a lesser effect on physico-chemical processes. Therefore, the small seasonal variation in COD removal in HZ-CW might be the result of the combined effects of various mechanisms.

3.1.3. The Performance for NH4+-N Removal

Nitrogen (N) is recognized as one of the key contributors to eutrophication in water; therefore, the removal performance of NH4+-N serves as a significant indicator for assessing the water purification effectiveness of the full-scale CWs [4,26,27]. As shown in Figure 4a, the average NH4+-N EffC in the 4th and 5th year were 0.84 ± 1.35 mg L−1 and 0.18 ± 0.23 mg L−1, respectively, with almost all of the EffC of NH4+-N were lower than the effluent standard (Figure 4a). t-tests confirmed the significant difference between InC and EffC of NH4+-N (p < 0.01) during each year. However, the mean NH4+-N EffC in the 1st year was 4.40 ± 3.60 mg L−1, failing to meet the effluent requirement, which might be due to the unstable establishment of the bacterial community and the relatively high InC of NH4+-N [15,28]. The average NH4+-N RE were 56.33%, 78.33%, and 46.04% in the 1st, 4th, and 5th year, respectively (Figure 4c), presenting a significant difference in RE between the 1st year and the 4th year (p < 0.05). According to the former studies, the NH4+-N RE in CWs had a positive correlation with the inflow load [4,15] in the 5th year, the average NH4+-N InC (1.63 ± 2.20 mg L−1) was significantly lower than that in the 4th year (4.58 ± 4.31 mg L−1), so the NH4+-N RE in the 5th year was significantly lower than that in the 4th year.
This study also revealed a significant difference in NH4+-N RE between autumn and spring–winter in both the 4th and 5th years (p < 0.05) (Figure 4b), potentially due to the higher InC NH4+-N in the autumn of the 4th than that in the spring and winter. Similarly, the InC NH4+-N in the autumn of the 5th year was lower than that in the spring and winter of the same year. This result was inconsistent with former studies, which showed that a low temperature limited microbial activity and plant growth, thereby leading to a decrease in NH4+-N RE in CWs in winter and spring. Therefore, it is necessary to consider both temperature and NH4+-N InC when evaluating the removal effect of CWs on NH4+-N.

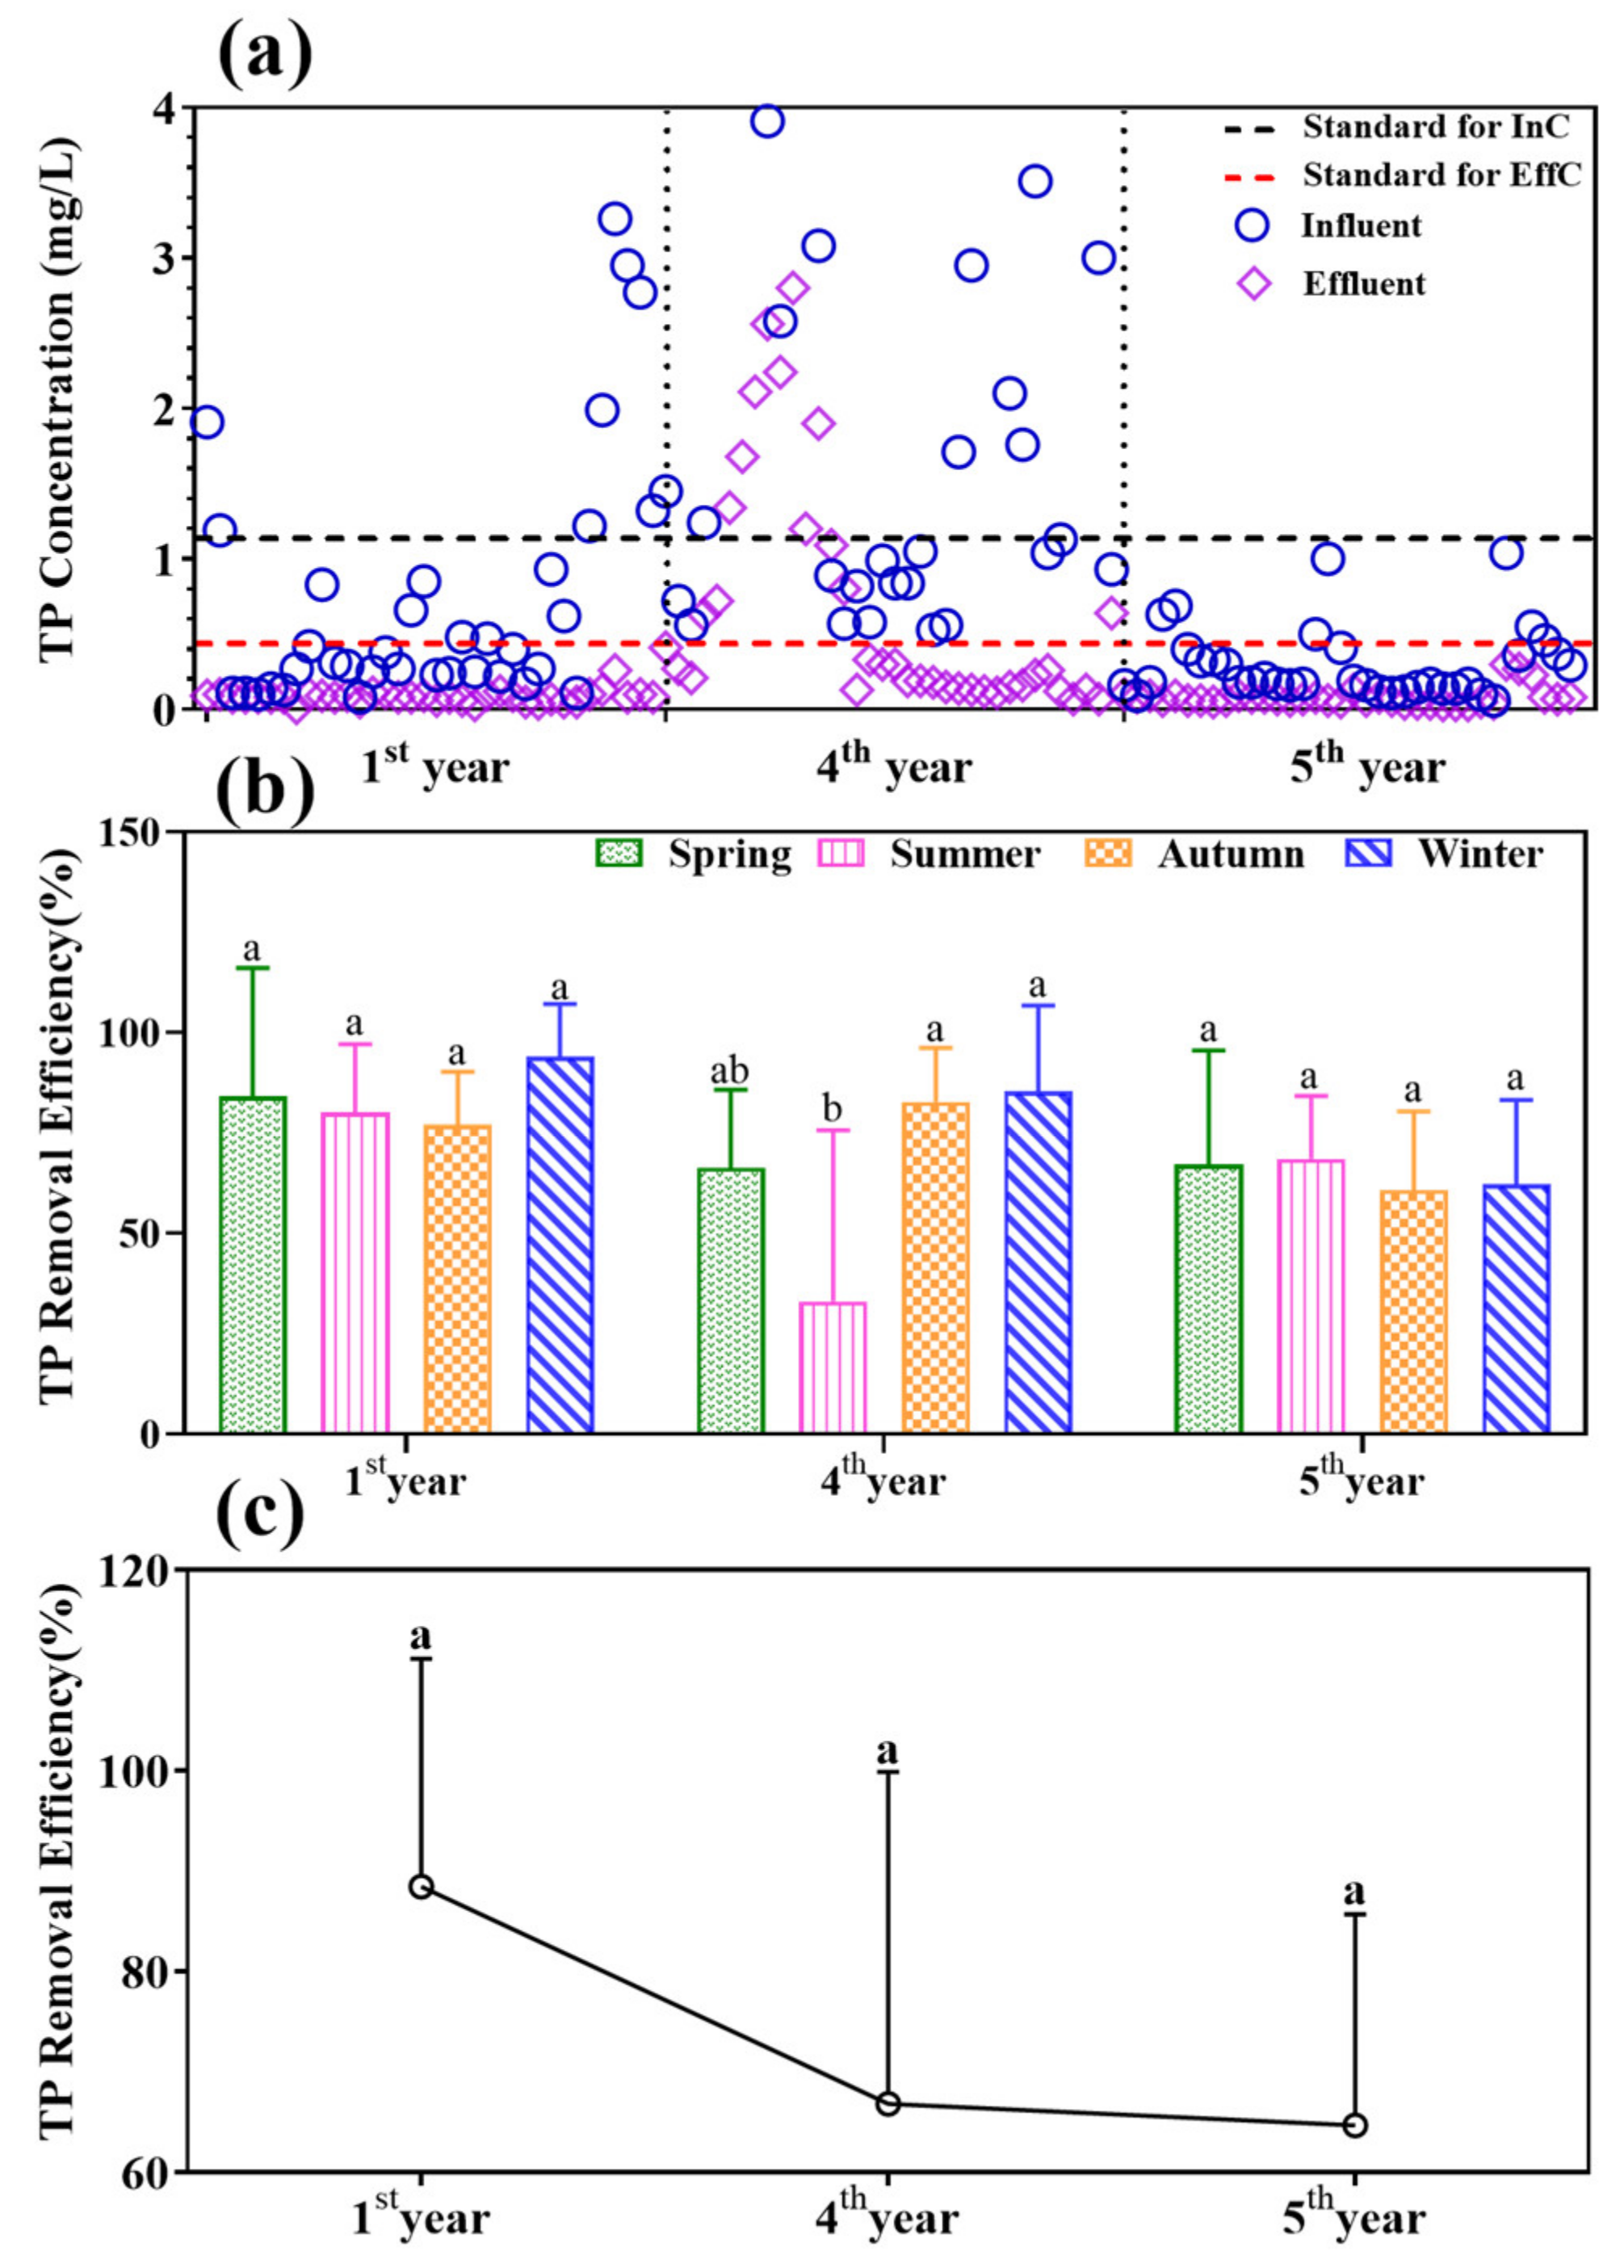
3.1.4. The Performance for TP Removal

As shown in Figure 5a, the average EffC of TP were 0.08, 0.67, and 0.08 mg L−1 in the 1st, 4th, and 5th year, respectively. Specifically, the mean EffC of TP in the 4th year failed to meet the effluent TP requirement of ≤0.4 mg L−1, which was attributed to the elevated TP InC of 2.97 mg L−1, approximately three times the design influent value, and higher than those recorded in the 1st (0.73 mg L−1) and 5th year (0.30 mg L−1). In the 1st and 5th years, there was no significant seasonal difference in TP RE (p > 0.05). Nevertheless, between summer and autumn–winter in the 4th year, there were seasonal variations (p < 0.05) (Figure 5b), potentially because of the high TP InC. Compared to the RE of NH4+-N and COD, the TP RE was relatively stable (p > 0.05), totalling 88.44%, 66.86%, and 64.68% in the 1st year, 4th year, and 5th year, respectively, which was higher than 60% (Figure 4c), as reported by Saggai, Ainouche [29].
Enhanced biological phosphorus removal (EBPR) processes have proven to be effective in removing TP from STPs through the accumulation of polyphosphate accumulating organisms (PAOs) [30]. However, the tail-water lacked organic matter and did not necessarily have alternating anaerobic/aerobic or anaerobic/anoxic conditions, so the role of EBPR in tail-water CWs was limited [15]. The substrate adsorption and filtration are the primary pathways for TP removal in these processes and are less affected by environmental factors, such as temperature. This explained the absence of seasonal variation in TP removal observed in the HZ-CW in the 1st and 5th years of operation. It is worth noting that clogging was reported as a factor affecting the RE of TP after years of operation [31], while this study found that the HZ-CW still exhibited effective TP removal, even after several years of operation.

3.2. The Bacterial Communities Diversity and Composition in HZ-CW

The bacterial communities in each zone of the HZ-CW at the end of the 5th year of operation were revealed by the high-throughput sequencing.

3.2.1. The Richness and Diversity Analysis of the Bacterial Communities

Bacterial richness and diversity within each zone of the HZ-CW were listed in Table 1. The Coverage of the sequences were 0.969, 0.990, 0.966, 0.968, 0.967, 0.964, and 0.982 in AP, FP, FWS1, FWS2, FWS3, FWS4, and EP, respectively, which indicated that the majority of the OTUs have been captured [32]. ACE estimator showed that the community richness of FWS1, FWS2, FWS3, and FWS4 was similar to the ACE from 6223 to 6797, indicating their similar function. The community abundance of samples in the AP was slightly lower than that in the FWS1–4 with the ACE estimator of 5861, which might result from the relatively abundant matrix and the aerobic conditions [33]. The ACE estimators in FP and EP were 1997 and 3349, which might be caused by the greater depth of FP and EP (2.0 m and 1.5 m) and the non-aerated environment. Similar phenomena were observed for bacterial diversity, which FP and EP presented the lower diversity according to Shannon indices.
According to Wang et al., the Chao1 and Shannon index of bacterial communities in an STP were 1498 and 5.46 [30], respectively; both were significantly lower than those in the HZ-CW, except for those in FP. This result was attributed to the CWs’ proximity to the natural environment and minimal artificial intervention. The high richness and diversity of microbial communities in the CWs indicate the greater adaptability in pollutant removal, and the CWs have greater potential for the elimination of emerging contaminants, such as antibiotics, estrogens, and personal care products [34,35].

3.2.2. Bacterial Community Composition

The bacterial community structure in different samples was analyzed and shown in Figure 6. On the phylum level, Proteobacteria dominated in all sediment samples, and the relative abundance was 33.75%, 48.62%, 39.07%, 39.99%, 46.07%, 71.80%, and 36.74% in AP, FP, FWS1, FWS2, FWS3, FWS4, and EP, respectively. The result was similar to that reported by Hu et al. (30.38–52.28%) [23] and Li et al. (26.4–52.6%) [36]. The phylum Proteobacteria plays an integral role in carbon, nitrogen, and sulfur cycling within the ecosystem [37,38,39], with a significant prevalence observed in CWs, STPs, and soils [32,40]. The Bacillota was the subdominant phylum with a relative abundance of 23.36%, 24.53%, 14.04%, 18.83%, 18.79%, 11.28%, and 15.94%, respectively. Bacteroidota, Chloroflexota, and Actinomycetota were phyla with a relative abundance above 1.0% in at least one sample. These taxa exhibited a high level of prevalence in STPs. Actinomycetota was found to represent a significant proportion in FP, which was attributed to the anaerobic conditions situated at the bed of FP and the saprophytic tendency of Actinomycetota [41]. Acidobacteriota was also the top 10 phylum in the system with a relative abundance ranging from 0.4% to 3.1%, which could improve the degradation of plant residues. As shown in Figure 6a, FWS1, FWS2, FWS3, and FWS4 which were sequentially connected presented similar community composition on the phylum level.
On the genus level, 25 primary genera (relative abundance > 1.00% in at least one sample) were observed (Figure 6b). In AP, Bacillus was the dominant genus with a relative abundance of 15.30%, followed by Rokubacteria, Hymenobacter, Phyllobacterium, unidentified-Deltaproteobacteria, and Sphingomonas. In FP, the dominant genus was Phyllobacterium, followed by Lactobacillus Delftia, unidentified-Cyanobacteria, Rhodococcus, Staphylococcus, and Megasphaera. In FWS1, FWS2, FWS3, and FWS4, Phyllobacterium was the dominant genus with relative abundance of 9.33%, 6.39%, 8.04%, and 4.66%, respectively. For Bacillus, the relative abundances were 3.97%, 3.17%, 2%, and 11.84% in FWS1, FWS2, FWS3, and FWS4. Acinetobacter, Staphylococcus, and Clostridiales also presented high abundance. In EP, the relative abundance of Phyllobacterium was as high as 31.06%, similar to that in FP, which should result from a comparable ecosystem. The relative abundances of Delftia, Acinetobacter, Bacillus, Staphylococcus, as well as Sphingomonas in EP, were 11.93%, 8.82%, 4.49%, 2.76%, and 2.41%.

3.2.3. Bacteria Related to Nitrogen and Phosphorus Removal

The bacteria related to nitrogen and phosphorus removal were listed in Table 2. The dominant ammonia oxidizers (AOB) were found to be Unidentified_Nitrosomonadaceae, with a relative abundance ranging from 0.171–0.593% in AP and FWS1–4, 0.026% in FP, and 0.036% in EP, respectively. Nitrosomonas was another AOB with a relative abundance below 0.013%. All samples obtained three genera of nitrite oxidizers (NOB), and the relative abundance were 0.25%, 0.026%, 0.18%, 0.25%, 0.19%, 0.19%, and 0.047% in AP, FP, FWS1, FWS2, FWS3, FWS4, and EP, respectively. Results showed that the relative abundance of AOB and NOB in AP and FWS1–4 was significantly higher than that in FP and EP, which was mainly caused by the lack of DO at the bottom of FP and EP. The relative abundance of nitrifying microorganisms was comparable to that of integrated subsurface-flow CW in Zhu’s paper [15], which ensured the effectiveness of the CWs in removing NH4+-N. Three potential anammox bacteria were also found in sediment samples, Candidatus_Anammoximicrobium, unidentified_Brocadiales, and Candidatus_Brocadia, but their relative abundance in each region was less than 0.1%, which was significantly lower than other researches [15,18]. This was mainly because HZ-CW was a surface-flow CW, whereas those were subsurface-flow CWs. Therefore, based on the abundance of nitrifying bacteria and anammox bacteria, it could be inferred that nitrification, rather than anammox, was the main process of ammonia removal in surface-flow CWs.
Three putative genera of PAOs Thiothrix, Microlunatus, and Tessaracoccus were found in at least one sample, but the relative abundance was all below 0.01%. Accumulibacter and Tetrasphaera, the two typical phosphorus accumulating organisms (PAOs) in STPs, were not observed in all the samples, which might be caused by the absence of volatile fatty acids (VFA) or proteins and polysaccharides in the influent and the alternation of aerobic and anaerobic conditions. [30,42,43] The findings suggested that EBPR did not represent the principal mechanism for TP removal in the HZ-CW; instead, adsorption, filtration, and other processes appeared to be the driving factors. Consequently, TP removal remained unaffected by seasonal variances [44].

4. Conclusions

After several years of operation, the HZ-CW still exhibited a good contaminant removal efficiency, the average removal efficiencies of COD, NH4+-N, and TP were 7.6%, 78.33%, 66.86% and 15.14%, 64.68%, 46.04% in the 4th and 5th year, respectively. Fluctuation of the influent concentration was demonstrated as the main factor contributing to the inter- and intra-annual variation of COD, NH4+-N, and TP removal efficiency. The high-throughput sequencing analysis showed the high richness and diversity of the bacteria community in the HZ-CW, indicating the greater adaptability and potential for contaminants elimination. The relative abundance of ammonia-oxidizing organisms (AOMs) and anammox bacteria revealed that nitrification was the dominant NH4+-N removal pathway in the HZ-CW, and adsorption and filtration was the primary TP removal mechanism due to the fairly low abundance of PAOs. This study revealed that CWs were a promising choice for advanced treatment of tailwater even after multi-years’ operation, which deepened the understanding of CW performance and could promote their wider application.

Author Contributions

Conceptualization, S.S. (Siyuan Song), D.Z. and S.A.; Data curation, S.S. (Siyuan Song) and Y.G.; Formal analysis, S.S. (Siyuan Song), D.Z. and B.W.; Resources, B.W.; Visualization, B.W.; Funding acquisition, S.A., A.L. and S.S. (Siyuan Song); Investigation, T.Y. and S.S. (Sheng Sheng); Writing—original draft, S.S. (Siyuan Song); Writing—review and editing, S.S. (Siyuan Song), B.W., D.Z. and A.L. All authors have read and agreed to the published version of the manuscript.

Funding

This research was funded by the Zhejiang Province Postdoctoral Research Funding Project (No.ZJ2021047); the Major Science and Technology Program for Water Pollution Control and Treatment (No.2017ZX07602002).

Data Availability Statement

Not applicable.

Conflicts of Interest

The authors declare no conflict of interest. The funders had no role in the design of this study; in the collection, analyses, or interpretation of data; in the writing of the manuscript; or in the decision to publish the results.

References

  1. Vymazal, J. Constructed wetlands for wastewater treatment: Five decades of expericence. Environ. Sci. Technol. 2011, 45, 61–69. [Google Scholar] [CrossRef] [PubMed]
  2. Vymazal, J.; Brezinova, T. Long term treatment performance of constructed wetlands for wastewater treatment in mountain areas: Four case studies from the Czech Republic. Ecol. Eng. 2014, 71, 578–583. [Google Scholar] [CrossRef]
  3. Song, S.; Liu, B.; Zhang, W.; Wang, P.; Qiao, Y.; Zhao, D.; Yang, T.; An, S.; Leng, X. Performance of a large-scale wetland treatment system in treating tailwater from a sewage treatment plant. Mar. Freshw. Res. 2018, 69, 833–841. [Google Scholar] [CrossRef]
  4. Wu, H.; Zhang, J.; Guo, W.; Liang, S.; Fan, J. Secondary effluent purification by a large-scale multi-stage surface-flow constructed wetland: A case study in northern China. Bioresour. Technol. 2018, 249, 1092–1096. [Google Scholar] [CrossRef] [PubMed]
  5. Song, S.; Wang, P.; Liu, Y.; Zhao, D.; An, S. Effects of Oenanthe javanica on Nitrogen Removal in Free-Water Surface Constructed Wetlands under Low-Temperature Conditions. Int. J. Environ. Res. Public Health 2019, 16, 1420. [Google Scholar] [CrossRef]
  6. Zhao, D.; Zhang, M.; Liu, Z.; Sheng, J.; An, S. Can cold-season macrophytes at the senescence stage improve nitrogen removal in integrated constructed wetland systems treating low carbon/nitrogen effluent? Bioresour. Technol. 2018, 265, 380–386. [Google Scholar] [CrossRef]
  7. Gao, Y.; Zhang, W.; Gao, B.; Jia, W.; Miao, A.; Xiao, L.; Yang, L. Highly efficient removal of nitrogen and phosphorus in an electrolysis-integrated horizontal subsurface-flow constructed wetland amended with biochar. Water Res. 2018, 139, 301–310. [Google Scholar] [CrossRef]
  8. Vymazal, J. Constructed wetlands for wastewater treatment. Ecol. Eng. 2005, 25, 475–477. [Google Scholar] [CrossRef]
  9. Vymazal, J. Constructed wetlands for treatment of industrial wastewaters: A review. Ecol. Eng. 2014, 73, 724–751. [Google Scholar] [CrossRef]
  10. Morvannou, A.; Choubert, J.M.; Vanclooster, M.; Molle, P. Modeling nitrogen removal in a vertical flow constructed wetland treating directly domestic wastewater. Ecol. Eng. 2014, 70, 379–386. [Google Scholar] [CrossRef]
  11. Chen, S.K.; Jang, C.S.; Chou, C.Y. Assessment of spatiotemporal variations in river water quality for sustainable environmental and recreational management in the highly urbanized Danshui River basin. Environ. Monit. Assess. 2019, 191, 100. [Google Scholar] [CrossRef]
  12. Liu, D.; Ge, Y.; Chang, J.; Peng, C.; Gu, B.; Chan, G.Y.S.; Wu, X. Constructed wetlands in China: Recent developments and future challenges. Front. Ecol. Environ. 2009, 7, 261–268. [Google Scholar] [CrossRef]
  13. Zhang, D.Q.; Jinadasa, K.B.; Gersberg, R.M.; Liu, Y.; Ng, W.J.; Tan, S.K. Application of constructed wetlands for wastewater treatment in developing countries--a review of recent developments (2000–2013). J. Environ. Manag. 2014, 141, 116–131. [Google Scholar] [CrossRef]
  14. Li, X.; Li, Y.; Lv, D.; Li, Y.; Wu, J. Nitrogen and phosphorus removal performance and bacterial communities in a multi-stage surface flow constructed wetland treating rural domestic sewage. Sci. Total Environ. 2020, 709, 136235. [Google Scholar] [CrossRef]
  15. Zhu, T.; Gao, J.; Huang, Z.; Shang, N.; Gao, J.; Zhang, J.; Cai, M. Comparison of performance of two large-scale vertical-flow constructed wetlands treating wastewater treatment plant tail-water: Contaminants removal and associated microbial community. J. Environ. Manag. 2021, 278, 111564. [Google Scholar] [CrossRef]
  16. Cooper, D.; Griffin, P.; Cooper, P. Factors affecting the longevity of sub-surface horizontal flow systems operating as tertiary treatment for sewage effluent. Water Sci. Technol. 2005, 51, 127–135. [Google Scholar] [CrossRef]
  17. Nivala, J.; Rousseau, D.P.L. Reversing clogging in subsurface-flow constructed wetlands by hydrogen peroxide treatment: Two case studies. Water Sci. Technol. 2009, 59, 2037–2046. [Google Scholar] [CrossRef]
  18. Zhang, M.; Zhao, D.; Chen, C.; Yang, J.; Lu, Q.; Zhang, N.; Leng, X.; An, S. The effect of re-startup strategies on the recovery of constructed wetlands after long-term resting operation. Bioresour. Technol. 2020, 311, 123583. [Google Scholar] [CrossRef]
  19. Li, C.; Liu, Q.; Fan, J.; Peng, Y.; Du, R. Metagenomics-based interpretation of selective bioaugmentation promoting partial-denitrification coupling with anammox process reactivation in suspended sludge system. Chem. Eng. J. 2023, 454, 139977. [Google Scholar] [CrossRef]
  20. Wang, X.; Tian, Y.; Zhao, X.; Peng, S.; Wu, Q.; Yan, L. Effects of aeration position on organics, nitrogen and phosphorus removal in combined oxidation pond-constructed wetland systems. Bioresour. Technol. 2015, 198, 7–15. [Google Scholar] [CrossRef]
  21. Boog, J.; Nivala, J.; Aubron, T.; Wallace, S.; van Afferden, M.; Muller, R.A. Hydraulic characterization and optimization of total nitrogen removal in an aerated vertical subsurface flow treatment wetland. Bioresour. Technol. 2014, 162, 166–174. [Google Scholar] [CrossRef] [PubMed]
  22. Dong, H.; Qiang, Z.; Li, T.; Jin, H.; Chen, W. Effect of artificial aeration on the performance of vertical-flow constructed wetland treating heavily polluted river water. J. Environ. Sci. 2012, 24, 596–601. [Google Scholar] [CrossRef] [PubMed]
  23. Hu, N.; He, J.; Shi, W.; He, J.; Lv, B.; Liang, Y.; Huang, L. Ecological restoration for the Liangtan river by Rotating biological contactors combined with hybrid constructed wetlands. J. Clean. Prod. 2022, 375, 134189. [Google Scholar] [CrossRef]
  24. Kadlec, R.H.; Wallace, S. Treatment Wetlands, 2nd ed.; CRC Press Taylor & Francis Group: Boca Raton, FL, USA, 2009. [Google Scholar]
  25. Aiello, R.; Bagarello, V.; Barbagallo, S.; Iovino, M.; Marzo, A.; Toscano, A. Evaluation of clogging in full-scale subsurface flow constructed wetlands. Ecol. Eng. 2016, 95, 505–513. [Google Scholar] [CrossRef]
  26. Du, L.; Trinh, X.; Chen, Q.; Wang, C.; Wang, H.; Xia, X.; Zhou, Q.; Xu, D.; Wu, Z. Enhancement of microbial nitrogen removal pathway by vegetation in Integrated Vertical-Flow Constructed Wetlands (IVCWs) for treating reclaimed water. Bioresour. Technol. 2018, 249, 644–651. [Google Scholar] [CrossRef] [PubMed]
  27. Godos, I.; Vargas, V.A.; Blanco, S.; Gonzalez, M.C.; Soto, R.; Garcia-Encina, P.A.; Becares, E.; Munoz, R. A comparative evaluation of microalgae for the degradation of piggery wastewater under photosynthetic oxygenation. Bioresour. Technol. 2010, 101, 5150–5158. [Google Scholar] [CrossRef]
  28. Wu, Y.; Han, R.; Yang, X.; Zhang, Y.; Zhang, R. Long-term performance of an integrated constructed wetland for advanced treatment of mixed wastewater. Ecol. Eng. 2017, 99, 91–98. [Google Scholar] [CrossRef]
  29. Saggai, M.M.; Ainouche, A.; Nelson, M.; Cattin, F.; El Amrani, A. Long-term investigation of constructed wetland wastewater treatment and reuse: Selection of adapted plant species for metaremediation. J. Environ. Manag. 2017, 201, 120–128. [Google Scholar] [CrossRef]
  30. Wang, B.; Jiao, E.; Guo, Y.; Zhang, L.; Meng, Q.; Zeng, W.; Peng, Y. Investigation of the polyphosphate-accumulating organism population in the full-scale simultaneous chemical phosphorus removal system. Environ. Sci. Pollut. Res. Int. 2020, 27, 37877–37886. [Google Scholar] [CrossRef]
  31. Rousseau, D.P.L.; Horton, D.; Griffin, P.; Vanrolleghem, P.A.; Pauw, N.D. Impact of operational maintenance on the asset life of storm reed beds. Water Sci. Technol. 2005, 51, 243–250. [Google Scholar] [CrossRef]
  32. Ansola, G.; Arroyo, P.; Saenz de Miera, L.E. Characterisation of the soil bacterial community structure and composition of natural and constructed wetlands. Sci. Total Environ. 2014, 473–474, 63–71. [Google Scholar] [CrossRef]
  33. Wu, Y.; Han, R.; Yang, X.; Fang, X.; Chen, X.; Yang, D.; Zhang, R. Correlating microbial community with physicochemical indices and structures of a full-scale integrated constructed wetland system. Appl. Microbiol. Biotechnol. 2016, 100, 6917–6926. [Google Scholar] [CrossRef]
  34. Zhang, Y.; You, X.; Huang, S.; Wang, M.; Dong, J. Knowledge Atlas on the Relationship between Water Management and Constructed Wetlands—A Bibliometric Analysis Based on CiteSpace. Sustainability 2022, 14, 8288. [Google Scholar] [CrossRef]
  35. Zhang, Y.; Ji, Z.; Pei, Y. Nutrient removal and microbial community structure in an artificial-natural coupled wetland system. Process Saf. Environ. Prot. 2021, 147, 1160–1170. [Google Scholar] [CrossRef]
  36. Li, D.; Ye, B.; Hou, Z.; Chu, Z.; Zheng, B. Long-term performance and microbial distribution of a filed-scale storing multi-pond constructed wetland with Ottelia acuminata for the treatment of non-point source pollution. J. Clean. Prod. 2020, 262, 121367. [Google Scholar] [CrossRef]
  37. Li, H.; Liu, F.; Luo, P.; Chen, X.; Chen, J.; Huang, Z.; Peng, J.; Xiao, R.; Wu, J. Stimulation of optimized influent C:N ratios on nitrogen removal in surface flow constructed wetlands: Performance and microbial mechanisms. Sci. Total Environ. 2019, 694, 133575. [Google Scholar] [CrossRef]
  38. Fumasoli, A.; Morgenroth, E.; Udert, K.M. Modeling the low pH limit of Nitrosomonas eutropha in high-strength nitrogen wastewaters. Water Res. 2015, 83, 161–170. [Google Scholar] [CrossRef]
  39. Gao, J.; Zhu, T.; Liu, C.; Zhang, J.; Gao, J.; Zhang, J.; Cai, M.; Li, Y. Ammonium removal characteristics of heterotrophic nitrifying bacterium Pseudomonas stutzeri GEP-01 with potential for treatment of ammonium-rich wastewater. Bioprocess Biosyst. Eng. 2020, 43, 959–969. [Google Scholar] [CrossRef]
  40. Chen, Y.; Wen, Y.; Tang, Z.; Huang, J.; Zhou, Q.; Vymazal, J. Effects of plant biomass on bacterial community structure in constructed wetlands used for tertiary wastewater treatment. Ecol. Eng. 2015, 84, 38–45. [Google Scholar] [CrossRef]
  41. Li, D.; Chu, Z.; Zeng, Z.; Sima, M.; Huang, M.; Zheng, B. Effects of design parameters, microbial community and nitrogen removal on the field-scale multi-pond constructed wetlands. Sci. Total Environ. 2021, 797, 148989. [Google Scholar] [CrossRef]
  42. Qiu, G.; Zuniga-Montanez, R.; Law, Y.; Thi, S.S.; Nguyen, T.Q.N.; Eganathan, K.; Liu, X.; Nielsen, P.H.; Williams, R.B.H.; Wuertz, S. Polyphosphate-accumulating organisms in full-scale tropical wastewater treatment plants use diverse carbon sources. Water Res. 2019, 149, 496–510. [Google Scholar] [CrossRef] [PubMed]
  43. Fernando, E.Y.; McIlroy, S.J.; Nierychlo, M.; Herbst, F.A.; Petriglieri, F.; Schmid, M.C.; Wagner, M.; Nielsen, J.L.; Nielsen, P.H. Resolving the individual contribution of key microbial populations to enhanced biological phosphorus removal with Raman-FISH. ISME J. 2019, 13, 1933–1946. [Google Scholar] [CrossRef] [PubMed]
  44. Tang, X.Q.; Huang, S.L.; Fciwem, M.S. Comparison of phosphorus removal between vertical subsurface flow constructed wetlands with different substrates. Water Environ. J. 2009, 23, 180–188. [Google Scholar] [CrossRef]
Figure 1. Schematic of HZ-CW system. AP, aerated pond; FP, facultative pond; FWS1–FWS4, four free water surface flow constructed wetlands follow the water flow; EP, ecological pond.
Processes 11 01469 g001
Figure 2. The influent and effluent DO concentrations of HZ-CW in the 4th, 5th and 1st year (n = 36 for each year), and the DO concentrations in different seasons (n = 9 for each season). Data are given as the mean ± s.d. InC, influent concentration; EffC, effluent concentration.
Processes 11 01469 g002
Figure 3. The performance of HZ-CW for COD removal during the study period. (a) The influent and effluent concentrations, (b) COD removal efficiencies (%) in different seasons (n = 9 for each season), (c) the mean COD removal efficiencies (%) in each year (the 1st year, 4th year, and 5th year, n = 36 for each year). Different letters indicate significant differences (p < 0.05) among different years. Data are given as the mean ± s.d. InC: influent concentration; EffC: effluent concentration.
Processes 11 01469 g003
Figure 4. The performance of HZ-WC for NH4+-N removal during the study period. (a) The influent and effluent concentrations, (b) NH4+-N removal efficiencies (%) in different seasons during the study period (n = 9 for each season), (c) the mean NH4+-N removal efficiencies (%) in each year (the 1st year, 4th year, and 5th year, n = 36 for each year). Different letters indicate significant differences (p < 0.05) among different years. Data are given as the mean ± s.d. InC: influent concentration; EffC: effluent concentration.
Processes 11 01469 g004
Figure 5. The performance of HZ-CW for TP removal during the study period. (a) The influent and effluent concentrations, (b) TP removal efficiencies (%) in different seasons (n = 9 for each season), (c) the mean TP removal efficiencies (%) in each year (the 1st year, 4th year, and 5th year, n = 36 for each year). Different letters indicate significant differences (p < 0.05) among different years. Data are given as the mean ± s.d. InC: influent concentration; EffC: effluent concentration.
Processes 11 01469 g005
Figure 6. Relative abundance of bacterial community composition of each stage at the (a) phylum and (b) genus level by 16S rRNA MiSeq sequencing. The sum of the relative abundance of all the other phyla in the figure is grouped into “OTHERS”. AP, aerated pond; FP, facultative pond; FWS1–FWS4, four free water surface flow constructed wetlands follow the water flow; EP, ecological pond.
Processes 11 01469 g006
Table 1. Comparison of phylotype coverage and diversity estimation of the 16S rRNA gene libraries at 97% similarity from the Miseq high-throughput analysis.
Samples97% Similarity
OTUsCoverageChao1Shannon
AP4371 ± 437 ab0.9695638 ± 137 ab8.608 ± 1.41 a
FP1464 ± 948 c0.9901883 ± 1014 c5.486 ± 0.28 b
FWS14691 ± 1633 ab0.9666116 ± 2031 ab8.894 ± 1.93 a
FWS24924 ± 1948 a0.9686099 ± 2384 ab9.317 ± 2.40 a
FWS34661 ± 1831 ab0.9675989 ± 2205 ab8.9785 ± 2.55 a
FWS45154 ± 761 a0.9643267 ± 2116 bc9.331 ± 1.66 a
EP2481 ± 1459 bc0.9826572 ± 2220 a5.7825 ± 1.85 b
Coverage (Good’s coverage), richness indices (chao1), diversity indices (Shannon) were calculated by the Mothur program. Different superscript lower case letters indicate statistically significant differences among HZ-CW elements (p < 0.05); AP, aerated pond; FP, facultative pond; FWS1–FWS4, four free water surface flow constructed wetlands follow the water flow; EP, ecological pond.
Table 2. The genera of nitrifying and polyphosphate accumulating bacteria in each stage of SHZ-CW.
GenusRelative Abundances (%)
APFPFWS1FWS2FWS3FWS4EP
AOB unidentified_Nitrosomonadaceae0.1780.0260.2870.1710.2220.5930.036
Nitrosomonas0.0130.0110.0070.0070.0080.0050.002
NOBunidentified_Nitrospirae0.1070.0030.1140.2000.1730.1350.014
unidentified_Nitrospiraceae0.1040.0210.0450.0350.0070.0340.030
Candidatus_Nitrotoga0.0420.0020.0220.0130.0100.0190.003
AnammoxCandidatus_Anammoximicrobium0.0260.0000.0200.0430.0260.0260.005
unidentified_Brocadiales0.0000.0000.0000.0010.0020.0180.000
PAOsCandidatus_Brocadia0.0010.0010.0070.0000.0020.0710.000
Thiothrix0.0000.0010.0020.0090.0020.0010.000
Microlunatus0.0000.0000.0010.0010.0030.0000.001
Disclaimer/Publisher’s Note: The statements, opinions and data contained in all publications are solely those of the individual author(s) and contributor(s) and not of MDPI and/or the editor(s). MDPI and/or the editor(s) disclaim responsibility for any injury to people or property resulting from any ideas, methods, instructions or products referred to in the content.

