Article

Hydrothermal Leaching of Amylose from Native, Oxidized and Heat-Treated Starches

by
Mykola V. Nikolenko
1,
Viktoriia D. Myrhorodska-Terentieva
1,
Yuriy Sakhno
2,
Deb P. Jaisi
2,
Blaž Likozar
3 and
Andrii Kostyniuk
3,*
1
Faculty of Chemical Technologies and Ecology, Ukrainian State University of Chemical Technology, Gagarin Avenue 8, 49005 Dnipro, Ukraine
2
Department of Plant and Soil Sciences, University of Delaware, Newark, DE 19716, USA
3
Department of Catalysis and Chemical Reaction Engineering, National Institute of Chemistry, Hajdrihova 19, 1001 Ljubljana, Slovenia
*
Author to whom correspondence should be addressed.
Processes 2023, 11(5), 1464; https://doi.org/10.3390/pr11051464
Submission received: 12 April 2023 / Revised: 8 May 2023 / Accepted: 10 May 2023 / Published: 11 May 2023

Abstract

:
The kinetics of amylose leaching in hot, excess water from native, oxidized-by-potassium permanganate and heat-treated potato starch at temperatures of 62–90 °C was investigated in isothermal conditions. For the first time, it was proposed to describe the kinetic data by the Kroger–Ziegler equation. It was found that for native starch in the range of 62–70 °C, the activation energy of the amylose leaching process is 192.3 kJ/mol, and at a temperature of 80–90 °C, it decreases to 22 kJ/mol. Similar patterns were established for modified starches. In the kinetic mode, the activation energy was 102.5 kJ/mol for oxidized starch and 44.7 and 82.5 kJ/mol for heat-treated starches at a temperature of 135 °C for 2.5 and 5 h. In the diffusion mode, it was: 18.7 kJ/mol for oxidized and 16.2 and 18.9 kJ/mol for heat-treated starches for 2.5 and 5 h, respectively. It is shown that the consideration of amylose leaching as a heterogeneous pseudochemical process makes it possible to explain the change in the activation energy with increasing temperature by the transition of the leaching process from the kinetic to the diffusion mode. As such a pseudochemical process, it is proposed to consider the breaking of multiple hydrogen bonds between amylose macromolecules. The change in the activation energies of amylose extraction from modified starches is explained by the change in the degree of amylose polymerization. Thin-layer chromatography was used to compare the molecular weight distributions of the resulting modified amylose samples. FTIR spectroscopy and thermal methods of analysis were used to study the transformations of starch during heat treatment.

1. Introduction

Despite the long history of the study of native and modified starches, their research still does not lose its relevance, primarily due to the wide application of starch in food technology [1,2,3,4]. In addition, starches are often used in the pulp and paper industry, textile industry, construction industry, pharmacy, in the production of packaging materials, disposable dishes, etc. [5]. In food chemistry, the study of the processes that occur during the processing of starch-containing raw materials is important in connection with the tasks of creating food products with the desired textural and nutritional characteristics [6].
The technical use of starches is related to their property of forming pasty solutions. There are various methods of gelatinization of starches—chemical (treatment with solutions of alkalis, calcium or magnesium chlorides), mechanical and hydrothermal. Hydrothermal gelatinization of starch is an endothermic process of destruction of starch granules in an aqueous solution with the formation of a hydrogel as a result of the temperature increase. Today, it is generally accepted to consider gelatinization as a set of stages such as saturation of amorphous parts of starch granules with water with the destruction of hydrogen bonds between macromolecules of biopolymers, an increase in the volume (swelling) of the granules until their outer shell (membrane) ruptures due to an increase in osmotic pressure, leaching of amylose from the granules into a hydrogen solution, formation of a sol and its transition into a gel [7,8,9,10,11,12,13,14,15]. The processes of hydrothermal leaching of amylose from starch by the in vitro method were studied in works [16,17,18,19,20,21].
The separation of amylose from amylopectin by the method of water leaching is carried out by heating a suspension of starch in an excess of water to a temperature slightly above the temperature of gelatinization, so as not to disturb the integrity of the granules. Amylose can be removed by centrifugation or isolated from solution by precipitation with the addition of a hydrophobic agent that forms inclusion complexes [22]. Authors [21,23,24] suggest leaching of amylose not with water but with alkali or calcium chloride solutions. The released amylose was separated and purified by the method of recrystallization with n-butanol [25].
In the literature, a number of factors influencing the processes of leaching amylose from starch granules are considered: ultrasound [26,27], presence of polysaccharides, proteins, pectin, sugars, and salt [17,28,29,30,31], amylose content in granules [32], the size of starch granules [33], rate of heating of starch in water [19], degree of melting of starch crystals [17], the moisture content [11]. Such a large number of factors affecting the process of amylose leaching indicates the complexity of this process and the need to standardize the conditions of its experimental study.
The kinetics of starch leaching and gelatinization processes have been repeatedly studied over the past 50 years. For example, Turhan and Gunasekaran [16] investigated the kinetics of gelatinization in situ and in vitro of starches of hard and soft wheat when boiled in water in the temperature range 60–100 °C. It was found that gelatinization of starch in both cases followed first-order reaction kinetics. For in vitro gelatinization, the average (i.e., for the entire studied temperature range) activation energy (Ea) was 76 kJ/mol. The in situ gelatinization was characterized by the average activation energy 108 kJ/mol. In our opinion, such averaging of Ea values cannot be considered correct. For example, the same authors considered the possibility of describing the experimental data for in situ gelatinization with two values Ea: 137 kJ/mol at a temperature below 75 °C and 79 kJ/mol at a higher temperature 75 °C. It has been suggested that the sudden decrease in Ea above 75 °C indicates some structural changes in the wheat grains leading to a higher rate of water transfer compared to the rate of the gelatinization process. However, the reasons for the change in the speed ratio of these processes are not clear and are not commented on.
Similar results have been published by Spigno and De Faveri [34]. They showed that if the experimental data on the kinetics of gelatinization are described in the coordinates of the Arrhenius equation by one linear correlation, then with the correlation coefficient R2 = 0.76, the value of Ea is obtained close to 26 kJ/mol. However, if the experimental points are described by two linear correlations (with correlation coefficients greater than 0.9), then different Ea results for different temperatures: up to 79 °C Ea = 144 kJ/mol, above 79 °C Ea = 14 kJ/mol. It is obvious that in the first variant of data approximation with such a small value of the correlation coefficient, the found value of Ea has no physical meaning.
The idea of describing the kinetics of gelatinization by two activation energies was first expressed by Suzuki et al. [35]. These authors found that the Ea values for gelatinization of white rice above and below 75 °C are 83 and 37 kJ/mol, respectively. Many other authors also observed the effect of dependence of Ea of the gelatinization process on temperature. For example, for in situ gelatinization, Ea decreases from 78 to 44 kJ/mol at a temperature above 85 °C during gelatinization of brown rice starch [36], from 187 to 99 kJ/mol above 85 °C during gelatinization of rice starch [37], from 40 to 20 kJ/mol above 60 °C during gelatinization of soybean starch [38], and from 111 to 45 kJ/mol above 80 °C during gelatinization of corn starch [20]. The following activation energy values were found for in vitro gelatinization of extracted starches: 234 kJ/mol for the temperature interval 67–86 °C [39], 110 kJ/mol for the interval 53–65 °C [40], and 42 kJ/mol for the interval 73–92 °C [41].
A number of authors discuss the effect of changing Ea in the process of gelatinization above a certain temperature in terms of a certain “breaking point” in the kinetics of the process—the so-called critical temperature point of the “solid-liquid” phase transition, which divides the gelatinization process into two stages: swelling of the amorphous part and destruction of the crystalline part of starch granules [36,42,43,44,45]. In fact, it is assumed that at first the gelatinization takes place in the amorphous areas and after the “breaking point” in the crystalline areas. However, for all studied starches, Ea is initially higher, and then, after reaching the “break point” temperature, its value decreases sharply. It is obvious that amorphous formations in starch granules are easier to “destroy” than crystalline ones; that is, from the point of view of successive dissolution of amorphous and crystalline parts of the granule, there should be an inverse relationship—the first Ea is less and then more. Thus, the idea of a “breaking point” in the kinetics of the process does not explain the regularities observed. In our opinion, the concept of the critical temperature point of the phase transition is valid only for whole granules. The fact is that during the separation of starch from vegetable raw materials, part of the granules is destroyed. It is obvious that for destroyed granules, the stage of their swelling accelerates significantly, which explains the observed decrease in the temperature of the start of gelatinization. This regularity is well confirmed by the known facts of the possibility of partial gelatinization of starch at temperatures below the “breaking point” [44].
The activation energy of gelatinization was also determined by Ahmed [46], who proposed considering the gelatinization process as a chemical reaction with a stepwise dependence of its speed on the starch concentration. In the Arrhenius equation, they did not use the rate constants of gelatinization of starch but the ratio of the rate of change in the rheological parameter (modulus of elasticity) of the paste solution to the value of this parameter. However, it is known that such a module does not depend linearly on the concentration of the polymer in the solution, which introduces an error into the results of the calculation of activation energies.
Li and Hu [47] note that most of the starches studied by them in conditions of limited water content showed an order of the gelatinization reaction close to 2.5. This differs from gelatinization of starch in isothermal conditions with an excess of water, which corresponds to first-order kinetics [11,16,48]. Spigno and De Faveri [34] showed that the value of Ea depends on the choice of the type of kinetic equation. All models tested by the authors (Kissinger, Mel–Johnson–Avrami, two- and three-dimensional diffusion) gave different values of Ea: at t < 79.5 °C Ea = 144–230 kJ/mol, at t > 79.5 °C Ea = 14–30 kJ/mol. In our opinion, the choice of a kinetic model should not be formal (for example, based on the value of the correlation coefficient) but based on the physical meaning of the analyzed process.
Thus, the kinetics and mechanism of the processes of gelatinization of starches and leaching of amylose from starch granules are still the subject of intensive research. It is surprising that the effect of the dependence of the activation energy of these processes on temperature has not yet been explained, even despite detailed studies of the molecular structure of amylopectin and amylose biopolymers and their intermolecular interactions [49,50,51].
The purpose of our research was to study the kinetics of hydrothermal leaching of amylose from native and modified starches by the in vitro method in isothermal conditions with excess water content. Based on the research results, the kinetic model was used to determine the rate constants and activation energies of the amylose leaching process. To understand the processes occurring during the modification of starch, the changes in the average size of granules and molecular weight distribution of amylose were studied. FTIR spectroscopy and thermal methods of analysis were used to study the transformations of starch during heat treatment.

2. Materials and Methods

2.1. Materials

The experiments used potato starch of the highest grade (DSTU 4286: 2004) with a mass fraction of moisture of 16.8% and total ash of 0.30%. An amount of 100 g of starch (in terms of dry matter) were neutralized in 8.5 cm3 of 0.10 M NaOH solution.

2.2. Methods of Modification of Starch

Heat treatment (dextrinization) of native starch was carried out without adding acids or salts by one-stage dry heating of starch powder at a temperature of 135 °C for 2.5 and 5 h. Starch was deposited in a thin layer in a drying cabinet and heating was carried out at a rate of 10 °C/min, since in previous studies it was found that under such conditions the maximum heat absorption on the curve of differential thermal analysis (DTA) is achieved. After cooling, the heat-treated starch samples were washed for 2 min. with distilled water on a Buchner funnel under vacuum and dried at room temperature to obtain starch with a moisture content of 20%.
To obtain oxidized starch, 150 mL of distilled water and 10 mL of concentrated hydrochloric acid solution were added to 30 g of starch. The suspension was stirred, heated to 35–40 °C, 30 mL of 0.15% KMnO4 solution was added and kept with periodic stirring for 30 min in a water bath at a temperature of 35–40 °C. After oxidation, the starchy milk was filtered on a Buchner funnel under vacuum, washed for neutralization with sodium carbonate and excess distilled water, and dried at room temperature to obtain starch with a moisture content of mass fraction 20%.

2.3. Microscopic Studies of Starch

Microscopy studies were conducted using a scanning electron microscope JEOL JSM-6510 (JEOL, Tokyo, Japan). Starch samples were examined at a magnification from 300 to 850 times.

2.4. Methodology of Kinetic Measurements

To study the kinetics of amylose leaching, 400.0 mL of distilled water was poured into a round-bottomed flask with a paddle stirrer. The flask was placed in a thermostat and heated to a set temperature in the range of 62–90 °C. Then, with constant stirring (at least 150 rpm), a starch weighing 4.00 g was added to the solution, and 1.5–2 mL of the suspension solution was periodically taken into centrifuge tubes. Tubes with solutions were immediately placed in cold water to stop the gelatinization process, then subjected to centrifugation for 5 min. at 3000 rpm. Next, aliquots of transparent solutions with a volume of 1.00 mL were taken from each test tube, transferred to 100.0 mL volumetric flasks, and after was added 0.5 mL of a 5% iodine solution (prepared in a 20% KI solution) and up to the mark with distilled water and mixed well. The light absorption of the solutions was measured after 30 min. using a SF-46 spectrophotometer at a wavelength of 610 nm. In order to determine the maximum (equilibrium) saturation of the amylose solution, the starch suspension was kept in a round-bottomed flask at the same temperatures for 6 h; then, aliquots of the solution were taken, and the light absorption of the amylose solution with iodine was measured according to the method described above.
The degree of amylose leaching was calculated from the data of three parallel measurements as the ratio of the current values of light absorption of its solutions with iodine to its maximum value for the given conditions of the isothermal experiment. The chosen conditions of the experiment made it possible to obtain amylose solutions in concentrations that did not go beyond the linear dependence of the light absorption of its complexes with iodine on the concentration: 0–2.2 mg/mL.

2.5. Thin-Layer Chromatographic Studies

The method of thin-layer chromatography (TLC) was used to compare the molecular weight distribution of the studied amylose samples. Prepared amylose solutions were applied to filter paper of high density (black or blue tape) measuring 10 × 10 cm using micropipettes with a capillary end. The size of the spots did not exceed 3 mm in diameter. After drying in air at room temperature, the plate was placed in a horizontal chromatographic chamber with a solvent (40% solution of ethyl alcohol), closed with a lid and saturated with steam for one hour. The starting edge of the paper was immersed in the mobile phase, and its front was expected to pass at a distance of 0.5 cm from the opposite edge of the paper. Then the plate was dried and sprayed with a diluted solution of iodine.
The choice of filter paper as a stationary phase is due to the fact that industrial chromatographic plates for TLC are prepared using starches as a binding component, and therefore, when using them, iodine cannot be used to visualize amylose spots—iodine reacts not only with amylose, but also with starch in a non-moving form phase.
The analysis of chromatographic spots of amylose with iodine was carried out by the method of colorimetry, which is based on the calculation of the color characteristics of the analyzed object. To determine the color coordinates, chromatographic spots were scanned on an Epson scanner. Software with default settings and scan resolution of 300 dpi was used. The file was saved in TIFF (24 bit) format without compression. In the graphic editor Gimp, the image of the spot was divided into separate strips with a width of 1 pixel, an averaging operation was performed along each row of the image, and the values of the color coordinates L, a and b were measured in the CIELab color space. L is illuminance, which is a combination of brightness and intensity and varies from 0 to 100, that is, from the darkest to the lightest color; a and b are coordinates that indicate the position of the color in the range from green to red and from blue to yellow.

2.6. Thermal Methods of Analysis and FTIR Spectroscopy Studies

Thermal analyses of starch during heat treatment were performed by using SDT Q600. The parameters of the STD furnace were set as follows: dehydration at a constant 50 °C over 30 min, followed by heating rump 1 °C/min up to 250 °C. Thermogravimetric (TG) and differential scanning calorimetry (DSC) analyses were performed under an N2 atmosphere at the flow rate of 50 mL/min.
FTIR spectra were collected in a Nicolet 380 FTIR spectrometer employed with single reflection Attenuated total reflectance (ATR) cell—Golden Gate with solid type IIa diamond enabling spectra collection in the temperature range of 25–250 °C. To refer intensity to the same optical density, the dynamometric limiter of the ATR cell was adopted to ensure that the pressure applied to the diamond crystal through the sample was the same in each measurement. FTIR spectra of starches were recorded during heating of samples from 50 to 250 °C with a heating rate of 4 °C/min. Starch samples were previously lyophilized over 12 using a freeze dryer.

2.7. Statistical Analysis

The reproducibility of all measurements was checked by means of parallel experiments. Statistical analysis of the results was carried out using Excel software. Gross false results were rejected by performing a Q-test at a confidence level of 90%. The confidence interval was calculated with a confidence probability of 95%. The relative standard deviation of measurements of the degree of amylose leaching did not exceed 2%.

3. Results

3.1. Microscopic Studies

In order to choose a model of the amylose leaching process, we conducted microscopic studies of starch. Figure 1 presents photographs of native and heat-treated starch powders at 610- and 850-times magnification. As can be seen from these photographs, the samples under investigation contain not only whole pellets of various sizes and a rounded shape, but also partially destroyed pellets with many smaller fragments. On the chips of the destroyed granules, it is clearly visible that they are covered with a thin shell (membrane).
Figure 2 shows histograms of the size distribution of starch particles. In the calculations, both intact and destroyed granules were used, and particles with a size of less than 5 μm were not taken into account in the calculations. The results of counting the number of particles in micrographs were approximated by Gaussian functions. According to these approximations, the most likely particle size of the studied sample of native starch is 24.4 μm with a half-width of the Gaussian distribution curve of 25.1 μm. After heat treatment of starch for one hour at 135 °C, the maximum of the size distribution curve shifted to 21.7 μm, and the half-width of the curve decreased to 21.3 μm.
The decrease in the size of starch particles after its heat treatment is well explained by their dehydration and change in the degree of packing of biopolymer macromolecules as a result of their possible decomposition and repolymerization. However, the quality of starch particles did not change after heat treatment. Thus, both starch samples are characterized by the same morphology, and the same models of the amylose leaching process can be applied to them. One part of the amylose is not in direct contact with the solution, as it is inside the starch granules, and therefore until the decomposition of the membrane shell of the granule due to its swelling (i.e., saturation with water), it remains inside the granules and does not participate in the gelatinization process. The rest of the amylose is contained in the decomposed granules and is therefore in direct contact with water, i.e., in their extraction into the solution, there is no stage of destruction of the membrane shell. At the same time, for such amylose, an inductive period due to the hydration process of both amorphous and crystalline amylose should be observed.

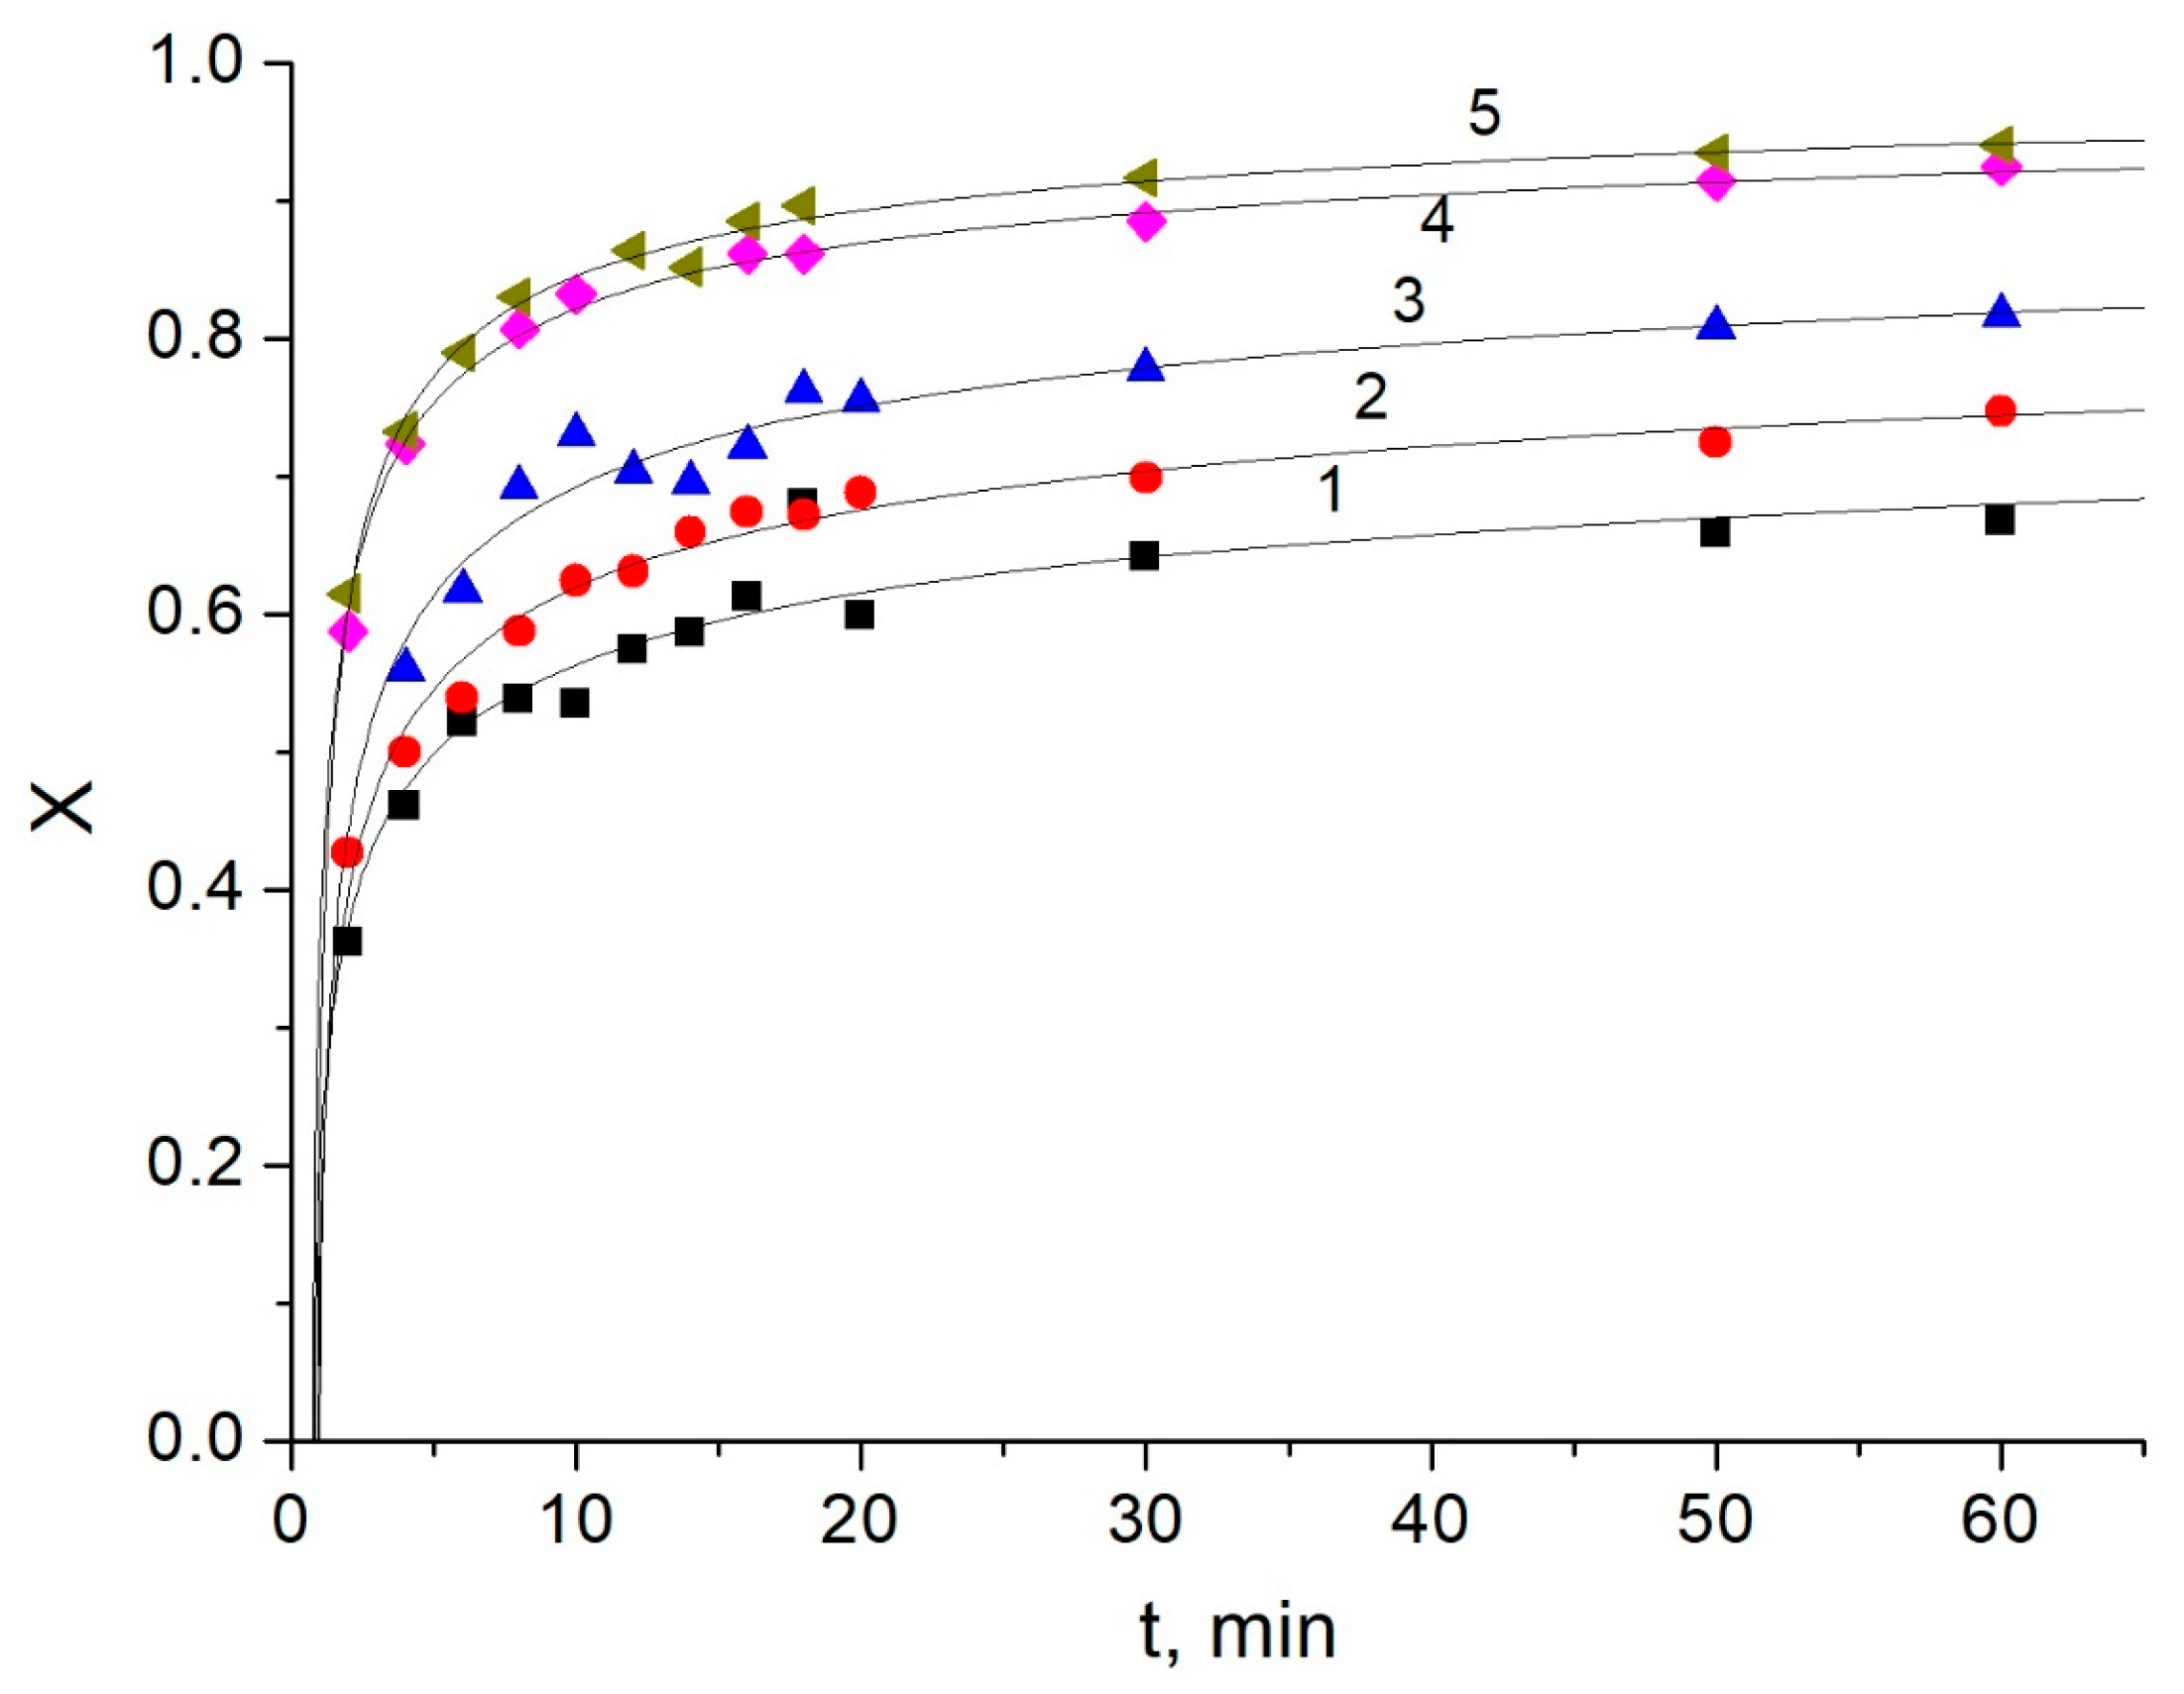
3.2. Kinetic Studies of Amylose Leaching

In all experiments on hydrothermal leaching of starches, a natural increase in the amount of amylose in the solution was observed as the duration of leaching increased. The graphs have the form of convex curves that tend to saturation with increasing leaching time (Figure 3, Figure 4, Figure 5 and Figure 6).
Assuming that the process of amylose leaching has a diffusion nature, 12 kinetic equations were used to analyze the experimental results, which are used to describe diffusion processes in “solid-liquid” systems: one- and two-dimensional diffusion, Yander, “anti-Yander”, Kroger–Ziegler, Ginstling–Brounstein, Zhuravlev–Lesokhin–Tempelman, etc. [52].
Statistical processing of the kinetic dependences of X(t) in the coordinates of these equations according to Fisher’s variance ratio at a significance level of 0.05 showed that the hypothesis of linearity can be accepted for all the models under consideration; however, the correlation coefficients when approximating the experimental data differ significantly. The best results (R2 > 0.99) were obtained when the kinetic data were described by the Kroger–Ziegler equation:
k l n t = ( 1 ( 1 X ) 1 3 ) 2
where X is the degree of amylose extraction; k is the observed rate constant of the process; t is the isothermal holding time.
As known, the Kroger–Ziegler model considers a heterogeneous chemical process between a solid reagent A and a soluble reagent B resulting in the formation of a solid reaction product AB. In the approximation of this model for a spherical particle of a solid reagent with an effective radius of r0, a layer of reaction product with a thickness of z will be formed over a period of time t due to the chemical reaction:
r = r 0 z
where r0 is the initial radius; z is the thickness of the reaction product layer; r is the radius of a solid particle at a certain time t.
The degree of transformation of the solid reactant (1 − X) can be expressed in terms of the ratio of its volumes at the moment of time t and before the beginning of the transformation:
1 X = 4 3 π r 0 z 3 4 3 π r 0 3 = r 0 z 3 r 0 3
From this equation it follows that:
z = r 0 ( 1 1 X 1 3 )
Kroger and Ziegler suggested considering a heterogeneous chemical process with a variable diffusion coefficient of reactant particles transported through the reaction product layer: D = k 1 t . Using the Yander model, which postulates a parabolic law of dependence on the time of the gradual growth of the reaction product layer, they presented the rate of change in the thickness of the reaction product layer in the following form:
d z d t = D V m C 0 z = k 1 V m C 0 t z
where D is the diffusion coefficient; Vm is the molar volume of the reaction product; C0 is the concentration of the soluble reagent on the surface.
After separating the variables and integrating this equation:
z d z = V m C 0 k 1 d t t
We receive:
z 2 = 2 V m C 0 k 1 l n t
Let us combine Equations (2) and (3):
r 0 2 1 ( 1 X ) 1 / 3 2 = 2 V m C 0 k 1 l n t
To simplify the expression, we will denote the product of constant values as a constant k and obtain the Kroger–Ziegler equation:
k l n t = ( 1 1 X 1 / 3 ) 2
Therefore, the fundamental difference between the Kroger–Ziegler model and other models of heterogeneous chemical processes is that the diffusion coefficient of transported particles is not considered a constant, but a variable value.
With regard to the process of extracting amylose, when there is no question of a chemical reaction between reagents in solution and in the solid phase of starch granules, the use of models of heterogeneous chemical processes may appear questionable. However, if we take into account that the extraction of amylose is impossible without prior hydration of its macromolecules (the so-called granule swelling stage), then the heterogeneous reaction model can be applied to starch granules as well: water molecules from the liquid phase diffuse inside the solid granules, and the formation or destruction of hydrogen bonds interactions involving water molecules can be an analogue of the chemical interaction between water and amylose. Since the hydration of the outer layers of starch granules changes the architecture of their intermolecular bonds, the instability of the diffusion coefficient of water molecules as a reagent in this model is quite understandable.
The tangents of the angles of inclination of the obtained straight lines in the coordinates of the Kroger–Ziegler equation made it possible to determine the rate constants, which were used to construct graphs in the coordinates of the Arrhenius equation and calculate the activation energies of the investigated processes (Figure 7). It was established that in the lnk-1/T coordinates, the dependences have the form of convex curves, which are well known in the theory of heterogeneous chemical processes and testify to the dependence of the activation energy on the temperature of the process implementation: at relatively low temperatures, the process proceeds in the kinetic regime with the limiting stage of the chemical reaction at the phase interface, and at relatively high temperatures, the process goes into the diffusion mode, since the rate of the chemical reaction increases sharply with increasing temperature, and the limiting stage of the process becomes the process of diffusion of reactants (or reaction products).
Calculations for native starch according to Figure 6 showed that in the range of 62–70 °C, the activation energy of the amylose leaching process is 192.3 kJ/mol, and at a temperature of 80–90 °C, it decreases to 22 kJ/mol. These values of Ea well confirm the known literature data for different types of starches. For example, Spigno G. and De Faveri D. [34] show the values of Ea at t < 79.5 °C are 144–230 kJ/mol, and at t > 79.5 °C, they decrease to 14–30 kJ/mol. In this and many other works, lnk-1/T dependences were approximated by two straight lines, and their intersection was considered as a certain characteristic point of the gelatinization process. However, this point is not a “break” point on the curve in the coordinates of the Arrhenius equation, since the transition from the kinetic regime to the diffusive regime does not occur abruptly, but smoothly through the so-called transitional regime of the chemical process. The main problem in explaining the effect of the dependence of the activation energy of the amylose leaching process on temperature is the high value of Ea at low temperatures. If the value of the activation energy at the level of 14–30 kJ/mol can be attributed without any doubt to the diffusion process, then the Ea values of more than a hundred kJ/mol can be understood only if they characterize chemical interaction.
In our opinion, a way out of this paradox is possible using the idea of numerous hydrogen bonds between amylose macromolecules. If to break one hydrogen bond, for example, of a water dimer an energy is needed of the order of 21 kJ/mol, then for ten such bonds between OH groups of amylose macromolecules, the breaking energy should be at the level of 200 kJ/mol. Since hydrogen bonds play a major role in the crystallization of amylose and amylopectin, it should be concluded that they should also play a major role in the destruction of starch granules in the process of amylose leaching.
Thus, the destruction of multiple hydrogen bonds between amylose macromolecules should be considered as such a reaction. Therefore, amylose leaching can be considered as a heterogeneous pseudochemical process that can proceed both in kinetic and diffusion modes.
The role of reagents in such a model of a heterogeneous process “solid-liquid” is performed by amylose (solid reagent) and water (reagent from the liquid phase), and the reaction itself should be represented by a scheme:
A 2 + n H 2 O 2 A · n 2 H 2 O
where [A]2 is an amylose dimer in which macromolecules are connected by hydrogen bonds; A · n 2 H 2 O is disconnected hydrated amylose molecules.
Modification of starch by heat treatment and oxidation also led to a change in the activation energy of the amylose leaching process when it occurs in the kinetic mode in the temperature range of 62–70 °C: 102.5 kJ/mol for oxidized starch, 44.7 and 82.5 kJ/mol for heat-treated starches at a temperature of 135 °C for 2.5 and 5 h, respectively. At high temperatures, when the process is implemented in the diffusion mode, changes in the activation energy compared to native starch are not so significant: 22.0 kJ/mol for native starch, 18.7 kJ/mol for oxidized, 16.2 and 18.9 kJ/mol for heat-treated starches over 2.5 and 5 h, respectively.
It should be noted that for modified starches, not only the values of the activation energies but also the values of the rate constants have changed (Figure 7). According to the Arrhenius equation, a decrease in the rate constant can be caused by a change in the values of both the activation energy and the pre-exponential factor k0 (which is a characteristic of the total number of reacting atoms or molecules per unit of time, under the condition that Ea = 0). Calculations showed that with a decrease in the values of the activation energy of the amylose leaching process, the values of k0 also decrease. Figure 8 illustrates the effect of starch heat treatment time on the rate constants of the amylose leaching process in the kinetic and diffusion mode. The observed decrease in k and its subsequent increase can be explained by a change in the size of amylose molecules as a result of thermal treatment of starch. As is known, the process of thermal conversion of starches is generally considered as a combination of two opposite processes: polymerization and depolymerization starch biopolymers. Probably, at the beginning of heat treatment, the polymerization process predominates, which contributes to a decrease in the number of amylose macromolecules, a change in their configuration and, as a result, causes a decrease in the pre-exponential coefficient k0 and the rate constants. As the heat treatment continues, the depolymerization process begins to predominate, which leads to a decrease in the size of macromolecules and, accordingly, to an increase in the pre-exponential factor and the rate constant of the amylose leaching process.
The modification of starch by oxidation also led to almost a halving of the activation energy of the amylose leaching process when it proceeds in the kinetic mode in the temperature range of 62–70 °C. As is known, when starch is oxidized, destruction of its macromolecules is possible, and alcohol and aldehyde groups are partially oxidized with the formation of carbonyl and carboxyl groups. However, it should be taken into account that when starch is oxidized by permanganate ions below the temperature of gelatinization (that is, without destruction of starch granules), these processes occur mainly on the surface of the granules and the area adjacent to it, since the penetration of relatively large permanganate ions into the interior of the granule is unlikely. From this point of view, the decrease in the activation energy of the amylose leaching process from starch with a modified surface (mainly amylopectin) layer of granules remains an unclear phenomenon. In our opinion, the resolution of this contradiction is possible if we take into account that permanganate oxidation is carried out in an acidic environment. Additions of hydrochloric acid increase the oxidation-reduction potential of permanganate, but, at the same time, the process of acid hydrolysis of starch occurs in parallel, during which partial destruction of its macromolecules occurs. Hydrogen ions easily penetrate inside the granules together with water molecules during starch hydration and contribute to the process of partial destruction of amylose macromolecules and thereby cause a decrease in the activation energy of the leaching process. Thus, starch oxidized by permanganate can be more correctly considered as twice modified starch, subjected to acid hydrolysis in the inner part of the granules and oxidation in their surface layer.

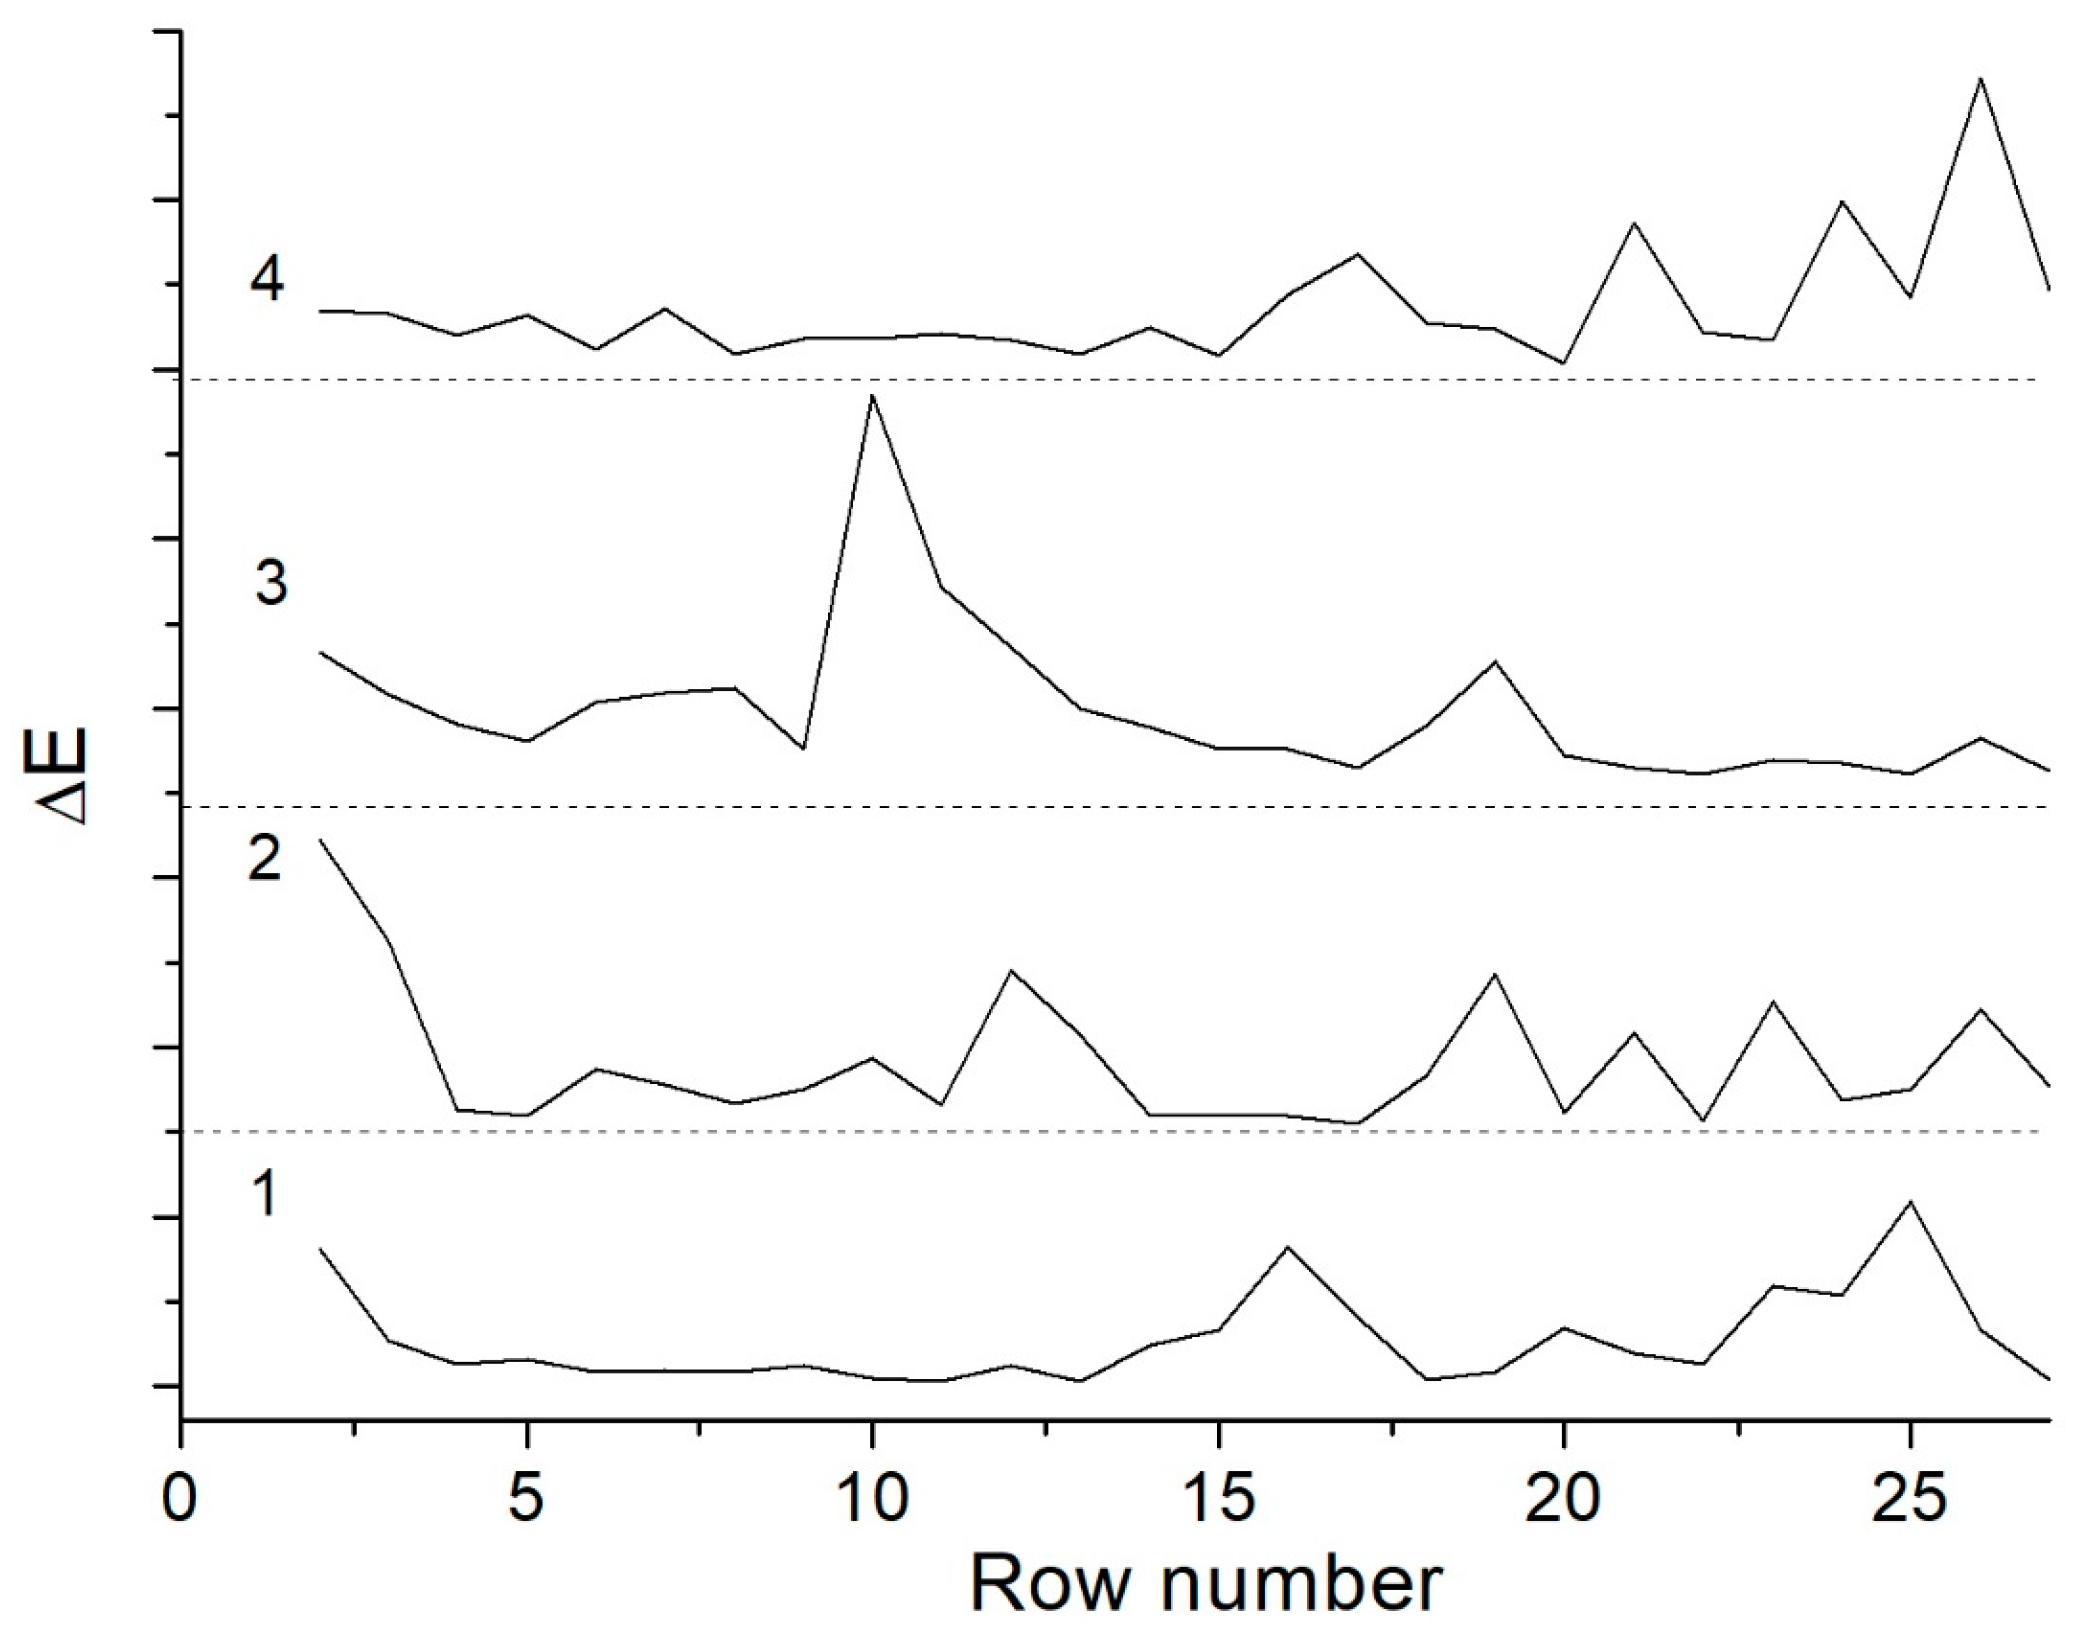
3.3. Study of Molecular Mass Distribution of Amylose Macromolecules

Changes in the activation energies of the process of hydrothermal leaching of amylose from modified starches are explained by us in terms of changes in the size of amylose macromolecules. Evidence of such changes can be provided by data on the molecular mass distribution of the obtained amylose samples. It is convenient to separate amylose into separate fractions by molar mass using a chromatographic method, since the movement of the same type of polymer macromolecules in the eluent flow is primarily controlled by their molar mass [53,54].
To compare the molecular mass distribution of the obtained amylose samples, we used the method of thin-layer chromatography. Experiments were conducted on the choice of eluent and conditions for the separation of amylose into separate fractions. It was not possible to fractionate amylose with any of the solvents used in chromatography—after its development with iodine, only one spot was observed on the paper, which remained almost at the starting line. At the same time, after scanning these spots and viewing them in an enlarged view on a computer monitor, an uneven distribution of their color in the direction of eluent movement was revealed, which is well explained by the selective movement of amylose macromolecules due to the difference in their molar masses. Therefore, the scanned photo of the chromatographic spot was processed in a graphic editor to determine the color coordinates in the CIELab system and build a profile of the color change in the direction of the eluent front movement.
The analysis of the obtained data on the color of amylose iodine complexes showed that the most informative are not the color coordinates themselves, which monotonously change along the spot with small bends or steps, but the derivatives of the functions of the colorimeters in the direction of the movement of the mobile phase front. An example of a colorimetric function often used in chemical analysis is the total color difference function (ΔE), which is the distance between two points in the color space and is determined by the formula:
Δ E = Δ L 2 + Δ a 2 + Δ b 2
Figure 9 shows examples of changes in the values of the total color difference of chromatographic spots of amylose with iodine in the direction from the lower limit to the upper limit. In the calculations of ΔE, the change in L, a and b was determined for two adjacent single-pixel rows: ΔL = Ln+1Ln; Δa = an+1an; Δb = bn+1bn, where n is row number one pixel high on the chromatographic spot.
Since the value of the complete color difference is proportional to the intensity of the color, and hence the content of the colored compound, the maxima on the curves of Figure 9 characterize the distribution of amylose macromolecules in the chromatographic spot along the movement of the mobile phase front. Obviously, macromolecules with a larger molar mass should move more slowly than macromolecules of smaller sizes. For example, for amylose extracted from native starch, the ΔE(n) graph shows the presence in the solution of at least four pronounced fractions, which were concentrated near the lower border of the spot (n < 3), in its middle part (n = 15–16) and its upper limit (n = 20–25).
These data correlate well with the data of Li et al. [53], who studied the distribution of amylose chain lengths of native starch using high-performance anion exchange chromatography. The presented chromatogram clearly shows four peaks, which the authors described as amylose fractions with a degree of polymerization of 6, 12, 24, and 36. The four peaks on the chromatogram were also registered by Zhang et al. [54] during the study of solutions of native starch pastes by the method of size-exclusion chromatography.
From the comparison of the profiles of the complete color difference of the chromatographic spots in the direction of the movement of the eluent front for amylose from native and heat-treated starches, it follows that the molecular mass distribution changes qualitatively: after heat treatment for 2.5 h, fractions with the largest (n < 3) and average (n = 15–16) molar mass disappear. Obviously, these macromolecules are destroyed, which leads to the appearance of new amylose fractions: at n = 3, 12 and in the interval 19–24. An increase in the duration of heat treatment of starch is characterized by the thickening of amylose macromolecules (which is well explained by the repolymerization process)—on the curve ΔE(n), the peaks are located at lower values of “n” compared to the curve for 2.5 h of heat treatment: n < 5, 10 and 19.
For oxidized starch, the profile of the total color difference of the chromatographic spots is also very different from the ΔE(n) profile for native starch. This difference confirms the conclusion made above about acid hydrolysis of starch when it is treated with a mixture of KMnO4 and HCl. Hydrogen ions easily penetrate into starch granules and contribute to the process of destruction of amylose macromolecules into smaller fragments, increasing the degree of its polydispersity (the largest peaks of ΔE(n) are located at n = 17, 21, 24 and 26).
It is obvious that amyloses with different molecular mass distribution of their macromolecules should be leached differently, which is reflected in the kinetic parameters of these processes and well explains the above established regularities. The values of activation energies for the kinetic mode of hydrothermal leaching of amylose vary in the following order: native starch > oxidized starch > heat-treated starch for 5 h > heat-treated starch for 2.5 h. In the same sequence, the content of high-molecular fractions of amylose decreases, as evidenced by the results of the study of the profiles of the complete color difference of the chromatographic spots of amylose with iodine in the direction of the movement of the eluent front.

3.4. TG and DSC Studies of Starch Heat Treatment Process

The methods of thermogravimetric analysis and differential scanning calorimetry were used to investigate mass changes and the probability of thermal effects during the heat treatment of potato starch (see Figure 10).
On the TG curve in the studied temperature range, two areas of a decrease in the weight of the starch sample are observed. The first section of the decrease in the mass of the sample by about 2% when heated to 115 °C is well explained by starch dehydration. With further heating, the mass of the sample does not change up to a temperature of 200 °C. At higher temperatures, we observe thermal decomposition of starch with the formation of gaseous products [55].
On the DSC curve under the studied conditions of starch heating, no obvious exo or endo effects are observed. At the same time, it should be noted that the DSC curve changes its slope angle (i.e., the rate of change in heat flow changes) during the heating of the sample above 100 °C, which indicates a change in the composition and, as a result, in the heat capacity of the material under study.
The process of heat treatment of starches, as a rule, is described by two stages—molecular dehydration (removal of water located in starch granules in a bound state with polysaccharides mainly due to hydrogen bonds) and intermolecular dehydration (splitting of water as a result of interaction between OH groups’ polysaccharides). The second process requires the implementation of molecular rearrangement of polysaccharides, since splitting of a water molecule is possible during the formation of an ether bond:
R1–OH + R2–OH → R1–O–R2 + H2O↑
where R1 and R2 are adjacent polysaccharides in starch granules.
It is obvious that both processes of molecular and intermolecular dehydration should be manifested both on the TG curves and on the DSC curves, in the form of areas of mass reduction and endo effects of heat absorption. In our opinion, the absence of the effects of starch mass reduction and heat absorption by reaction (4) can be explained by the fact that all OH groups of macromolecules do not enter into the reaction simultaneously but only those that are sterically available for such interaction at the given moment of heat treatment. The formation of ether bonds and the thermal motion of macromolecules leads to a change in their configuration and the appearance of new additional “reactive” OH groups, which acquire the ability to interact. Thus, it should be concluded that the condensation reaction of OH groups proceeds in a relatively wide temperature range, and, therefore, its endo effect turns out to be “smeared” and does not appear on the DSC curve in the form of a clearly pronounced extremum. It is of interest to study the presence of water in the starch formed by reaction (4) during its heat treatment by infrared spectroscopy.

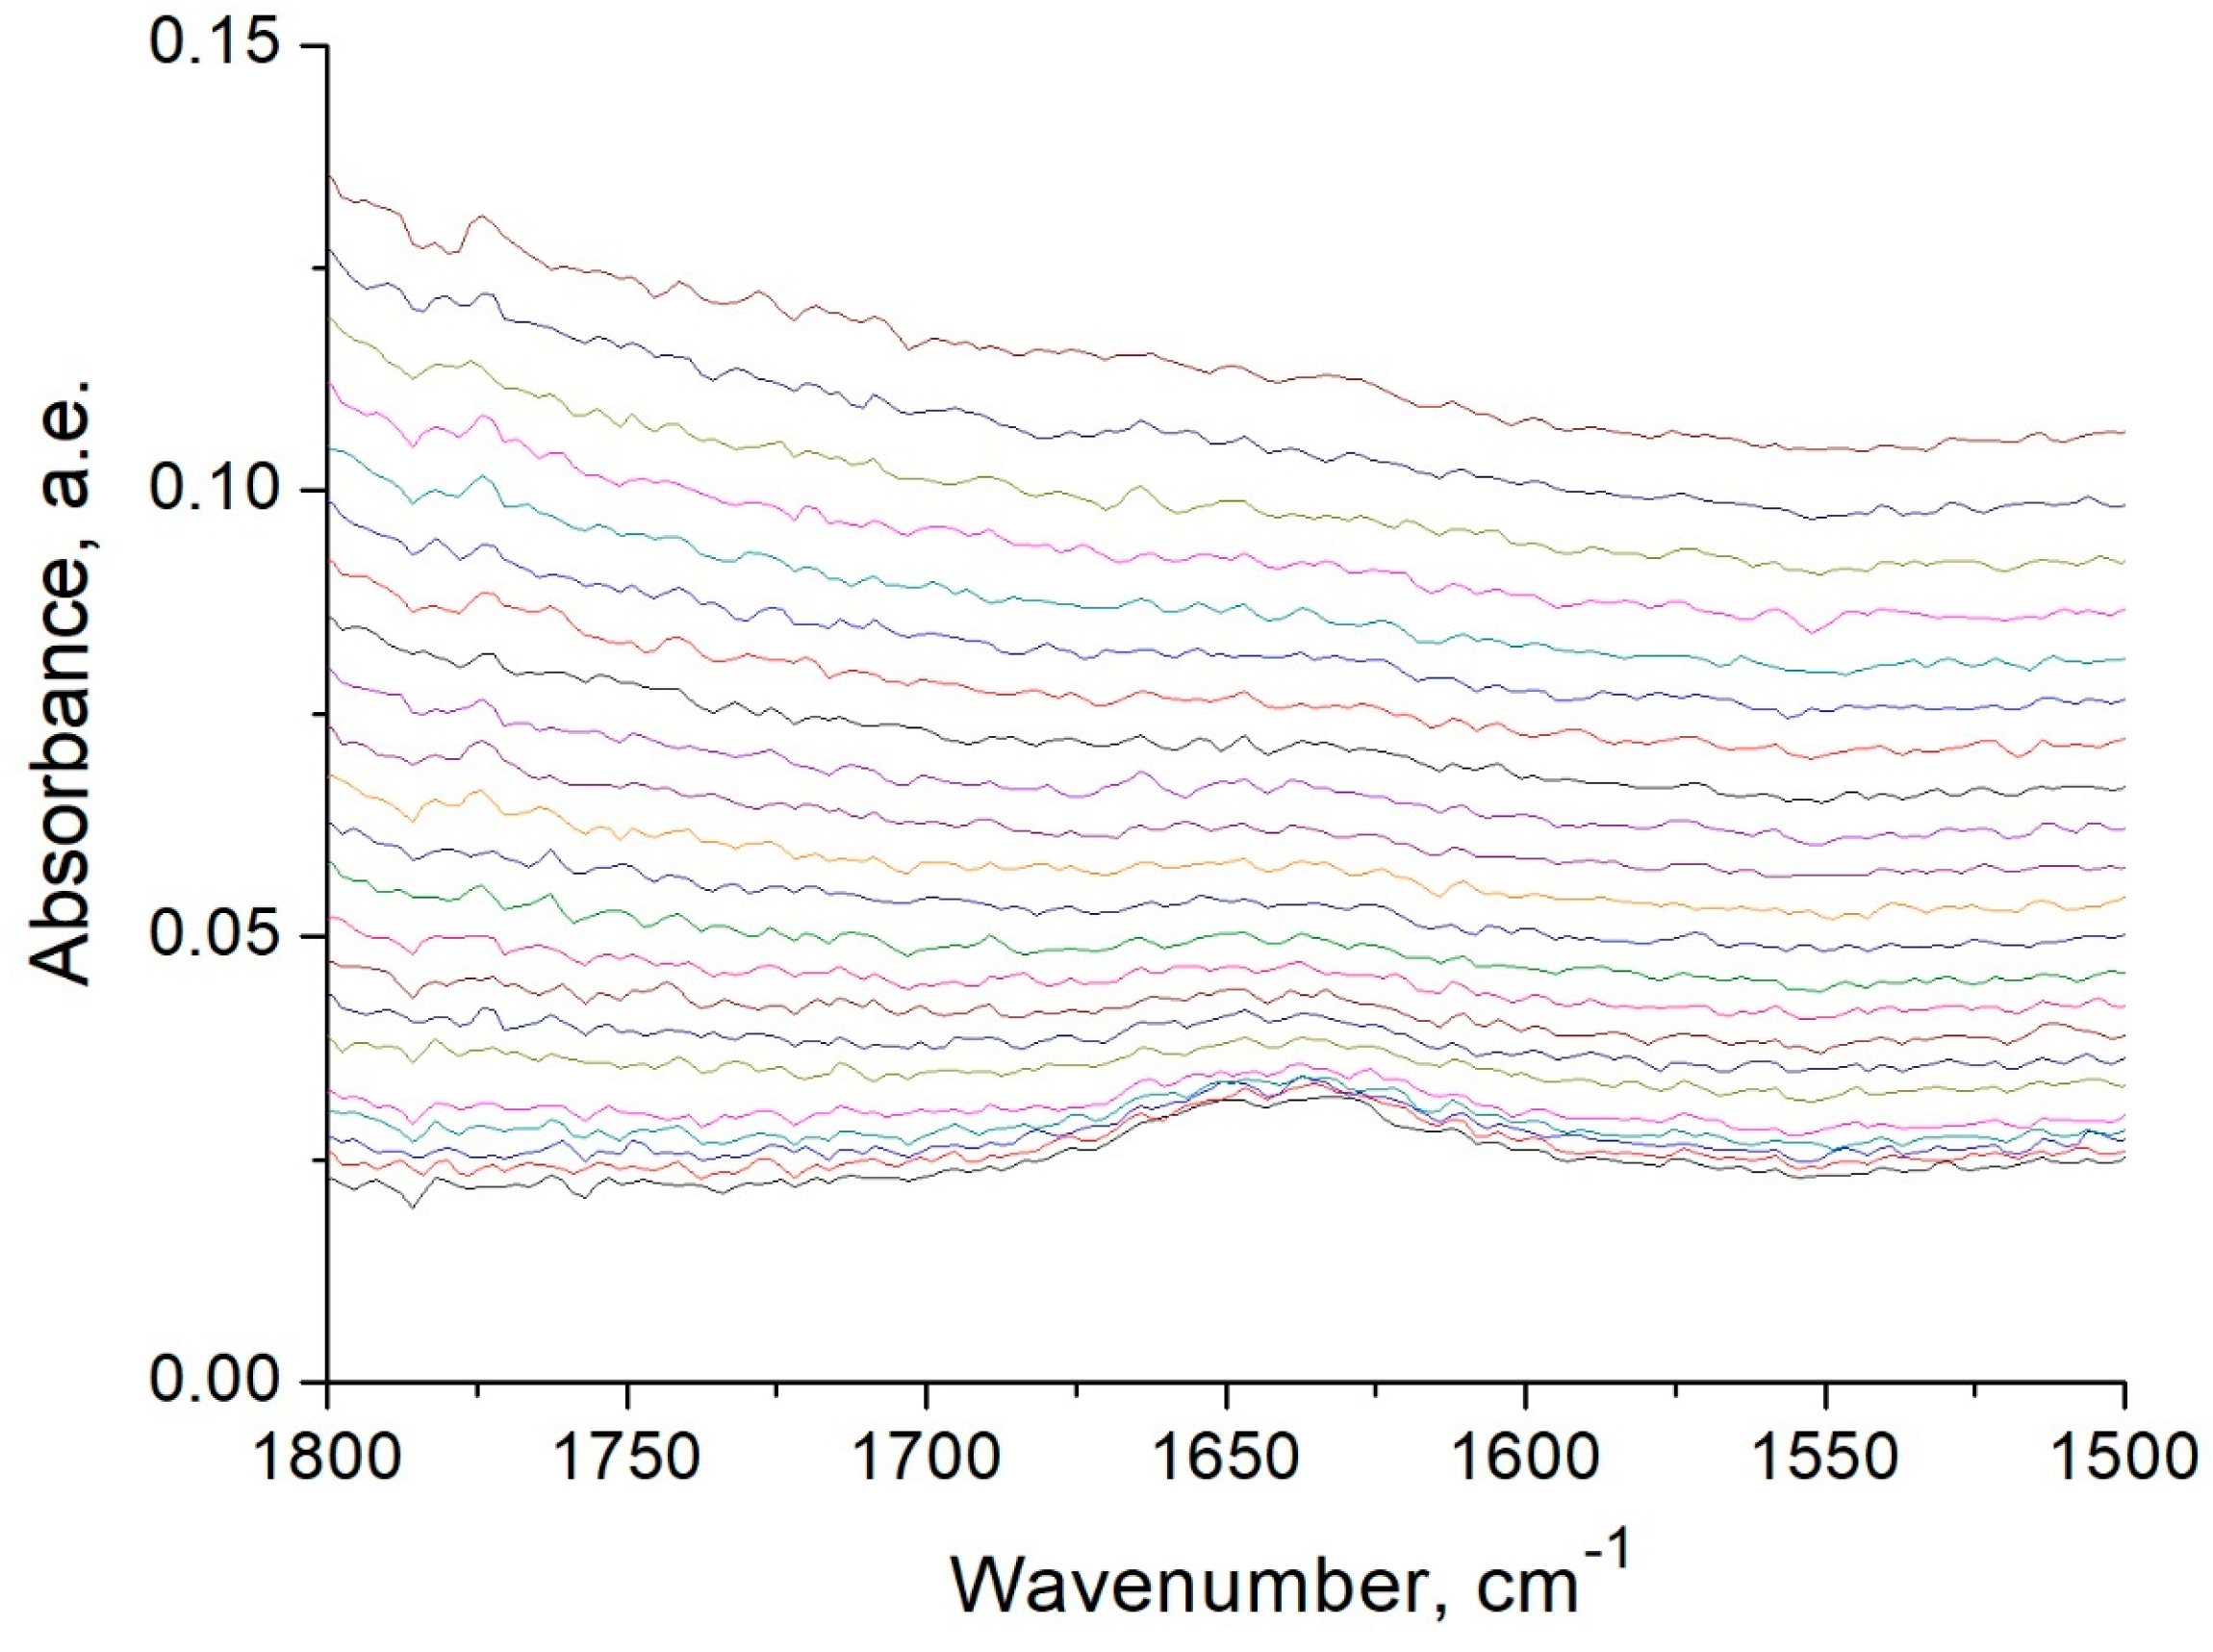
3.5. FTIR Spectroscopy Studies of Starch Heat Treatment Process

Figure 11 shows the FTIR spectra of potato starch recorded during the heating of the sample from 50 to 250 °C.
Figure 12 and Figure 13 show fragments of the FTIR spectra of starch for greater data detail. As can be seen from Figure 12, the peak for water at 1645 cm−1 (which characterizes vibration of its hydrogen atoms with a change in the angle HOH) does not change its position along the frequency axis with increasing temperature, and its intensity continuously decreases, which indicates evaporation of water from the sample.
Figure 13 shows the wide band in the FTIR spectra of starches at 4000–3000 cm–1, which characterizes vibrations of both water molecules and hydroxyl groups of amylose and amylopectin polymers. The maxima of the bands in the range 3800–3000 cm−1 with increasing temperature are monotonically shifted towards increasing wave numbers even after the complete removal of water. Therefore, we can conclude that such a shift of the peaks is due to a change in the vibrational frequency of the atoms of the OH groups of amylose and amylopectin as a result of a change in their polarization environment as the starch is heated.
When analyzing the FTIR spectra, the regularity that the position of the absorption band maxima at 2929 cm−1 remains unchanged (Figure 13) attracts attention. According to the reference data, the band at 2929 cm−1 characterizes the vibrations of the C-H bond atoms, which form the basis of the carbon skeleton of amylose and amylopectin. The invariance of the position of this absorption band with increasing temperature makes it possible to use it to estimate the effect of temperature on the intensity of the spectral bands.
Figure 14 (curve 2) shows the change in the intensity of the absorption band at 2929 cm−1 during the heat treatment of starch. The same figure shows the change in the intensity of the absorption bands at 3800–3000 cm−1 with increasing temperature and shows the differential curve obtained as the difference between curves 1 and 2. The differential curve shows that with increasing temperature, the intensity of the absorption band at 3800–3000 cm−1 first monotonically decreases, and after reaching a temperature of 140 °C, they practically do not change.
A similar result is also observed for the absorption band with a peak at 1645 cm−1, which characterizes the water content. Comparison of the intensities of this absorption band using the “baseline correction” procedure shows that the intensity of the peak rapidly decreases with increasing temperature. The observed simultaneous decrease in the intensities of the absorption bands at 3800–3000 cm−1 and 1645 cm−1 allows us to conclude that with increasing temperature, not only the water content decreases but also the amount of starch OH groups.
It should be noted that the presence of water in starches up to temperatures of 140–150 °C can also be explained by slow diffusion of residual water in the starch volume, since FIIR spectra were recorded under conditions of relatively fast heating (~4 °C/min). In support of this hypothesis, we note that the removal of water from starches is not recorded on the TG curve after a temperature of 110 °C (Figure 10). This can be explained from the point of view of their low heating rate (1 °C/min): most of the water molecules have time to diffuse to the surface of starch granules and evaporate already at 100 °C. However, this hypothesis does not explain the absence of an endo effect of the condensation reaction of OH groups on the DSC curve.
As is known, the reactions of dehydration of low-molecular-weight primary alcohols with the formation of ethers are carried out in concentrated sulfuric acid at 130–140 °C. As a rule, this is explained by the fact that hydrogen ions catalyze the formation of an ether bond. However, sulfuric acid is not only a source of hydrogen ions, but also a strong acceptor of water molecules with the formation of strong H2SO4*nH2O hydrates. Obviously, the equilibrium of the ester formation reaction according to the Le Chatelier–Brown principle in this case naturally shifts to the right, and concentrated sulfuric acid is not so much a catalyst as a regent, which reduces the concentration of the reaction product in the reaction mixture.
In our case, the ester bond formation reaction proceeds in the starch solid phase between the hydrogen-bonded hydroxyl groups of amylose or amylopectin. It is obvious that the rate of formation of such ester bonds in the bulk of starch can be much higher than in the liquid phase, since the hydrogen-bonded OH groups of polymers are already oriented relative to each other in a certain way. This increases the likelihood of their association with the elimination of a water molecule. Since water is continuously removed from the reaction zone due to evaporation at high temperature, the equilibrium of reaction (4) will naturally shift to the right.
The condensation reaction of OH groups also makes it possible to explain the effect of shifting the absorption band in the range of 3800–3000 cm−1 towards increasing wave numbers with increasing temperature. Since with increasing temperature, all those OH groups that were involved in hydrogen bonds (located close to each other) react according to reaction (4), their contribution to the absorption band gradually decreases. Therefore, at high temperatures, only vibrations of those OH groups that are not bound by intermolecular hydrogen bonds are observed in the spectrum. As is known, the absorption bands of such OH groups are in the higher wavelength part of the spectrum due to a decrease in the polarization effect of neighboring polymer atoms.

4. Conclusions

The studies carried out have shown that for native starch, the leaching activation energy is 192.3 kJ/mol for the temperature range of 60–70 °C and 22 kJ/mol at the temperature of 80–90 °C. Since such a high value of Ea of the process occurring in the kinetic mode is characteristic of chemical reactions, the explanation of the effect of the dependence of the activation energy of the amylose leaching process on temperature requires the involvement of ideas about the chemical reaction that takes place during the extraction of amylose from the granules into the volume of the solution. In our opinion, the destruction of multiple hydrogen bonds between amylose macromolecules should be considered as such a reaction. Therefore, amylose leaching can be considered as a heterogeneous pseudochemical process that can proceed both in kinetic and diffusion modes.
It was shown that the changes in the activation energy of the leaching of amylose from modified starches should be explained by a change in size macromolecules (the degree of its polymerization). Evidence of such changes is provided by thin-layer chromatography data, which show changes in molecular weight distributions in modified starch samples.
The data of FTIR spectroscopy and thermal methods of analysis show that the reaction of intermolecular dehydration with the formation of ether bridges C-O-C proceeds in a relatively wide temperature range (up to 140 °C), and therefore its endo effect is “smeared” and does not appear on the DSC curve in the form of a clearly defined extremum.

Author Contributions

Conceptualization, M.V.N.; methodology, M.V.N.; software, V.D.M.-T., M.V.N. and Y.S.; validation, M.V.N.; formal analysis, M.V.N.; investigation, V.D.M.-T., M.V.N. and Y.S.; resources, A.K., B.L. and D.P.J.; data curation, M.V.N.; writing—original draft preparation, V.D.M.-T. and M.V.N.; writing—review and editing, M.V.N. and V.D.M.-T.; visualization, M.V.N.; supervision, B.L. and A.K.; project administration, A.K.; funding acquisition, A.K. and B.L. All authors have read and agreed to the published version of the manuscript.

Funding

The work was supported by R & D project 0121U112071 of the Ukrainian State University of Chemical Technology.

Data Availability Statement

Data sharing is not applicable to this article.

Conflicts of Interest

The authors declare no conflict of interest.

References

  1. Apriyanto, A.; Compart, J.; Fettke, J. A review of starch, a unique biopolymer—Structure, metabolism and in planta modifications. Plant Sci. J. 2022, 318, 111223. [Google Scholar] [CrossRef]
  2. Kaur, P.; Kaur, K.; Basha, S.J.; Kennedy, J.F. Current trends in the preparation, characterization and applications of oat starch—A review. Int. J. Biol. Macromol. 2022, 212, 172–181. [Google Scholar] [CrossRef]
  3. Fan, Y.; Picchioni, F. Modification of starch: A review on the application of “green” solvents and controlled functionalization. Carbohydr. Polym. 2020, 241, 116350. [Google Scholar] [CrossRef] [PubMed]
  4. Nizam, N.H.M.; Rawi, N.F.M.; Ramle, S.F.M.; Aziz, A.A.; Abdullah, C.K.; Rashedi, A.; Kassim, M.H.M. Physical, thermal, mechanical, antimicrobial and physicochemical properties of starch based film containing aloe vera: A review. J. Mater. Res. Technol. 2021, 15, 1572–1589. [Google Scholar] [CrossRef]
  5. Adewale, P.; Yancheshmeh, M.S.; Lam, E. Starch modification for non-food, industrial applications: Market intelligence and critical review. Carbohydr. Polym. 2022, 291, 119590. [Google Scholar] [CrossRef] [PubMed]
  6. Chung, H.-J.; Lim, H.S.; Lim, S.-T. Effect of partial gelatinization and retrogradation on the enzymatic digestion of waxy rice starch. J. Cereal Sci. 2006, 43, 353–359. [Google Scholar] [CrossRef]
  7. Donmez, D.; Pinho, L.; Patel, B.; Desam, P.; Campanella, O.H. Characterization of starch–water interactions and their effects on two key functional properties: Starch gelatinization and retrogradation. Curr. Opin. Food Sci. 2021, 39, 103–109. [Google Scholar] [CrossRef]
  8. Majzoobi, M.; Farahnaky, A. Granular cold-water swelling starch; properties, preparation and applications, a review. Food Hydrocoll. 2021, 111, 106393. [Google Scholar] [CrossRef]
  9. Chavan, P.; Sinhmar, A.; Nehra, M.; Thory, R.; Pathera, A.K.; Sundarraj, A.A.; Nain, V. Impact on various properties of native starch after synthesis of starch nanoparticles: A review. Food Chem. 2021, 364, 130416. [Google Scholar] [CrossRef]
  10. Amagliani, L.; O’Regan, J.; Kelly, A.L.; O’Mahony, J.A. Chemistry, structure, functionality and applications of rice starch. J. Cereal Sci. 2016, 70, 291–300. [Google Scholar] [CrossRef]
  11. Li, C. Recent progress in understanding starch gelatinization—An important property determining food quality. Carbohydr. Polym. 2022, 293, 119735. [Google Scholar] [CrossRef] [PubMed]
  12. Renzetti, S.; van den Hoek, I.A.F.; van der Sman, R.G.M. Mechanisms controlling wheat starch gelatinization and pasting behaviour in presence of sugars and sugar replacers: Role of hydrogen bonding and plasticizer molar volume. Food Hydrocoll. 2021, 119, 106880. [Google Scholar] [CrossRef]
  13. Miles, M.J.; Morris, V.J.; Orford, P.D.; Ring, S.G. The roles of amylose and amylopectin in the gelation and retrogradation of starch. Carbohydr. Res. 1985, 135, 271–281. [Google Scholar] [CrossRef]
  14. Putseys, J.A.; Gommes, C.J.; Van Puyvelde, P.; Delcour, J.A.; Goderis, B. In situ SAXS under shear unveils the gelation of aqueous starch suspensions and the impact of added amylose-lipid complexes. Carbohydr. Polym. 2011, 84, 1141–1150. [Google Scholar] [CrossRef]
  15. Vermeylen, R.; Derycke, V.; Delcour, J.A.; Goderis, B.; Reynaers, H.; Koch, M.H.J. Gelatinization of starch in excess water:  beyond the melting of lamellar crystallites. A combined wide- and small-angle X-ray scattering study. Biomacromolecules 2006, 7, 2624–2630. [Google Scholar] [CrossRef]
  16. Turhan, M.; Gunasekaran, S. Kinetics of in situ and in vitro gelatinization of hard and soft wheat starches during cooking in water. J. Food Eng. 2002, 52, 1–7. [Google Scholar] [CrossRef]
  17. Doblado-Maldonado, A.; Gomand, S.; Goderis, B.; Delcour, J. The extent of maize starch crystal melting as a critical factor in the isolation of amylose via aqueous leaching. Food Hydrocoll. 2016, 61, 36–47. [Google Scholar] [CrossRef]
  18. Doblado-Maldonado, A.; Janssen, F.; Gomand, S.; Ketelaere, B.; Goderis, B.; Delcour, J. A response surface analysis of the aqueous leaching of amylose from maize starch. Food Hydrocoll. 2017, 63, 265–272. [Google Scholar] [CrossRef]
  19. Palav, T.; Seetharaman, K. Mechanism of starch gelatinization and polymer leaching during microwave heating. Carbohydr. Polym. 2006, 65, 364–370. [Google Scholar] [CrossRef]
  20. Cabrera, E.; Pineda, J.C.; Duran De Bazua, C.; Segurajauregeui, J.S.; Vernon, E.J. Kinetics of water diffusion and starch gelatinization during corn nixtamalization. In Engineering and Food; McKenna, B.M., Ed.; Engineering sciences in the food industry; Elsevier: London, UK, 1984; Volume 1, pp. 117–125. [Google Scholar]
  21. Zhu, Y.; Cui, B.; Yuan, C.; Lu, L.; Li, J. A new separation approach of amylose fraction from gelatinized high amylose corn starch. Food Hydrocoll. 2022, 131, 107759. [Google Scholar] [CrossRef]
  22. Naguleswaran, S.; Vasanthan, T.; Hoover, R.; Bressler, D. Amylolysis of amylopectin and amylose isolated from wheat, triticale, corn and barley starches. Food Hydrocoll. 2014, 35, 686–693. [Google Scholar] [CrossRef]
  23. Li, H.; Dhital, S.; Flanagan, B.; Mata, J.; Gilbert, E.; Gidley, M. High amylose wheat and maize starches have distinctly different granule organization and annealing behaviour: A key role for chain mobility. Food Hydrocoll. 2020, 105, 105820. [Google Scholar] [CrossRef]
  24. Li, Y.; Liu, P.; Ma, C.; Zhang, N.; Shang, X.; Wang, L.; Xie, F. Structural disorganization and chain aggregation of high-amylose starch in different chloride salt solutions. ACS Sustain. Chem. Eng. 2020, 8, 483–4847. [Google Scholar] [CrossRef]
  25. Shi, H.; Yin, Y.; Hu, X.; Jiao, S. Determination of molecular weight and structure characterization of canna amylose purified using the method of n-butanol recrystallization. Adv. Mat. Res. 2012, 554–556, 1216–1222. [Google Scholar] [CrossRef]
  26. Li, Y.; Wu, Z.; Wan, N.; Wang, X.; Yang, M. Extraction of high-amylose starch from Radix Puerariae using high-intensity low-frequency ultrasound. Ultrason. Sonochem. 2019, 59, 104710. [Google Scholar] [CrossRef]
  27. Setyawati, Y.; Ahsan, S.; Ong, L.; Soetaredjo, F.; Ismadji, S.; Ju, Y. Production of glutinous rice flour from broken rice via ultrasonic assisted extraction of amylose. Food Chem. 2016, 203, 158–164. [Google Scholar] [CrossRef]
  28. Yang, F.; Du, Q.; Miao, T.; Zhang, X.; Xu, W.; Jia, D. Interaction between potato starch and Tremella fuciformis polysaccharide. Food Hydrocoll. 2022, 127, 107509. [Google Scholar] [CrossRef]
  29. Yuris, A.; Goh, K.; Hardacre, A.; Matia-Merino, L. Understanding the interaction between wheat starch and Mesona chinensis polysaccharide. LWT 2017, 84, 212–221. [Google Scholar] [CrossRef]
  30. Sun, L.; Xu, Z.; Song, L.; Ma, M.; Zhang, C.; Chen, X.; Xu, X.; Sui, Z.; Corke, H. Removal of starch granule associated proteins alters the physicochemical properties of annealed rice starches. Int. J. Biol. Macromol. 2021, 185, 412–418. [Google Scholar] [CrossRef]
  31. Chen, R.; Williams, P.; Shu, J.; Luo, S.; Chen, J.; Liu, C. Pectin adsorption onto and penetration into starch granules and the effect on the gelatinization process and rheological properties. Food Hydrocoll. 2022, 129, 107618. [Google Scholar] [CrossRef]
  32. Hou, C.; Zhao, X.; Tian, M.; Zhou, Y.; Yang, R.; Gu, Z.; Wang, P. Impact of water extractable arabinoxylan with different molecular weight on the gelatinization and retrogradation behavior of wheat starch. Food Chem. 2020, 318, 126477. [Google Scholar] [CrossRef] [PubMed]
  33. Fonseca-Florido, H.; Gomez-Aldapa, C.; Velazquez, G.; Hernandez-Hernandez, E.; Mata-Padilla, J.; Solís-Rosales, S.; Mendez-Montealvo, G. Gelling of amaranth and achira starch blends in excess and limited water. LWT 2017, 81, 265–273. [Google Scholar] [CrossRef]
  34. Spigno, G.; De Faveri, D. Gelatinization kinetics of rice starch studied by non-isothermal calorimetric technique: Influence of extraction method, water concentration and heating rate. J. Food Eng. 2004, 62, 337–344. [Google Scholar] [CrossRef]
  35. Suzuki, K.; Kubota, K.; Omich, M.; Hosaka, H. Kinetic studies on cooking of rice. J. Food Sci. 1976, 41, 1180–1185. [Google Scholar] [CrossRef]
  36. Bakshi, A.S.; Singh, R.P. Kinetics of water diffusion and starch gelatinization during rice parboiling. J. Food Sci. 1980, 45, 1387–1392. [Google Scholar] [CrossRef]
  37. Birch, G.; Priestley, R. Degree of gelatinization of cooked rice. Starch 1973, 25, 98–100. [Google Scholar] [CrossRef]
  38. Kubota, K. Studies on the soaking and cooking rate equations of soybean. J. Fac. Appl. Biol. Sci. Hiroshima Univ. 1979, 18, 1–9. [Google Scholar] [CrossRef]
  39. Okechukwu, P.; Rao, M. Kinetics of cowpea starch gelatinization based on granule swelling. Starch 1996, 48, 43–47. [Google Scholar] [CrossRef]
  40. Shiotsubo, T. Starch gelatinization at different temperatures as measured by enzymatic digestion method. Agric. Biol. Chem. 1983, 47, 2421–2425. [Google Scholar] [CrossRef]
  41. Kubota, K.; Hosokawa, Y.; Suzuki, K.; Hosaka, H. Studies on the gelatinization rate of rice and potato starches. J. Food Sci. 1979, 44, 1394–1397. [Google Scholar] [CrossRef]
  42. Zhou, Z.; Robards, K.; Helliwell, S.; Blanchard, C. Effect of storage temperature on rice thermal properties. Int. Food Res. J. 2010, 43, 709–715. [Google Scholar] [CrossRef]
  43. Resio, A.C.; Suarez, C. Gelatinization kinetics of amaranth starch. Int. J. Food Sci. Technol. 2001, 36, 441–448. [Google Scholar] [CrossRef]
  44. Ojeda, C.; Tolaba, M.; Suarez, C. Modeling starch gelatinization kinetics of milled rice flour. Cereal Chem. 2000, 77, 145–147. [Google Scholar] [CrossRef]
  45. Yeh, A.; Li, J. Kinetics of phase transition of native, cross-linked and hydroxipropilated rice starches. Starch 1996, 48, 17–21. [Google Scholar] [CrossRef]
  46. Ahmed, J. Rheometric non-isothermal gelatinization kinetics of mung bean starch slurry: Effect of salt and sugar—Part 1. J. Food Eng. 2012, 109, 321–328. [Google Scholar] [CrossRef]
  47. Li, C.; Hu, Y. A kinetics-based decomposition approach to reveal the nature of starch asymmetric gelatinization thermograms at non-isothermal conditions. Food Chem. 2021, 344, 128697. [Google Scholar] [CrossRef]
  48. Lund, D.B.; Wirakartakusumah, M. A Model for Starch Gelatinization Phenomena. In Engineering and Food; McKenna, B.M., Ed.; Elsevier: London, UK, 1984; Volume 1, pp. 425–432. [Google Scholar]
  49. Popov, D.; Buléon, A.; Burghammer, M.; Chanzy, H.; Montesanti, N.; Putaux, J.-L.; Potocki-Véronèse, G.; Riekel, C. Crystal structure of A-amylose: A revisit from synchrotron microdiffraction analysis of single crystals. Macromolecules 2009, 42, 1167–1174. [Google Scholar] [CrossRef]
  50. Sattelle, B.; Almond, A. Microsecond kinetics in model single- and double-stranded amylose polymers. Phys. Chem. Chem. Phys. 2014, 16, 8119–8126. [Google Scholar] [CrossRef]
  51. Xu, J.; Li, Z.; Zhong, Y.; Zhou, Q.; Lv, Q.; Chen, L.; Blennow, A.; Liu, X. The effects of molecular fine structure on rice starch granule gelatinization dynamics as investigated by in situ small-angle X-ray scattering. Food Hydrocoll. 2021, 121, 107014. [Google Scholar] [CrossRef]
  52. Dickinson, C.F.; Heal, G.R. Solid-liquid diffusion controlled rate equations. Thermochim. Acta 1999, 340–341, 89–103. [Google Scholar] [CrossRef]
  53. Li, H.; Li, J.; Guo, L. Rheological and pasting characteristics of wheat starch modified with sequential triple enzymes. Carbohydr. Polym. 2020, 230, 115667. [Google Scholar] [CrossRef] [PubMed]
  54. Zhang, Z.; Li, E.; Fan, X.; Yang, C.; Ma, H.; Gilbert, R.G. The effects of the chain-length distributions of starch molecules on rheological and thermal properties of wheat flour paste. Food Hydrocoll. 2020, 101, 105563. [Google Scholar] [CrossRef]
  55. Pigłowska, M.; Kurc, B.; Rymaniak, Ł.; Lijewski, P.; Fuć, P. Kinetics and thermodynamics of thermal degradation of different starches and estimation the OH group and H2O content on the surface by TG/DTG-DTA. Polymers 2020, 12, 357. [Google Scholar] [CrossRef] [PubMed]
Figure 1. Photomicrographs of samples of native starch (photo on the left, scale 1: 850) and heat-treated starch (photo on the right, scale 1: 610).
Processes 11 01464 g001
Figure 2. Histograms (light gray bars for native starch and dark gray bars for heat-treated starch) and curves of granule size distribution for native (1) and heat-treated starches (2).
Processes 11 01464 g002
Figure 3. Kinetic data on hydrothermal leaching of amylose from native starch at a temperature 62 (1), 66 (2), 69 (3), 80 (4) and 90 °C (5). (The curves here and in Figure 4, Figure 5 and Figure 6 are drawn according to the Kroger–Ziegler equation).
Processes 11 01464 g003
Figure 4. Kinetic data on hydrothermal leaching of amylose from thermally treated starch for 2.5 h at a temperature 62 (1), 66 (2), 69 (3), 80 (4) and 90 °C (5).
Processes 11 01464 g004
Figure 5. Kinetic data on hydrothermal leaching of amylose from thermally treated starch for 5 h at a temperature 62 (1), 66 (2), 69 (3), 80 (4) and 90 °C (5).
Processes 11 01464 g005
Figure 6. Kinetic data on hydrothermal leaching of amylose from oxidized starch at a temperature 62 (1), 66 (2), 69 (3), 80 (4) and 90 °C (5).
Processes 11 01464 g006
Figure 7. Comparison of the rate constants of the amylose leaching process at different temperatures in the coordinates of the Arrhenius equation from native (1), oxidized (2) and heat-treated starches at 135 °C for 2.5 (3) and 5 (4) hours.
Processes 11 01464 g007
Figure 8. The influence of the time of heat treatment of starch (at 135 °C) on the value of the rate constants of the amylose leaching process at a temperature 62 (1) and 90 °C (2).
Processes 11 01464 g008
Figure 9. Change in values of total color difference (ΔE) of chromatographic spots of amylose with iodine in the direction from the lower border of the spot to its upper border: 1—amylose from native starch; 2—amylose from heat-treated starch for 2.5 h; 3—amylose from thermally treated starch for 5 h; 4—amylose from oxidized starch. (The zero lines for the upper curves are shifted along the ΔE axis upwards).
Processes 11 01464 g009
Figure 10. TG (1) and DSC (2) curves for potato starch at a heating rate of 1 °C/min.
Processes 11 01464 g010
Figure 11. FTIR spectra of starch heated from 50 °C (bottom line) up to 250 °C (upper line).
Processes 11 01464 g011
Figure 12. Fragment of FTIR spectra of starch heated from 50 °C (bottom line) up to 250 °C (upper line).
Processes 11 01464 g012
Figure 13. Fragment of FTIR spectra of starch heated from 50 °C (bottom line) up to 250 °C (upper line) in 63 min.
Processes 11 01464 g013
Figure 14. Comparison of the intensities of the maxima of the absorption bands at 3800–3000 cm−1, (1) and 2929 cm−1 (2) for potato starch during its heating; (3)–differential curve. (The arrow shows the transition of curve (3) from a monotonic decrease to a constant value).
Processes 11 01464 g014
Disclaimer/Publisher’s Note: The statements, opinions and data contained in all publications are solely those of the individual author(s) and contributor(s) and not of MDPI and/or the editor(s). MDPI and/or the editor(s) disclaim responsibility for any injury to people or property resulting from any ideas, methods, instructions or products referred to in the content.

