Article

Numerical Simulation of CO2 Extraction from the Cement Pre-Calciner Kiln System

College of Materials Science and Engineering, Nanjing Tech University, Nanjing 211816, China
*
Author to whom correspondence should be addressed.
Processes 2023, 11(5), 1449; https://doi.org/10.3390/pr11051449
Submission received: 8 April 2023 / Revised: 30 April 2023 / Accepted: 7 May 2023 / Published: 11 May 2023

Abstract

:
The cement industry is one of the primary sources producing anthropogenic CO2 emissions. The significant increase in the demand for cement in years has significantly contributed to the increase in carbon emissions. Among numerous CO2 treatment technologies, calcium looping (CaL) is a practical approach to mitigating CO2 emissions. This paper used calcium looping (CaL) to capture CO2 from flue gas in a cement pre-calciner kiln system. The raw material exiting the lowest stage of the preheater is used as a calcium-based adsorbent, and the carbonation reactor is built between the tertiary and secondary preheaters, using the high-temperature flue gas exiting the tertiary preheater to provide heat for the reaction. The CFD (Computational Fluid Dynamics) simulation technology was used to evaluate the rationality of the carbonation reactor and the key factors affecting the carbon removal efficiency of the carbonation reactor. The results indicate that the velocity and pressure fields of the carbonation reactor conform to the general operating rules and are reasonable. The optimal operating speed of particles in the carbonation reactor is 15 m/s, with a separation efficiency of particles of 92.5%, ensuring the smooth discharge of reaction products. The factor analysis of the carbonation reactor shows that when the temperature is 911 K, the mass flow rate of CaO is 2.07 kg/s, and the volume fraction of CO2 is 0.28, the carbonation reaction reaches a chemical equilibrium state, and the carbon removal efficiency is 90%. It should be noted that this carbon removal efficiency is the optimal carbon removal efficiency based on a combination of economic factors. In addition, the influencing factors show a precise sequence: CO2 volume fraction > CaO addition amount > temperature. Finally, we investigated the impact of the addition of the carbonation reactor on the preheater system. The results show that adding the carbonation reactor causes an increase in the flue gas velocity at the outlet of the preheater and a decrease in pressure, reducing the separation efficiency. Although the separation efficiency decreases slightly, the impact on the pre-calciner system is minimal.

1. Introduction

The greenhouse effect has been considered a major global climate problem in recent years, which severely negatively impacts the environment and the economy. Carbon (IV) oxide (CO2) contributes to more than 60% of the greenhouse effect [1]. CO2 emissions from the cement industry account for 5–8% of the artificial CO2 emissions [2]. Currently, carbon emission reduction in the cement industry mainly includes optimization and energy-saving means, alternative raw fuels, carbon capture technology, etc. [3,4]. Carbon capture technology is widely utilized as an effective means of carbon reduction compared to the more significant economic investment in process optimization and the unstable quality of alternative fuels [5].
Carbon capture technologies include the adsorption of adsorbents or solvents, membrane separation, low-temperature distillation separation, etc. [6,7,8]. Among them, calcium-based carbon capture technology is widely used for its high adsorption capacity, excellent adsorption effect, and high-temperature resistance [9]. Calcium-based carbon capture technology is a calcium looping (CaL) that uses the interconversion of CaO and CaCO3 to separate carbon dioxide from flue gas. SILABAN et al. [10] first studied the high-temperature separation process of CO2 based on a gas-solid reaction (CaO (s) + CO2 (g)↔CaCO3 (s)) and confirmed the feasibility of absorbing CO2 from high-temperature flue gas by the CaL method. Manovic et al. [11] investigated the steam reactivation of adsorbents, and after reactivation, the adsorbents had better CO2 capture properties than natural adsorbents; the average carbonation of reactivated adsorbents over ten cycles was nearly 70%, which was significantly higher than that of the original adsorbents (35–40%).
Two main ways to integrate calcium-based carbon capture technology with the cement industry are split CaL and integration CaL [12]. Split CaL is a calcium cycle capture system set up at the end of the cement plant (after the preheater) to complete the capture and purification of CO2 in the flue gas. Most reactor sites used to study CO2 adsorption in flue gases by the split CaL process are fluidized-bed reactors [13,14,15]. The fluidized bed reactor consists of the carbonation reactor and the calcination reactor. In the split CaL process, the CaO obtained by the calcination of quicklime into the calcination reactor is used as an adsorbent. The CaO adsorbent loses activity after several reactions [16,17]. Therefore, the CaO in the calcination reactor needs to be replaced in time, and it can be used as raw cement material to participate in the calcination process of cement clinker. Many studies have been conducted to simulate the split CaL process in cement [12,18,19]. The study results show that the split calcium cycle method’s fuel consumption is significantly higher than the reference cement kiln without carbon capture. However, a significant portion of this additional energy input is utilized in the heat recovery steam cycle. Although the energy consumption is balanced, the additional burner will again produce CO2 and cause environmental pollution.
Integration CaL is to use the preheater as a carbonation reactor and the decomposer as a calciner reactor to release high concentrations of CO2 for carbon capture and utilization using the calciner under oxygen-rich conditions [20,21]. The CaO adsorbent used in the integration CaL is derived from the calcination product in the decomposition furnace rather than pure limestone [22]. Moreover, the integrated CaL can eliminate the need for additional fuel and low fuel consumption [23]. However, the technology requires oxygen-enriched combustion for the decomposer, increasing the economic investment. Using calcined products from the decomposer as the adsorbent can cause instability in the adsorption performance. From the results of laboratory tests, the capture capacity of cement raw meal is comparable to that of pure limestone, indicating that raw meal can be used as a sorbent to reduce CO2 emissions during cement production [24]. Lena et al. [25] also confirmed the feasibility of using cement raw meal as an adsorbent in calcium cycling technology.
There are also many studies on new CaL process methods. Atsonios et al. [26] used the ASPEN Plus software to describe the process modeling of the CaL implementation on a typical (bypass-free) five-stage preheater, detailing the CO2 removal scheme process parameters. Spinelli et al. [22] present a one-dimensional model of an entrained flow carbonator for a calcium cycling process in a cement plant and discuss the sensitivity analysis results on the main controlling process parameters. The results show that the carbonation reactor CO2 capture efficiency is about 80% when the gas-to-solid ratio and adsorption capacity of the carbonation reactor is in the right combination in a gooseneck carbonator of lengths 2 to 80 m. Diego et al. [27] analyzed a new calcium cycle process for cement plants based on a dual CaL process for studying reactor setups for CO2 capture and CaCO3 calcination.
However, these calcium cycle processes still have some drawbacks. Among the current CaL processes, the split CaL process requires additional fuel, which will generate CO2 again. The integrated CaL process requires a decomposer for oxygen-enriched conditions, raising the economic investment. On the other hand, the carbonation reactors used in the CaL process studied so far are primarily fluidized beds or other reaction vessels. It is still relatively rare for carbonation reactors to be set up as cyclone separators. Therefore, a new process scheme is proposed in this paper which uses C5 preheater outlet raw material as the active CaO adsorbent, sets the carbonation reactor in the shape of a cyclone separator, and adds it to the preheater system, where the reaction occurs using high-temperature flue gas. The CaCO3 generated by the reaction enters the carbonation reactor placed on the ground. Compared with other CaL process solutions, this solution fully uses flue gas waste heat, saves energy consumption, and avoids CO2 regeneration [12]. The carbonation reactor is located in the pre-calciner kiln system so that the flue gas does not carry the raw material away from the kiln, which affects the cement clinker firing process. Setting the carbonation reactor into a cyclone shape can ensure the smooth discharge of the reaction products after the reaction.
The exploration of the calcium looping process has been extensively studied, but there is limited actual research on optimizing the decarbonization efficiency parameter of the process. Therefore, the focus of this study is to analyze and optimize the decarbonization parameters in the carbonation reactor using CFD simulation software and to analyze the impact of introducing the carbonation reactor on the pre-calciner system. Compared to similar studies [22], the results of this study demonstrate an improvement in the efficiency of the carbonation reactor under gas-solid reaction equilibrium conditions. Economic analysis shows that using flue gas waste heat saves energy consumption. The study’s results on the effect of the carbonation reactor on the pre-calciner system showed that the addition of the carbonation reactor decreased the separation efficiency. However, the decrease was insignificant and had a negligible impact on the pre-calciner system.

2. Process Scheme and Material Properties

2.1. Process Scheme

A cement plant was the research object in this study. The location of the added carbonation reactor in the cement pre-calciner system was determined according to the actual thermal calibration of each outlet temperature, pressure, flue gas concentration, and other parameters shown in Table 1 and Table 2. Carbonation occurs at 600–700 °C, and the produced CaCO3 decomposes into CaO and CO2 at above 850 °C [28]. The flue gas temperature at the C3 outlet in Table 2 is 621 °C, which is in line with that required for the carbonation reaction, and a carbonation reactor can be established at the flue gas outlet of C3 (three-stage preheater). As shown in Table 1, the volume fraction of CO2 in the C3 outlet gas is about 28%, so the initial volume fraction of CO2 in the carbonation reaction is set at 28%.
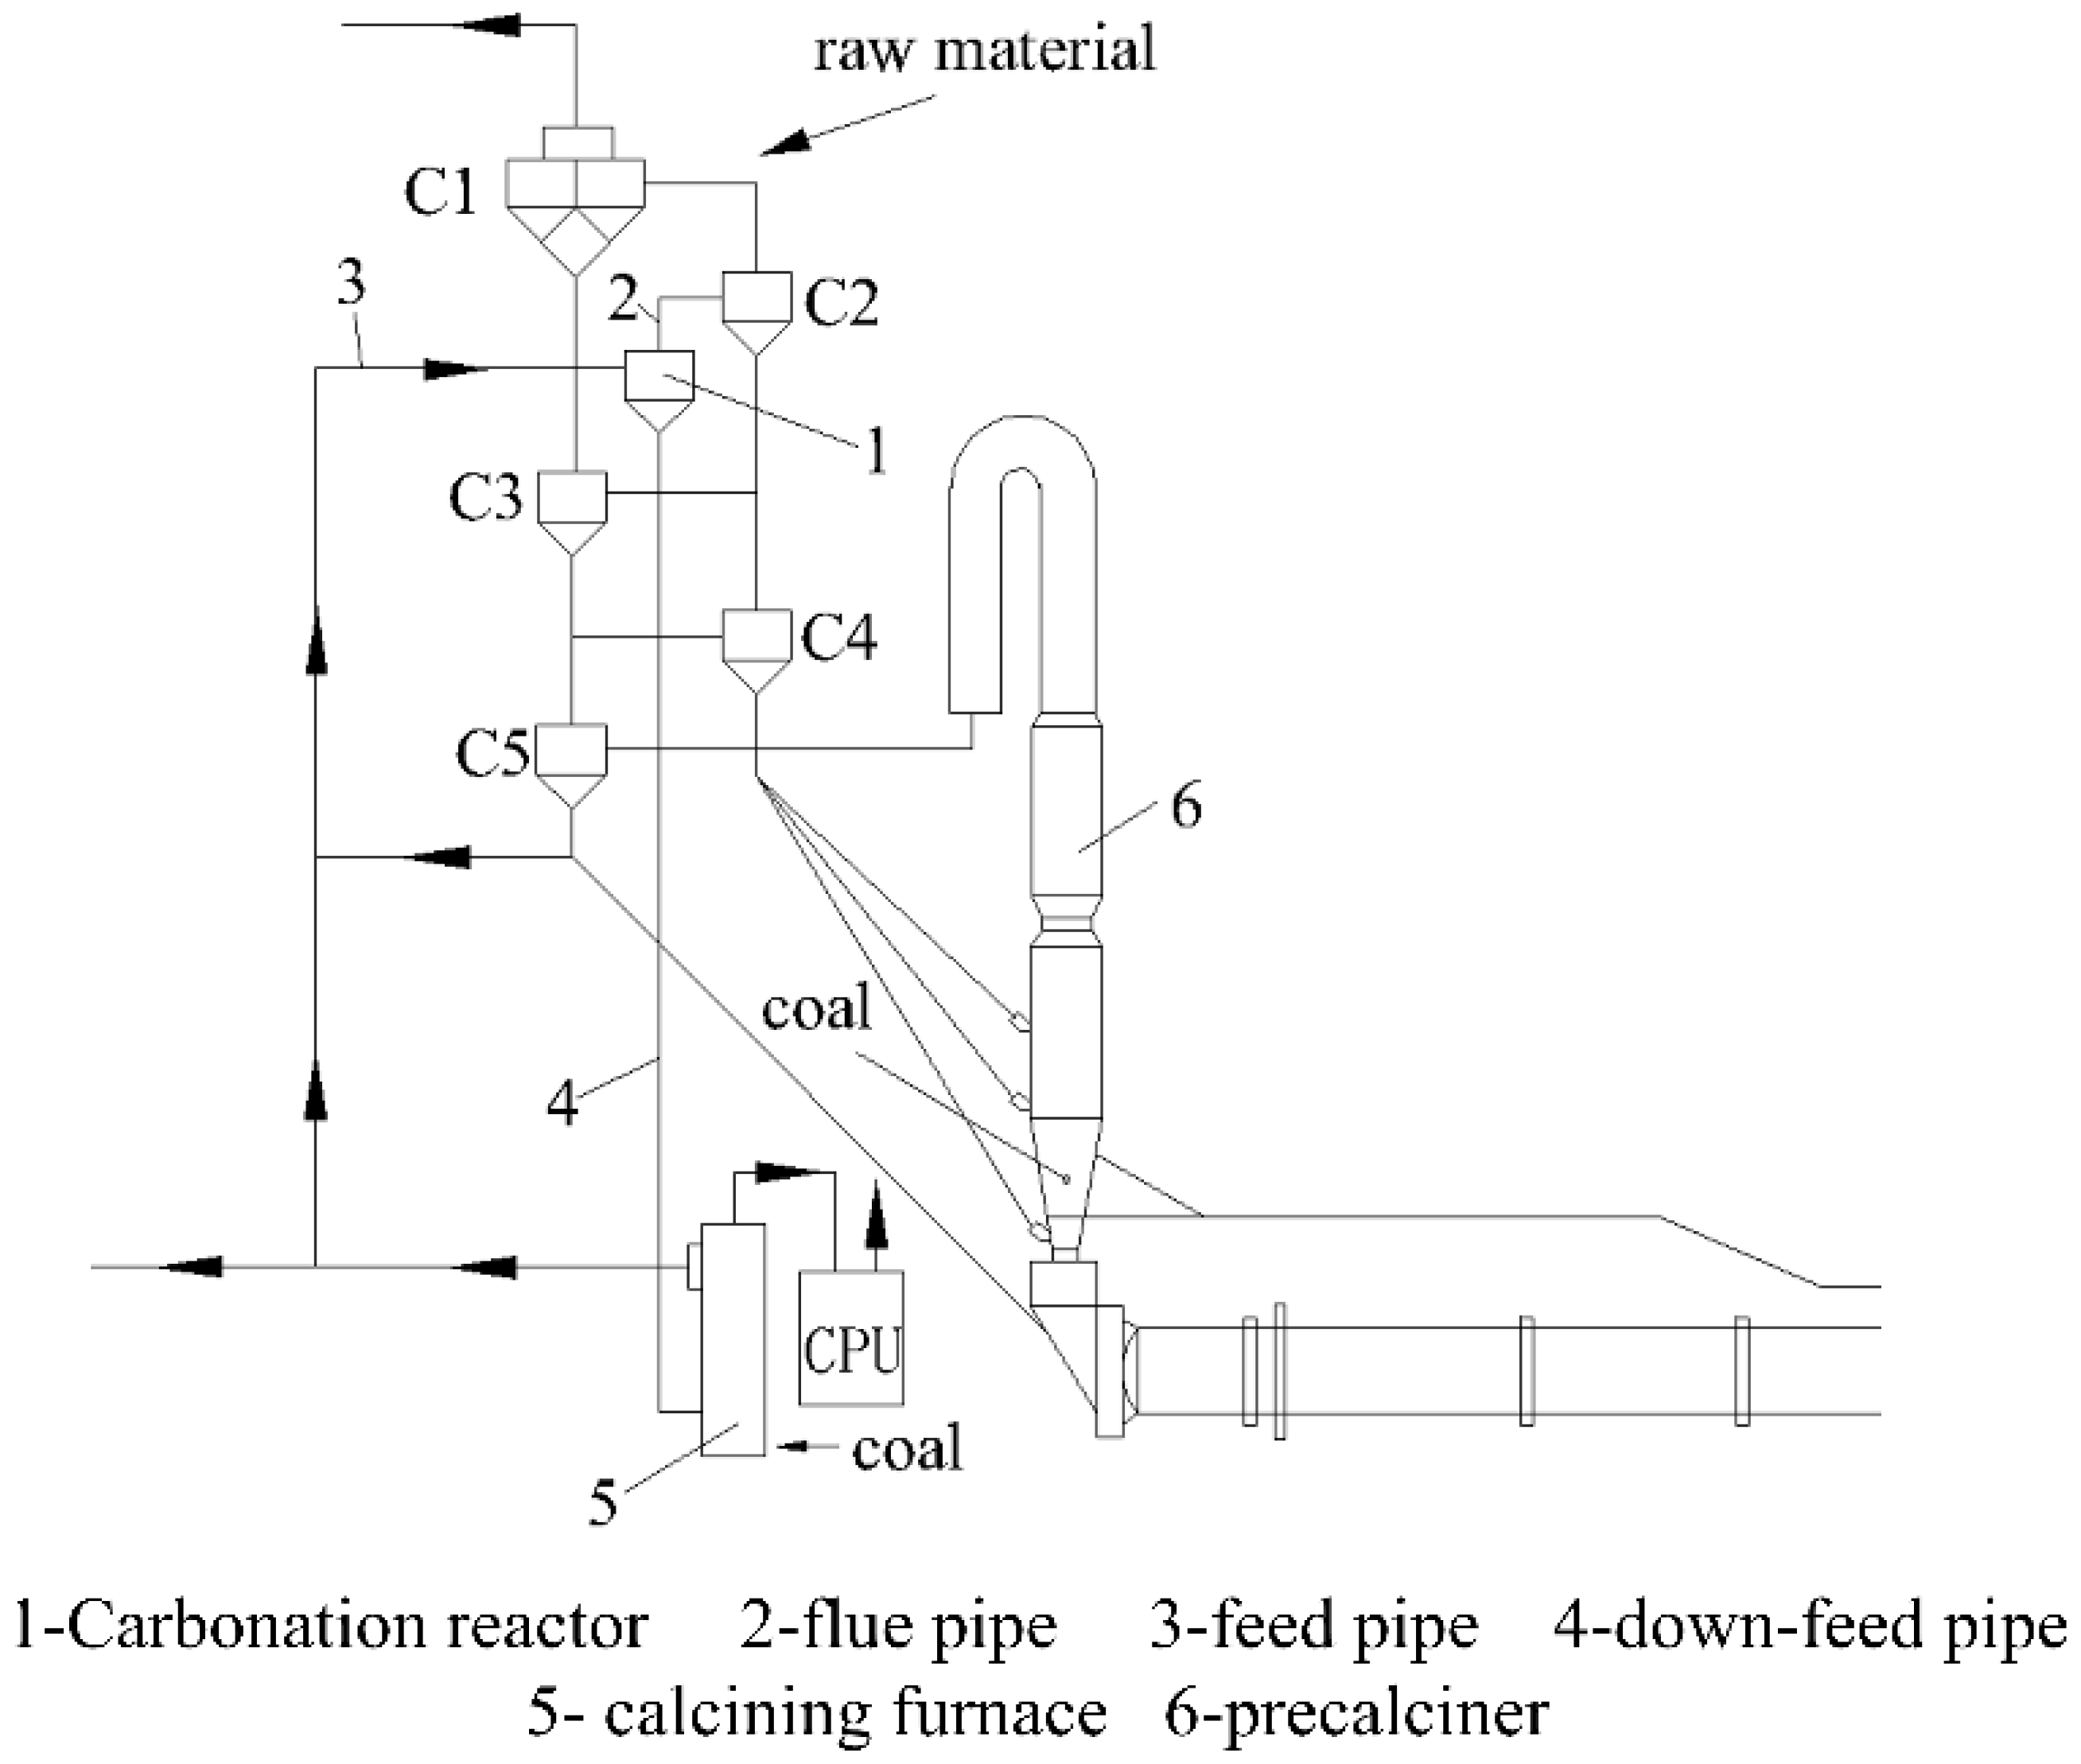
A representation of the process is shown in Figure 1. The carbonation reactor C2.5 was added at the outlet of C3. The flue gas of C3 and the active CaO entered the reactor through the carbonation reactor inlet. The CO2 of the flue gas was adsorbed after the complete reaction in the reactor and was discharged through the carbonation reactor outlet into the C2 cyclone. The generated CaCO3 was discharged through the dust exhaust into the calciner placed on the ground. Part of the CaO obtained after calcination was transferred to the carbonation reactor with the CaO at the outlet of the C5 down-feed pipe. At the same time, the other part of the calciner was directly transferred to the homogenization bank as the raw material. The CO2-rich flue gas entered the CPU (CO2 purification system) after calcination, and the pure CO2 could be used for commercial purposes.

2.2. Material Properties

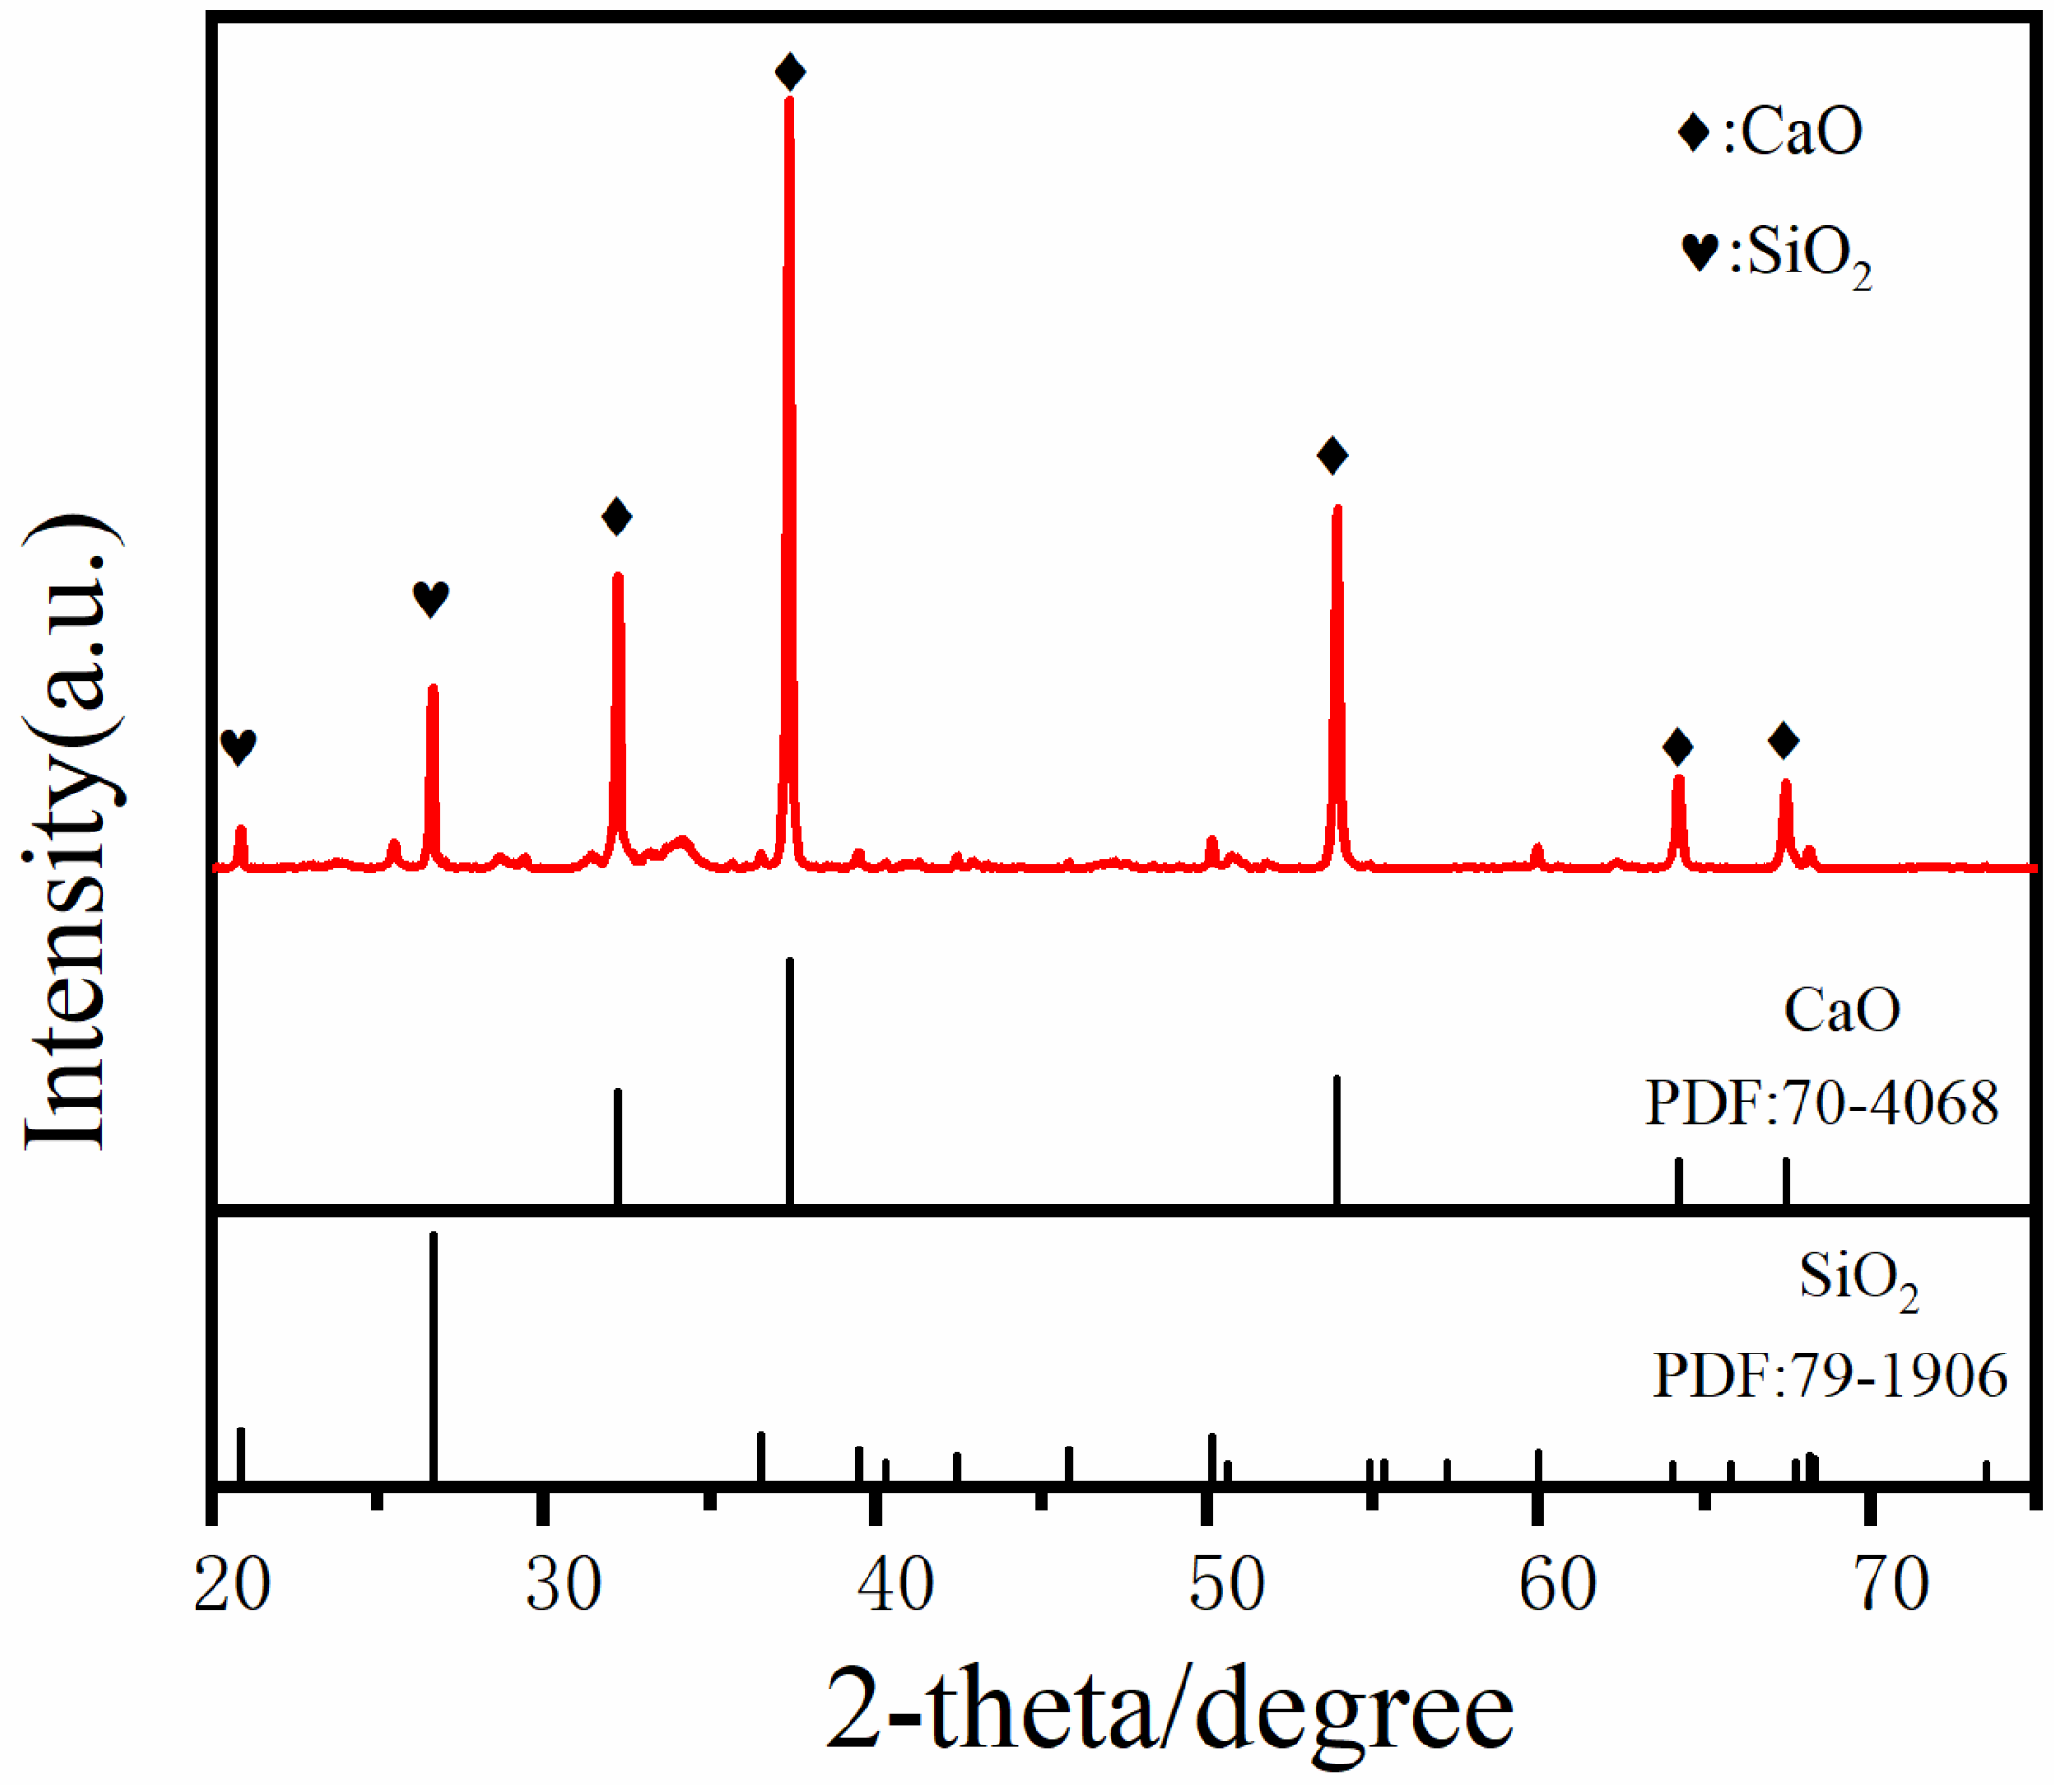
The raw material at the outlet of the C5 down-feed pipe is a mixture. In order to study what are the main components of the raw material from the C5 down-feed pipe, it was analyzed by an XRD (X-ray diffractometer). The XRD analysis results of the raw material, at the outlet of the C5 down-feed pipe, are shown in Figure 2. The results show that CaO and SiO2 are the two compounds that accounted for a significantly high proportion of the mixture at the outlet of the C5 down-feed pipe. At the same time, the phase content analysis results of the jade software show that CaO accounts for 78.4%, and SiO2 takes up 21.4%.
The results from the XRF analysis of the raw material, obtained from the C5 down-feed pipe, are presented in Table 3. XRF (X-ray Fluorescence) analysis is a commonly used chemical analysis technique that can quickly and accurately determine the content of elements in a sample [29]. Table 3 shows that the elements in the raw material derived from the C5 down-feed pipe included Ca, Si, Al, Fe, S, Mg, K, Ti, CL, Na, and other elements, which account for approximately 49.4% of the Ca content. Correspondingly, the CaO content of the raw material obtained from the C5 down-feed pipe was 75.09%. Combined with the elemental analysis results of the XRF, the CaO content of the raw material obtained from the C5 down-feed pipe can reach about 80%. Moreover, the actual thermal calibration data of the factory revealed that the decomposition rate of calcium carbonate at the C5 down-feed pipe can reach 96.2%, and the freshly decomposed calcium carbonate has the characteristics of high activity, indicating the feasibility of selecting the raw material at the outlet of the C5 down-feed pipe as the CO2 absorbent.

3. Numerical Theory and Physical Model

3.1. Numerical Governing Equation

3.1.1. Fundamental Governing Equations of Fluid Mechanics

The carbonation reactor involves the movement of a gas-solid, two-phase flow. Hot flue gas carries adsorbent particles into the reactor to complete the chemical adsorption and separation of the reaction products. This process follows the basic control equations of fluid dynamics, including the equations of mass, momentum, energy, and component conservation.
The mass conservation equation is shown below:
ρ t + ρ u x + ρ v y + ρ w z = 0
The momentum conservation equation is shown below:
ρ u t + d i v ρ u u = d i v μ   g r a d   u P x + S u
ρ v t + d i v ρ v u = d i v μ   g r a d   v P y + S v
ρ w t + d i v ρ w u = d i v μ   g r a d   w P z + S w
The energy conservation equation is shown below:
ρ C p T t + d i v ρ u C p T = d i v λ C p + ρ μ P r d i v C p T
The component conservation equation is shown below:
C S t + d i v ρ u C S = d i v D S   g r a d   ρ C S + S S
where ρ is the density and t is time. u, v, and w are the components of the velocity vector in the x, y, and z directions. u is the velocity vector and μ is the kinetic viscosity. Su, Sv, and Sw are the generalized source terms of the momentum conservation equation, representing the force on the micro-element (Su = 0; Sv = 0; Sw =−ρg if the body has only gravity and the Z-axis is vertically upward). Cp is the specific heat capacity, T is the temperature, k is the heat transfer coefficient, and ST is the viscous dissipation term. CS is the volume concentration of the component, DS is the diffusion coefficient of the component, and SS is the production rate of the component. Pr is the ratio of momentum diffusivity to thermal diffusivity, and λ is the thermal conductivity of the flue gas.

3.1.2. Turbulence Governing Equation

The physical model of the carbonation reactor is a cyclone dust collector. The RNG k-ε turbulence model was selected for simulation after a comparative analysis based on the turbulent flow characteristics of the carbonation reactor. In general, the standard k-ε model is the most commonly used turbulence model for simulating reactors. However, specific distortion will occur when the standard k-ε model is used for swirling solid flow or flow with curved walls. Compared with the standard k-ε model, the RNG k-ε turbulence model can correct the turbulent viscosity, fully consider the rotation and rotation flow in the average flow [30], and simulate more realistic working conditions. Therefore, the standard k-ε model was hereby improved to the RNG k-ε model, and the k equation and ε equation in the model are as follows:
ρ k t + ρ k u i x i = x i α k μ e f f k x j + G k + ρ ε
ρ ε t + ρ k u i x i = x j α ε μ e f f ε x j + C l ε k G k + C 2 ε ρ ε 2 k
where
μ e f f = μ + μ t
μ t = ρ C μ k 2 ε
C μ = 0.0845 ,   α k = α ε = 1.39
C l ε = C 1 ε η 1 η η 0 1 + β η 3
C 1 ε = 1.42 , C 2 ε = 1.68
η = 2 E i j E i j k ε
E i j = 1 2 u i x j + u j x i
η 0 = 4.377 , β = 0.012

3.1.3. Granular Phase Model

The fluid is considered a continuous phase in the discrete phase model, and the particles are considered discrete phases moving along a specific orbit. Discrete phase models are grouped into particle cloud models and random orbit models. The stochastic orbit model evaluates the effect of transient turbulent velocity on the particle orbit using a stochastic method. The carbonation reactor has a cyclone shape, and the three-dimensional flow field inside the cyclone is caused by the interaction between the particles and the gas-phase turbulence. Therefore, the random orbit model is more suitable for the flow field of the cyclone. The random orbit model tracked a total of 5760 particle numbers.

3.2. Kinetic Model of Carbonation Reaction

The carbonation reaction of CaO and CO2 is a typical gas-solid reaction, and the reaction equation is shown in Equation (9). The driving of chemical reactions requires the acquisition of reaction kinetic parameters. The Arrhenius equation is shown in Equation (10), which can be used to calculate the kinetic reaction parameters. After solving the equation, the activation energy of the reaction E a is 100 kJ/mol, and the pre-factor A is 1 × 10¹⁵. This kinetic parameter was input into the reaction to control the occurrence of the carbonation reaction.
C a O + C O 2 C a C O 3 H = 179.2   KJ / mol
k = A e E a R T
where, k denotes the reaction rate constant at temperature T ; A , the pre-factor, also known as the Arrhenius constant; E a , the activation energy of the reaction; T , the absolute temperature; and R , the molar gas constant.

3.3. Physical Model

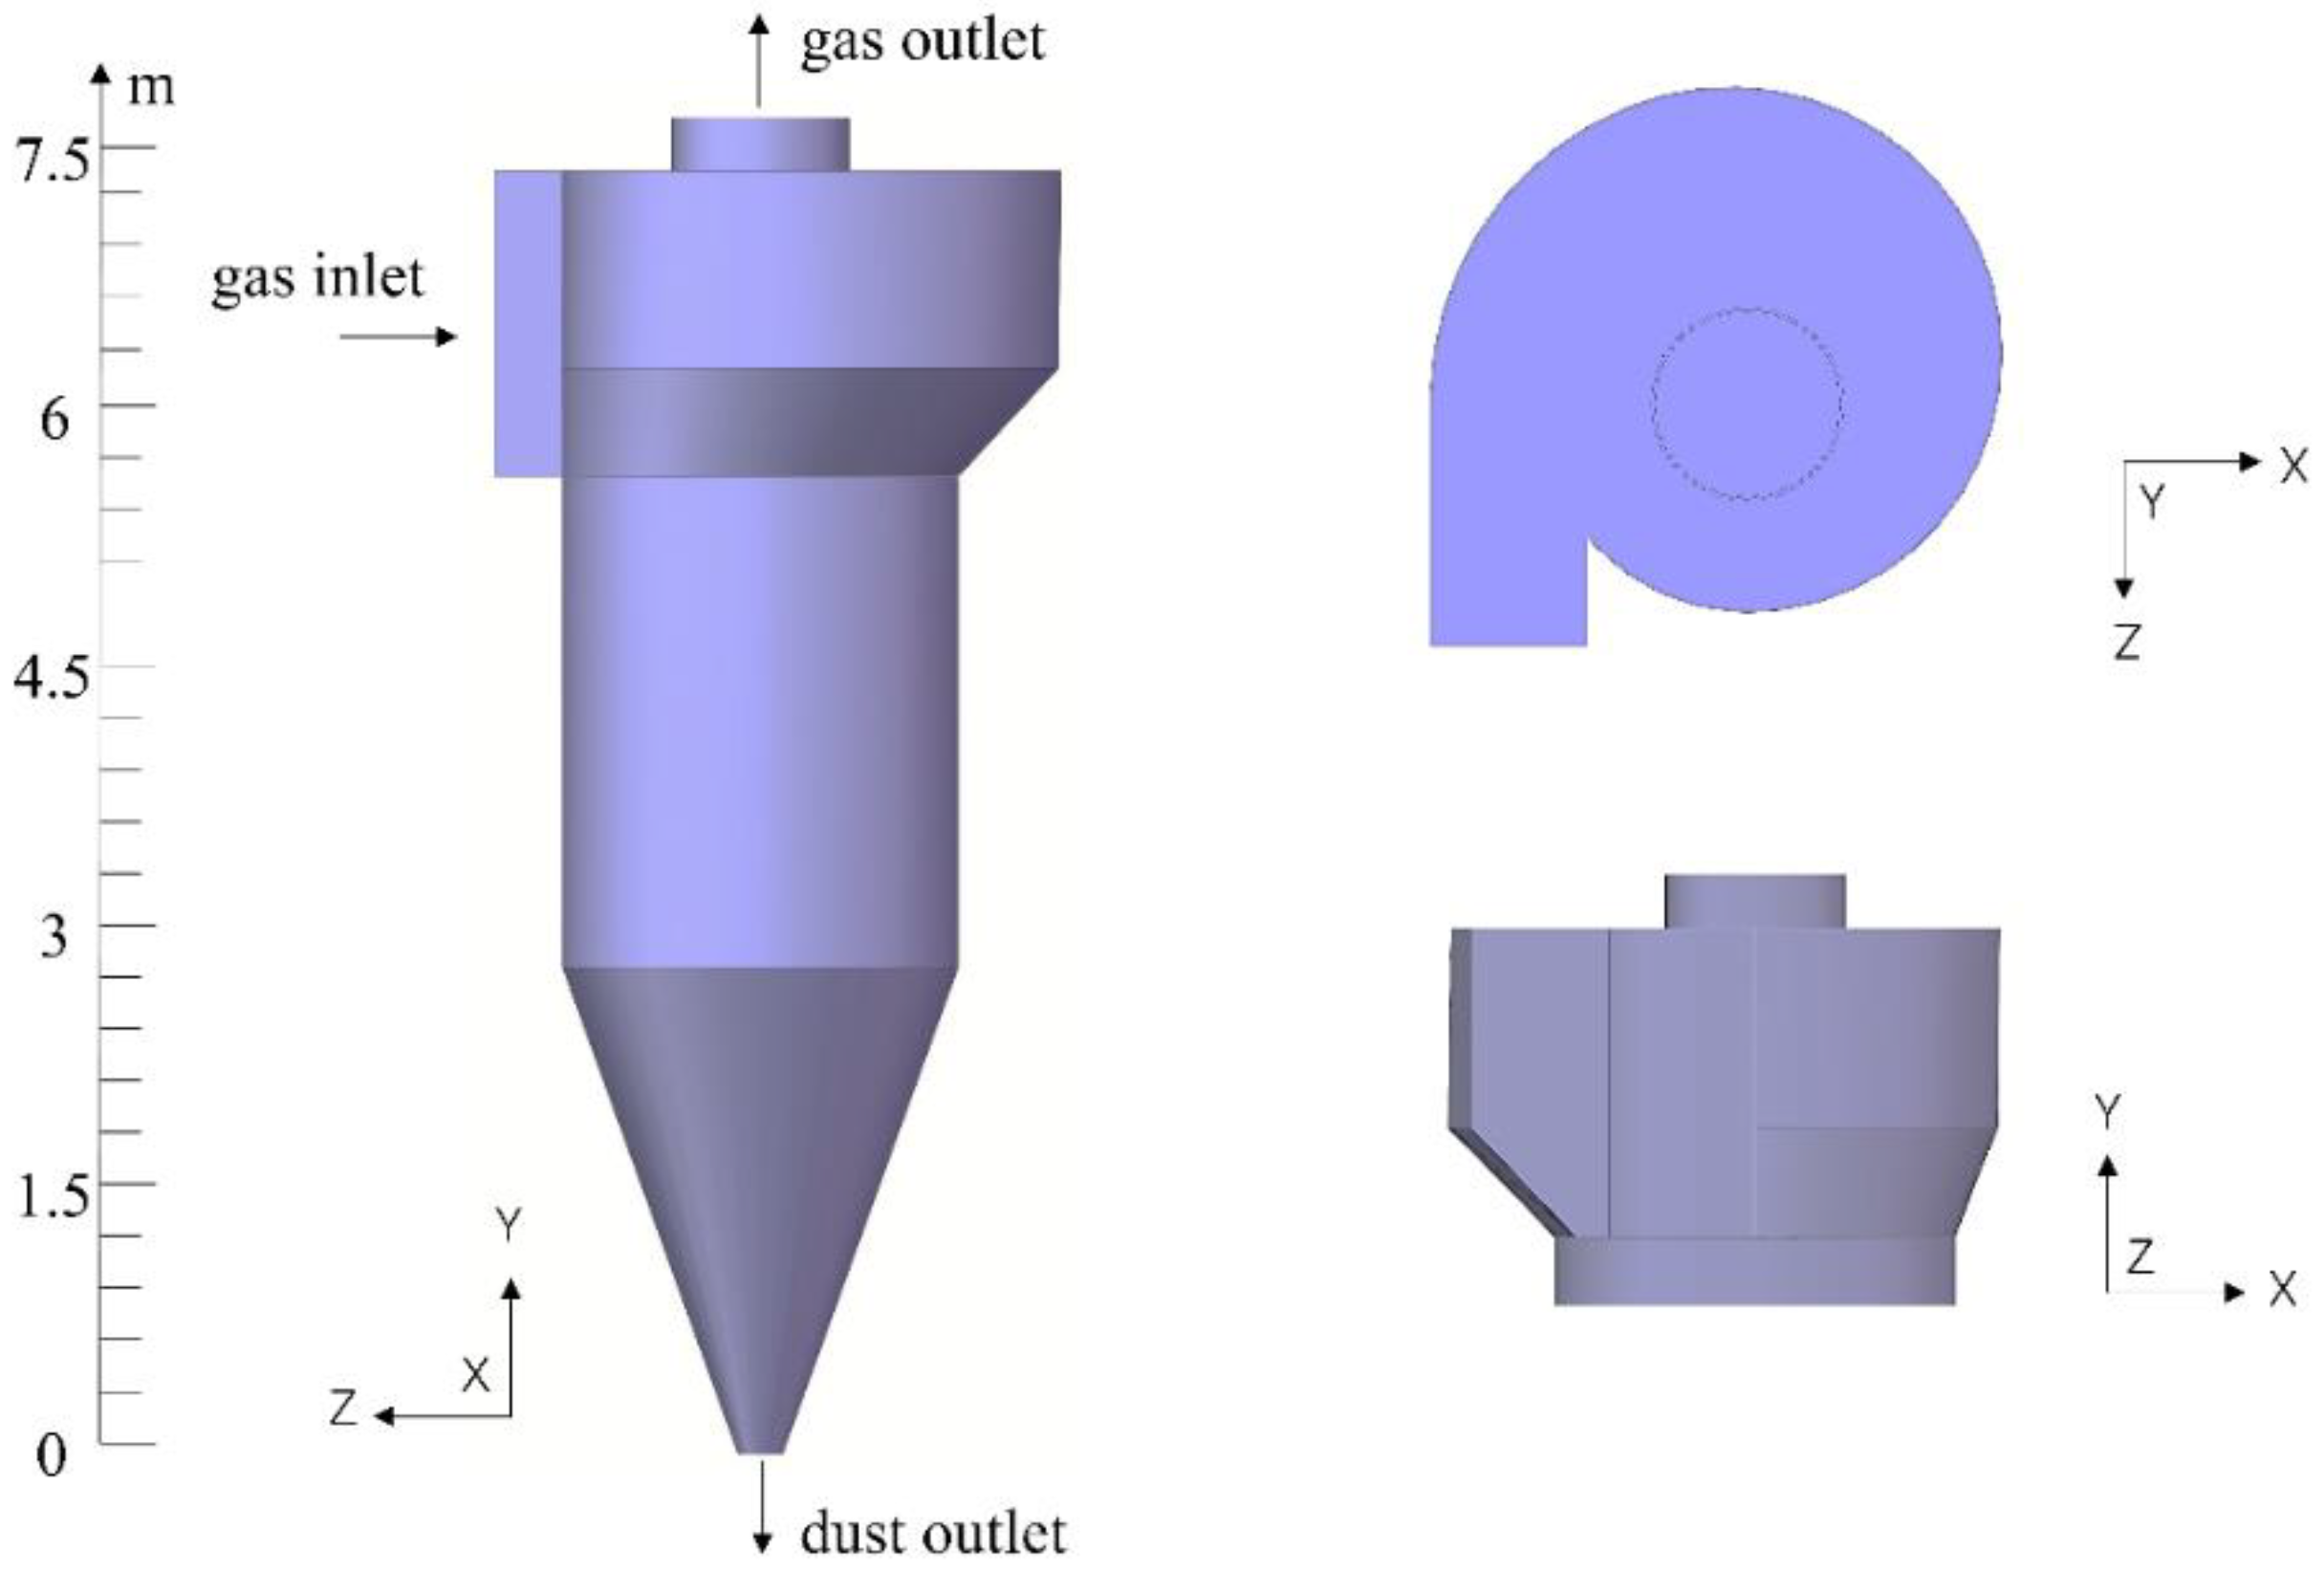
Figure 3 presents a 3D model of the carbonation reactor. The cyclone model allows for a longer particle residence time, adequate gas-solid reaction, and high absorption efficiency. The model was designed based on the model data of the cement field using the SolidWorks software for designing a three-dimensional model. The model comprises one gas inlet, one gas outlet, and one dust outlet. The total height of the model is 7550 mm, the diameter of the middle cylinder is 2235 mm, the diameter of the gas outlet is 1117.5 mm, and the diameter of the dust outlet is 250 mm.
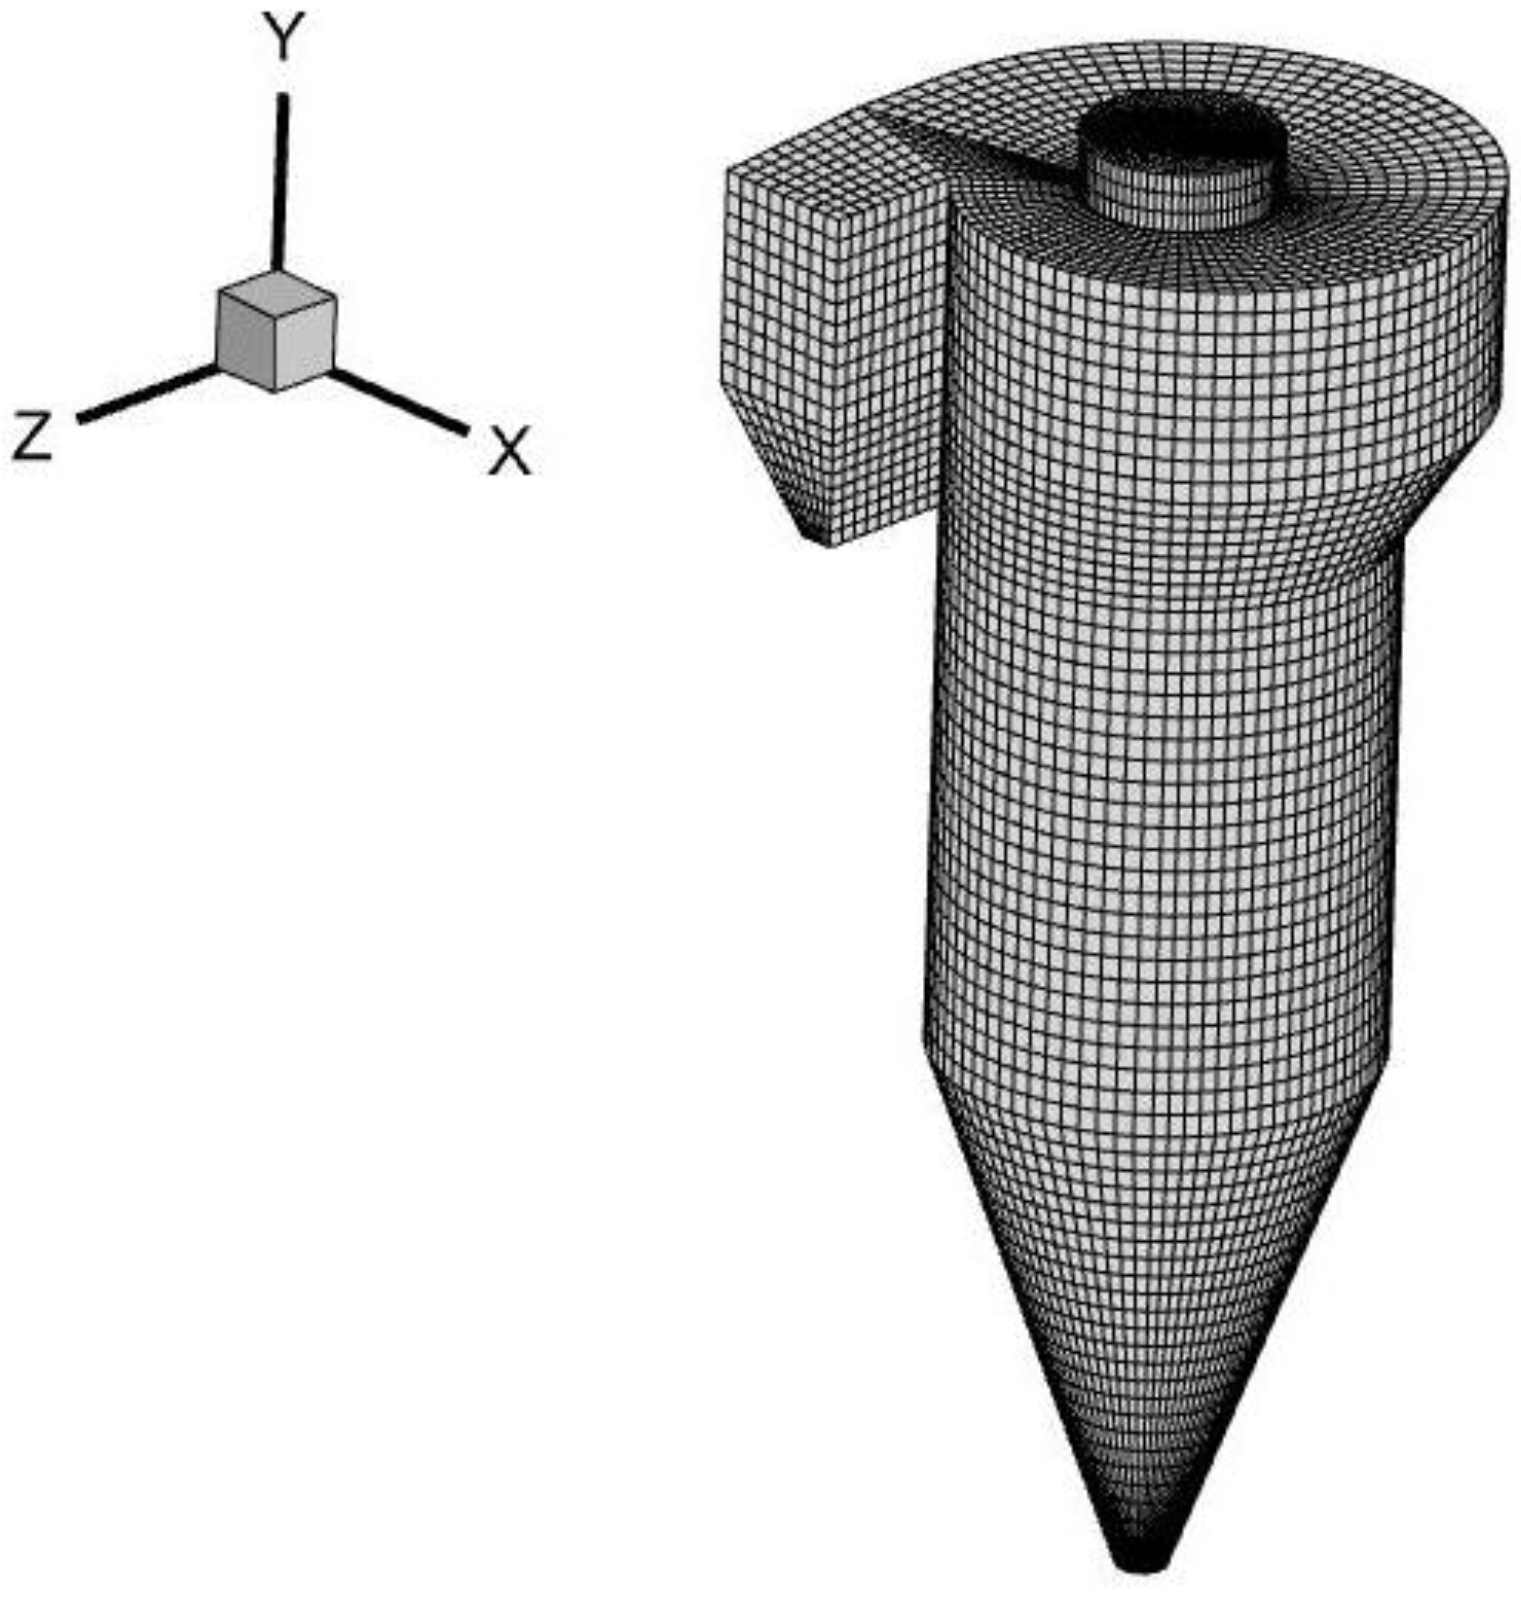
The mesh of the carbonation reactor was delineated using the ICEM software. The mesh is an unstructured mesh, and the results of the mesh delineation are shown in Figure 4. The number of meshes divided by the carbonation reactor is 117,344.

3.4. Boundary Conditions and Grid Independence Test

The boundary values used in this study were the original data of the cement plant, and the specific boundary values are presented in Table 4. The gas inlet was a velocity inlet, the gas outlet was a pressure outlet, the particle phase was set to trap the dust outlet and escape at the gas outlet, and the rest of the walls were set to reflective walls.
The following assumptions must be made for the particles to facilitate the calculation owing to the particle components’ inhomogeneity, the particle size’s uncertainty, and the particle movement’s irregularity:
  • The content of the CaO was the highest among the components of the raw material obtained from the C5 outlet, accounting for approximately 78.4%. Other components, such as SiO2, Al2O3, and Fe2O3, accounted for a relatively low proportion. It was assumed that the C5 outlet raw material only comprises the CaO to facilitate the calculation.
  • It was assumed that there was no relative velocity between the CaO and flue gas when they entered the carbonation reactor at the same time. The initial velocity of the particles is the inlet velocity of the gas.
A mesh combines computational cells generated by mathematical discretization based on the finite volume method. The model’s topology is divided to obtain the computational mesh using the Ansys ICEM meshing software. Different mesh quantities may lead to variations in computational accuracy. Therefore, the grid should be verified to ensure it is reliable. The temperature and O2 content corresponding to the grid numbers 57,018, 82,794, 117,344, 146,088, and 191,504 are shown in Table 5. The results showed that the data were stable when the number of the grid was 117,344 cells.

4. Analysis of Numerical Simulation Results

4.1. Model Validation Results

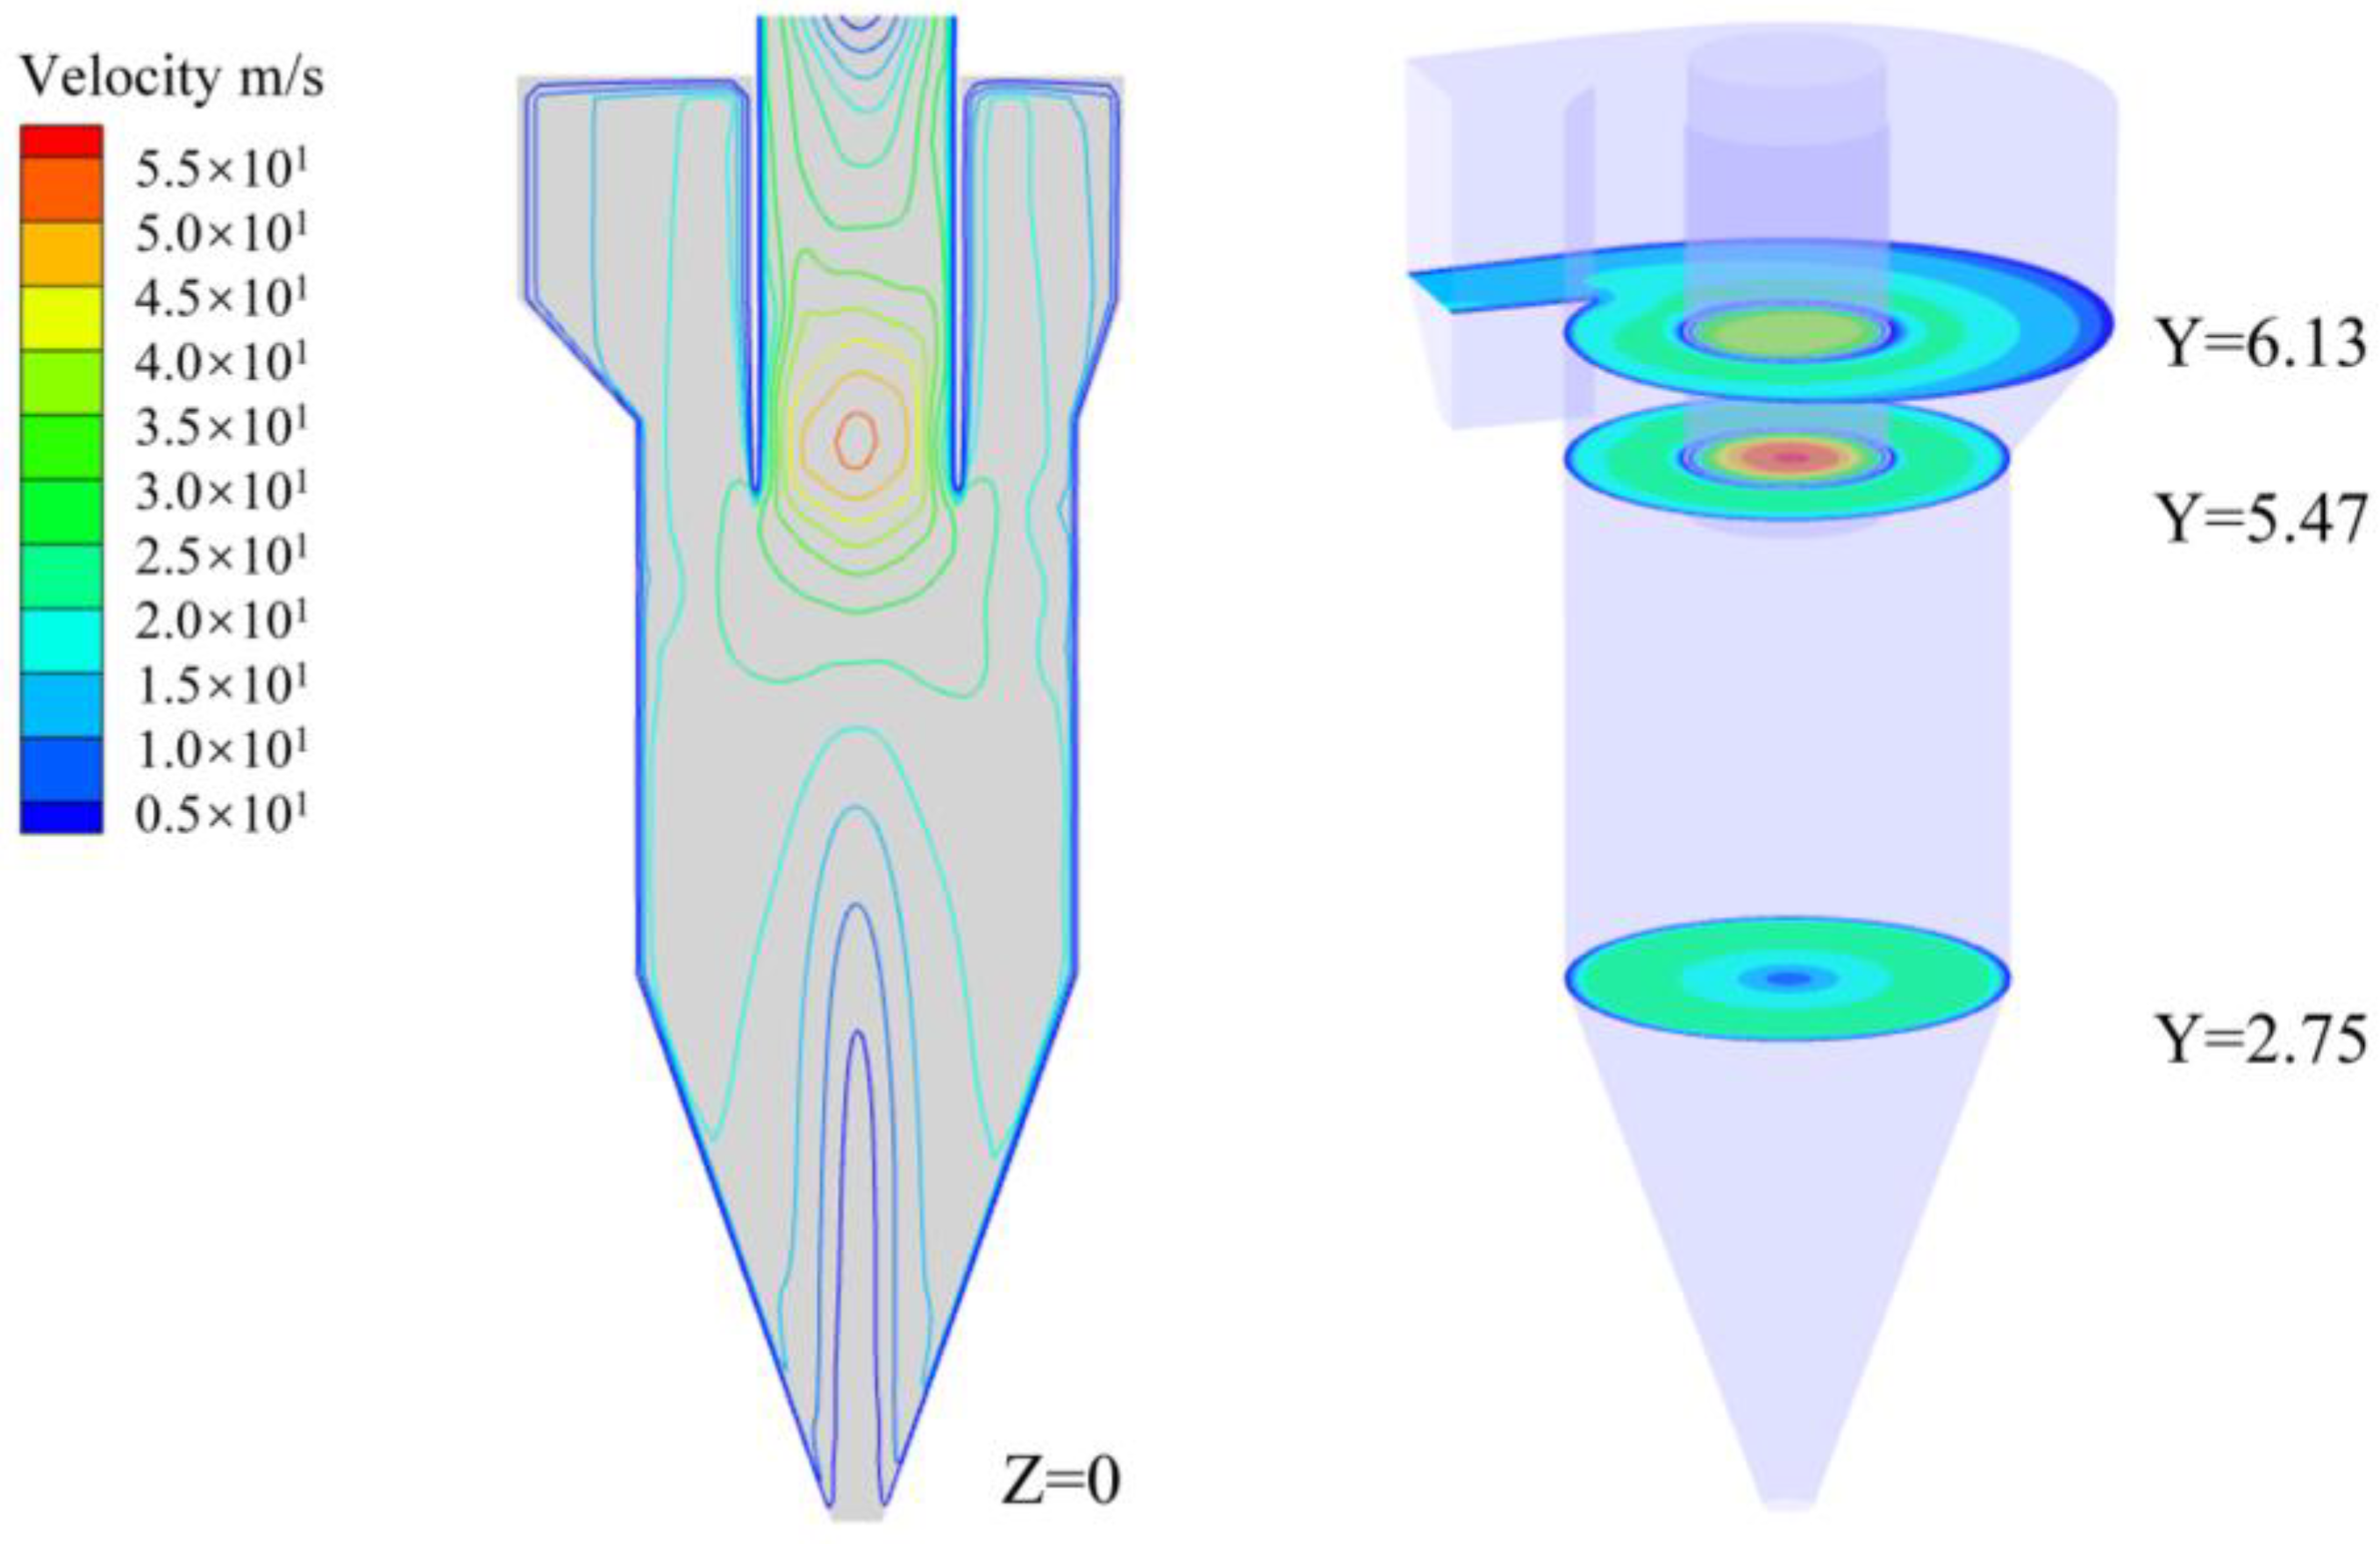
A cloud plot of the velocity distribution of the carbonation reactor gas is shown in Figure 5. The gas enters the carbonation reactor at high speed from the worm shell in the tangential direction, and the space suddenly increases, resulting in a decrease in the velocity. The gas velocity increases sharply when it moves to the entrance of the inner cylinder due to the sudden decrease in the flow space. The gas velocity exceeds the entrance velocity resulting in the occurrence of the vortex. The gas velocity at the worm shell does not show axisymmetric distribution due to the deviation of the worm shell from the center of the cylindrical cylinder. The velocity on the side away from the worm shell inlet between the cyclone and inner cylinder was low, thus promoting the gas-solid separation effect.
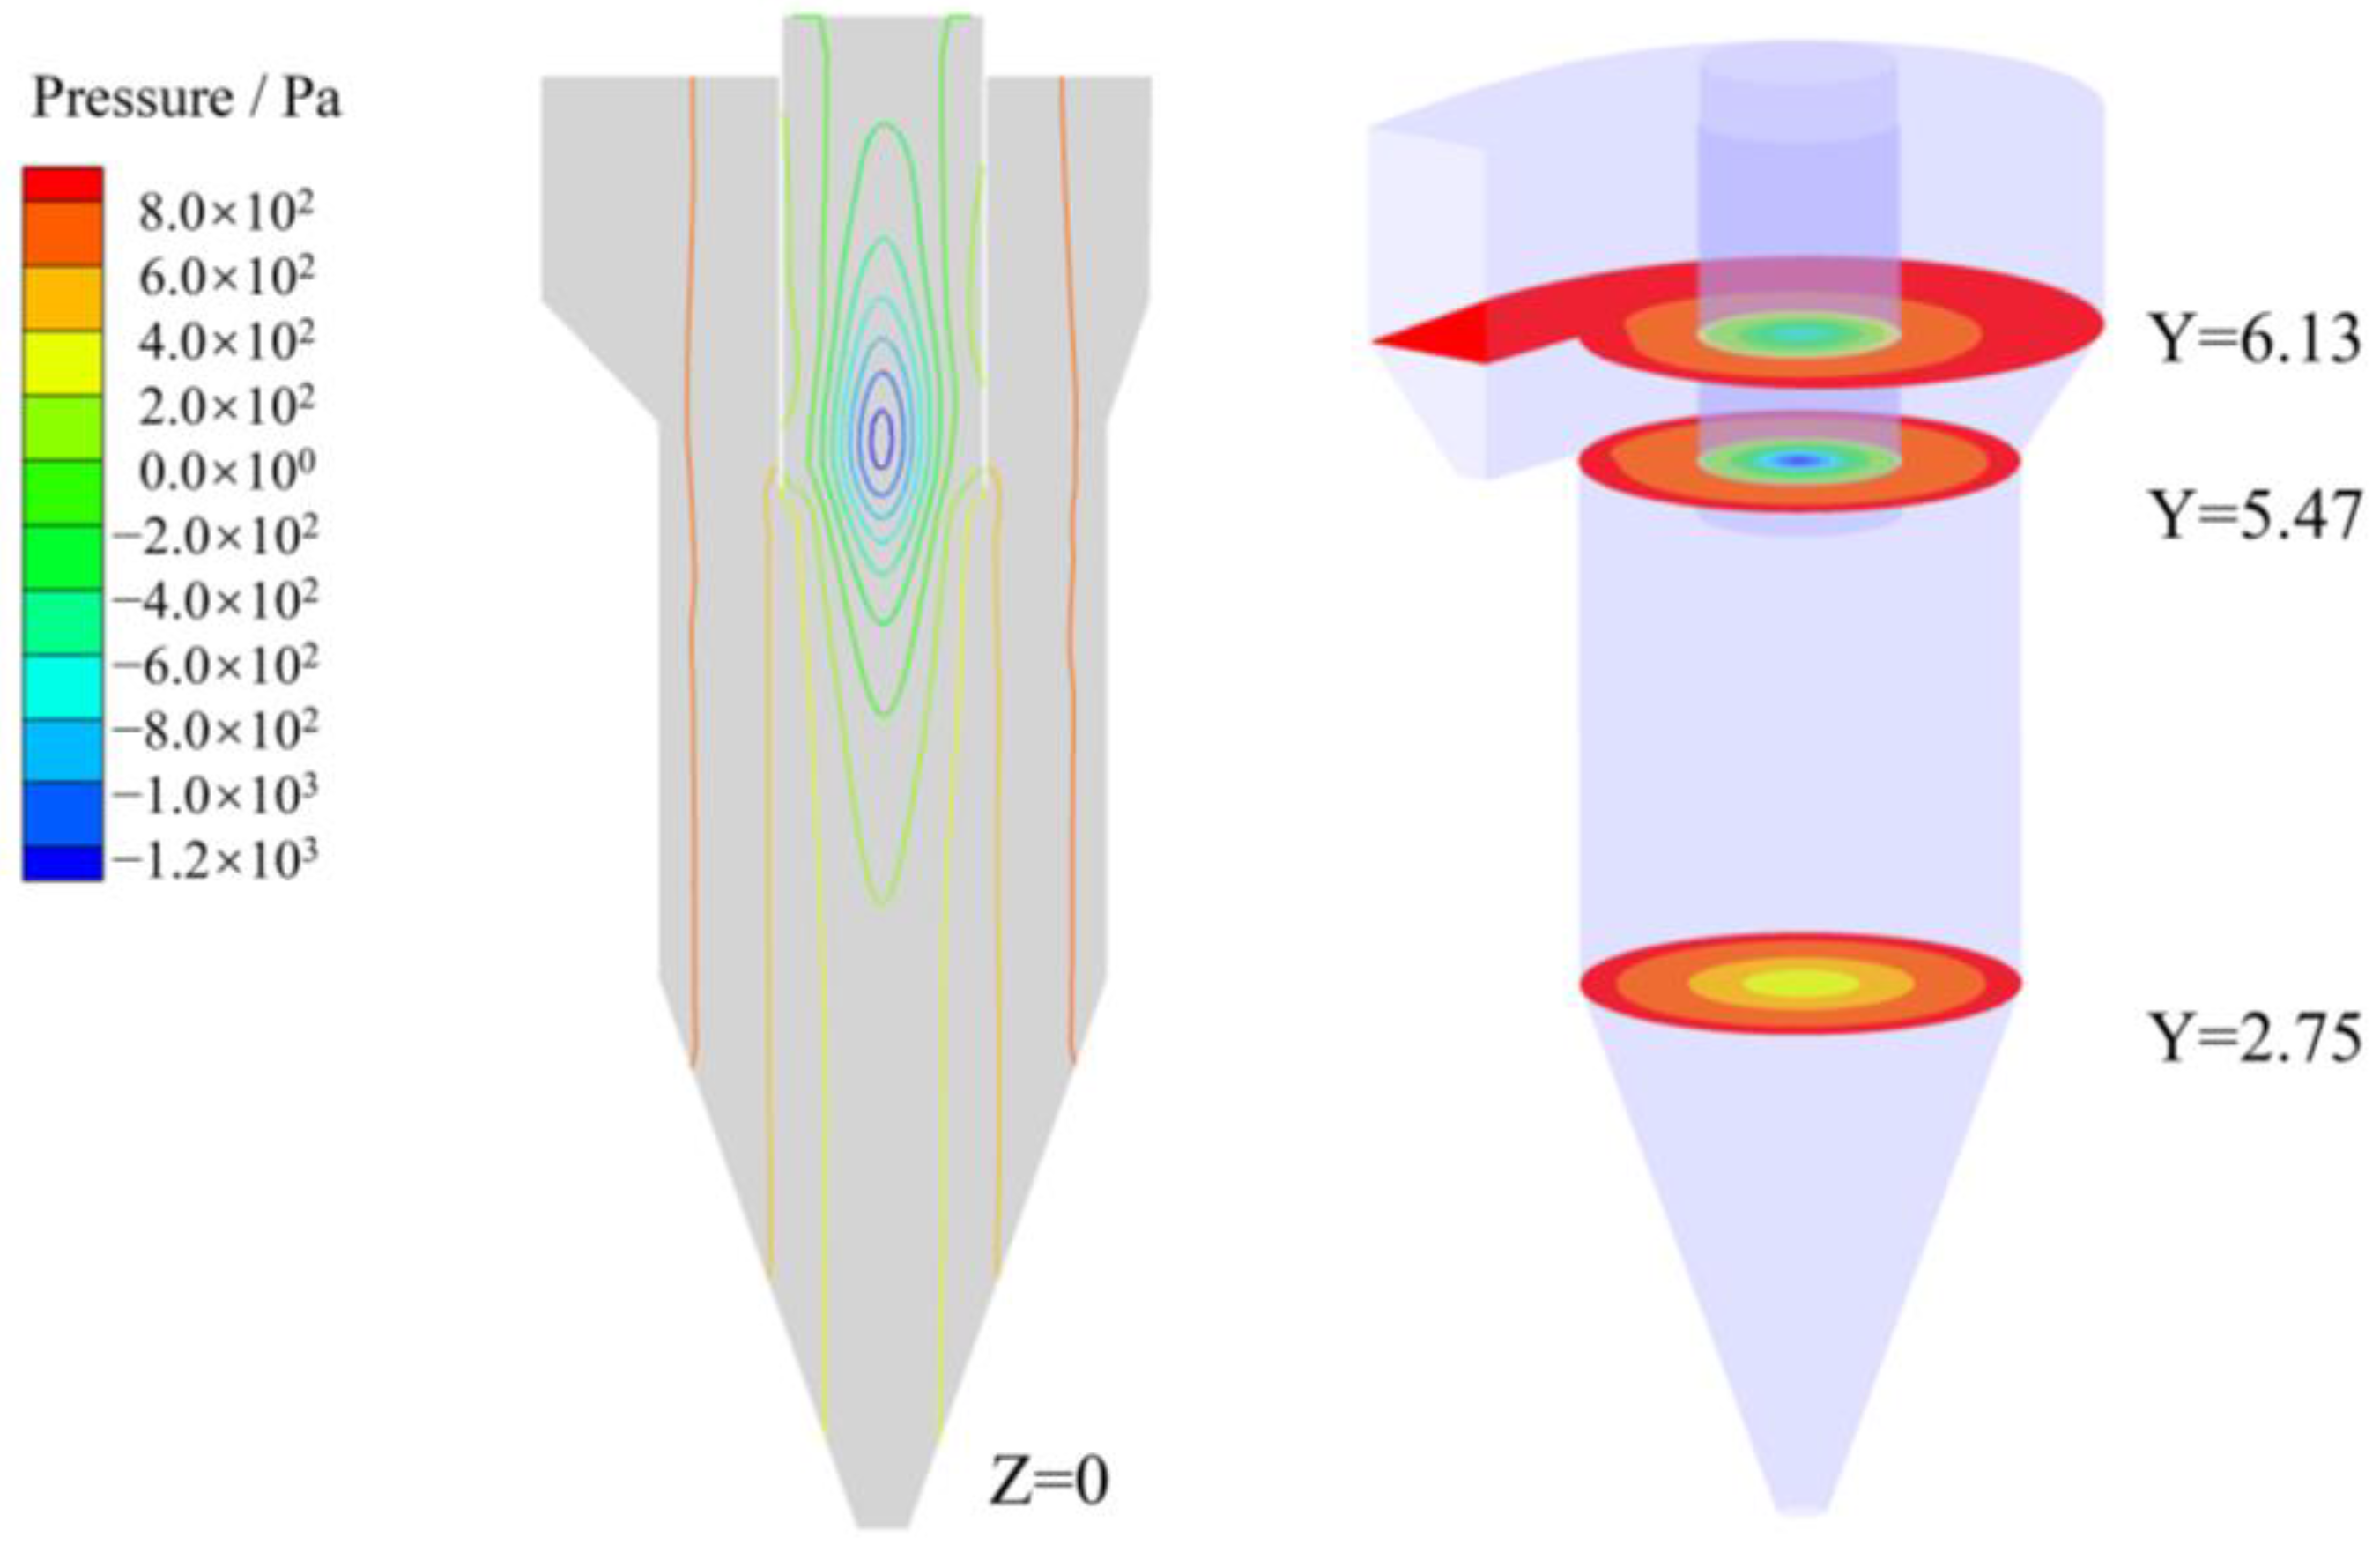
A cloud diagram of the static pressure distribution of the carbonation reactor in gas pressure is shown in Figure 6. The results showed that the static pressure value gradually decreased along the radial direction from the outside to the inside (Figure 6). The inner cylinder had the same distribution as the cylinder; the static pressure was lowest near the center axis of the inner cylinder with negative values (Figure 6). This phenomenon can be attributed to the forced vortex near the bottom of the inner cylinder, which forces the gas to rotate violently, resulting in a significant average pressure gradient. In addition, the results showed that the pressure gradually decreased at different heights along the axial direction. Negative pressure was observed at the center of the bottom of the reactor’s inner cylinder, forcing the gas to flow upward in the central part of the cone.
The above simulation results of the carbonation reactor’s single gas-phase cold flow field present velocity and pressure fields consistent with the general operation of cyclones in the literature, and the carbonation reactor can operate as usual [31]. It can be concluded that the carbonation reactor is effective.

4.2. Temperature Field Analysis of Carbonation Reactor

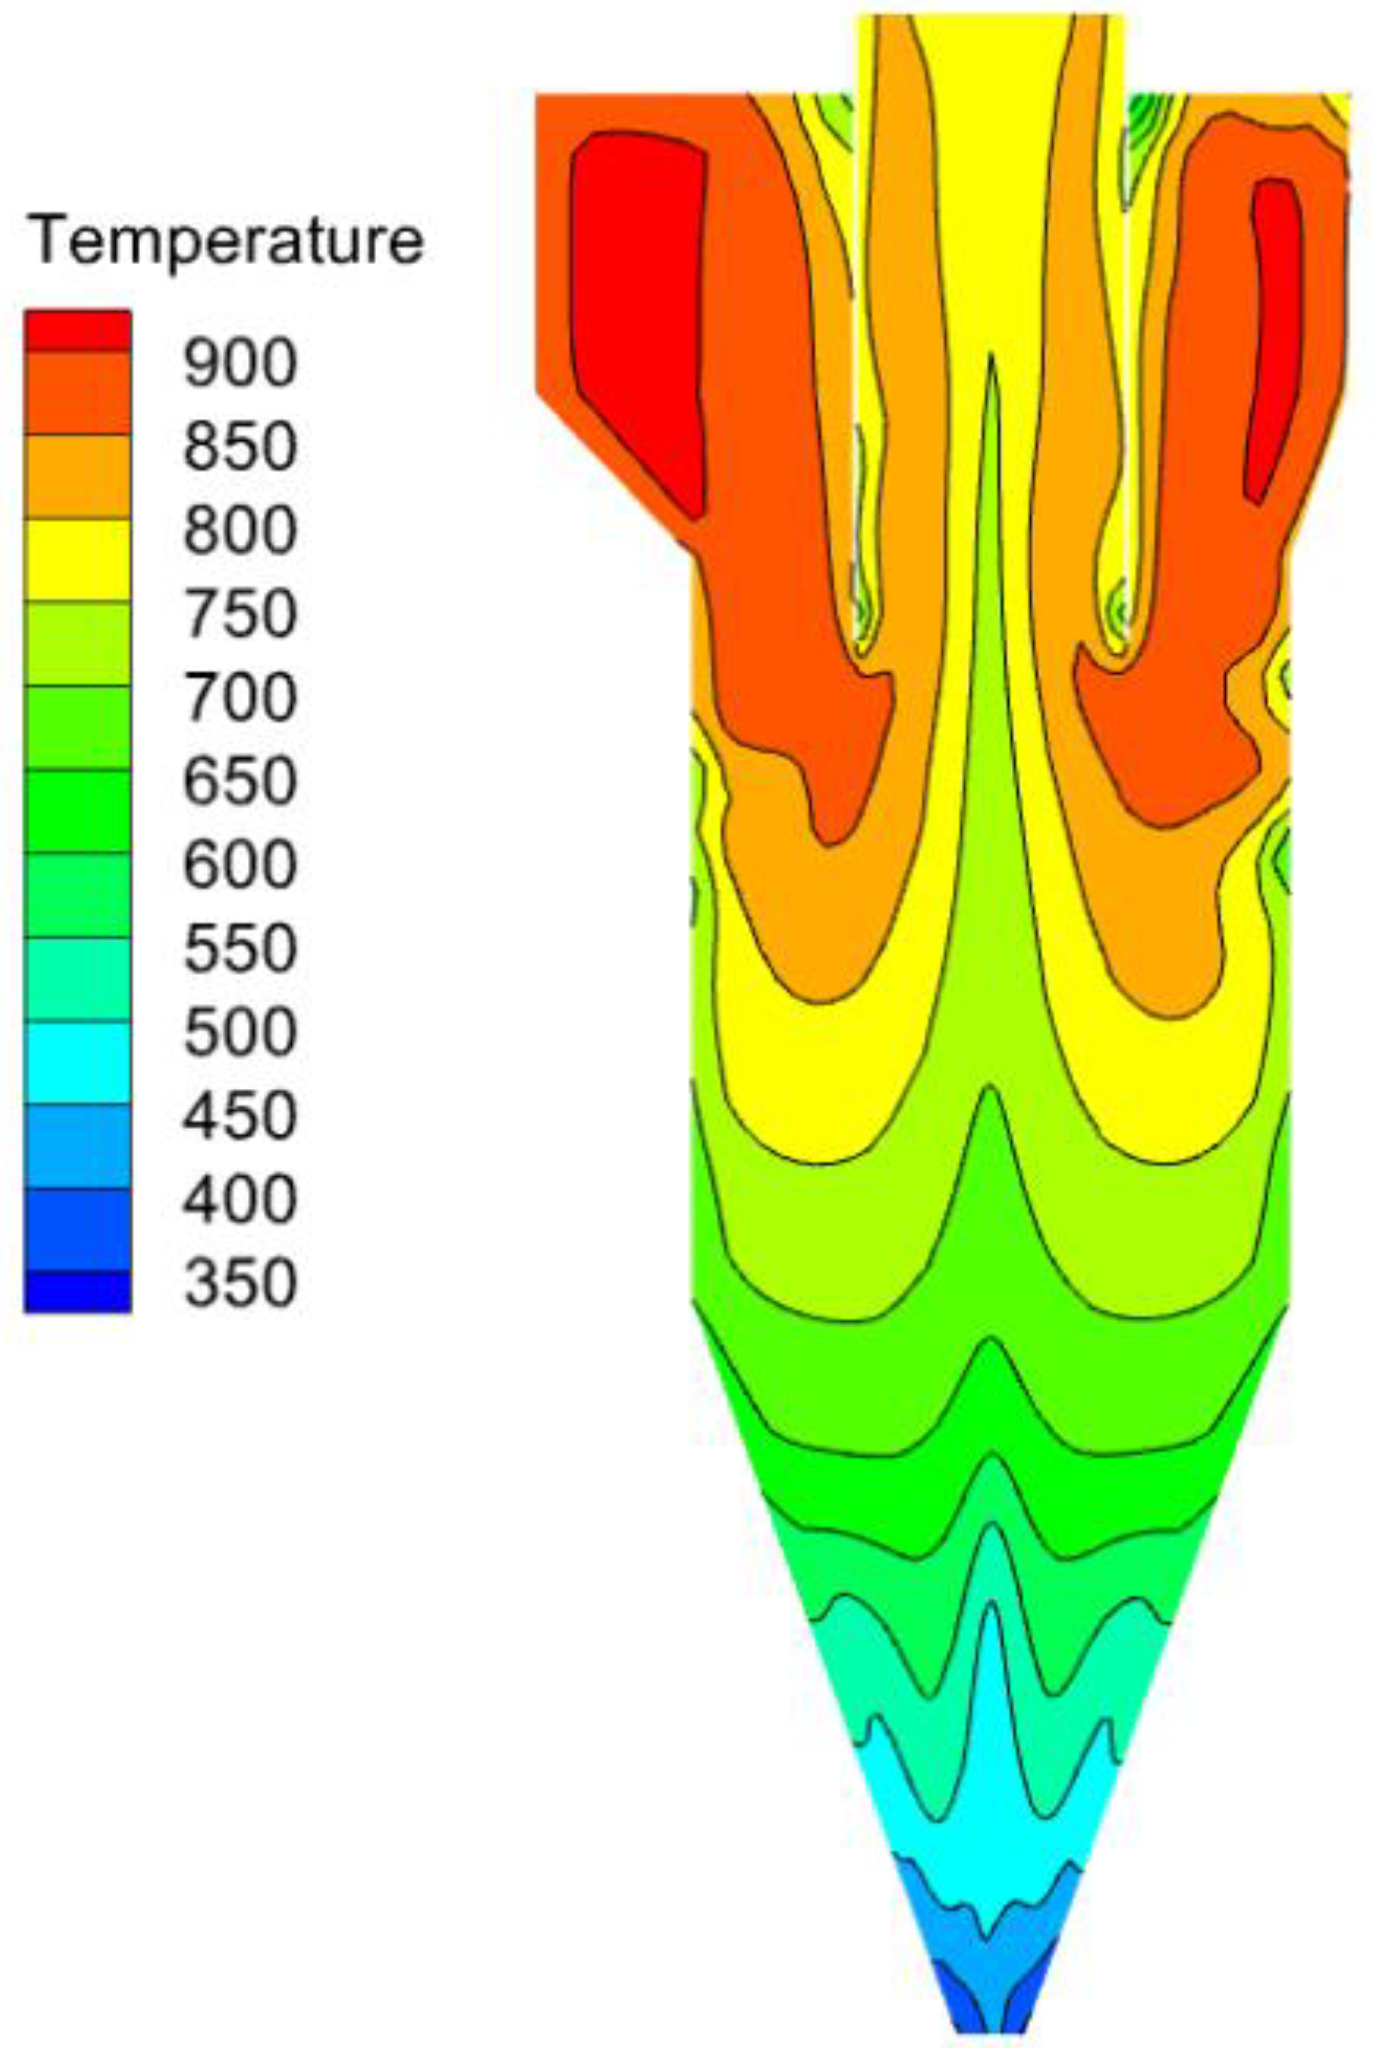
The temperature cloud in the carbonation reactor is shown in Figure 7. In the figure, the initial temperature of the gas is 911 K. The temperature of the flue gas decreases gradually along the flow direction. The temperature appears lower at the dust discharge port, where the temperature at the flue gas outlet is about 800 K. The temperature variation law is consistent with the operation principle of the preheater [32].

4.3. Analysis of the Motion of Particles

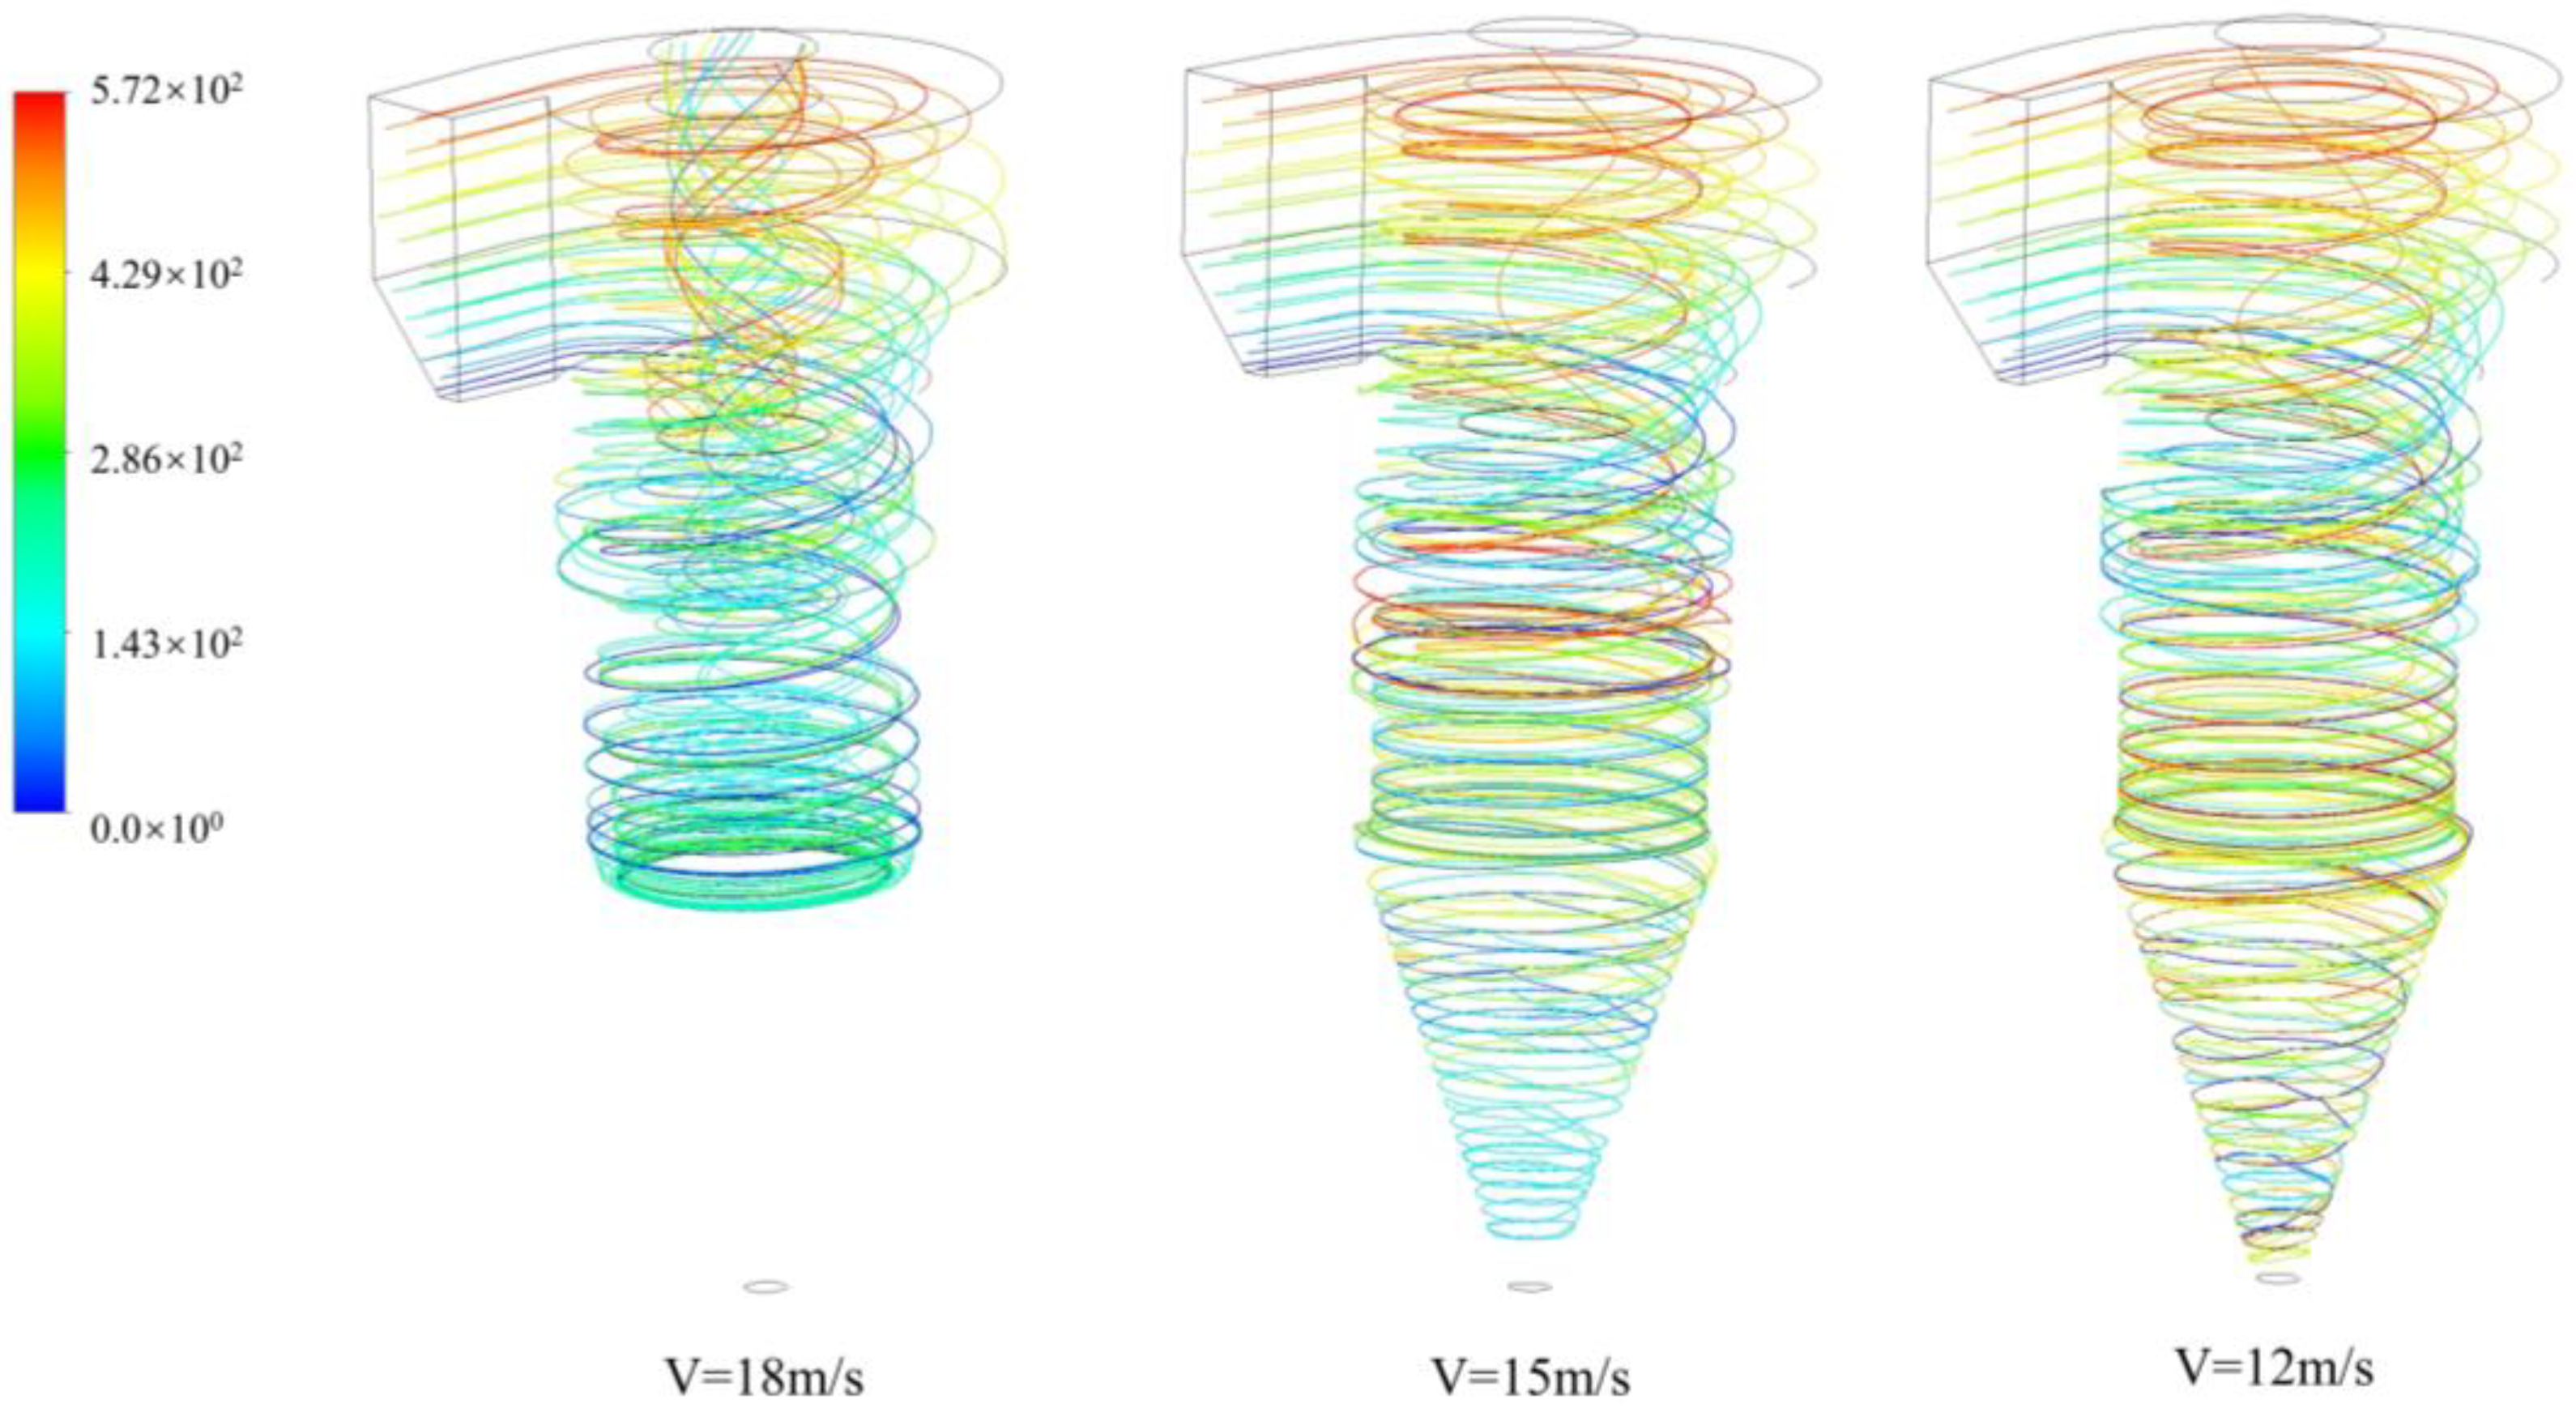
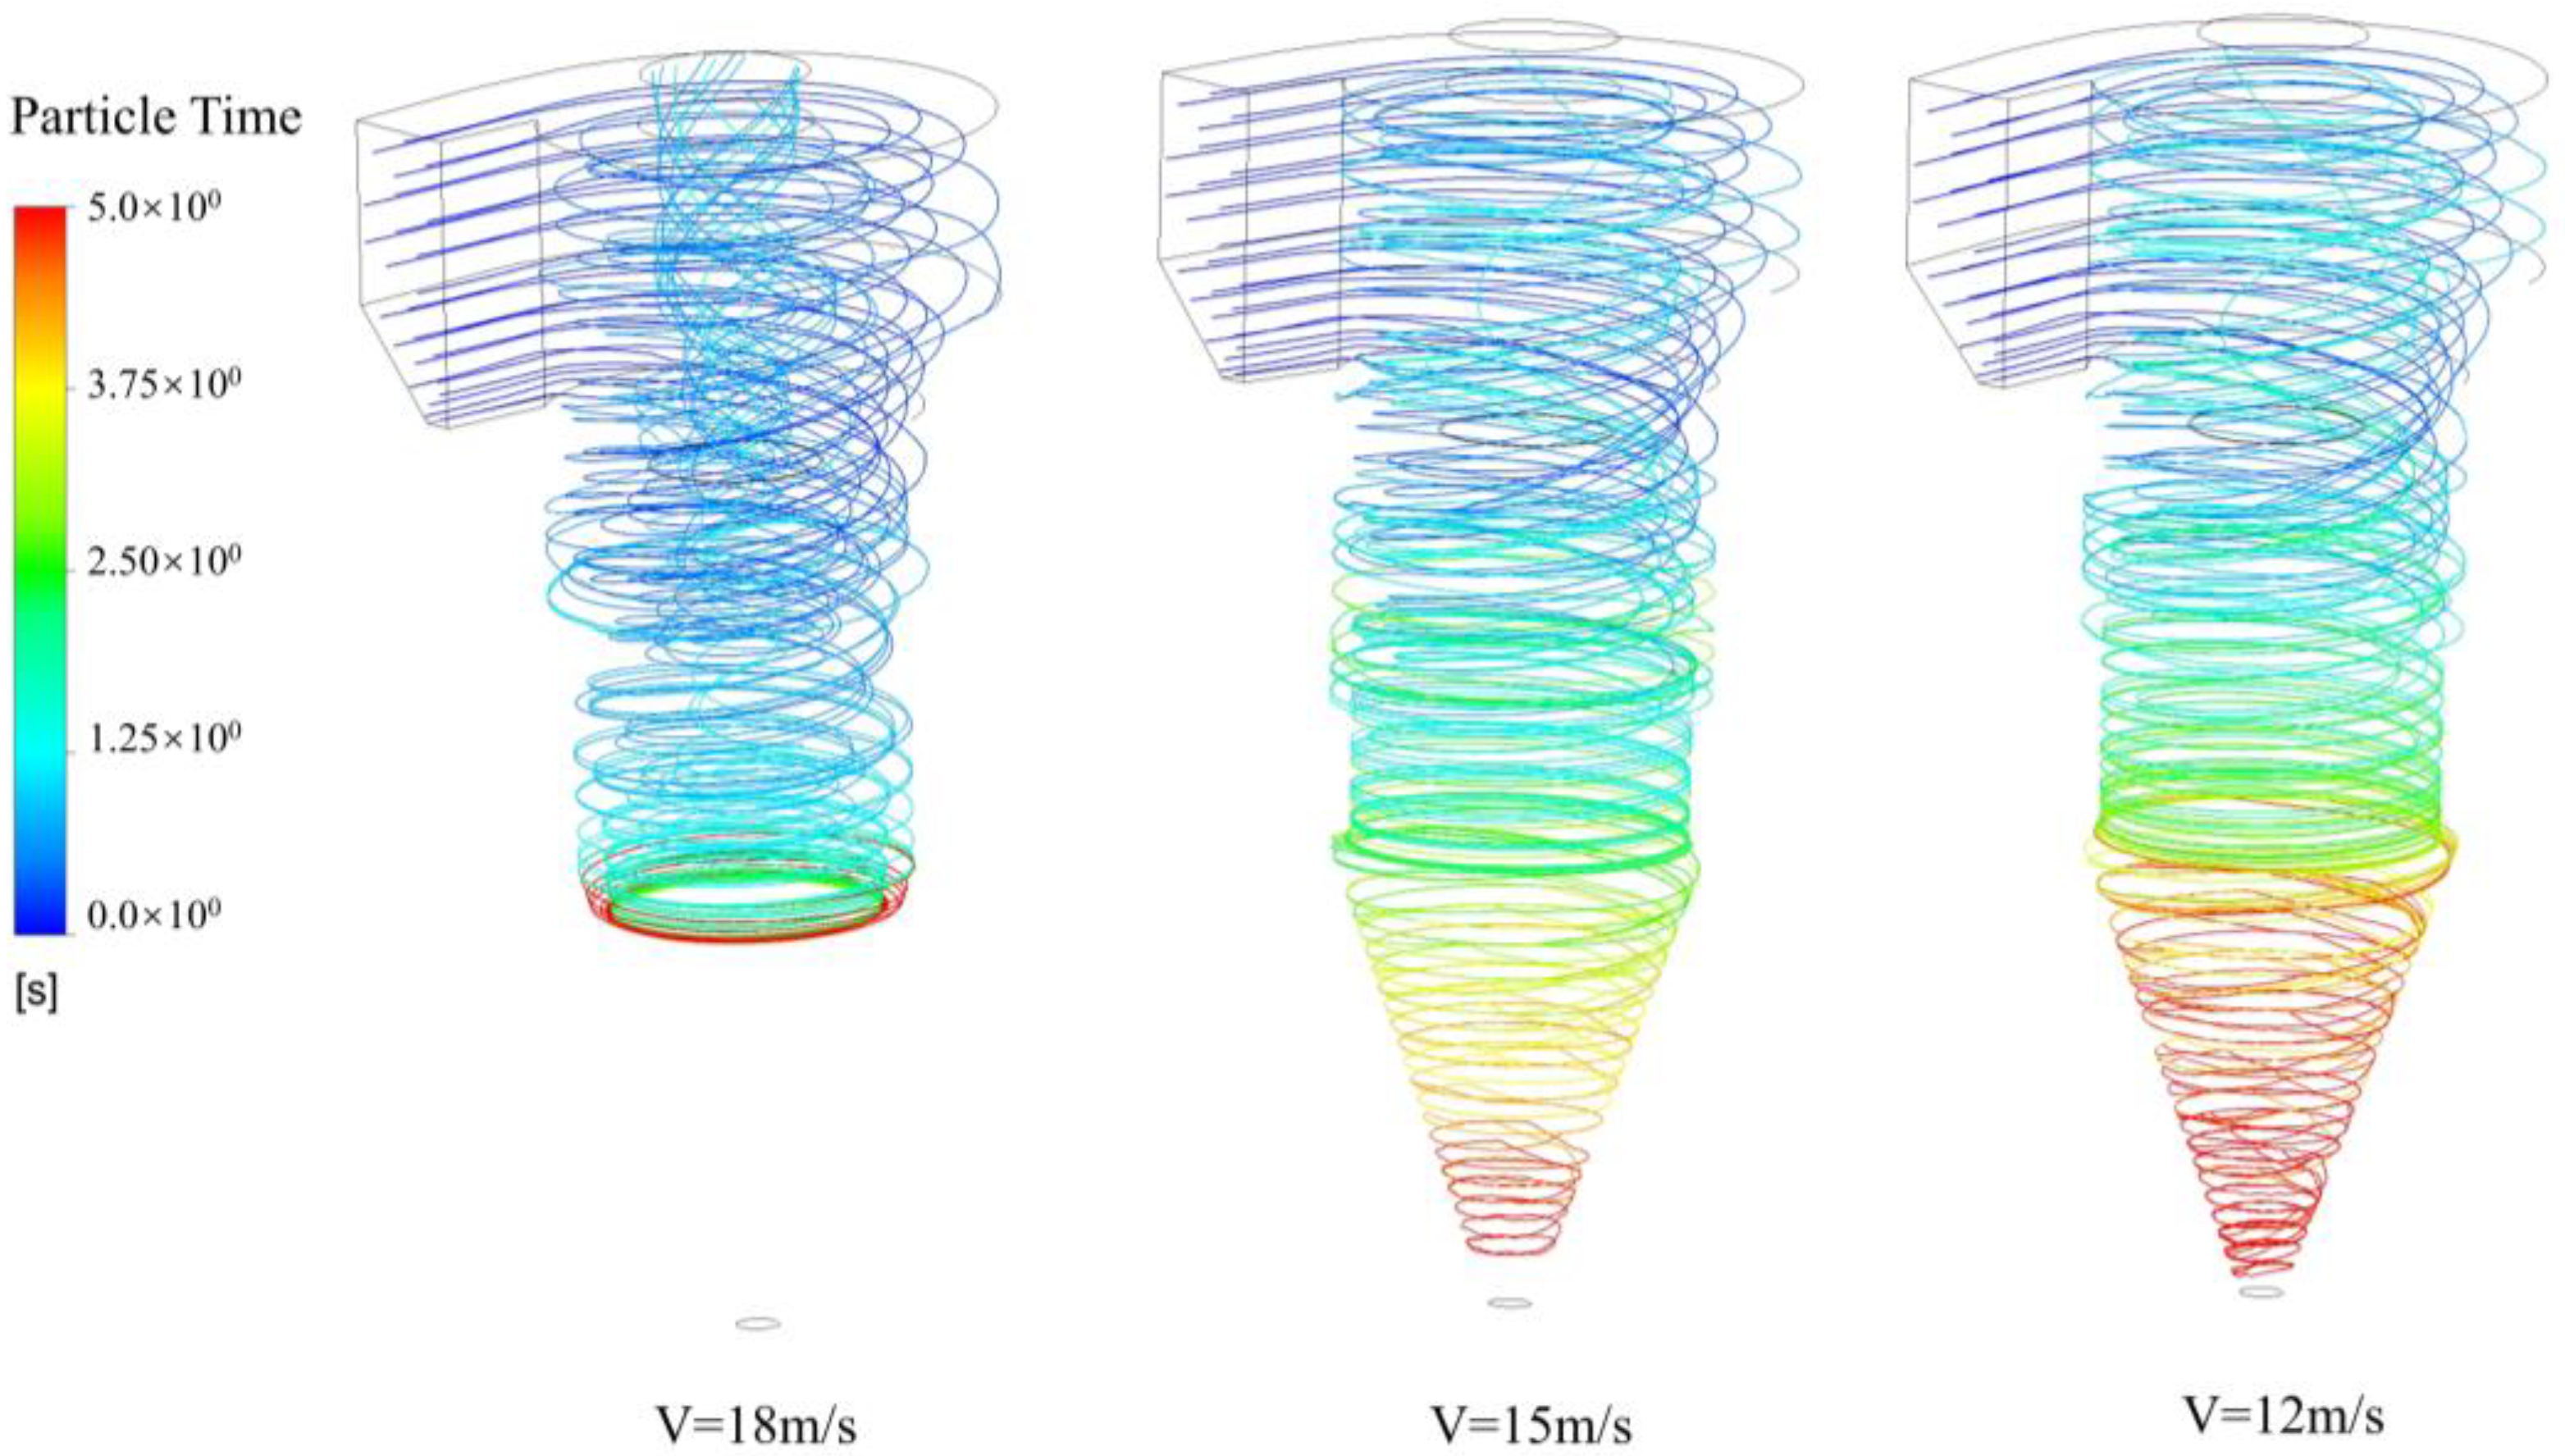
Figure 8 and Figure 9 show the trajectory and residence time of the solid CaO particles at different inlet velocities, respectively. In Figure 8, the particles at different speeds are in a spiral motion, which, under the action of centrifugal force, are close to the inner wall of the reactor to form a thin layer of particle belt and rotate downward with the airflow to reach the bottom of the cyclone after entering the carbonation reactor. The airflow presents upward rotation at this time, carrying some particles to the flue gas outlet.
By analyzing the movement of the particles at different speeds in Figure 8 and Figure 9, it can be found that in the case of a speed of 18 m/s, the CaO particles stop moving downward and turn back upwards before reaching the cone, when a large number of particles are carried upward by the airflow and escape from the outlet, and cannot be trapped at the dust outlet as usual. When the speed is 15 m/s, most of the CaO particles continue to move to the bottom of the cone under the action of the cone, where the residence time is linearly distributed, the particles do not accumulate, and the gas-solid separation is realized. When the velocity is 12 m/s, the streamline distribution of the particles is relatively messy, and the residence time in the cone part is the same, which increases the risk of particles being trapped inside the cone. To sum up, the velocity of entrained particles should be moderate, neither extremely large nor extremely small, since the excessive speed will cause particles to fail to achieve gas-solid separation. In contrast, minimal speed will cause particles to gather at the dust outlet and increase the residence time of the particles. Therefore, the optimal running speed was set as 15 m/s in this study.

4.4. Turbulent Kinetic Energy of the Flow Field

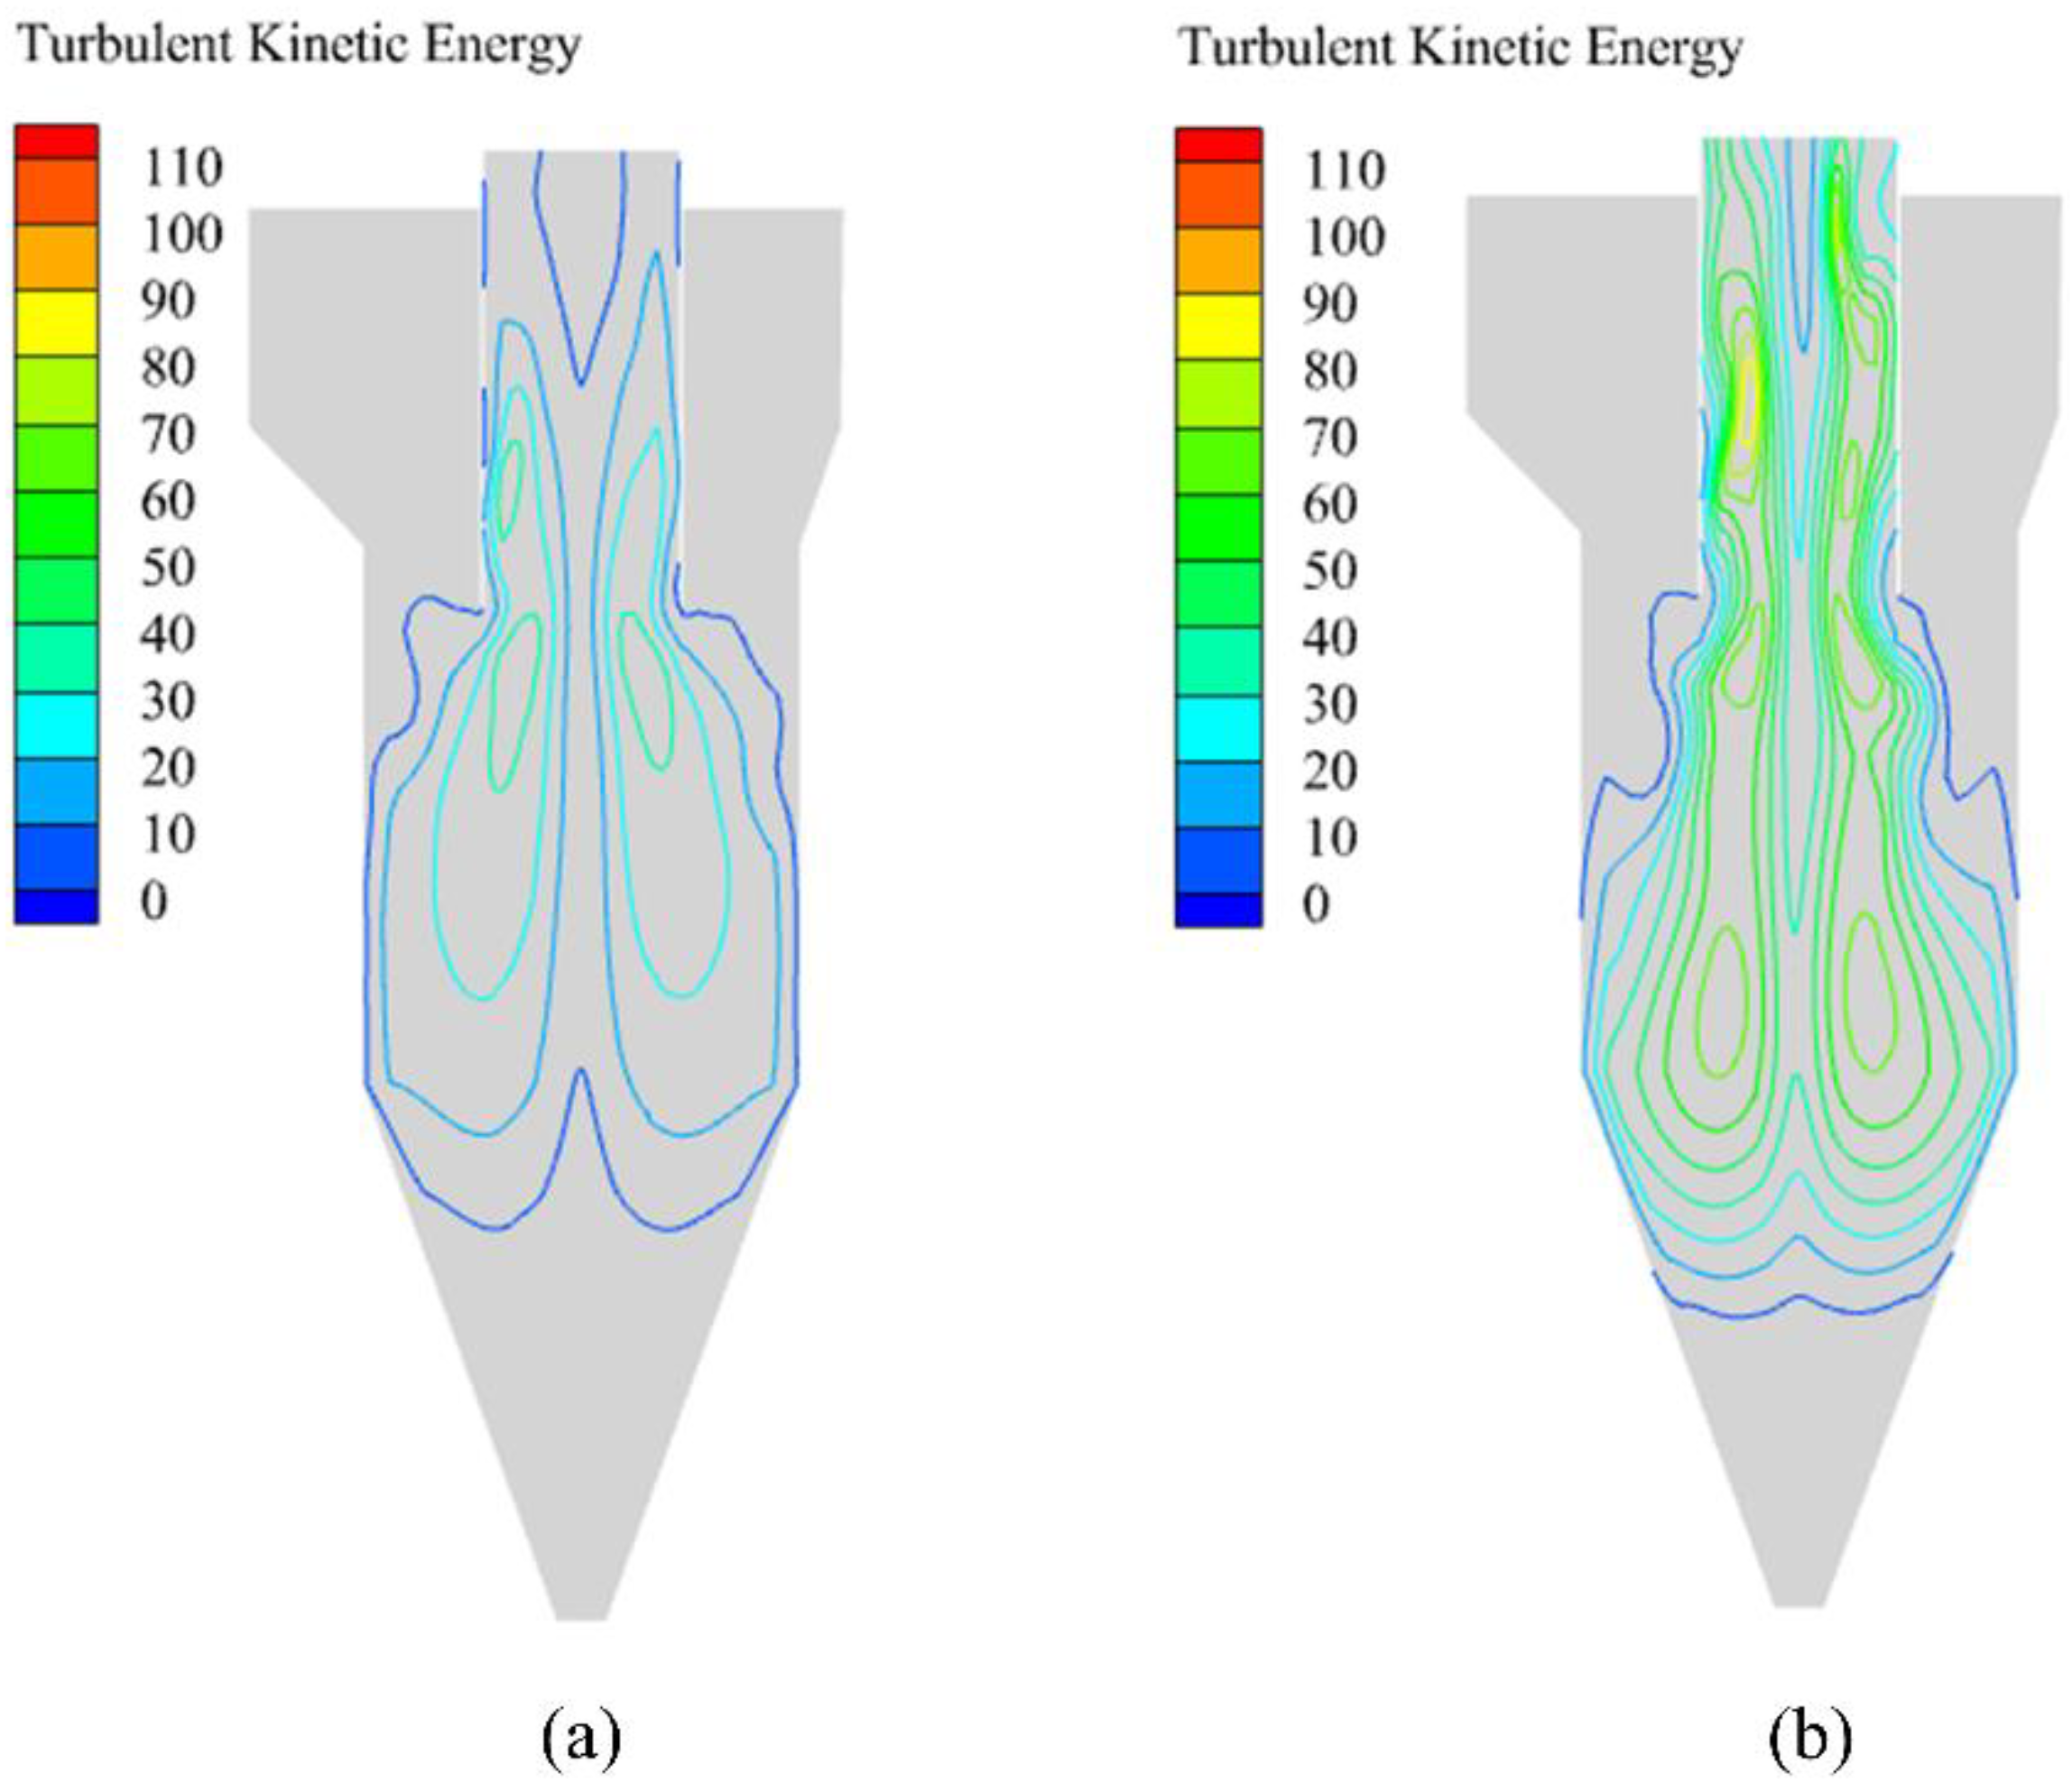
Figure 10 presents the turbulent kinetic energy diagrams in a carbonation reactor. Figure 10a shows the turbulent kinetic energy diagram in the gas phase, and Figure 10b shows the turbulent kinetic energy diagram after the addition of the CaO particles (2.27 kg/s). The turbulent kinetic energy is relatively small at the wall and central area of the reactor but relatively large at the bottom area of the inner cylinder, indicating the most vital turbulent airflow in this area. The turbulent kinetic energy of the turbulent flow in the cylindrical part is symmetrically distributed; the lower the axial direction is, the smaller the turbulent kinetic energy becomes, or even no turbulent flow phenomenon will be observed. Comparing Figure 10a,b, it can be seen that the addition of the CaO particles leads to an increase in the turbulence intensity of the carbonation reactor. The phenomenon of turbulence is subject to both advantages and disadvantages. On the one hand, it strengthens the transfer and reaction process, while on the other, frictional resistance and energy loss are greatly increased. According to the above analysis of the turbulence phenomenon, it can be obtained that the carbonation inversion is relatively intense in the inner cylinder and cylinder parts. However, the addition of particles will lead to an increase in turbulence intensity, which in turn leads to easy wear in the inner cylinder part. Therefore, the turbulent kinetic energy size should be controlled reasonably.

4.5. Analysis of the Separation Efficiency

When the dust-laden airflow moves, the dust gives the airflow a force that can locally change the movement state of the airflow, i.e., the resistance of the gas. At the same time, the airflow also gives the dust a reaction force of equal size, known as the power of the dust. The size of this resistance determines the resistance loss of the cyclone, while that of the power directly affects the recovery rate of the dust.
The separation efficiency of the carbonation reactor matters considerably for the collection of reaction products. The airflow in the carbonation reactor rotates downward at high speeds to reduce the pressure at the top, causing part of the airflow to carry fine dust particles and rotate downward along the outer wall of the exhaust pipe to be discharged from the exhaust pipe. As a result, the separation efficiency of the carbonation reactor cannot be maintained at 100%. The calculation formula and results of the separation efficiency are as follows:
η = 1 S o S i × 100 %
where, η is the separation efficiency, S o is the dust outflow at the dust outlet (kg/s), and S i is the dust inflow at the inlet (kg/s).
According to the simulation results, S o = 2.29   kg / s , S i = 2.47   kg / s , and the separation efficiency of the carbonation reactor is 92.5%. A high separation efficiency can effectively reduce the amount of fly ash and ensure the collection of most of the calcium carbonate produced from the reaction.

4.6. Verification of Carbonation Reactor Decarbonization Efficiency under Initial Conditions

Under the initial reaction conditions with a reactor temperature of 911 K, a CO2 concentration of 0.28 in the flue gas, and a CaO addition rate of 2.27 kg/s, the mass fraction of CO2 at the flue gas inlet is 0.28 and the mass fraction of CaO is 0.31. The simulation results after the carbonation reaction show that the content of CaO in the flue gas outlet and dust outlet is zero, indicating that all the CaO has participated in the reaction. The average mass fraction of the calcium carbonate at the dust outlet surface is 0.56. The average mass fraction of the CO2 at the flue gas outlet surface is 0.021, indicating that the mass fraction of the CO2 participating in the reaction in the flue gas is 0.259.
To verify the reliability of the carbon removal efficiency, the stoichiometric ratio of reactants and products can be calculated using chemical reaction relationships. In the carbonation reaction, the chemical stoichiometric relationship between CaO, CO2, and CaCO3 is 1:1:1; 1 mol of CaO reacts with 1 mol of CO2 to produce 1 mol of CaCO3. The molar mass of CaO is 56.08 g/mol, the molar mass of CO2 is 44 g/mol, and the molar mass of CaCO3 is 100.09 g/mol. Therefore, the mass ratio of reactants and products can be expressed as follows:
m C a O : m C O 2 : m C a C O 3 = M C a O : M C O 2 : M C a C O 3 = 56.08 : 44 : 100.09
According to the above calculation, the mass ratio of CaO to CO2 in the carbonation reaction is 1.28, and the mass ratio of CO2 to CaCO3 is 0.44. The numerical simulation results show that under the initial conditions, the mass fraction ratio of CaO and CO2 undergoing carbonation reaction is 0.31/0.259 = 1.2, with an error of 6% compared to the actual mass ratio, and the mass fraction ratio of CO2 and CaCO3 is 0.259/0.56 = 0.46, with an error of 5% compared to the actual mass ratio. The slight difference between the numerical simulation results and the calculated values based on the chemical reactions indicates a high degree of consistency, suggesting that the carbonation reaction occurring inside the reactor proceeds as expected.

4.7. Analysis of Factors Influencing Carbon Removal Efficiency of Carbonation Reactors

4.7.1. Effect of Different Temperatures on the Carbon Removal Efficiency of the Carbonation Reactor

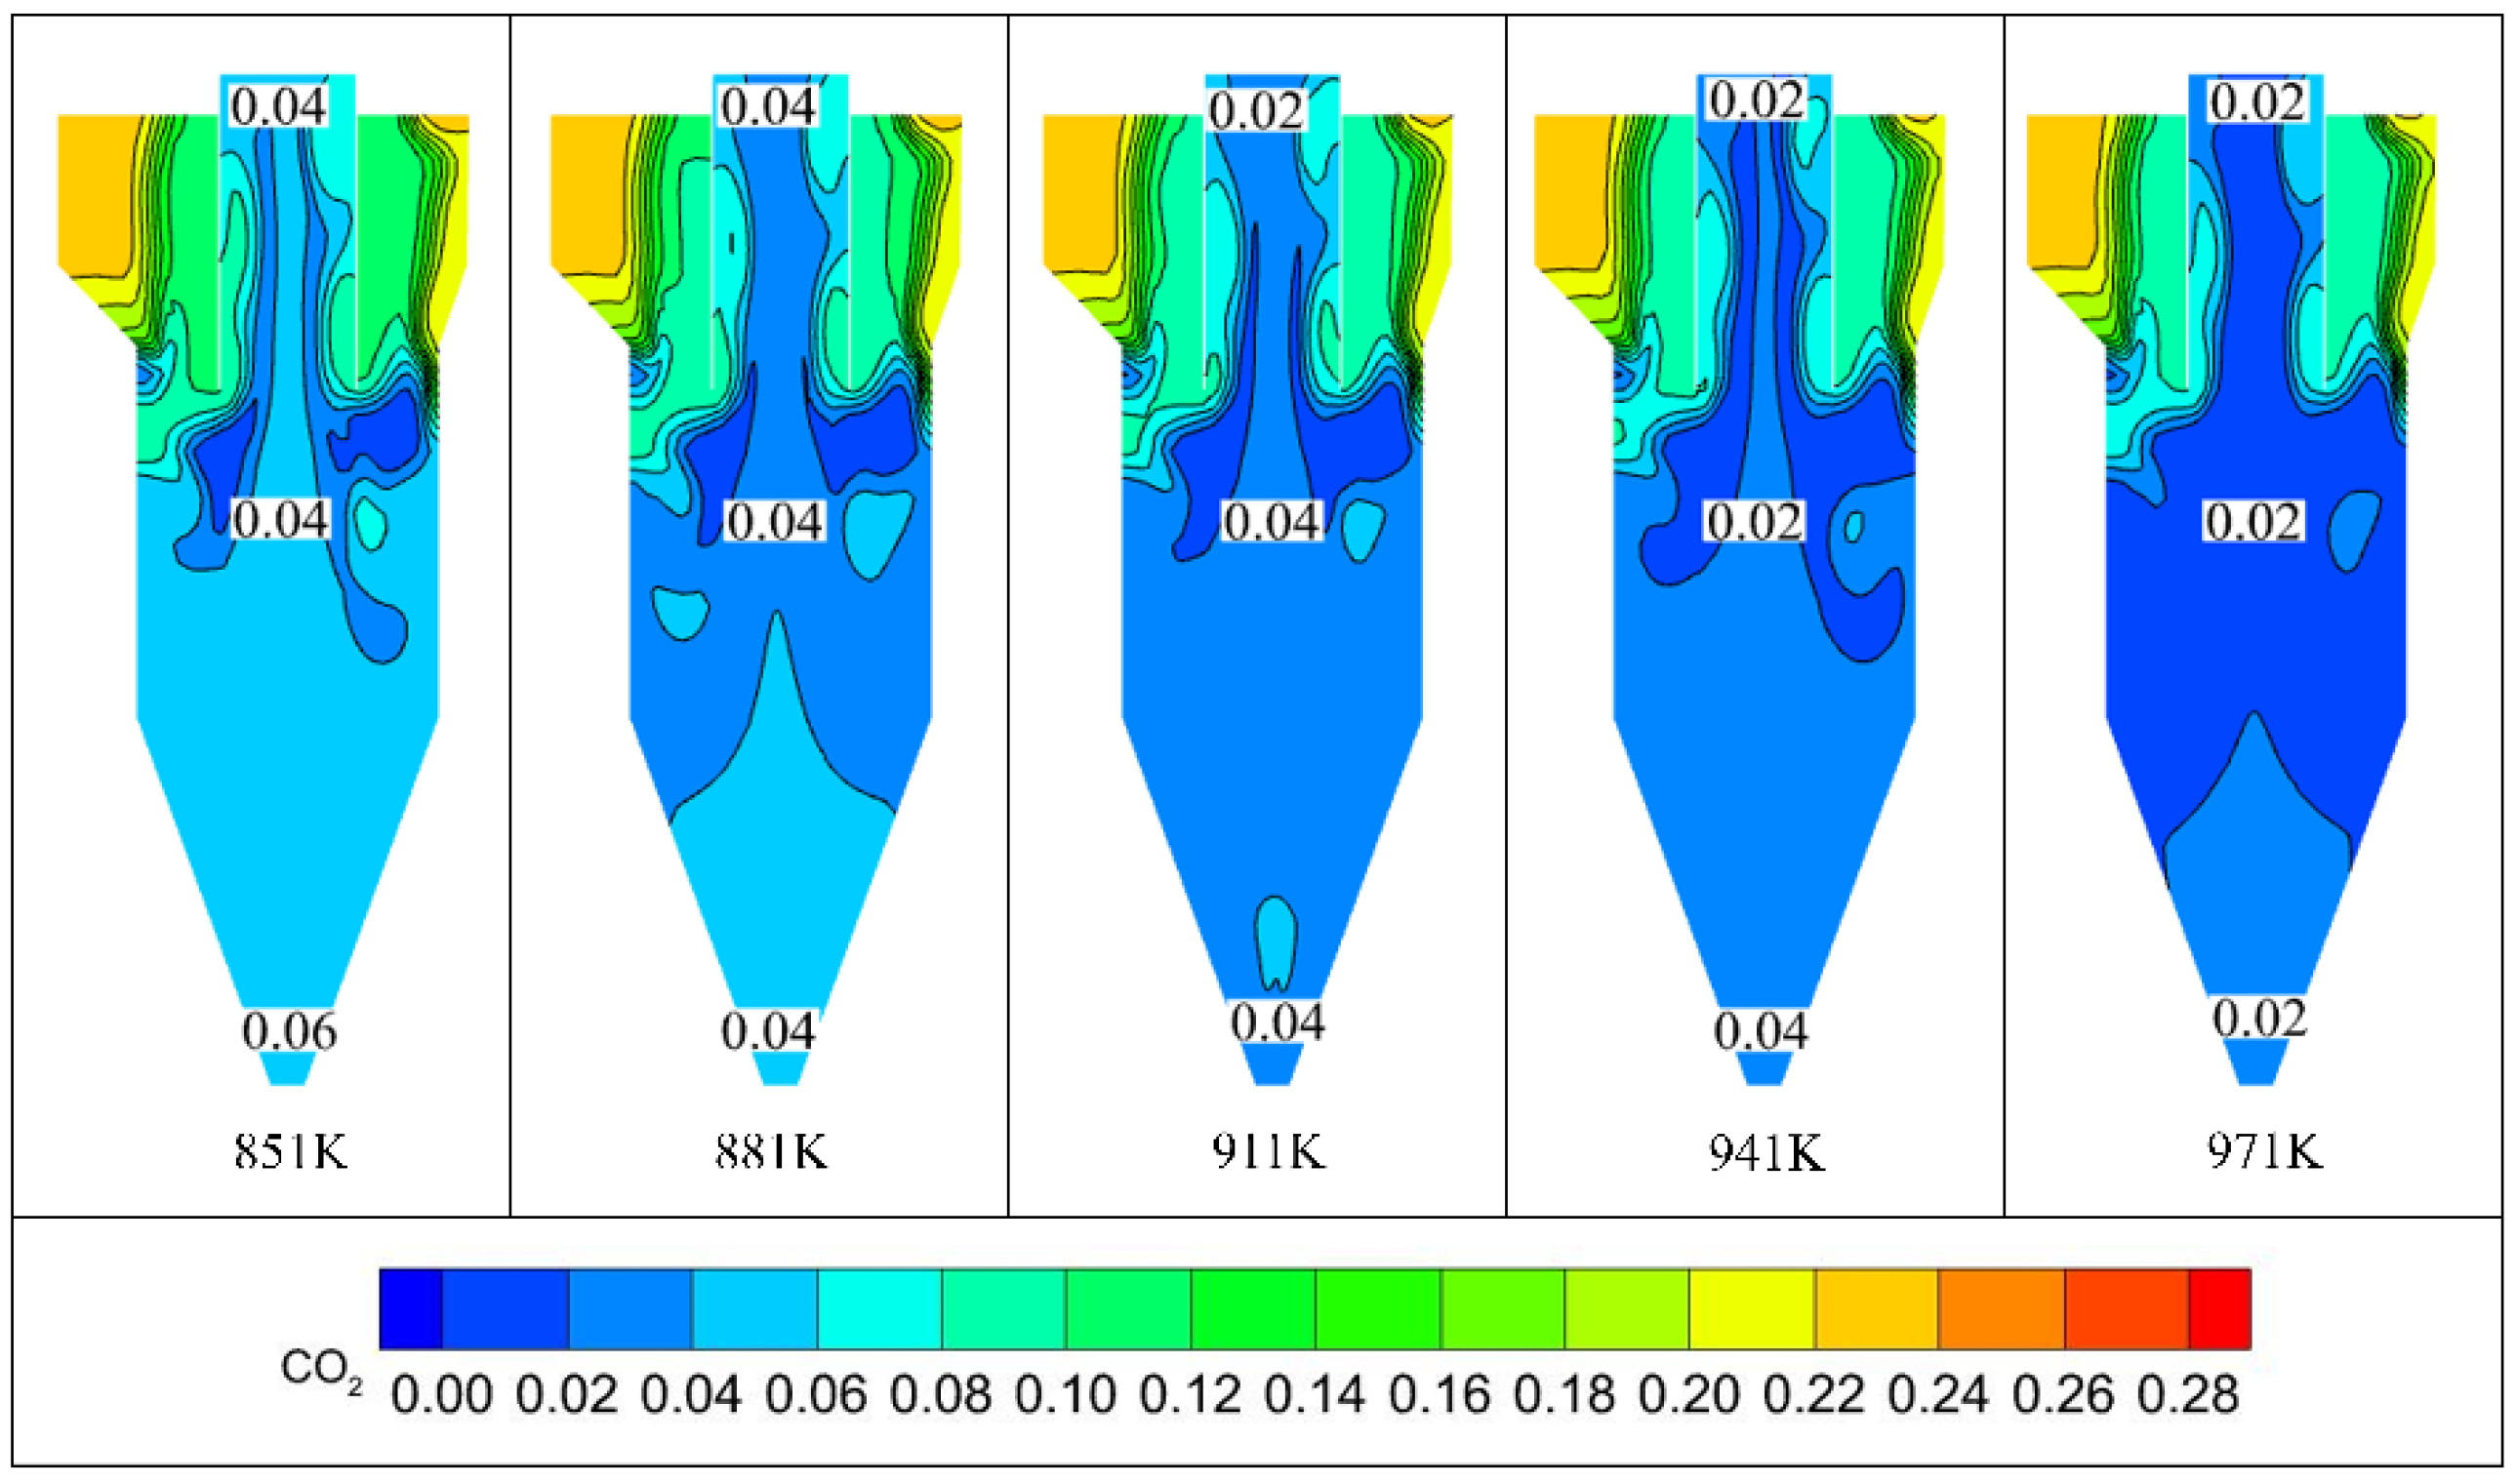
The CO2 fraction of the carbonation reactor at different temperatures on the XY cross-section is shown in Figure 11. The initial parameters of the reaction were set as follows: The mass flow rate of the added CaO was 2.07 kg/s and the volume fraction of CO2 was 0.8. As can be seen from Figure 11, the CO2 concentration in the reactor gradually decreased with the increase of the reaction temperature. When the temperature is 851 K and 881 K, the volume fraction of carbon dioxide out of the reactor is 0.04. When the temperature is 911 K, 941 K, and 971 K, the amount of carbon dioxide out of the reactor is 0.02. The increase in reaction temperature leads to a higher conversion rate of CaO, which, in turn, can adsorb more CO2 gas, resulting in a decrease in the concentration of CO2 at the flue gas outlet. This phenomenon is consistent with the experimental characteristics of CaO adsorbing CO2 [33].
As shown in Figure 12, the carbon removal efficiency of the carbonation reactor varies with temperature. The carbon removal efficiency is calculated from the surface average CO2 concentration at the flue gas inlet and outlet. From Figure 12, it can be obtained that the carbon removal efficiency of the carbonation reactor increases gradually with the temperature increase. When the temperature is greater than or equal to 911 K, the carbon removal efficiency of the carbonation reactor can reach more than 90%. Considering the carbon removal efficiency, the reaction temperature of the carbonation reaction can be chosen to be greater than or equal to 911 K. However, in actual production, it is necessary to consider the cost. Although the increase in temperature can improve the carbon removal efficiency, the increase in temperature requires additional fuel to provide heat, increasing the cost, and the specific value needs to be weighed.

4.7.2. Effect of Different CaO Addition on the Carbon Removal Efficiency of the Carbonation Reactor

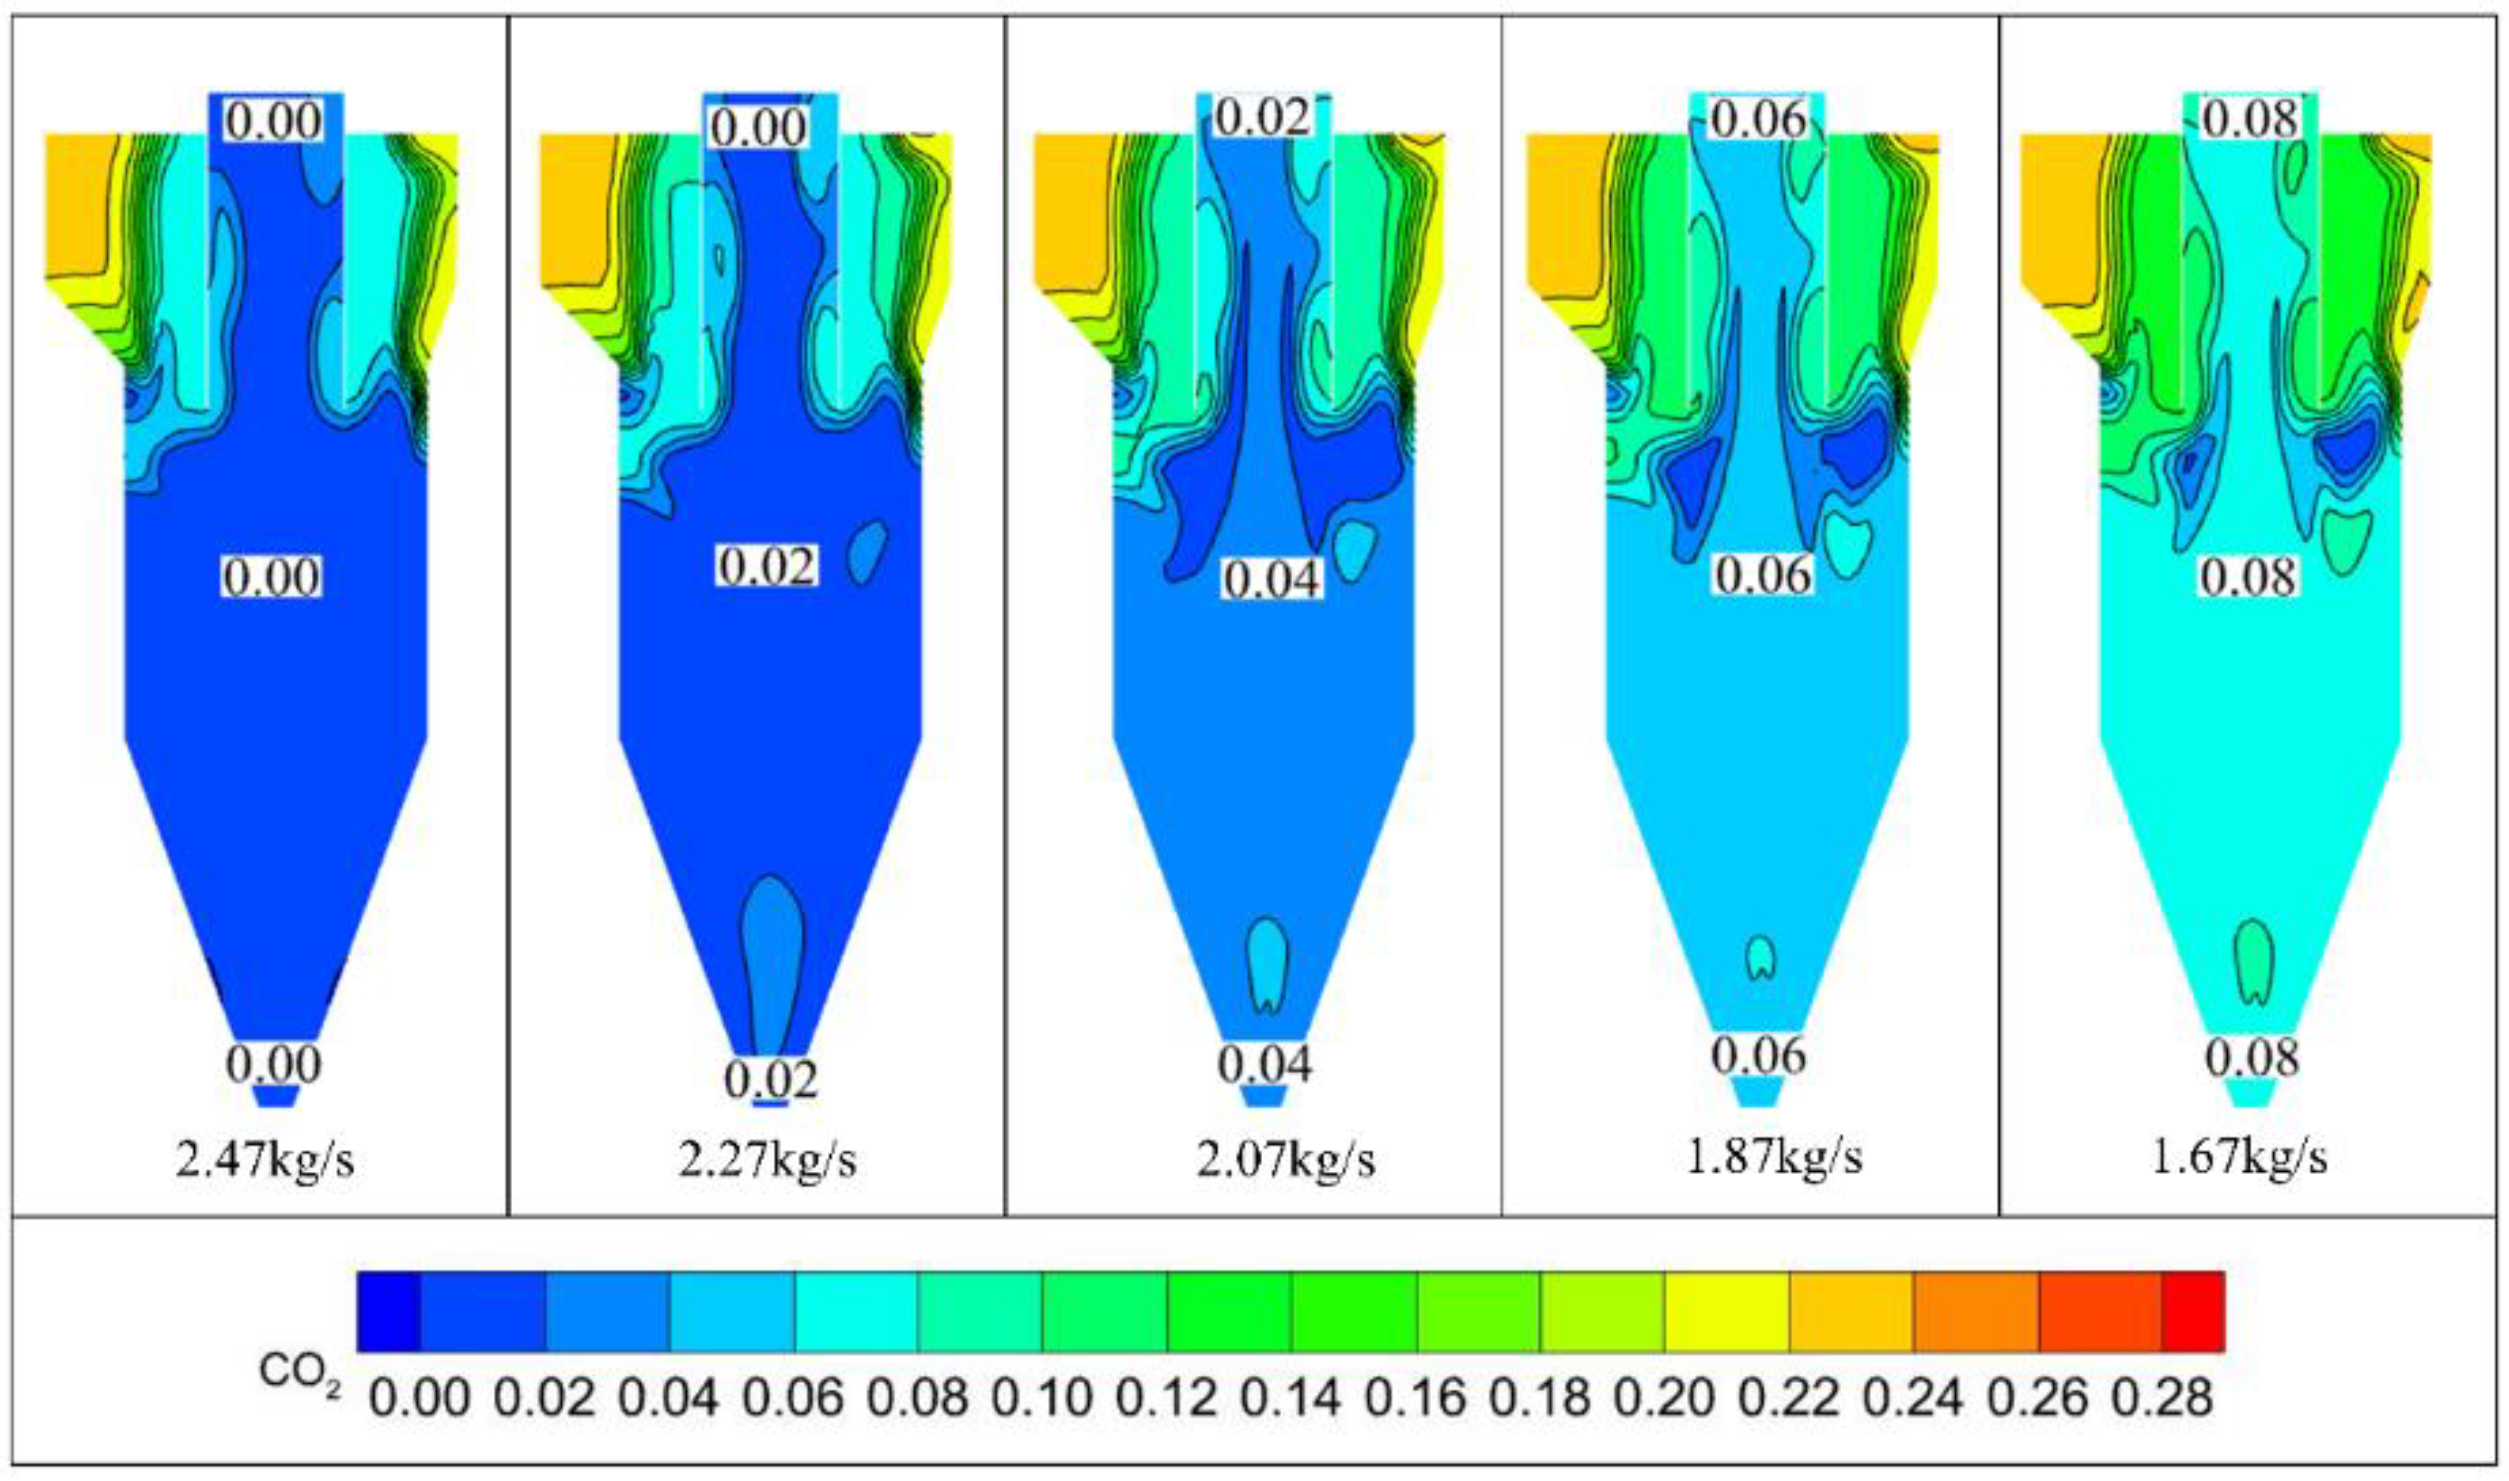
Figure 13 shows the CO2 composition diagram of the carbonation reactor on the XY cross-section under different CaO additions. The initial parameters of the reaction were now set as follows: The reaction temperature is 911 K, and the volume fraction of CO2 is 0.28. It is revealed that with the increase in CaO addition, the concentration of carbon dioxide in the reactor decreases gradually. The outlet volume fraction of CO2 is as low as zero in the case of a CaO mass flow rate of 2.47 kg/s and 2.27 kg/s. The amount of removed CO2 is 0.02, 0.06, and 0.08 when the CaO mass flow rate is 2.07 kg/s, 1.87 kg/s, and 1.67 kg/s, respectively, indicating that more CO2 can be absorbed by increasing the amount of added CaO. As the amount of the adsorbent CaO increases, according to the chemical reaction equilibrium law, more CO2 can be adsorbed, resulting in a lower concentration of CO2 at the flue gas outlet.
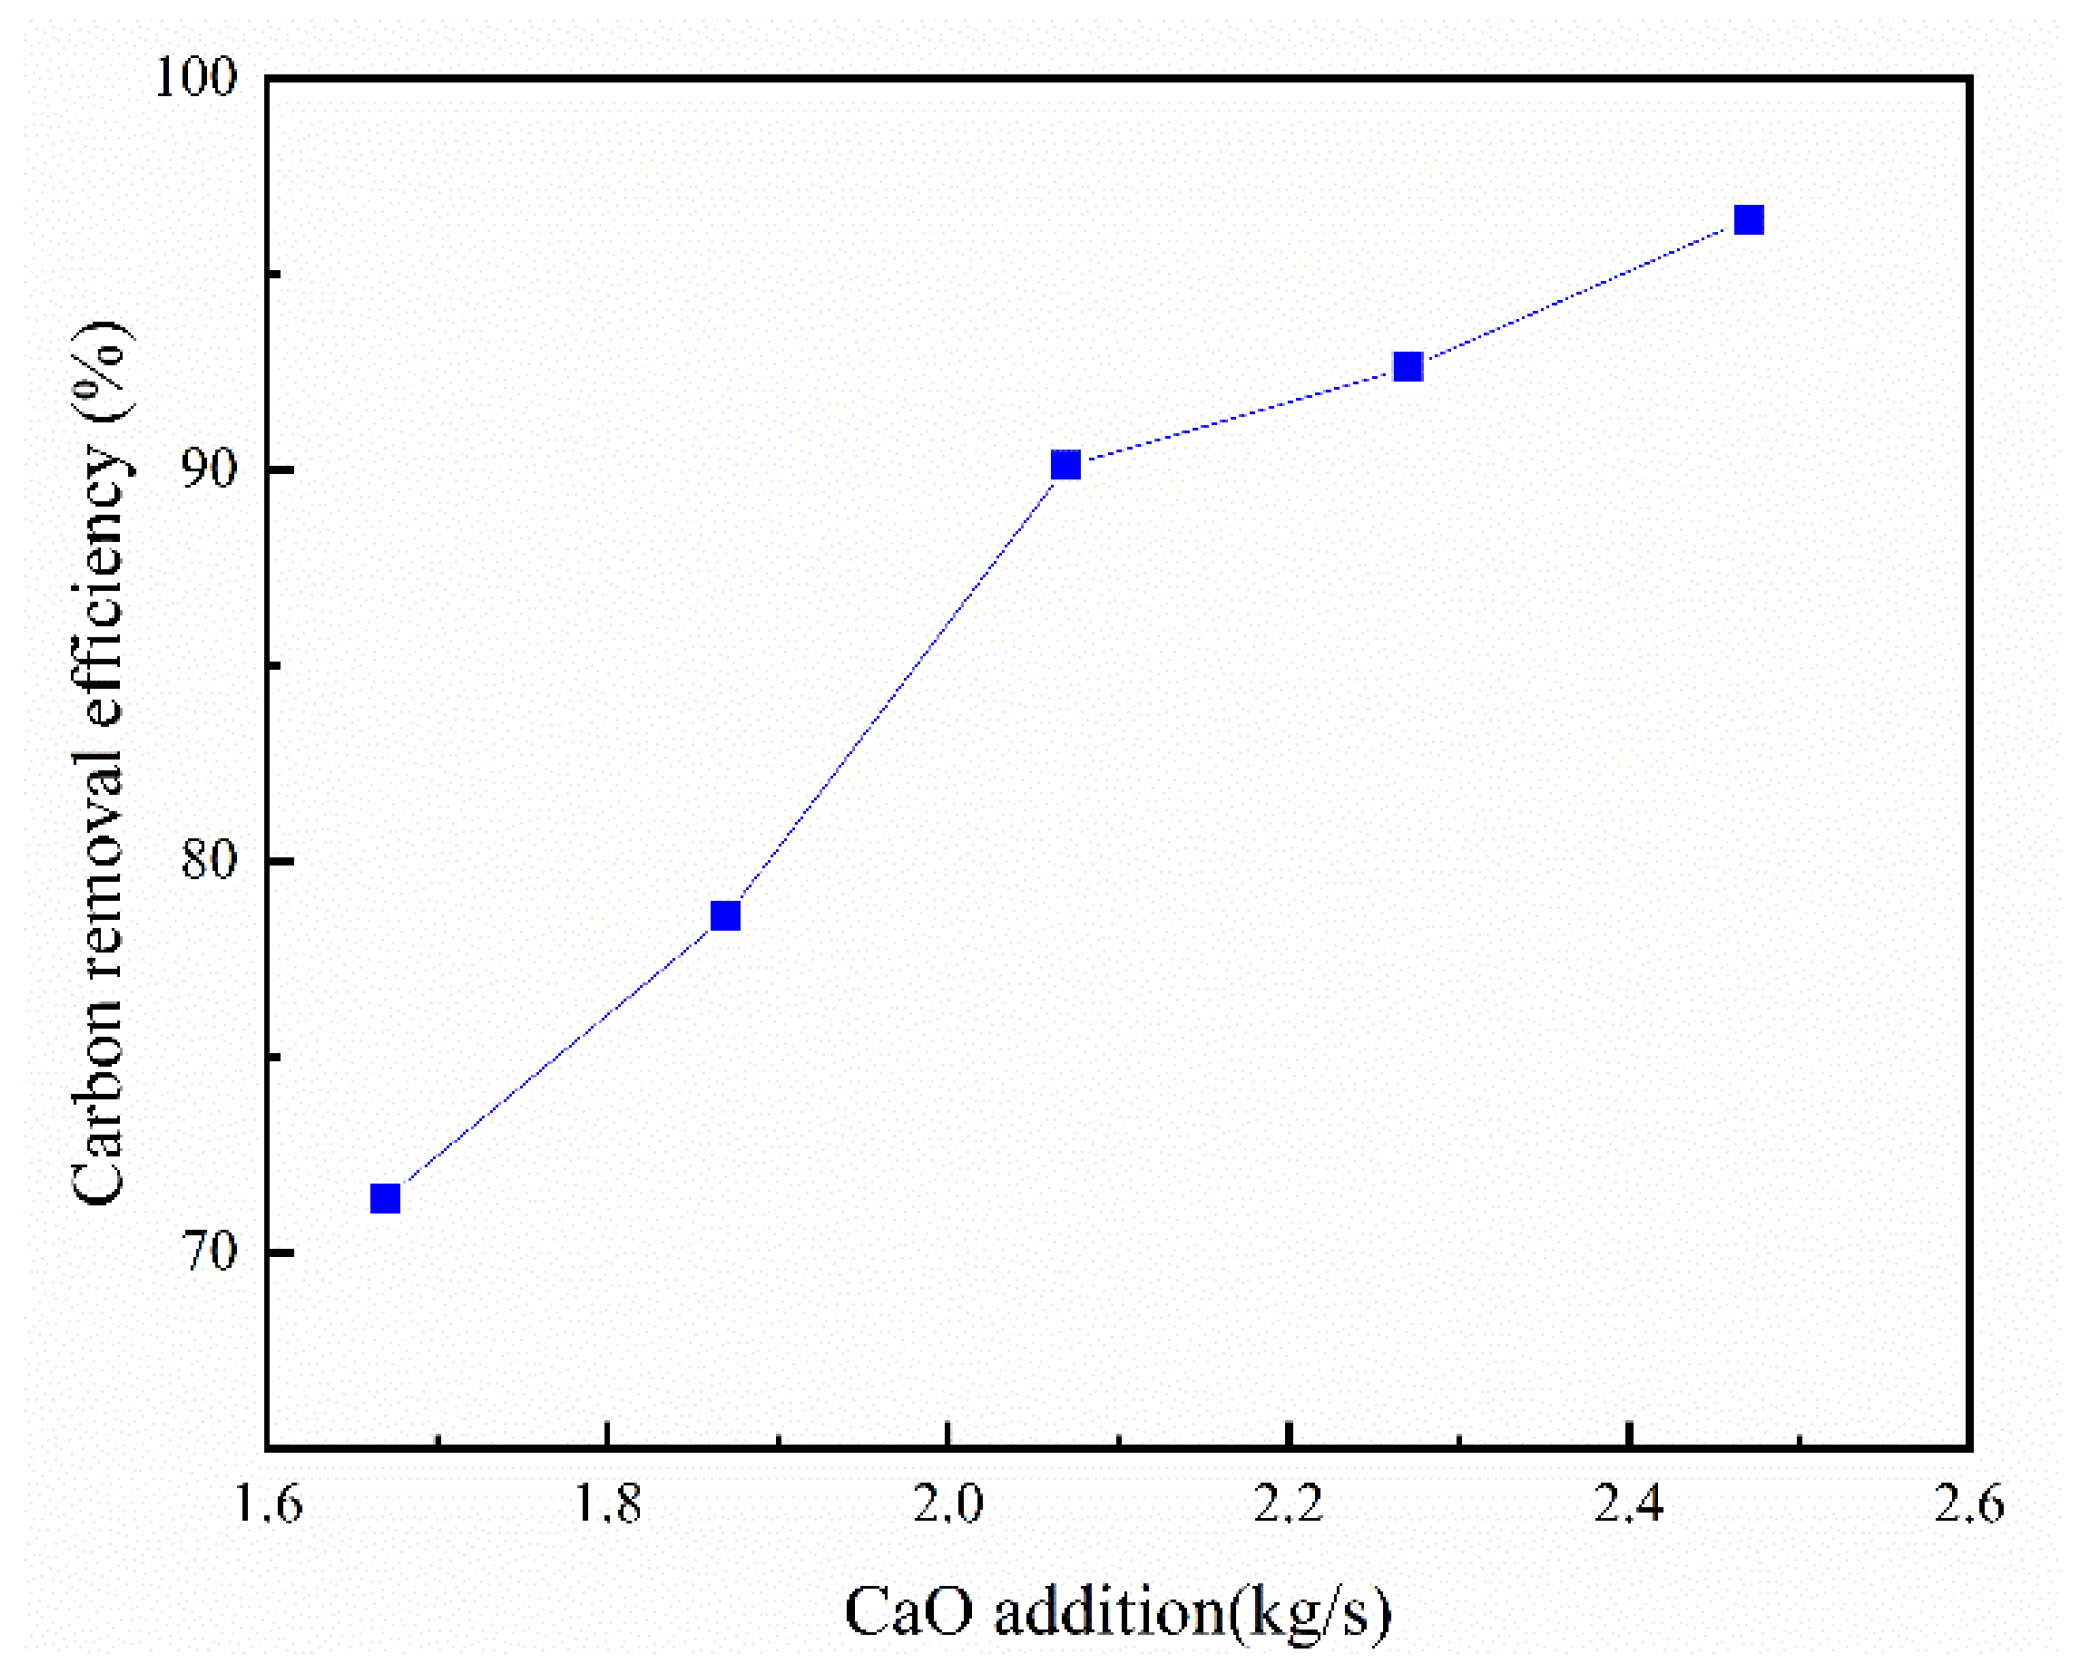
The carbon removal efficiency of the carbonation reactor varies with the amount of added CaO, as shown in Figure 14, where it can be observed that the carbon removal efficiency of the carbonation reactor gradually increases with the increase in the CaO addition. When the CaO addition amount is 2.07 kg/s and above, the carbon removal efficiency of the carbonation reactor can reach more than 90%. Therefore, considering the carbon removal efficiency, the CaO addition amount of 2.07 kg/s and above could be chosen. However, the active CaO used in this paper was taken from the C5 down-feed pipe. The amount should be manageable, so the specific value should be decided according to the situation.

4.7.3. Effect of Different CO2 Volume Fraction on the Carbon Removal Efficiency of Carbonation Reactor

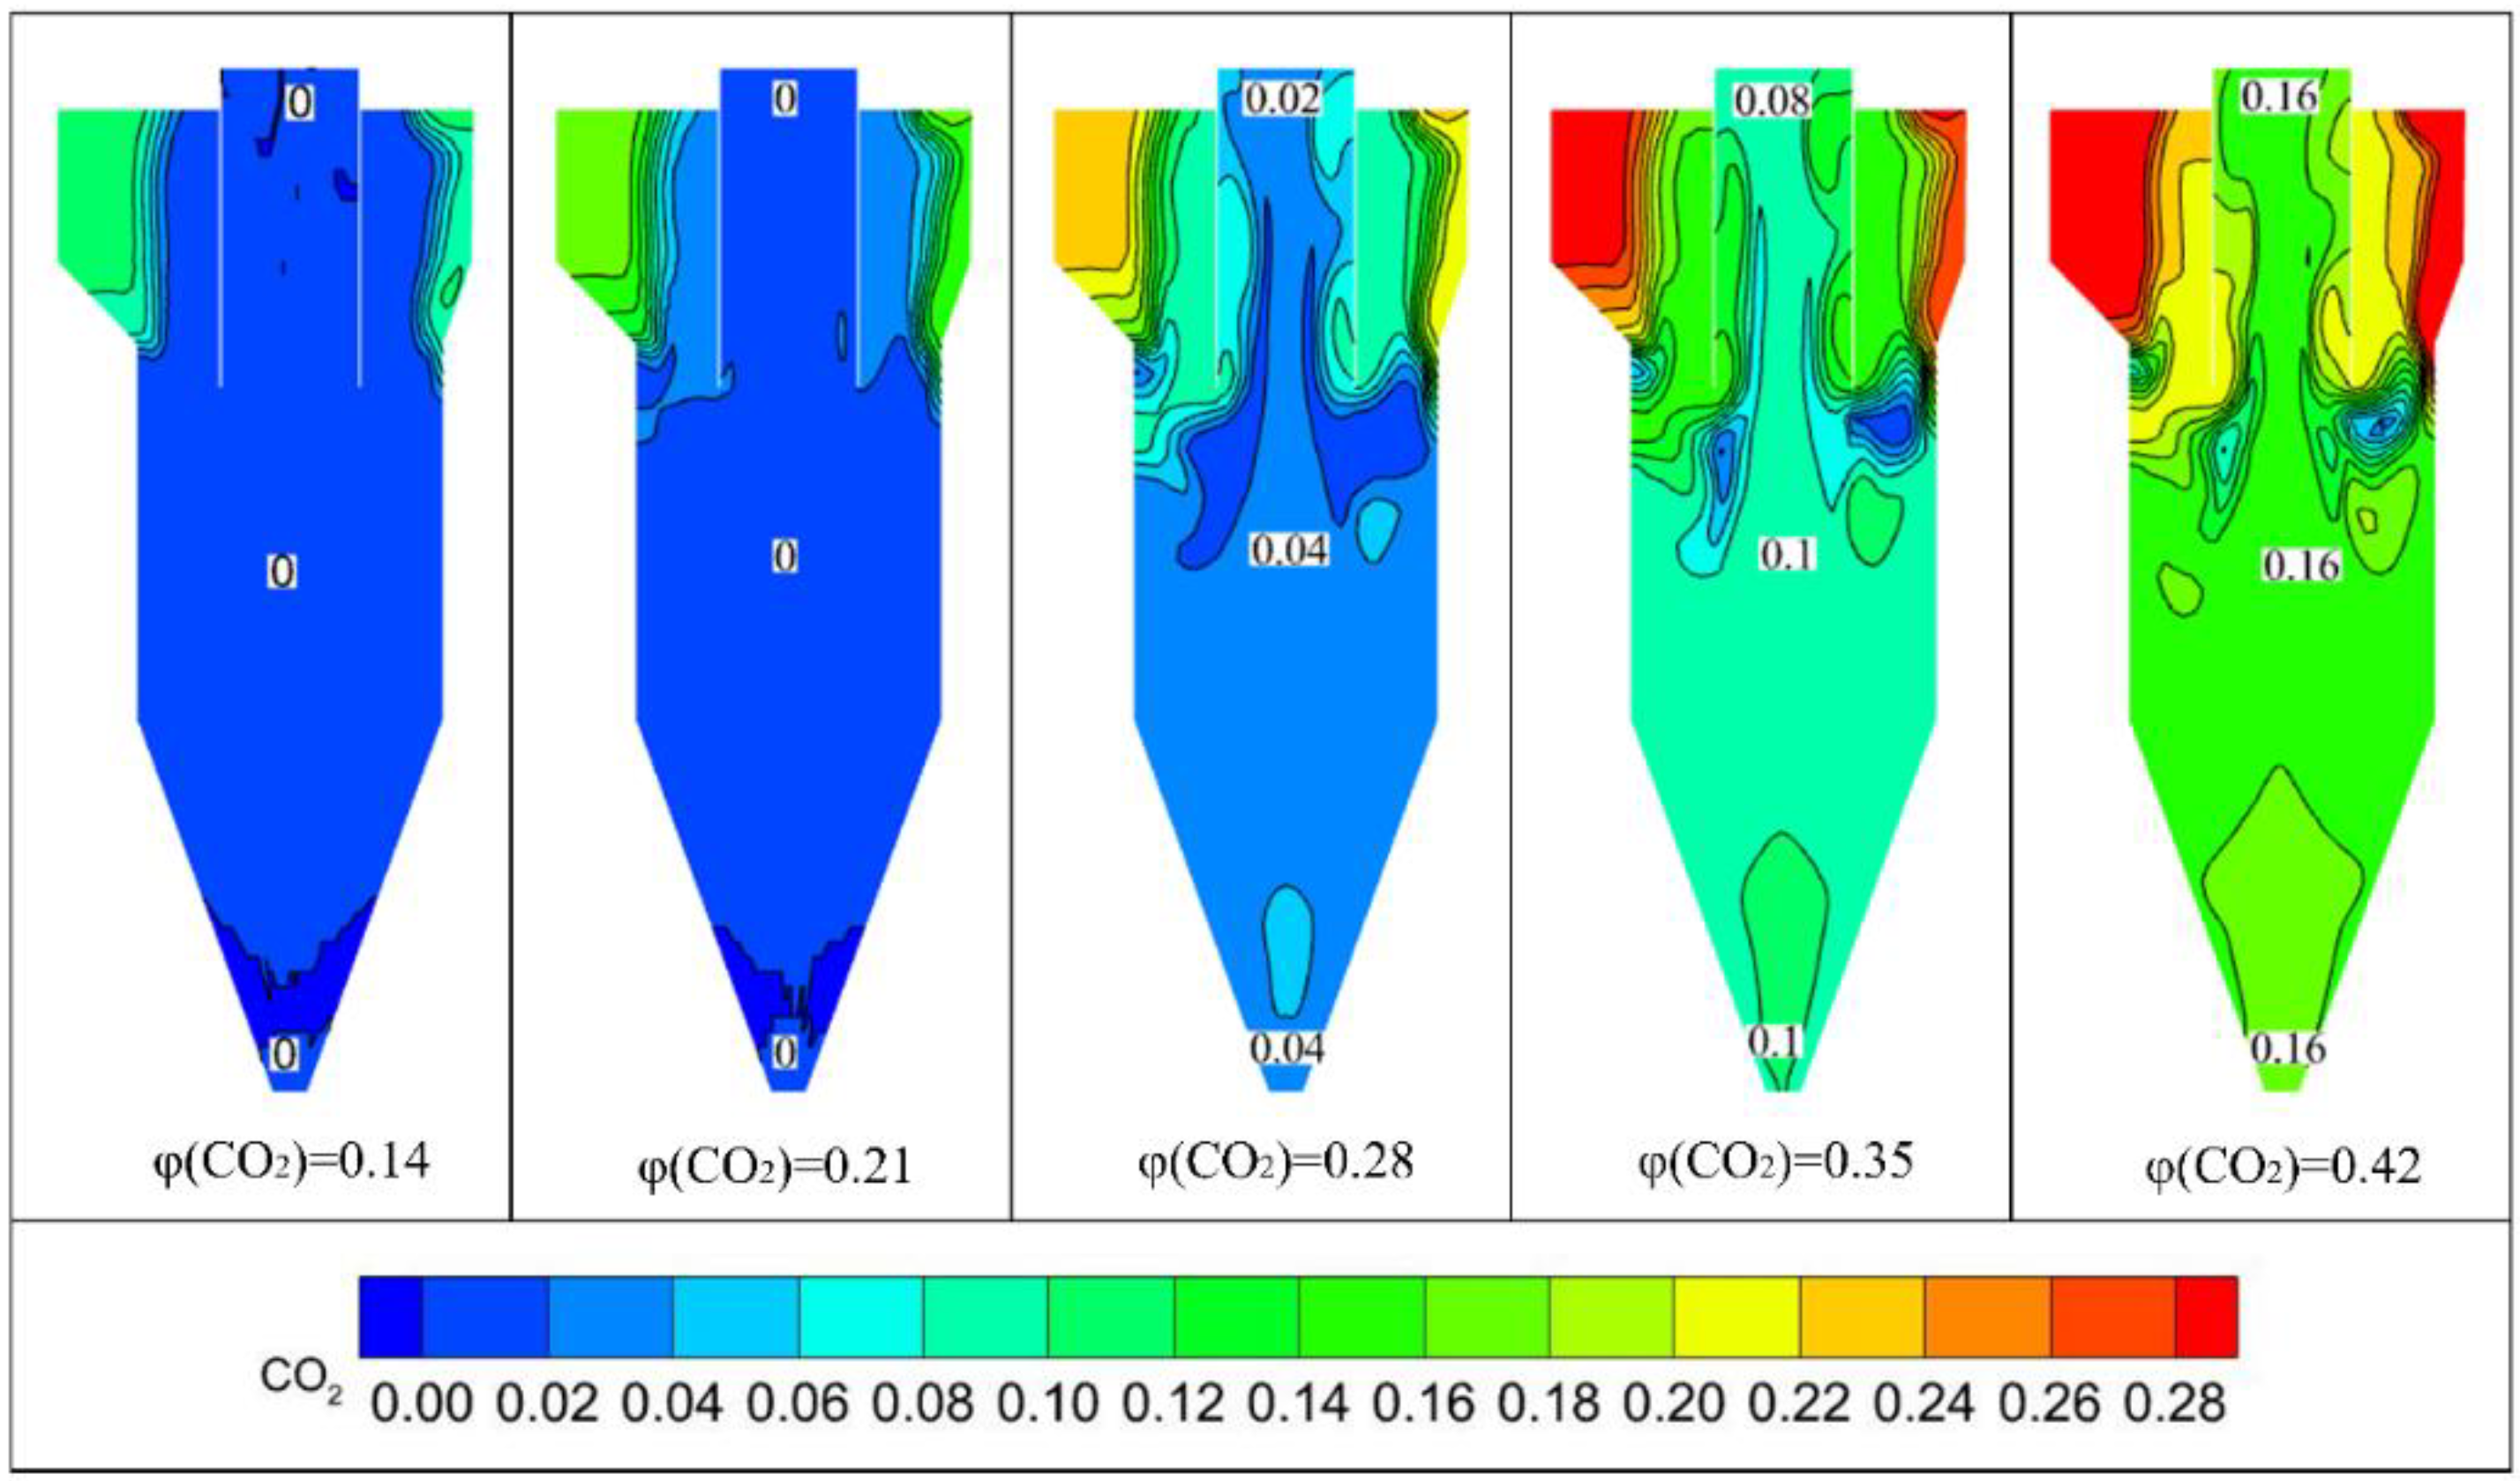
Figure 15 is the CO2 composition diagram of the carbonation reactor at the XY cross-section under different CO2 volume fractions. The initial parameters of the reaction include a temperature of 911 K and a CaO mass flow rate of 2.07 kg/s. As shown in the figure, when the CO2 volume fraction at the inlet is 0.14 and 0.21, the carbon dioxide volume fraction at the carbonation reactor outlet is 0, while in the case of a CO2 volume fraction at the inlet of 0.28, 0.35, and 0.42, the volume fractions of carbon dioxide are 0.02, 0.08 and 0.16, respectively. As the volume fraction of CO2 increases, the added active CaO is insufficient to absorb more CO2, leading to a high concentration of CO2 at the flue gas outlet. This phenomenon is caused by the inappropriate ratio of the two reactants. Therefore, the volume fraction of CO2 should be proportional to the amount of CaO added.
As shown in Figure 16, the carbon removal efficiency of the carbonation reactor varies with the volume fraction of CO2. Specifically, the carbon removal efficiency of the carbonation reactor gradually decreases with the increase in the CO2 volume fraction, which can reach 100% when the volume fraction of the CO2 is 0.14 and 0.21. In contrast, in the case of a CO2 volume fraction of 0.28, the carbon removal efficiency can reach 90%. However, when the CO2 volume fraction is less than 0.28, the carbon removal efficiency becomes relatively low. Therefore, to ensure removal efficiency, the volume fraction of CO2 should not be extremely large. The effect of changes in the CO2 volume fraction on the carbon removal efficiency is also related to the addition of the adsorbent CaO.
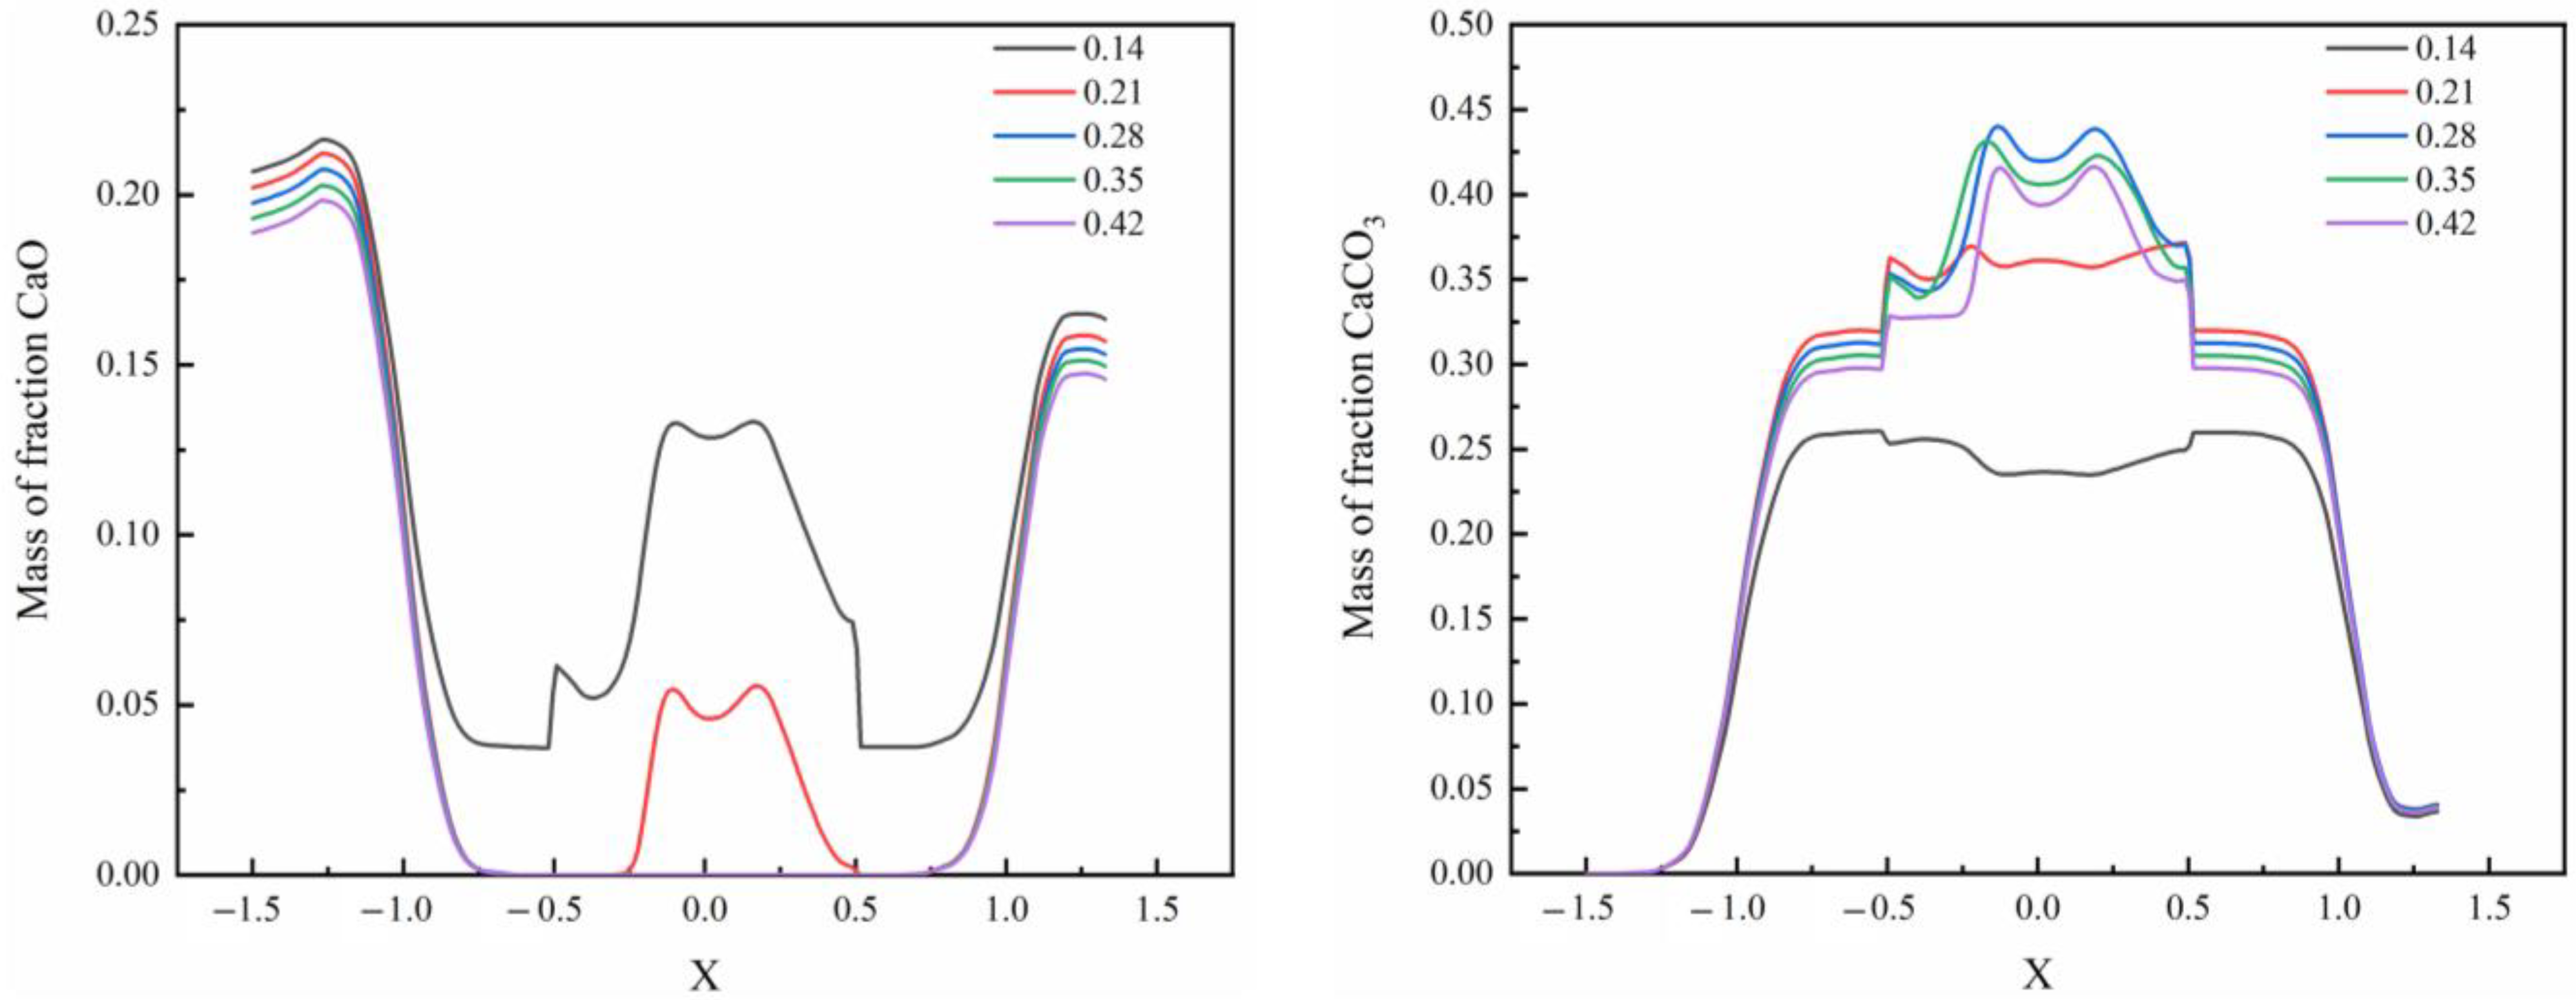
Figure 17 shows the changes in the CaO and CaCO3 along the X-axis at the intersection of the Y = 6.13 and Z = 0 lines for different CO2 concentrations. In the figure, when the CO2 content in the flue gas is 0.14 and 0.21, there is still some unreacted CaO in the inner cylinder. When the CO2 content is 0.28, the highest amount of CaCO3 is generated. However, although the CO2 concentration continues to increase afterward, the amount of CaCO3 generated no longer increases. This is because the chemical reaction reaches equilibrium when the CO2 concentration in the flue gas is 0.28. Even though the CO2 concentration increases, there are no longer sufficient amounts of CaO adsorbents added to the system to continue the reaction.
In summary, when the temperature is 911 K, the addition of CaO is 2.07 kg/s, and the CO2 volume fraction is 0.28, the chemical reaction reaches equilibrium, and the carbon removal efficiency reaches 90%. Compared with similar research [22], the carbon capture efficiency of the carbonation reactor has been improved under the condition of a gas-solid reaction equilibrium. When the carbon removal efficiency reaches 90%, the carbonation reactor has a good carbon removal function. Although increasing the temperature can improve carbon removal efficiency, it also leads to increased energy consumption. The temperature of the carbonation reactor is determined by the amount of coal powder added to the pre-decomposition kiln system. The coal used by the cement plant studied in this paper costs 1722 CNY per ton. Assuming an increase in the reaction temperature by 50 K, the required coal consumption would be 434 kg/h, with an annual economic input of 6.54 million CNY. Since a carbon removal efficiency of 90% already demonstrates excellent carbon removal capabilities, there is no need to increase the economic input further. Therefore, selecting the reaction condition with a carbon removal efficiency of 90% as the optimal condition is reasonable. However, considering the mutual influence of various factors, a full-factor analysis of each factor is needed below.

4.8. Optimal Parameter Analysis

This paper considered three influencing factors, including temperature, CaO addition, and CO2 volume fraction, and three-level values were taken for each factor. Then, a three-factor three-level experiment was required, and 3 3 = 27 combinations of experiments were required for a full-scale experiment, and the number of replicates for each combination was not considered. If the experiment is arranged according to L 9 3 4 orthogonal table, only nine times are required. In L 9 3 4 , L is the code of the orthogonal table, 9 is the number of experiments, 3 is the number of levels, and 4 is the maximum number of factors that can be arranged. Table 6 presents the factor level table.
The simulation design scheme and simulation results are shown in Table 7. A direct comparison of the data in Table 7 shows that simulation experiment nine produces the best results among these nine experiments. This suggests that a reaction temperature of 911 K, a CaO addition rate of 2.07 kg/s, and a CO2 volume fraction of 28% is the optimal reaction condition based on economic and carbon removal efficiency considerations.
Table 8 shows the analysis of the simulation results, where K1, K2, and K3 are the sum of the values of the carbon removal efficiency corresponding to individual levels in each factor; k1, k2, and k3 are one-third of K1, K2, and K3; and R represents the extreme difference, which is the maximum value minus the minimum value of the corresponding column k.
The R values in Table 8 show that the influencing factors in this experiment have a significant order of magnitude. The range of the CO2 volume fraction factor is the largest, up to 21.4, followed by the CaO concentration factor, and the temperature factor has the smallest range of 5.3. This indicates that the effect of the CO2 volume fraction is greater than that of the CaO addition and temperature. Therefore, in practical operation, if one wants to improve the carbon removal efficiency, the volume fraction of CO2 and the amount of CaO added should be the primary factors to consider.

4.9. Analysis of the Impact of the Carbonation Reactor on the Pre-Calciner System

The addition of a carbonation reactor mainly affects the C1 and C2 preheaters in the cement pre-calciner kiln system. Adding a carbonation reactor changes the gas velocity and pressure in C1 and C2, affecting the particle separation efficiency at the outlet of the primary preheater. Table 9 and Table 10 show the changes in velocity and pressure at the outlets of the C1 and C2 preheaters before and after the addition of the carbonation reactor. “Original” represents the state before the addition of the carbonation reactor, and “Current” represents the state after the addition. Data in Table 9 and Table 10 show that the velocity and pressure at the outlets of the C1 and C2 preheaters in the original cement pre-calciner kiln system are consistent with the actual data, indicating the reliability of the model. The study found that the addition of a carbonation reactor increased the gas velocity and reduced the pressure at the outlets of C1 and C2, thereby affecting the separation efficiency. Table 11 shows the changes in separation efficiency at the outlet of C1 before and after the addition of the carbonation reactor. The separation efficiency of the current C1 outlet has decreased by 1.3%, but the decrease is not significant. In summary, the addition of a carbonation reactor increases the velocity and reduces the pressure at the outlets of C1 and C2, resulting in a decrease in separation efficiency at the outlet of C1. However, due to the slight decrease, the impact on the cement pre-calciner kiln system is small.
5. Conclusions

In this paper, the proposed CaL recycling process scheme is explored. The addition position of the carbonation reactor in the pre-calciner kiln system was determined by the reaction temperature of the CO2 adsorption by CaO. The adsorbent C5 export raw material taken was analyzed to confirm the percentage of active CaO in it, and the results showed the feasibility of taking the C5 export raw material as adsorbent. Further exploration was carried out on the carbonation reactor, and the main research findings of this article are as follows:
(1)
The velocity field, pressure, and temperature fields of the carbonation reactor all conform to the general operating rules. Through comparison with the literature, it shows that the established model is reliable.
(2)
When the particle velocity of the adsorbent CaO in the carbonation reactor is 15 m/s, the separation efficiency reaches 92.5%, which is the optimal operating speed for the carbonation reactor. The addition of particles increases the turbulent kinetic energy of the carbonation reactor, thereby strengthening the transfer process of the reaction.
(3)
The factors affecting the carbon removal efficiency of the carbonation reactor were analyzed. Within the temperature range of the carbonation reaction, as the temperature increases and the amount of CaO added increases, and the volume fraction of CO2 decreases, the carbon removal efficiency will increase. When the temperature is 911 K, the amount of CaO added is 2.07 kg/s, and the volume fraction of CO2 is 0.28, the chemical reaction reaches equilibrium. At this time, the carbon removal efficiency can reach 90%, which is higher than other related research. In addition, increasing the temperature can also improve the carbon removal efficiency, but it is not considered to continue to increase the reaction temperature due to high economic costs.
(4)
This study conducted a comprehensive factor analysis on the carbonation reactor, and the results showed that when the carbon removal efficiency was 90%, it was the best reaction condition. At the same time, the factors affecting the carbon removal efficiency showed a clear order: CO2 volume fraction > CaO addition amount > reaction temperature. Therefore, various process parameters can be adjusted according to this order to achieve higher carbon removal efficiency in practical operations.
(5)
Explored the effect of the carbonation reactor on the pre-calciner system, and the study found that the carbonation reactor has an impact on the velocity, pressure, and particle separation efficiency at the outlet of the preheater in the pre-calciner system. Specifically, adding the carbonation reactor increases the outlet velocity of the preheater, reduces the pressure, and slightly reduces the particle separation efficiency. Although the particle separation efficiency is slightly reduced, the decrease is slight, and it remains at around 92.1%, with little impact on the pre-calciner system.
The above research demonstrates the carbon removal efficiency of the carbonation reactor under the proposed process. It indicates that the addition of the carbonation reactor has minimal impact on the preheating system of the pre-calciner. These findings provide a valuable data foundation for designing future decarbonization processes in the cement industry. Investigating the factors influencing the carbon removal efficiency of the carbonation reactor is a critical basis for optimizing process design.

Author Contributions

H.K. provided research ideas and directed the study. J.W. (Jiaying Wang) refined the study protocol and performed the simulations and analysis of the results, writing, and editing the manuscript. G.W. was responsible for the validation of the model. J.W. (Jie Wang) and X.Z. were responsible for the data collection for the cement plant testing work. All authors have read and agreed to the published version of the manuscript.

Funding

This research received no external funding.

Data Availability Statement

Not applicable.

Conflicts of Interest

The authors declare no conflict of interest.

References

  1. Ma’Mun, S.; Svendsen, H.F.; Hoff, K.A.; Juliussen, O. Selection of new absorbents for carbon dioxide capture. Energy Convers. Manag. 2007, 48, 251–258. [Google Scholar] [CrossRef]
  2. Wei, J.X.; Cen, K. Empirical assessing cement CO2 emissions based on China’s economic and social development during 2001–2030. Sci. Total Environ. 2019, 653, 200–211. [Google Scholar] [CrossRef] [PubMed]
  3. Luo, L.; Guo, Y.; Li, Y.; Zhang, Z.; Zhu, T. Research on Low-Carbon Development Technology Path and Forecast of Cement Industry under Carbon Neutral Situation. Res. Environ. Sci. 2022, 35, 1527–1537. [Google Scholar]
  4. Wei, J.; Geng, Y.; Shen, L.; Cen, K. Analysis of Chinese Cement Production and CO2 Emission. Environ. Sci. Technol. 2015, 38, 80–86. [Google Scholar]
  5. Ma, J.F.; Li, L.; Wang, H.F.; Du, Y.; Ma, J.J.; Zhang, X.L.; Wang, Z.L. Carbon Capture and Storage: History and the Road Ahead. Engineering 2022, 14, 33–43. [Google Scholar] [CrossRef]
  6. Dong, J.P.; Wang, F.; Chen, G.H.; Wang, S.G.; Ji, C.L.; Gao, F. Fabrication of nickel oxide functionalized zeolite USY composite as a promising adsorbent for CO(2)capture. Chin. J. Chem. Eng. 2022, 46, 207–213. [Google Scholar] [CrossRef]
  7. Ma, Y.J.; Wang, Z.M.; Xu, X.F.; Wang, J.Y. Review on porous nanomaterials for adsorption and photocatalytic conversion of CO2. Chin. J. Catal. 2017, 38, 1956–1969. [Google Scholar] [CrossRef]
  8. Helwani, Z.; Wiheeb, A.D.; Kim, J.; Othman, M.R. Improved carbon dioxide capture using metal reinforced hydrotalcite under wet conditions. Int. J. Greenh. Gas Control 2012, 7, 127–136. [Google Scholar]
  9. Zhang, L.Y.; Song, Y.F.; Shi, J.L.; Shen, Q.; Hu, D.; Gao, Q.; Chen, W.; Kow, K.W.; Pang, C.H.; Sun, N.N.; et al. Frontiers of CO2 Capture and Utilization (CCU) towards Carbon Neutrality. Adv. Atmos. Sci. 2022, 39, 1252–1270. [Google Scholar] [CrossRef]
  10. Shimizu, T.; Hirama, T.; Hosoda, H.; Kitano, K.; Inagaki, M.; Tejima, K. A twin fluid-bed reactor for removal of CO2 from combustion processes. Chem. Eng. Res. Des. 1999, 77, 62–68. [Google Scholar] [CrossRef]
  11. Manovic, V.; Anthony, E.J. Steam reactivation of spent CaO-based sorbent for multiple CO2 capture cycles. Environ. Sci. Technol. 2007, 41, 1420–1425. [Google Scholar] [CrossRef] [PubMed]
  12. De Lena, E.; Spinelli, M.; Gatti, M.; Scaccabarozzi, R.; Campanari, S.; Consonni, S.; Cinti, G.; Romano, M.C. Techno-economic analysis of calcium looping processes for low CO2 emission cement plants. Int. J. Greenh. Gas Control 2019, 82, 244–260. [Google Scholar] [CrossRef]
  13. Mohammadi, M.; Sedghkerdar, M.H.; Abbasi, M.; Izadbakhsh, A.; Karami, D. Reactivity stabilization and capacity study of fabricated alumina and zirconia-supported CaO-based sorbents for high-temperature CO2 capture in a fixed-bed reactor. Can. J. Chem. Eng. 2022, 101, 2548–2555. [Google Scholar] [CrossRef]
  14. Phromprasit, J.; Powell, J.; Assabumrungrat, S. Metals (Mg, Sr and Al) modified CaO based sorbent for CO2 sorption/desorption stability in fixed bed reactor for high temperature application. Chem. Eng. J. 2016, 284, 1212–1223. [Google Scholar] [CrossRef]
  15. Ridha, F.N.; Lu, D.; Macchi, A.; Hughes, R.W. Combined calcium looping and chemical looping combustion cycles with CaO-CuO pellets in a fixed bed reactor. Fuel 2015, 153, 202–209. [Google Scholar] [CrossRef]
  16. Yue, W.F.; Fan, C.G.; Song, W.L.; Li, S.G. Influence of additives on CaCO3 precursors and multicycle CO2 capture performance of CaO sorbents. J. Environ. Chem. Eng. 2022, 10, 107440. [Google Scholar] [CrossRef]
  17. Hsu, M.J.; Lee, K.H.; Chyou, Y.P. CO2 capture at high temperature using calcium-based sorbents. J. Chin. Inst. Eng. 2014, 37, 152–164. [Google Scholar] [CrossRef]
  18. Hornberger, M.; Moreno, J.; Schmid, M.; Scheffknecht, G. Experimental investigation of the carbonation reactor in a tail-end Calcium Looping configuration for CO2 capture from cement plants. Fuel Process. Technol. 2020, 210, 106557. [Google Scholar] [CrossRef]
  19. Dou, B.L.; Song, Y.C.; Liu, Y.G.; Feng, C. High temperature CO2 capture using calcium oxide sorbent in a fixed-bed reactor. J. Hazard. Mater. 2010, 183, 759–765. [Google Scholar] [CrossRef]
  20. Rolfe, A.; Huang, Y.; Haaf, M.; Pita, A.; Rezvani, S.; Dave, A.; Hewitt, N.J. Technical and environmental study of calcium carbonate looping versus oxy-fuel options for low CO2 emission cement plants. Int. J. Greenh. Gas Control 2018, 75, 85–97. [Google Scholar] [CrossRef]
  21. Bacatelo, M.; Capucha, F.; Ferrao, P.; Margarido, F. Selection of a CO2 capture technology for the cement industry: An integrated TEA and LCA methodological framework. J. CO2 Util. 2023, 68, 102375. [Google Scholar] [CrossRef]
  22. Spinelli, M.; Martinez, I.; Romano, M.C. One-dimensional model of entrained-flow carbonator for CO2 capture in cement kilns by Calcium looping process. Chem. Eng. Sci. 2018, 191, 100–114. [Google Scholar] [CrossRef]
  23. Ozcan, D.C.; Ahn, H.; Brandani, S. Process integration of a Ca-looping carbon capture process in a cement plant. Int. J. Greenh. Gas Control 2013, 19, 530–540. [Google Scholar] [CrossRef]
  24. Pathi, S.K.; Lin, W.G.; Illerup, J.B.; Dam-Johansen, K.; Hjuler, K. CO2 Capture by Cement Raw Meal. Energy Fuels 2013, 27, 5397–5406. [Google Scholar] [CrossRef]
  25. De Lena, E.; Arias, B.; Romano, M.C.; Abanades, J.C. Integrated Calcium Looping System with Circulating Fluidized Bed Reactors for Low CO2 Emission Cement Plants. Int. J. Greenh. Gas Control 2022, 114, 103555. [Google Scholar] [CrossRef]
  26. Atsonios, K.; Grammelis, P.; Antiohos, S.K.; Nikolopoulos, N.; Kakaras, E. Integration of calcium looping technology in existing cement plant for CO2 capture: Process modeling and technical considerations. Fuel 2015, 153, 210–223. [Google Scholar] [CrossRef]
  27. Diego, M.E.; Arias, B.; Abanades, J.C. Analysis of a double calcium loop process configuration for CO2 capture in cement plants. J. Clean. Prod. 2016, 117, 110–121. [Google Scholar] [CrossRef]
  28. Zhang, C.X.; Li, Y.J.; Bian, Z.G.; Zhang, W.; Wang, Z.Y. Simultaneous CO2 capture and thermochemical heat storage by modified carbide slag in coupled calcium looping and CaO/Ca(OH)2 cycles. Chin. J. Chem. Eng. 2021, 36, 76–85. [Google Scholar] [CrossRef]
  29. Panchuk, V.; Yaroshenko, I.; Legin, A.; Semenov, V.; Kirsanov, D. Application of chemometric methods to XRF-data—A tutorial review. Anal. Chim. Acta 2018, 1040, 19–32. [Google Scholar] [CrossRef]
  30. Liu, Y.H.; Du, G.S.; Liu, Z.G.; Wang, Y.Y. The influence of different design parameters and working conditions on characteristics of heat meters. J. Hydrodyn. 2009, 21, 394–400. [Google Scholar] [CrossRef]
  31. Dong, L.; Geng, Z.; Zhao, W. Numerical Simulation of Gas Phase in C1–C5 Cyclone Preheater for 5000 t/d Cement Clinker Production Line. Bull. Chin. Ceram. Soc. 2014, 33, 1497–1501, 1509. [Google Scholar]
  32. Tao, C.; Zhao, L.; Yu, W.; Zhang, K.; Hu, Z. Optimization of Six-Stage Preheater with Numerical Simulation. J. Tianjin Univ. 2011, 44, 369–376. [Google Scholar]
  33. Wang, K.; Zhang, Y.W.; Xue, M.; Wang, Z.Y.; Xi, J.Z. Experimental and kinetic investigations of double-effect oxygen carriers for chemical looping gasification. J. Therm. Anal. Calorim. 2023, 148, 867–882. [Google Scholar] [CrossRef]
Figure 1. Location distribution of carbonation reactor C2.5. (The arrows on the left side of the down-feed pipe is adsorbent transport, and the arrows on the right side of the down-feed pipe is flue gas transport, C1–C5 are preheaters of all levels.).
Processes 11 01449 g001
Figure 2. XRD analysis results of the raw material at the outlet of the C5 down-feed pipe. (The red line is the XRD result, the black line is the standard card of the compound).
Processes 11 01449 g002
Figure 3. 3D model of carbonation reactor.
Processes 11 01449 g003
Figure 4. Carbonation reactor grid.
Processes 11 01449 g004
Figure 5. Carbonation reactor gas velocity cloud.
Processes 11 01449 g005
Figure 6. Carbonation reactor gas pressure cloud.
Processes 11 01449 g006
Figure 7. Temperature cloud in the carbonation reactor.
Processes 11 01449 g007
Figure 8. Particle trajectory diagram at different inlet velocities.
Processes 11 01449 g008
Figure 9. Particle residence time at different inlet velocities.
Processes 11 01449 g009
Figure 10. Turbulent kinetic energy diagram (a) Turbulent kinetic energy of gas phase (b) Turbulent kinetic energy of CaO particles after addition.
Processes 11 01449 g010
Figure 11. CO2 fraction of carbonation reactor at the XY cross-section at different temperatures.
Processes 11 01449 g011
Figure 12. Carbonation reactor carbon removal efficiency with temperature.
Processes 11 01449 g012
Figure 13. CO2 fraction of carbonation reactor at the XY cross-section with different CaO addition.
Processes 11 01449 g013
Figure 14. Carbonation reactor carbon removal efficiency with CaO addition.
Processes 11 01449 g014
Figure 15. CO2 fraction plot of carbonation reactor at XY cross-section with different CO2 volume fractions.
Processes 11 01449 g015
Figure 16. Carbonation reactor carbon removal efficiency with CO2 volume fraction.
Processes 11 01449 g016
Figure 17. Variation of each component along the X-axis on the intersection of Y = 6.13 and Z = 0 at different CO2 concentrations.
Processes 11 01449 g017
Table 1. The gas composition at the outlet of the preheater.
Measurement PointGas Composition (%)
CO2O2CON2
C1 outlet30.32.3067.3
C2 outlet29.42.6067.9
C3 outlet28.33068.7
C4 outlet27.53.20.169.3
C5 outlet26.53.50.170.0
Table 2. Temperature and pressure at the outlet of the preheater.
Measurement PointParameters
Temperature/°CPressure/Pa
C1 outlet308−5846
C2 outlet482−4667
C3 outlet621−3676
C4 outlet747−2745
C5 outlet820−1937
Table 3. XRF analysis results of the raw material at the outlet of the C5 down-feed pipe.
Compoundm/m%StdErrElm/m%StdErr
CaO75.090.23Ca49.400.17
SiO210.120.16Si5.200.07
Al2O34.170.11Al2.740.06
Fe2O32.490.01Fe2.090.01
SO31.790.07Sx0.9160.030
MgO1.340.07Mg1.110.04
K2O1.070.06K1.050.05
TiO20.2710.014Ti0.1620.008
Cl0.2480.012Cl0.2480.012
Na2O0.0580.010Na0.04300.0075
SrO0.04810.0024Sr0.04070.0020
MnO0.04780.0023Mn0.03700.0018
P2O50.03800.0019Px0.01660.0008
Table 4. Carbonation reactor boundary conditions.
Measurement PointParameters
Velocity (m/s)Hydraulic Diameter (m)Mass Flow (kg/s)Temperature (K)Pressure (Pa)
Inlet151.932.47911−3552
Outlet-2-891−4741
Table 5. Grid independence test.
MeshParameters
Temperature (K)O2 Mole Fraction (%)
57,018870.532.3
82,794885.712.5
117,344896.232.8
146,088897.522.9
191,504898.122.9
Table 6. Table of factor levels.
LevelFactor
Temperature (K)CaO Addition (kg/s)CO2 Volume Fraction (%)
18511.6742
28811.8735
39112.0728
Table 7. L 9 3 4 Simulation design scheme and simulation results.
NumberFactor
Temperature (K)CaO Addition (kg/s)CO2 Volume Fraction (%)Carbon Removal Efficiency (%)
18511.674252
28511.872875
38512.073569
48811.672868
58811.873563
68812.074260
79111.673560
89111.874257
99112.072890
Table 8. Analysis of simulation results.
Calculated ValueFactor
TemperatureCaO AdditionCO2 Volume Fraction
K1196180169
K2191195192
K3207219233
k165.36056.3
k263.76564
k3697377.7
R5.31321.4
Table 9. Measured and simulated values of velocity at C1 and C2 exits.
NumberMeasured ValueSimulated Value
Original C2 Outlet1818.8027
Original C1 Outlet2121.432
Current C2 Outlet21.157
Current C1 Outlet24.1959
Table 10. Measured and simulated values of pressure at C1 and C2 outlets.
NumberMeasured ValueSimulated Value
Original C2 Outlet−4741−4659
Original C1 Outlet−6133−6134
Current C2 Outlet−6046
Current C1 Outlet−7423
Table 11. C1 cyclone separation efficiency comparison.
NumberOriginal C1Current C1
Separation efficiency93.4%92.1%
Disclaimer/Publisher’s Note: The statements, opinions and data contained in all publications are solely those of the individual author(s) and contributor(s) and not of MDPI and/or the editor(s). MDPI and/or the editor(s) disclaim responsibility for any injury to people or property resulting from any ideas, methods, instructions or products referred to in the content.