Simulation results obtained from these case studies are presented here and discussed in detail. In addition, the effectiveness of hybrid cooling as a solution for managing temperature in these scenarios are also evaluated and applied when necessary. It was assumed that the lowest cold air temperature coming from the air conditioning system was typically 16 °C and the airflow rate remained constant while the active cooling system was operating. While the cooling control algorithm used in this study was by no means optimised, the results indicated the feasibility and ballpark energy consumption rates of the proposed hybrid cooling strategy.
3.7.1. Case 1: Normal Summer Climate
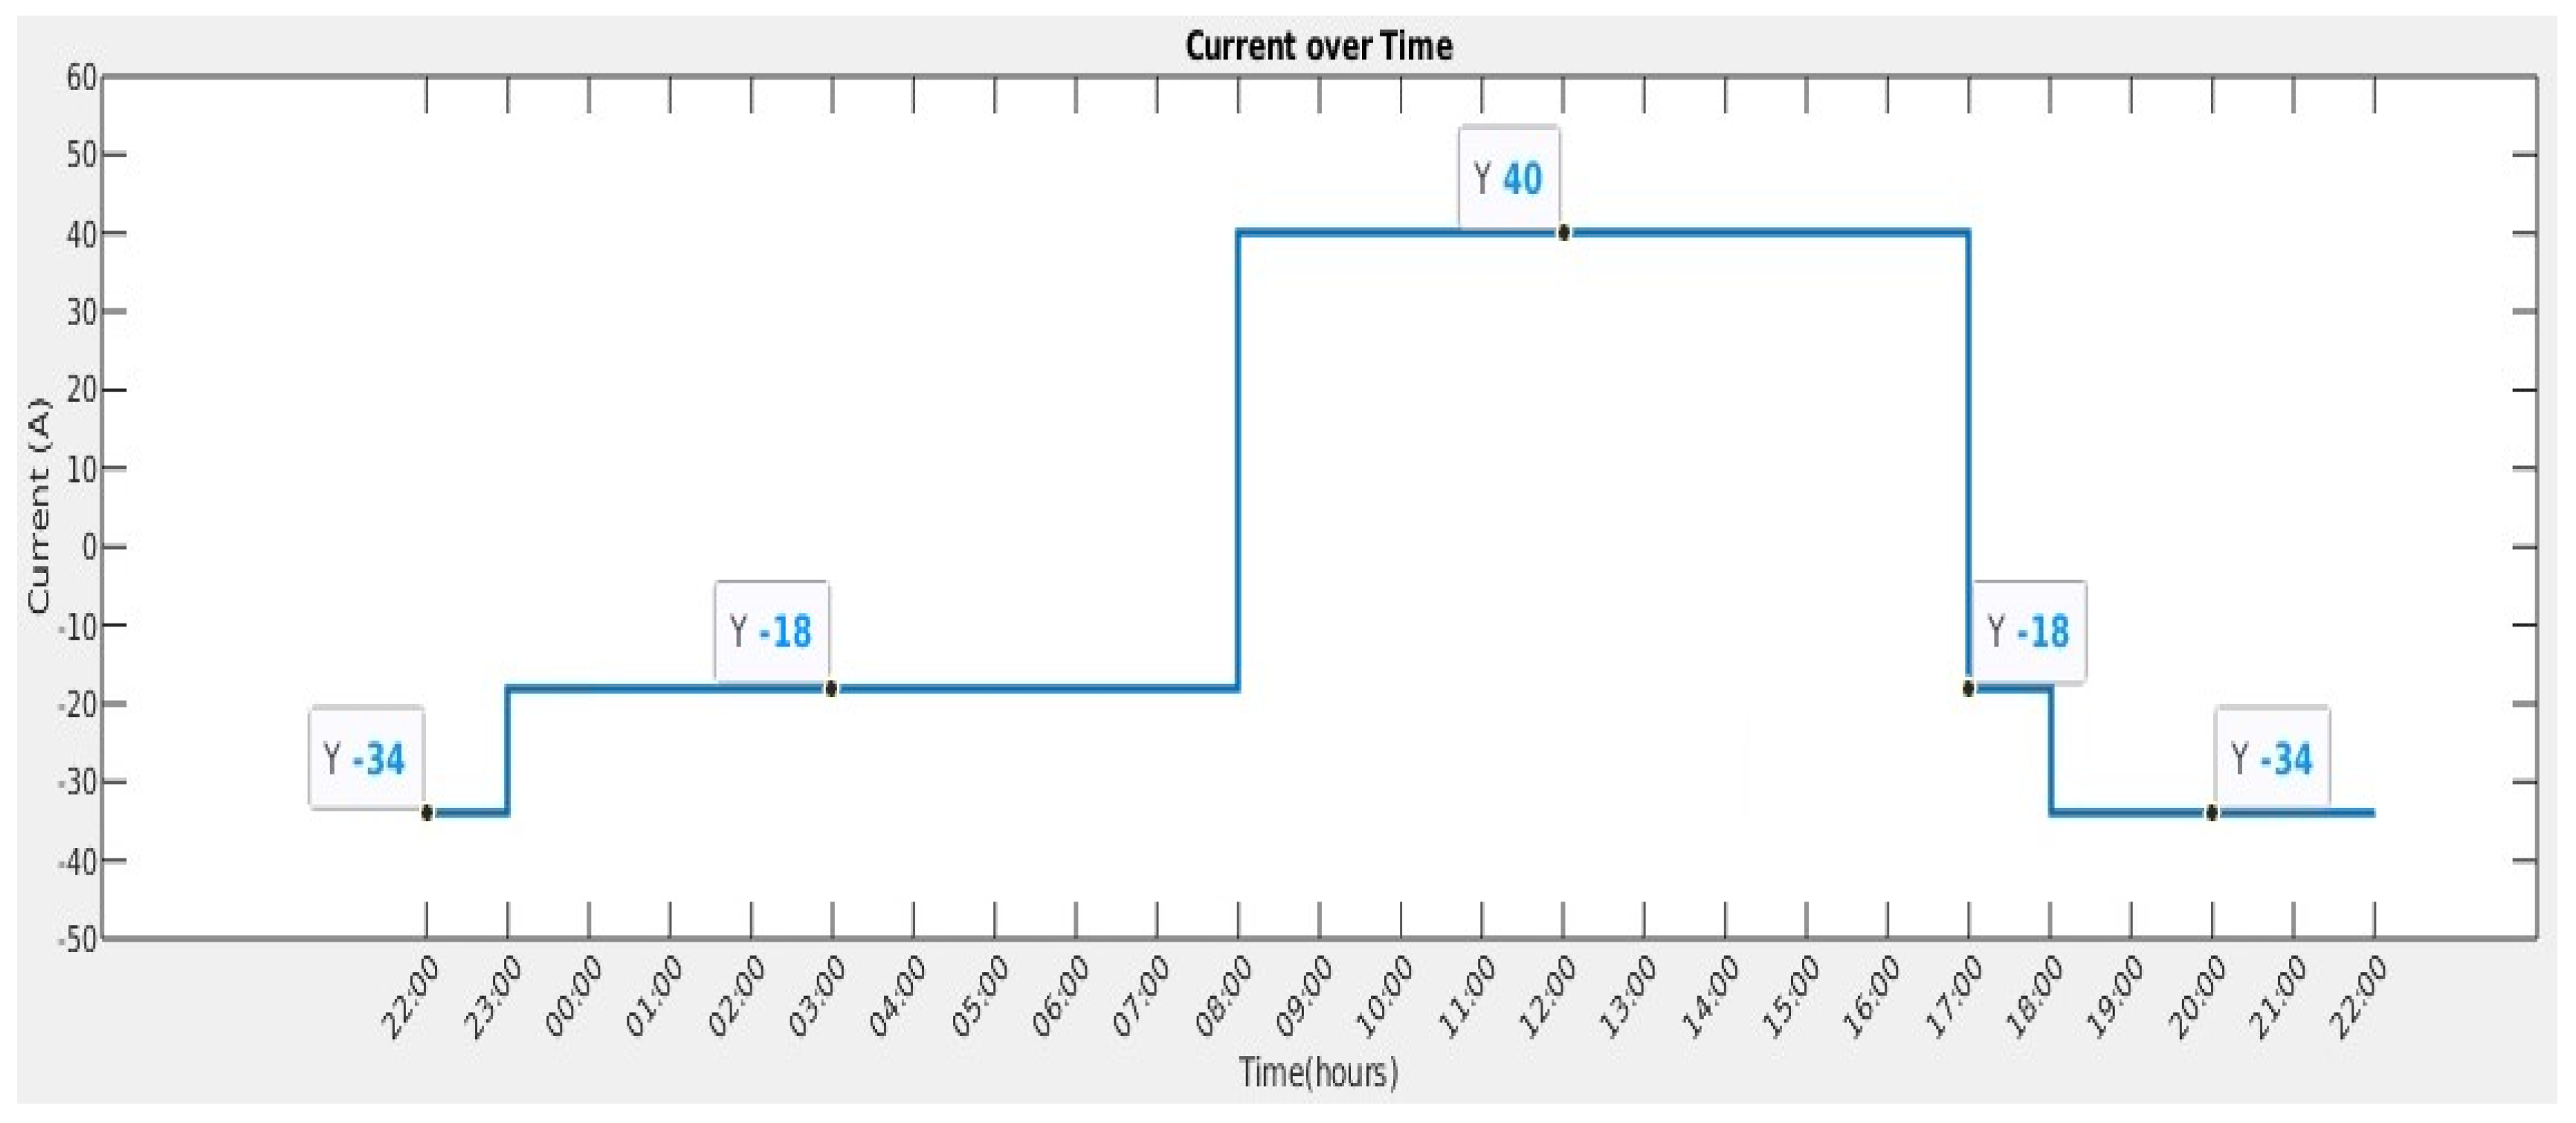
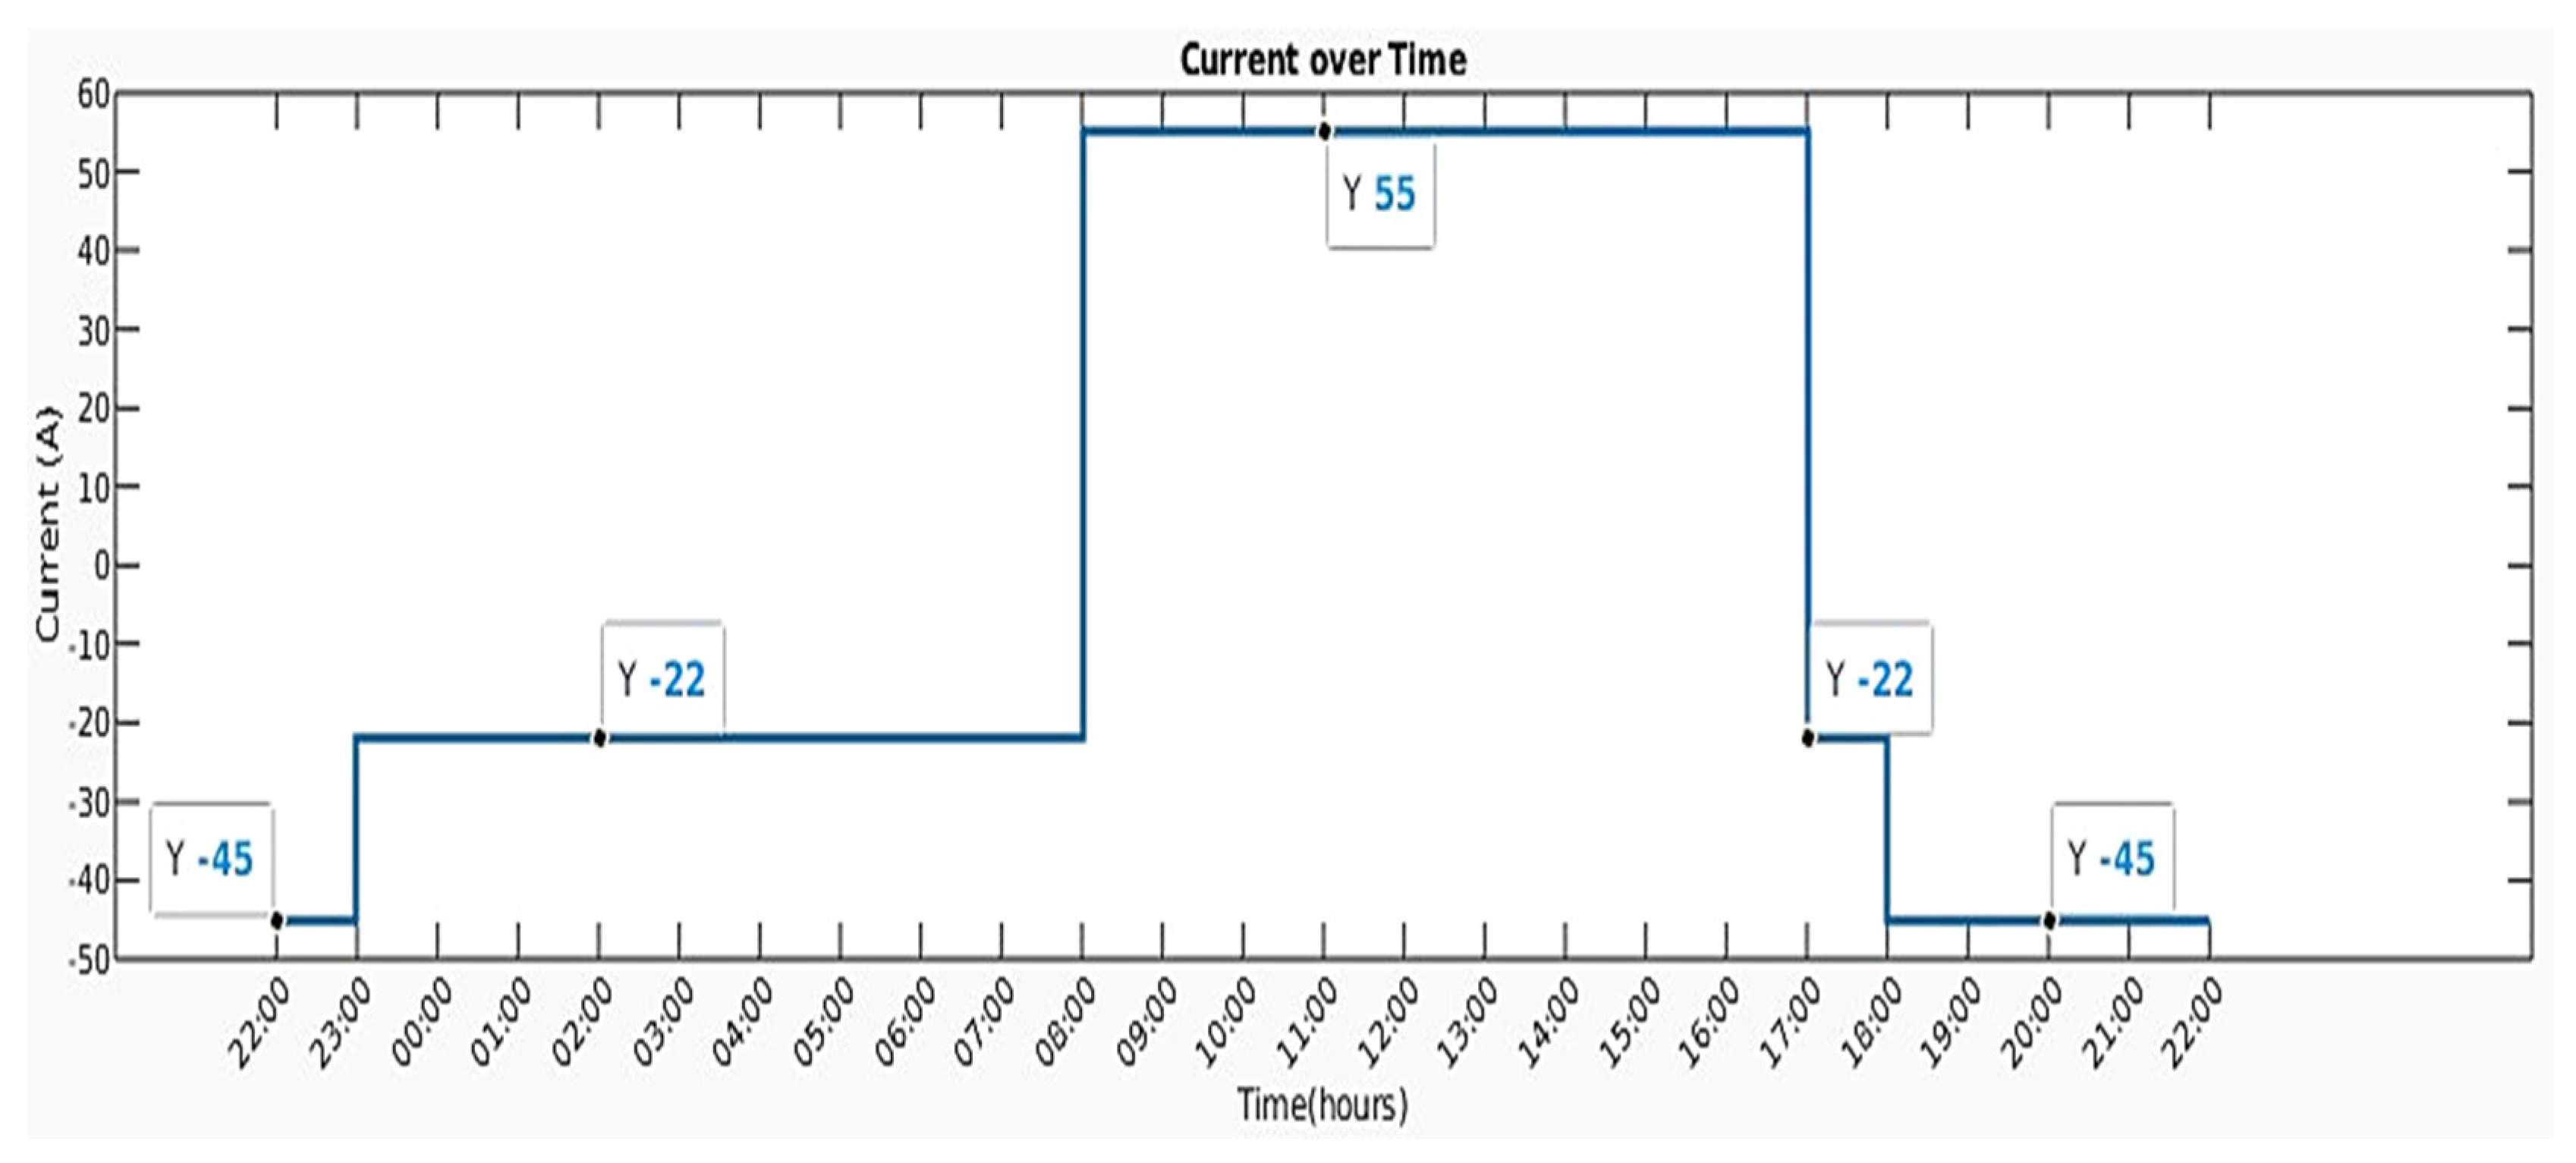
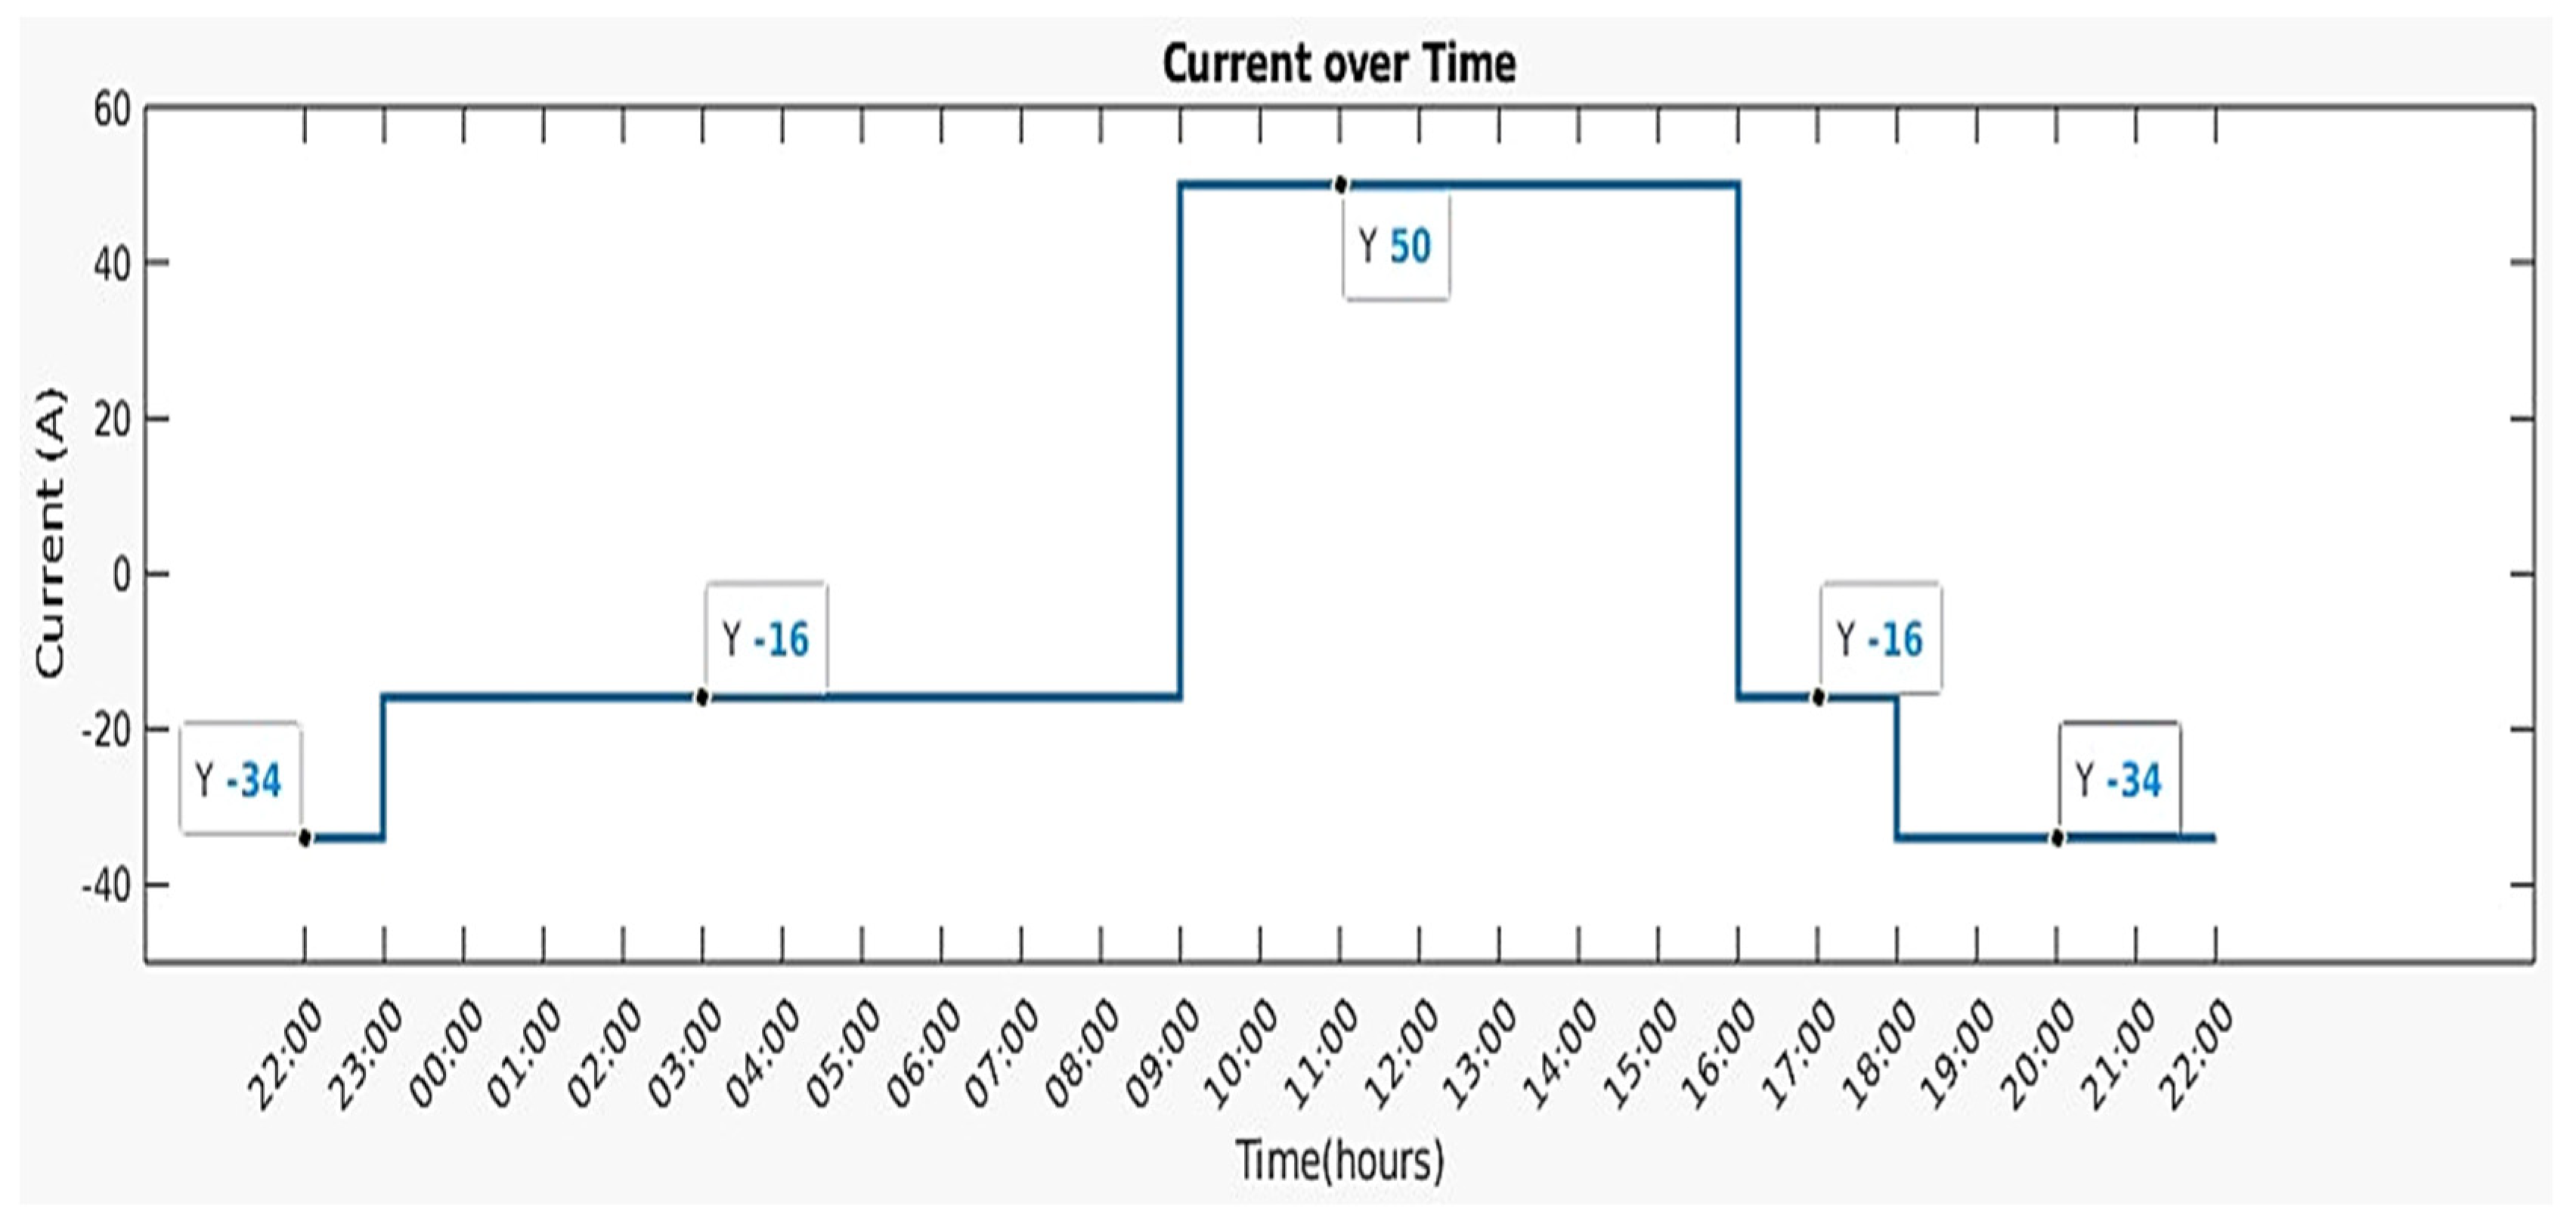
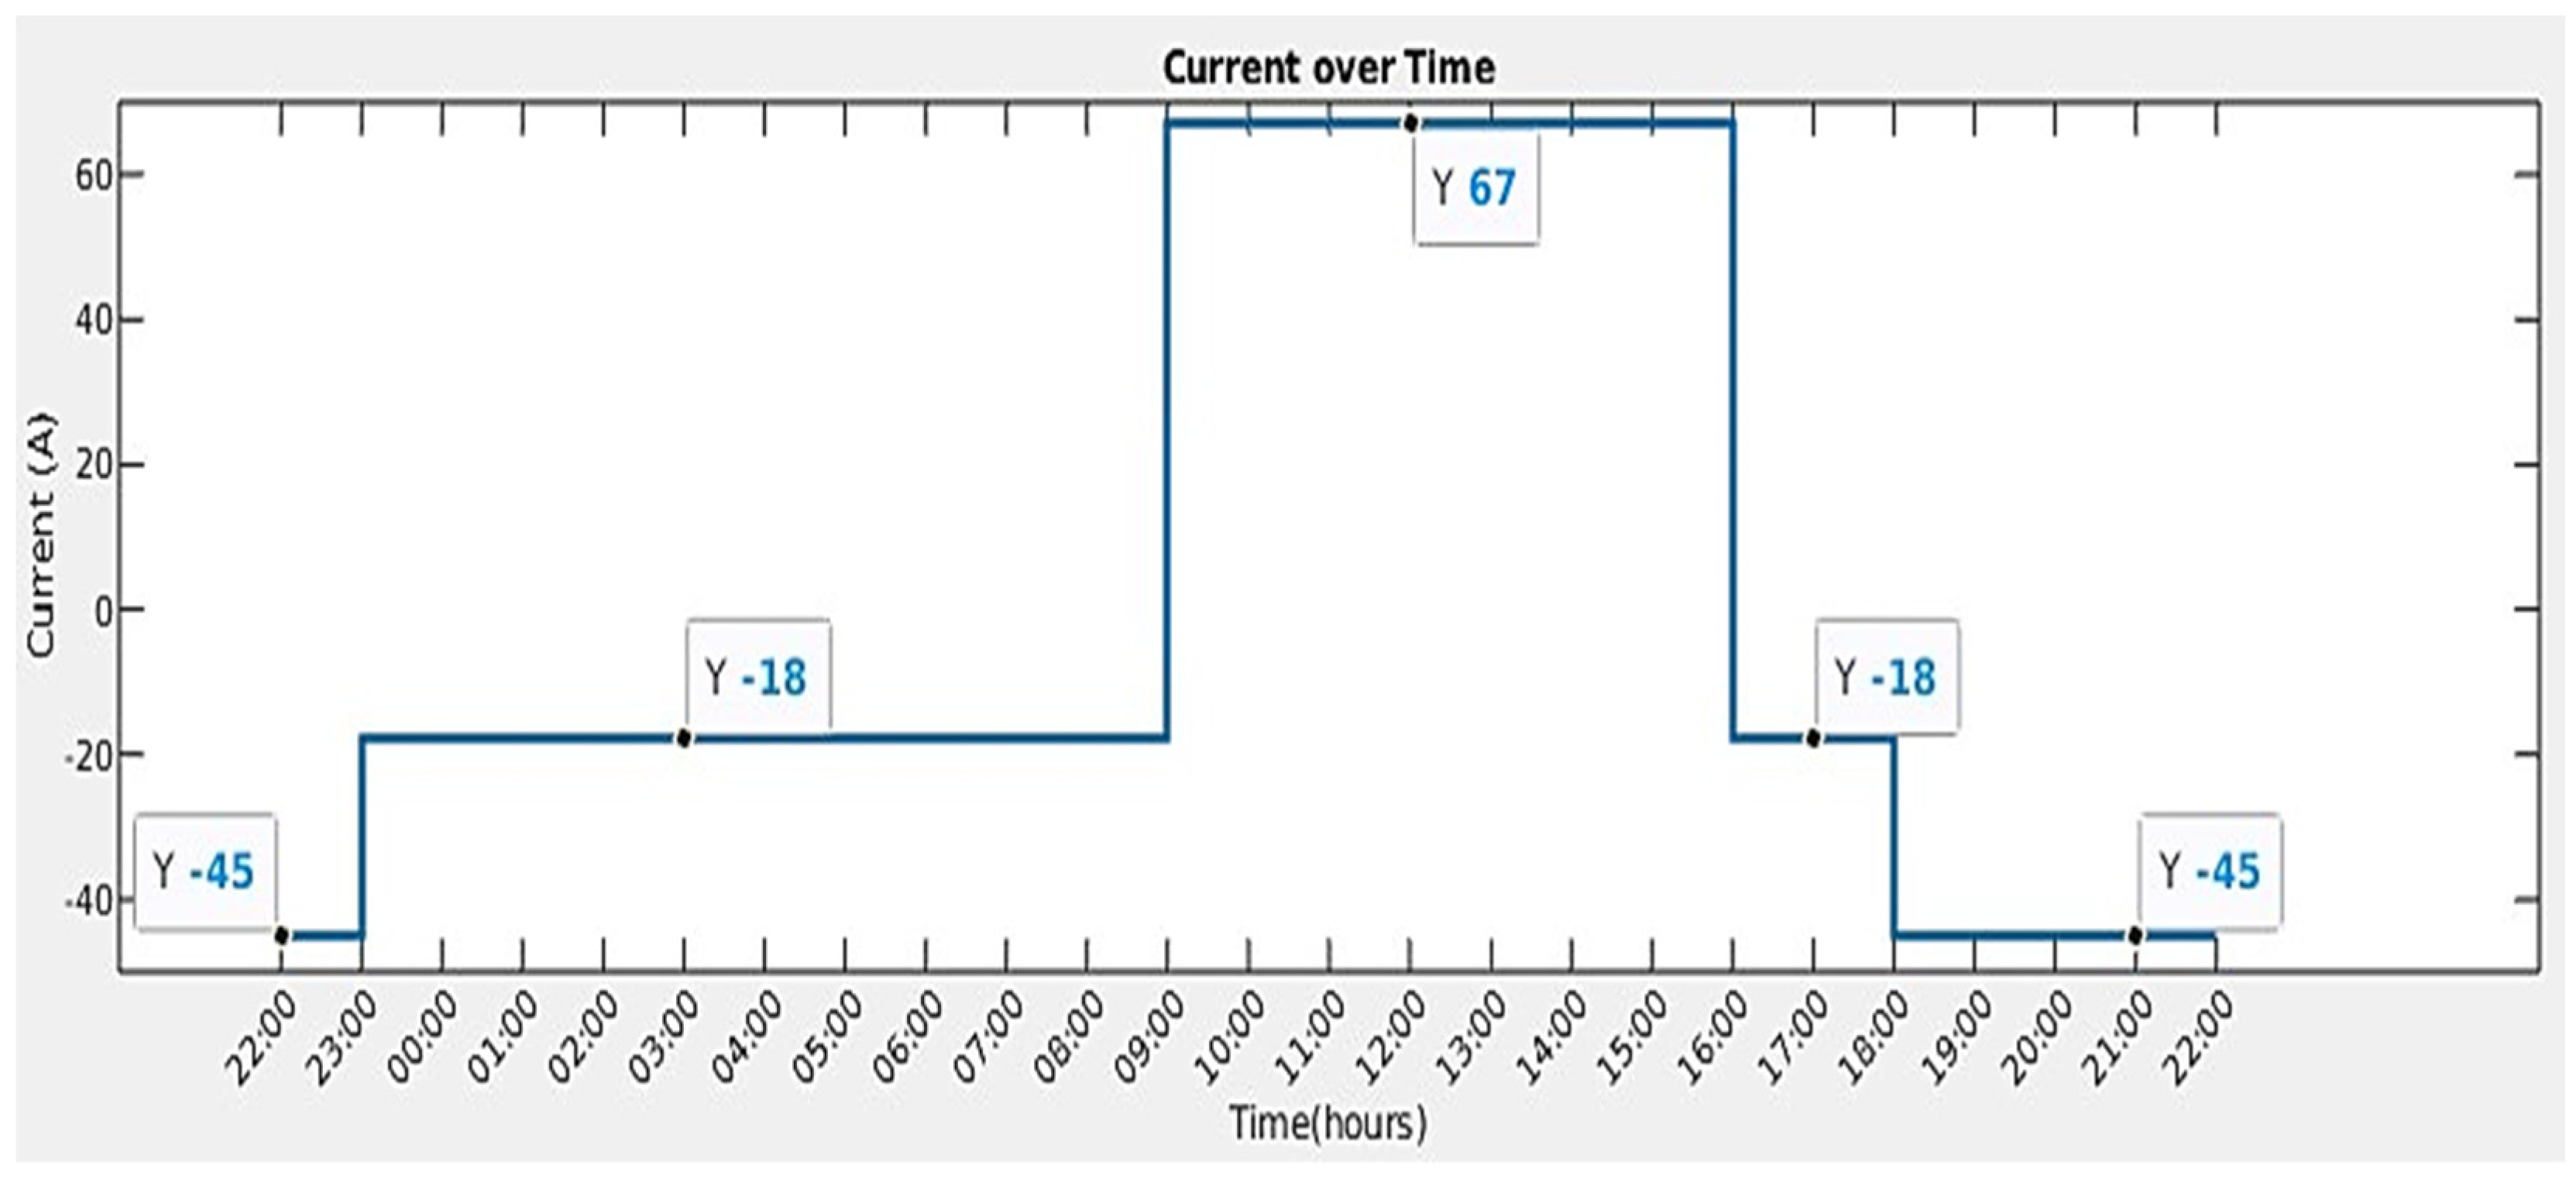
In this ambient temperature scenario, the main objective was to investigate the temperature response of the stacks and tanks when using containerised VFB systems in countries and regions where temperatures typically range from 15 °C to 35 °C during the summer. These countries and regions usually experience tropical, subtropical monsoon climates or Mediterranean climates. The load profiles in
Figure 1 and
Figure 2 were used in this scenario.
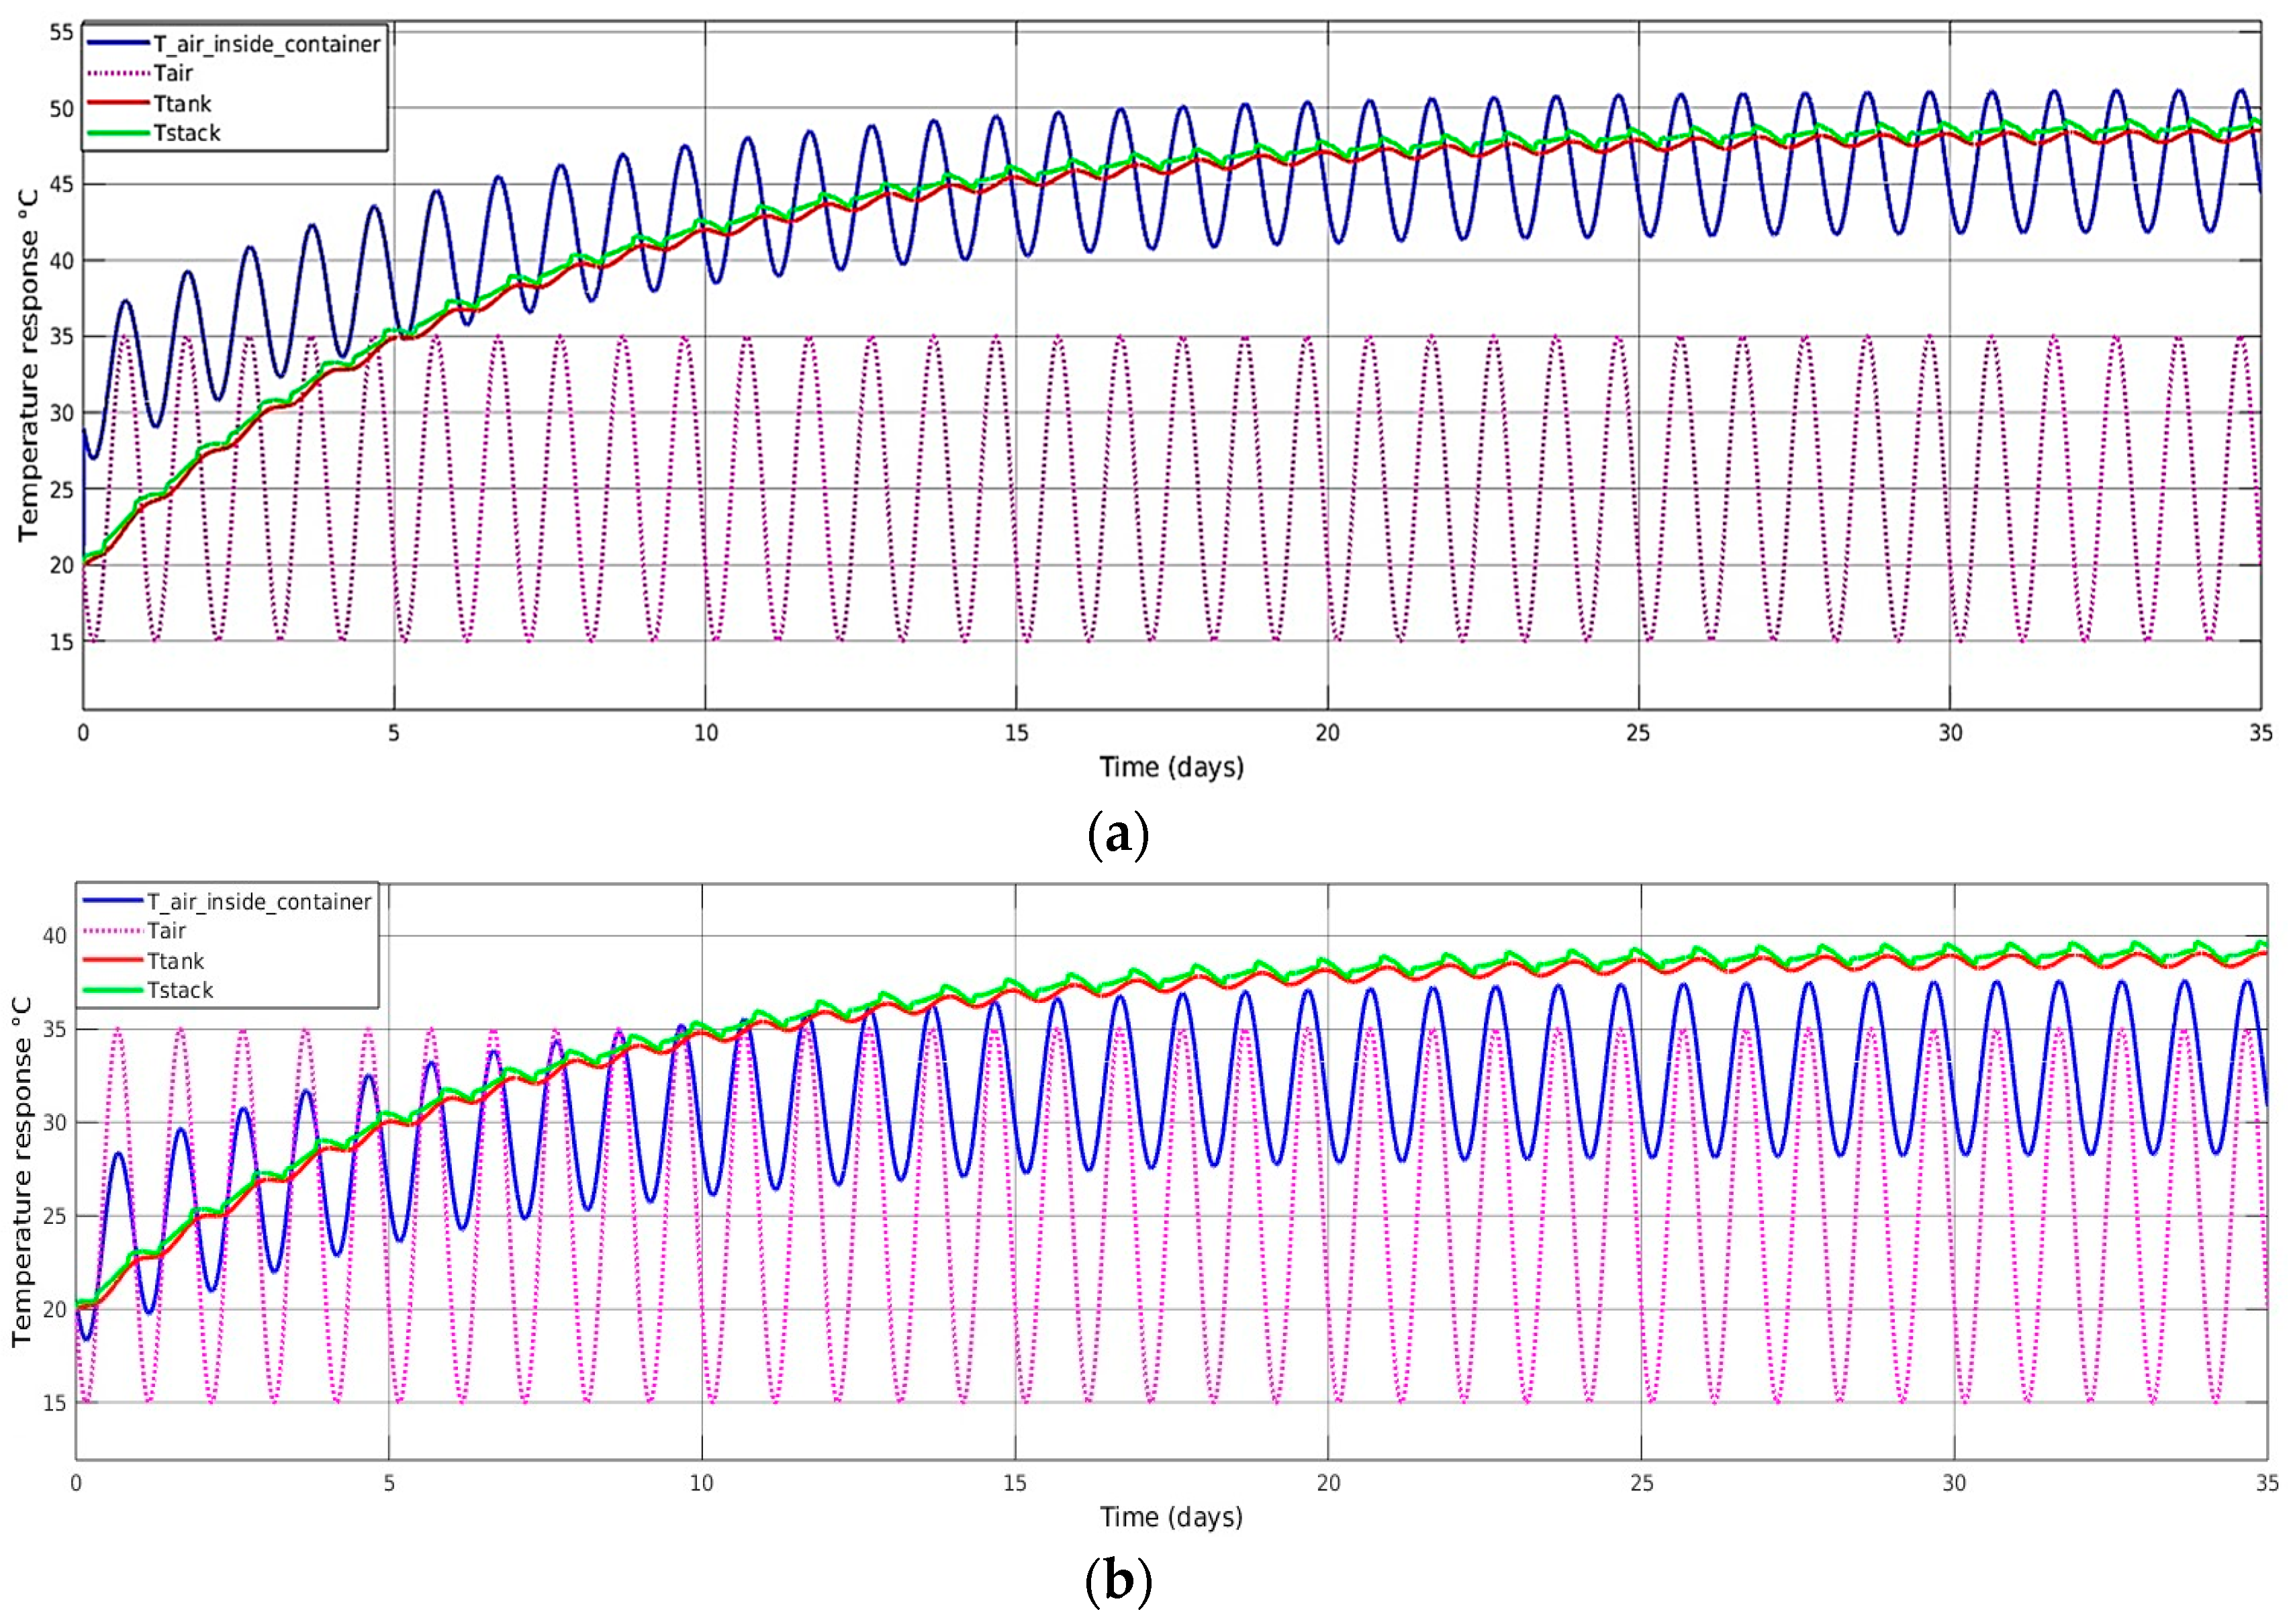
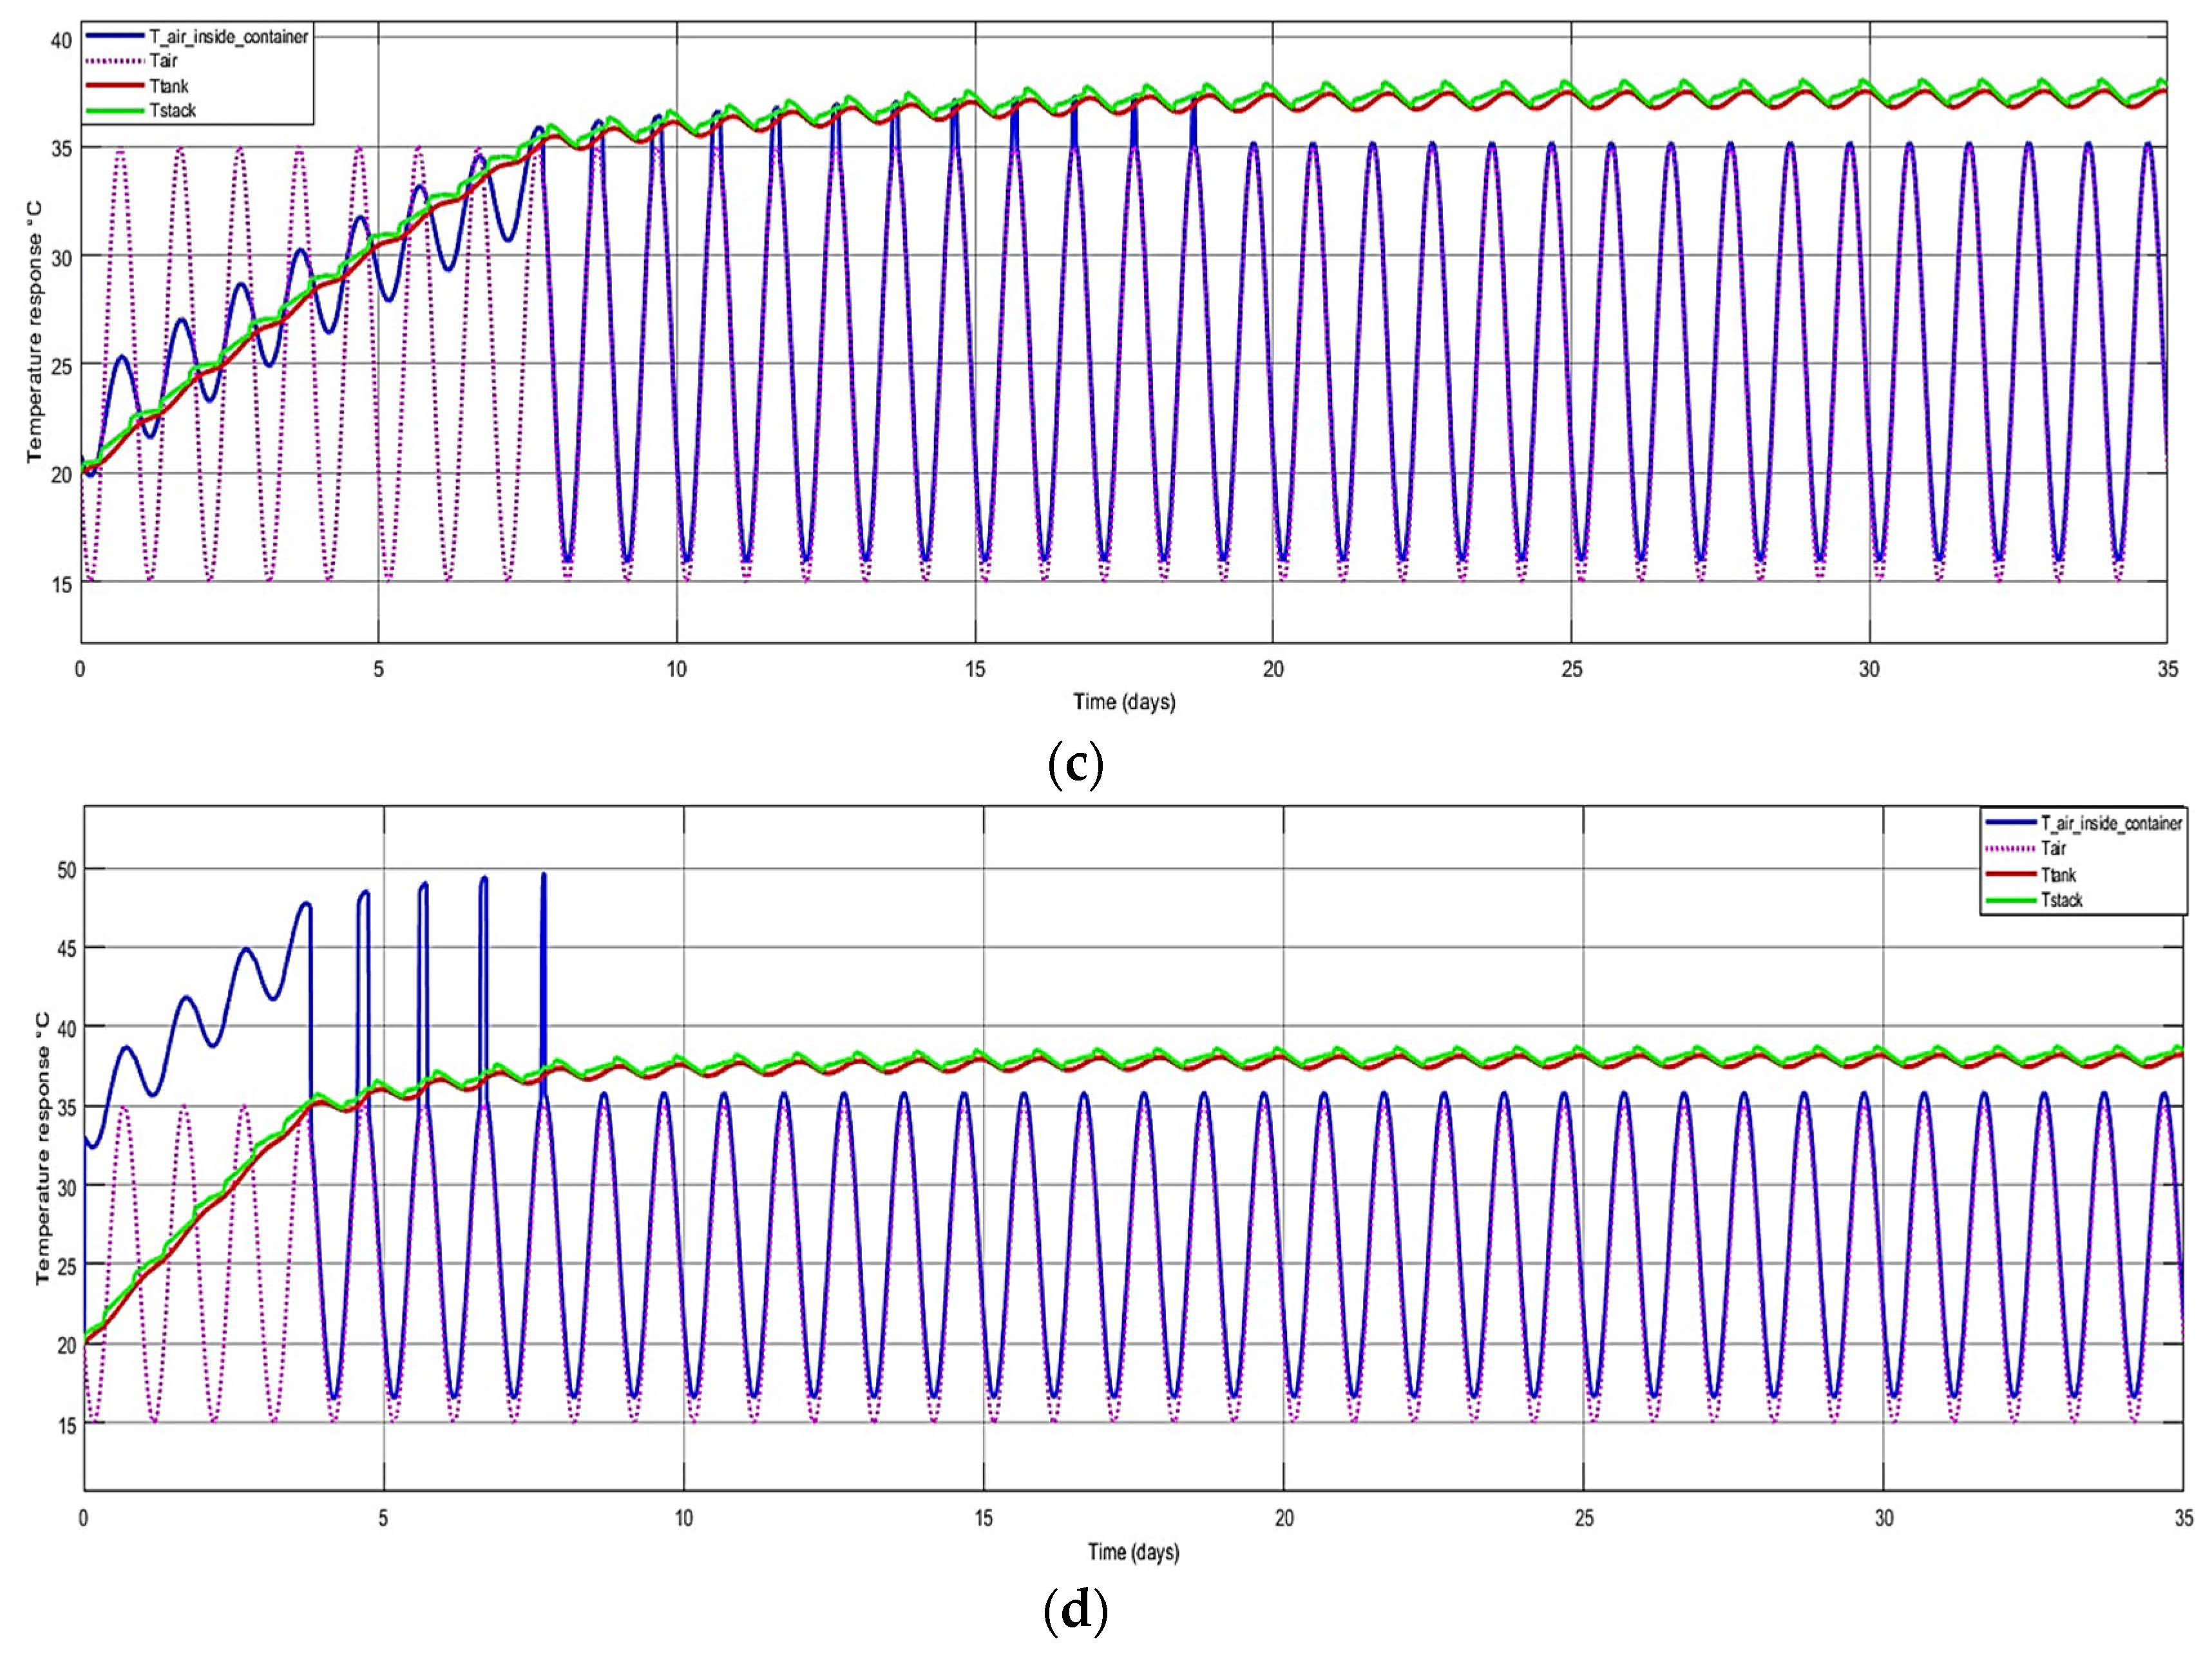
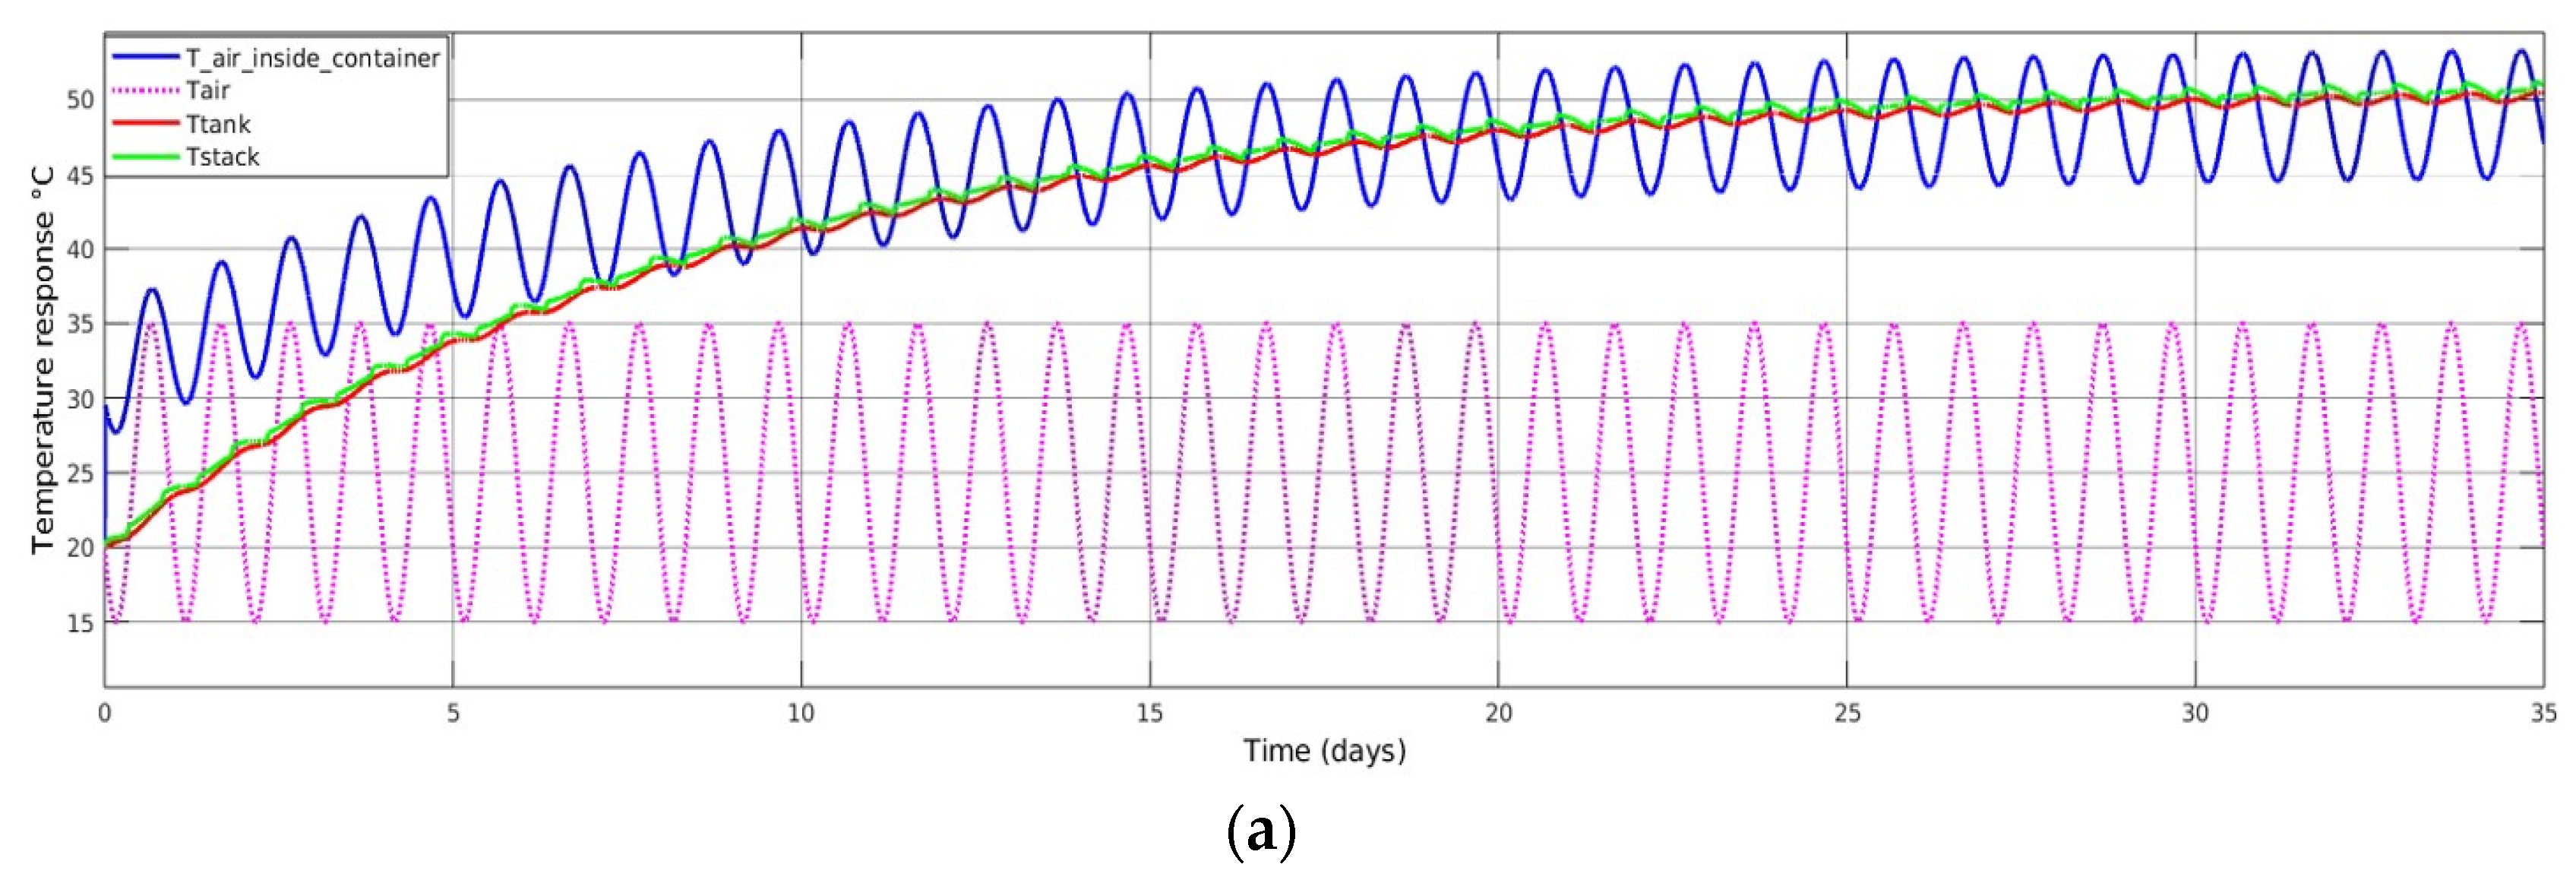
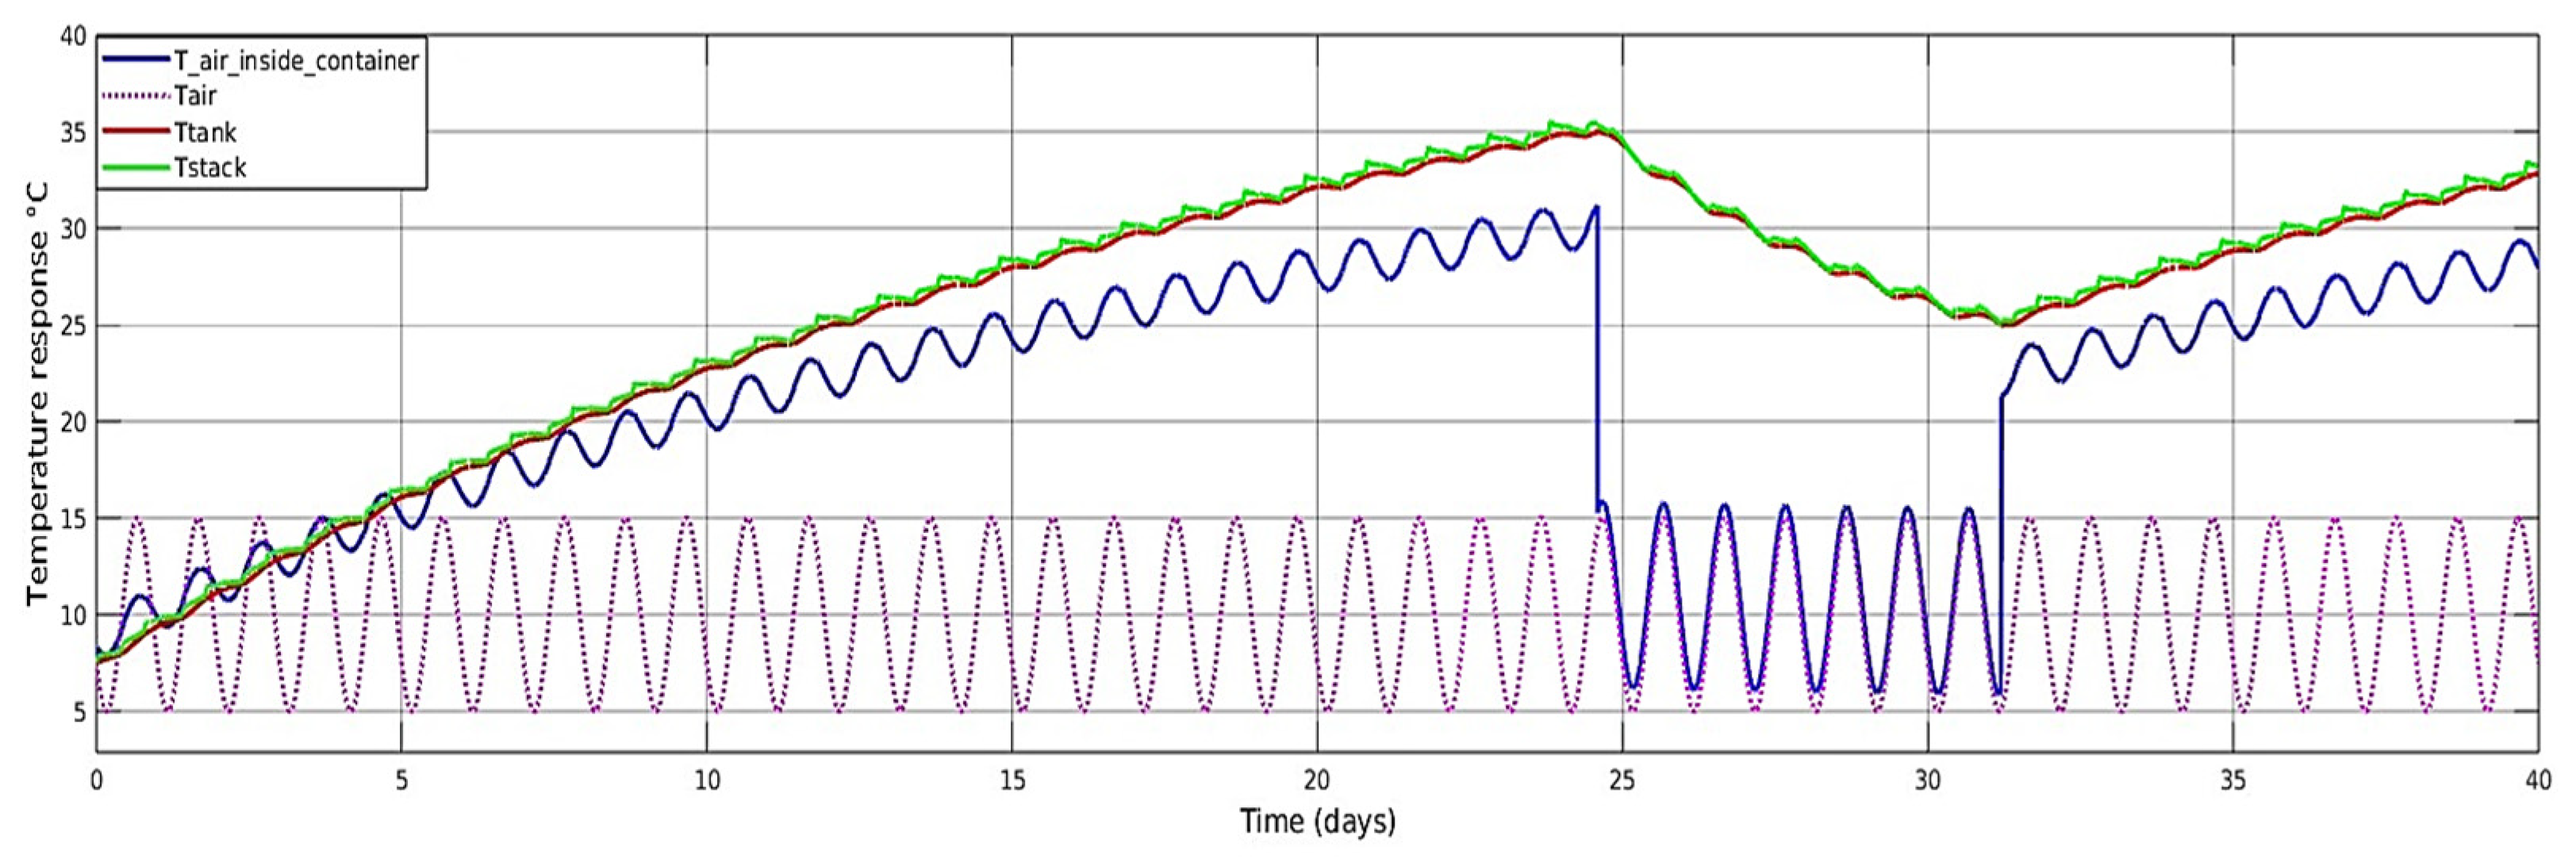
Figure 7 illustrates that fan-based passive cooling was capable of adequately cooling the stacks and tanks in a 6 h containerised system. However, the presence of inverters led to excessive heat generation, resulting in further increases in the temperature of the stacks and tanks, ultimately reaching high levels. Therefore, it is highly recommended to isolate the inverters from the internal environment to prevent such temperature increases. Despite the fact that fan-based passive cooling was influenced by ambient temperatures, and that insulation materials limited heat dissipation, this cooling strategy remained effective when appropriate insulation materials were implemented.
For a 6 h containerised VFB system (30 kW–180 kWh):
Figure 7.
Temperature response for a 6 h containerised VFB using the FAP-450 membrane for ambient temperature between 15 °C and 35 °C: (a) without insulation and fans, inverters are not isolated (); (b) without insulation and fans, inverters are isolated (); (c) with 0.02 m thick polyurethane insulation and passive cooling, inverters are isolated (); (d) with 0.02 m thick polyurethane insulation and passive cooling, inverters are not isolated ().
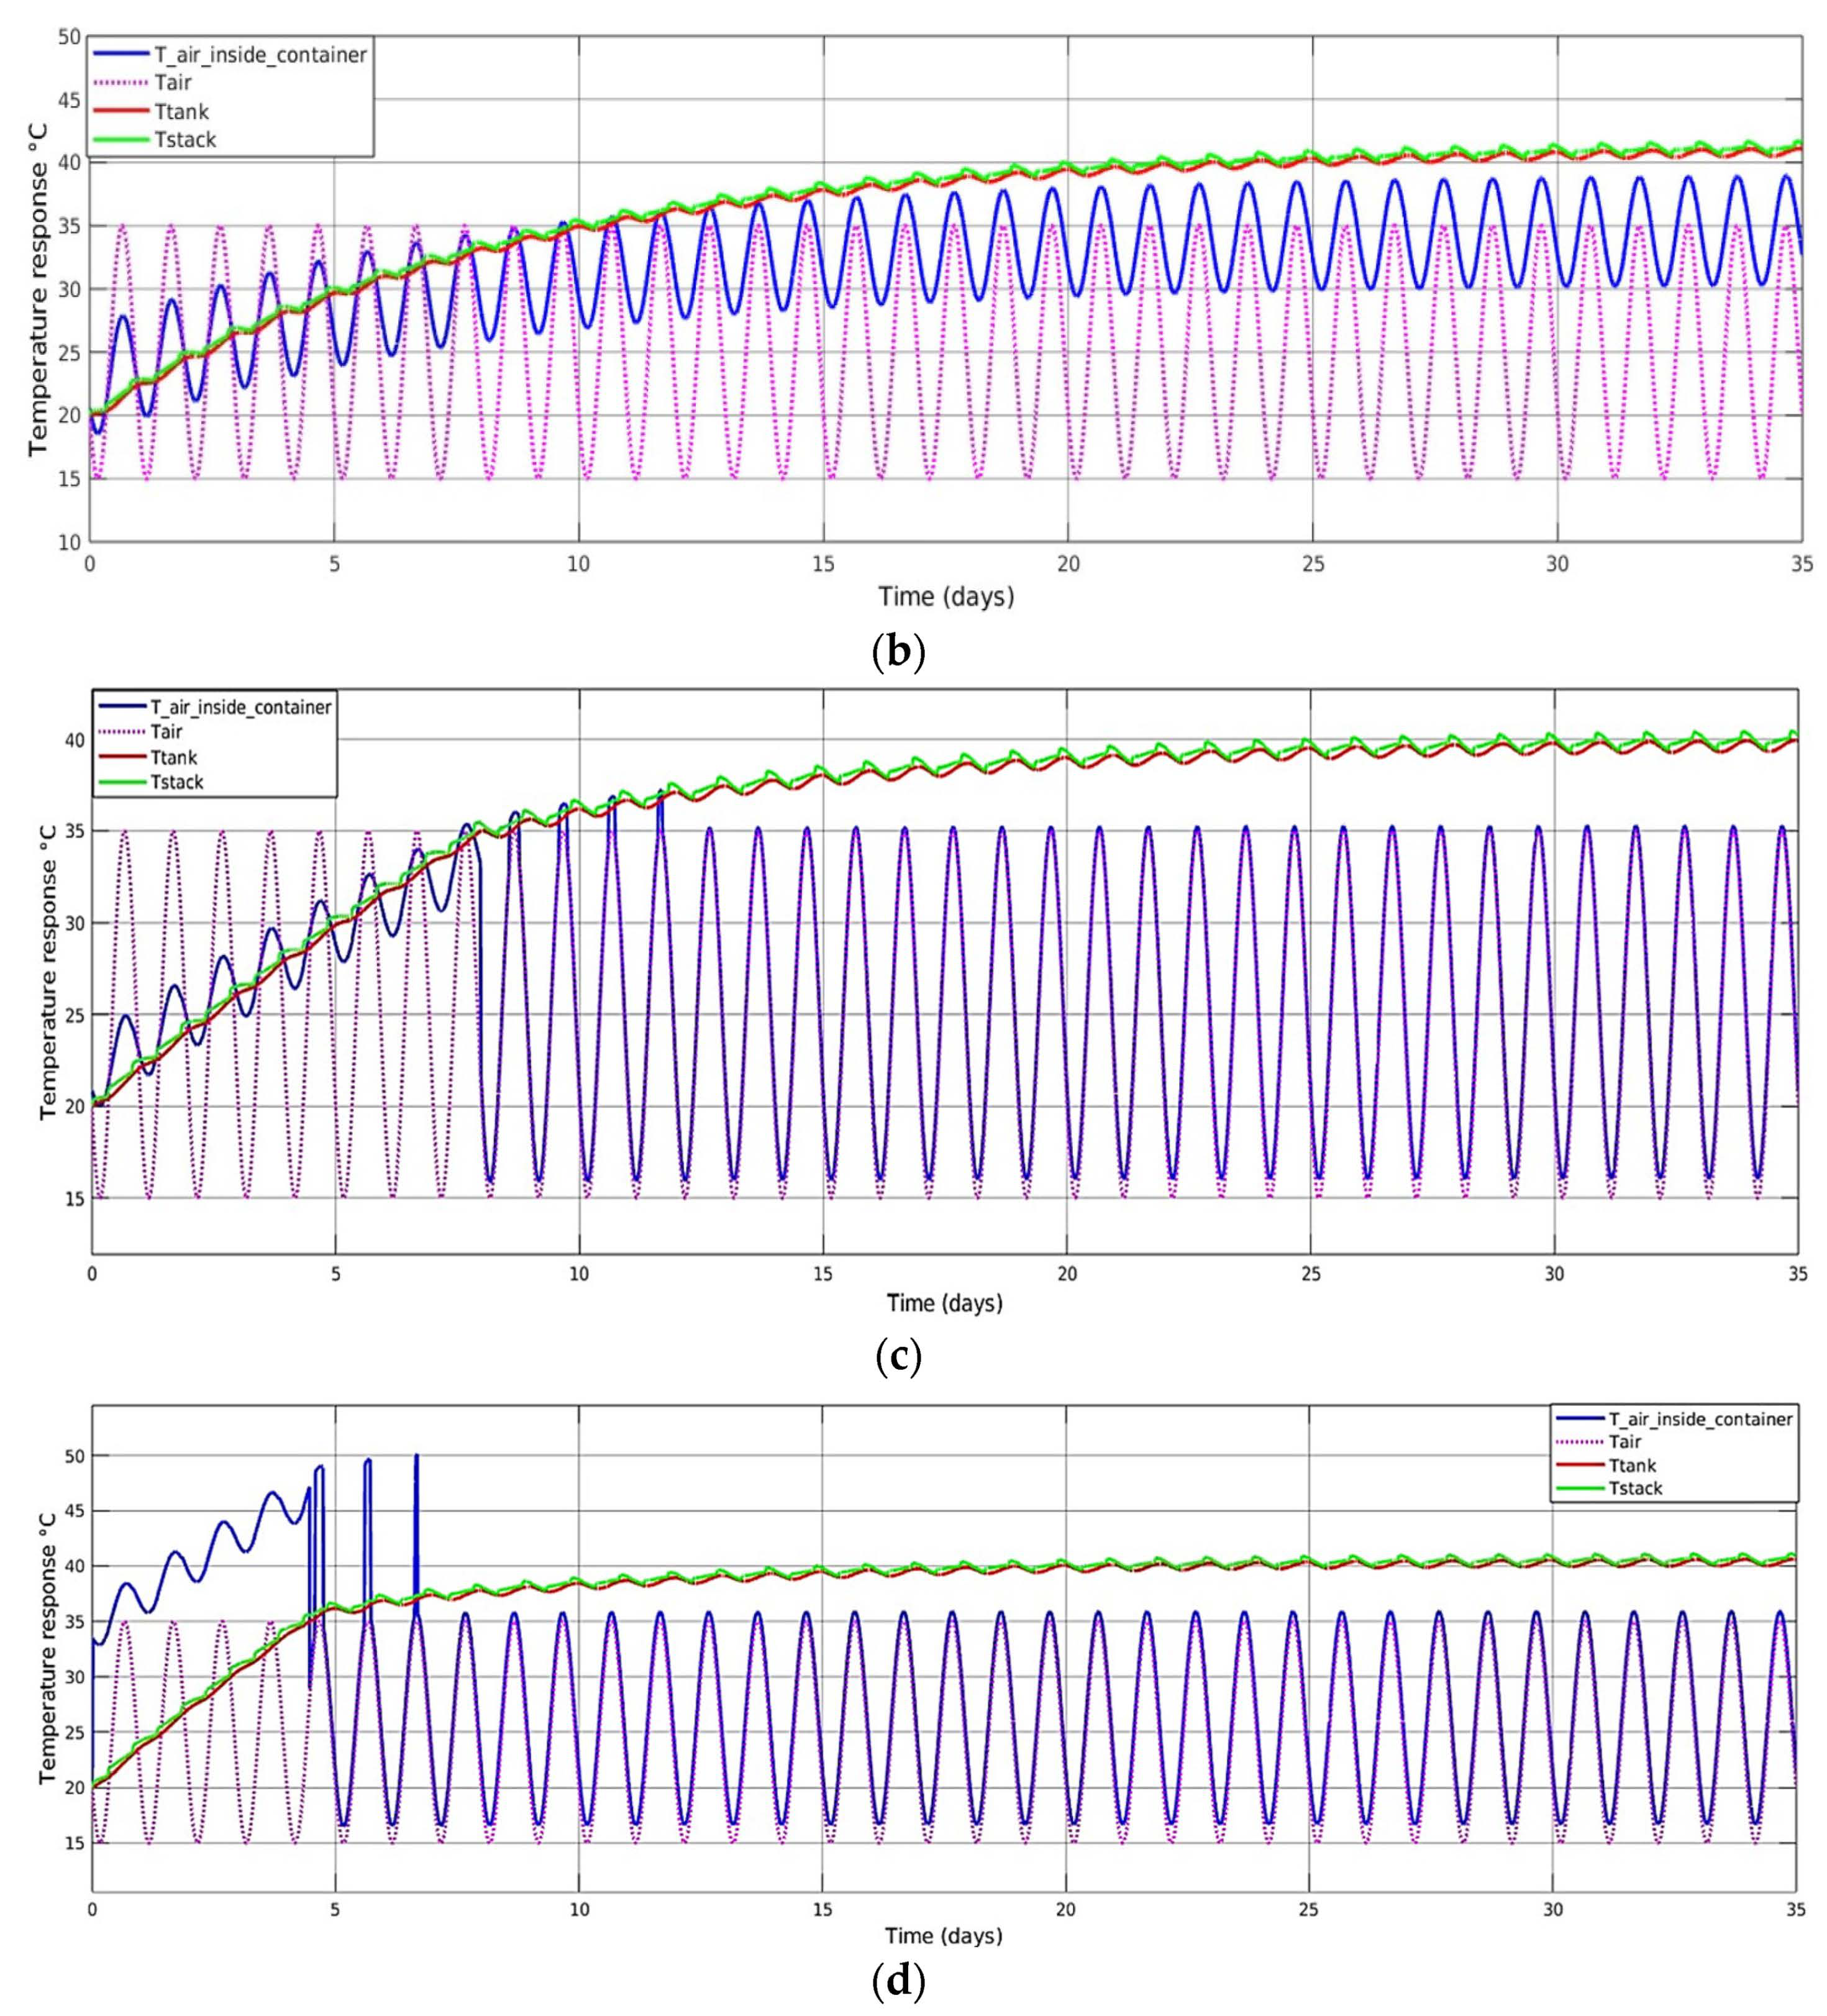
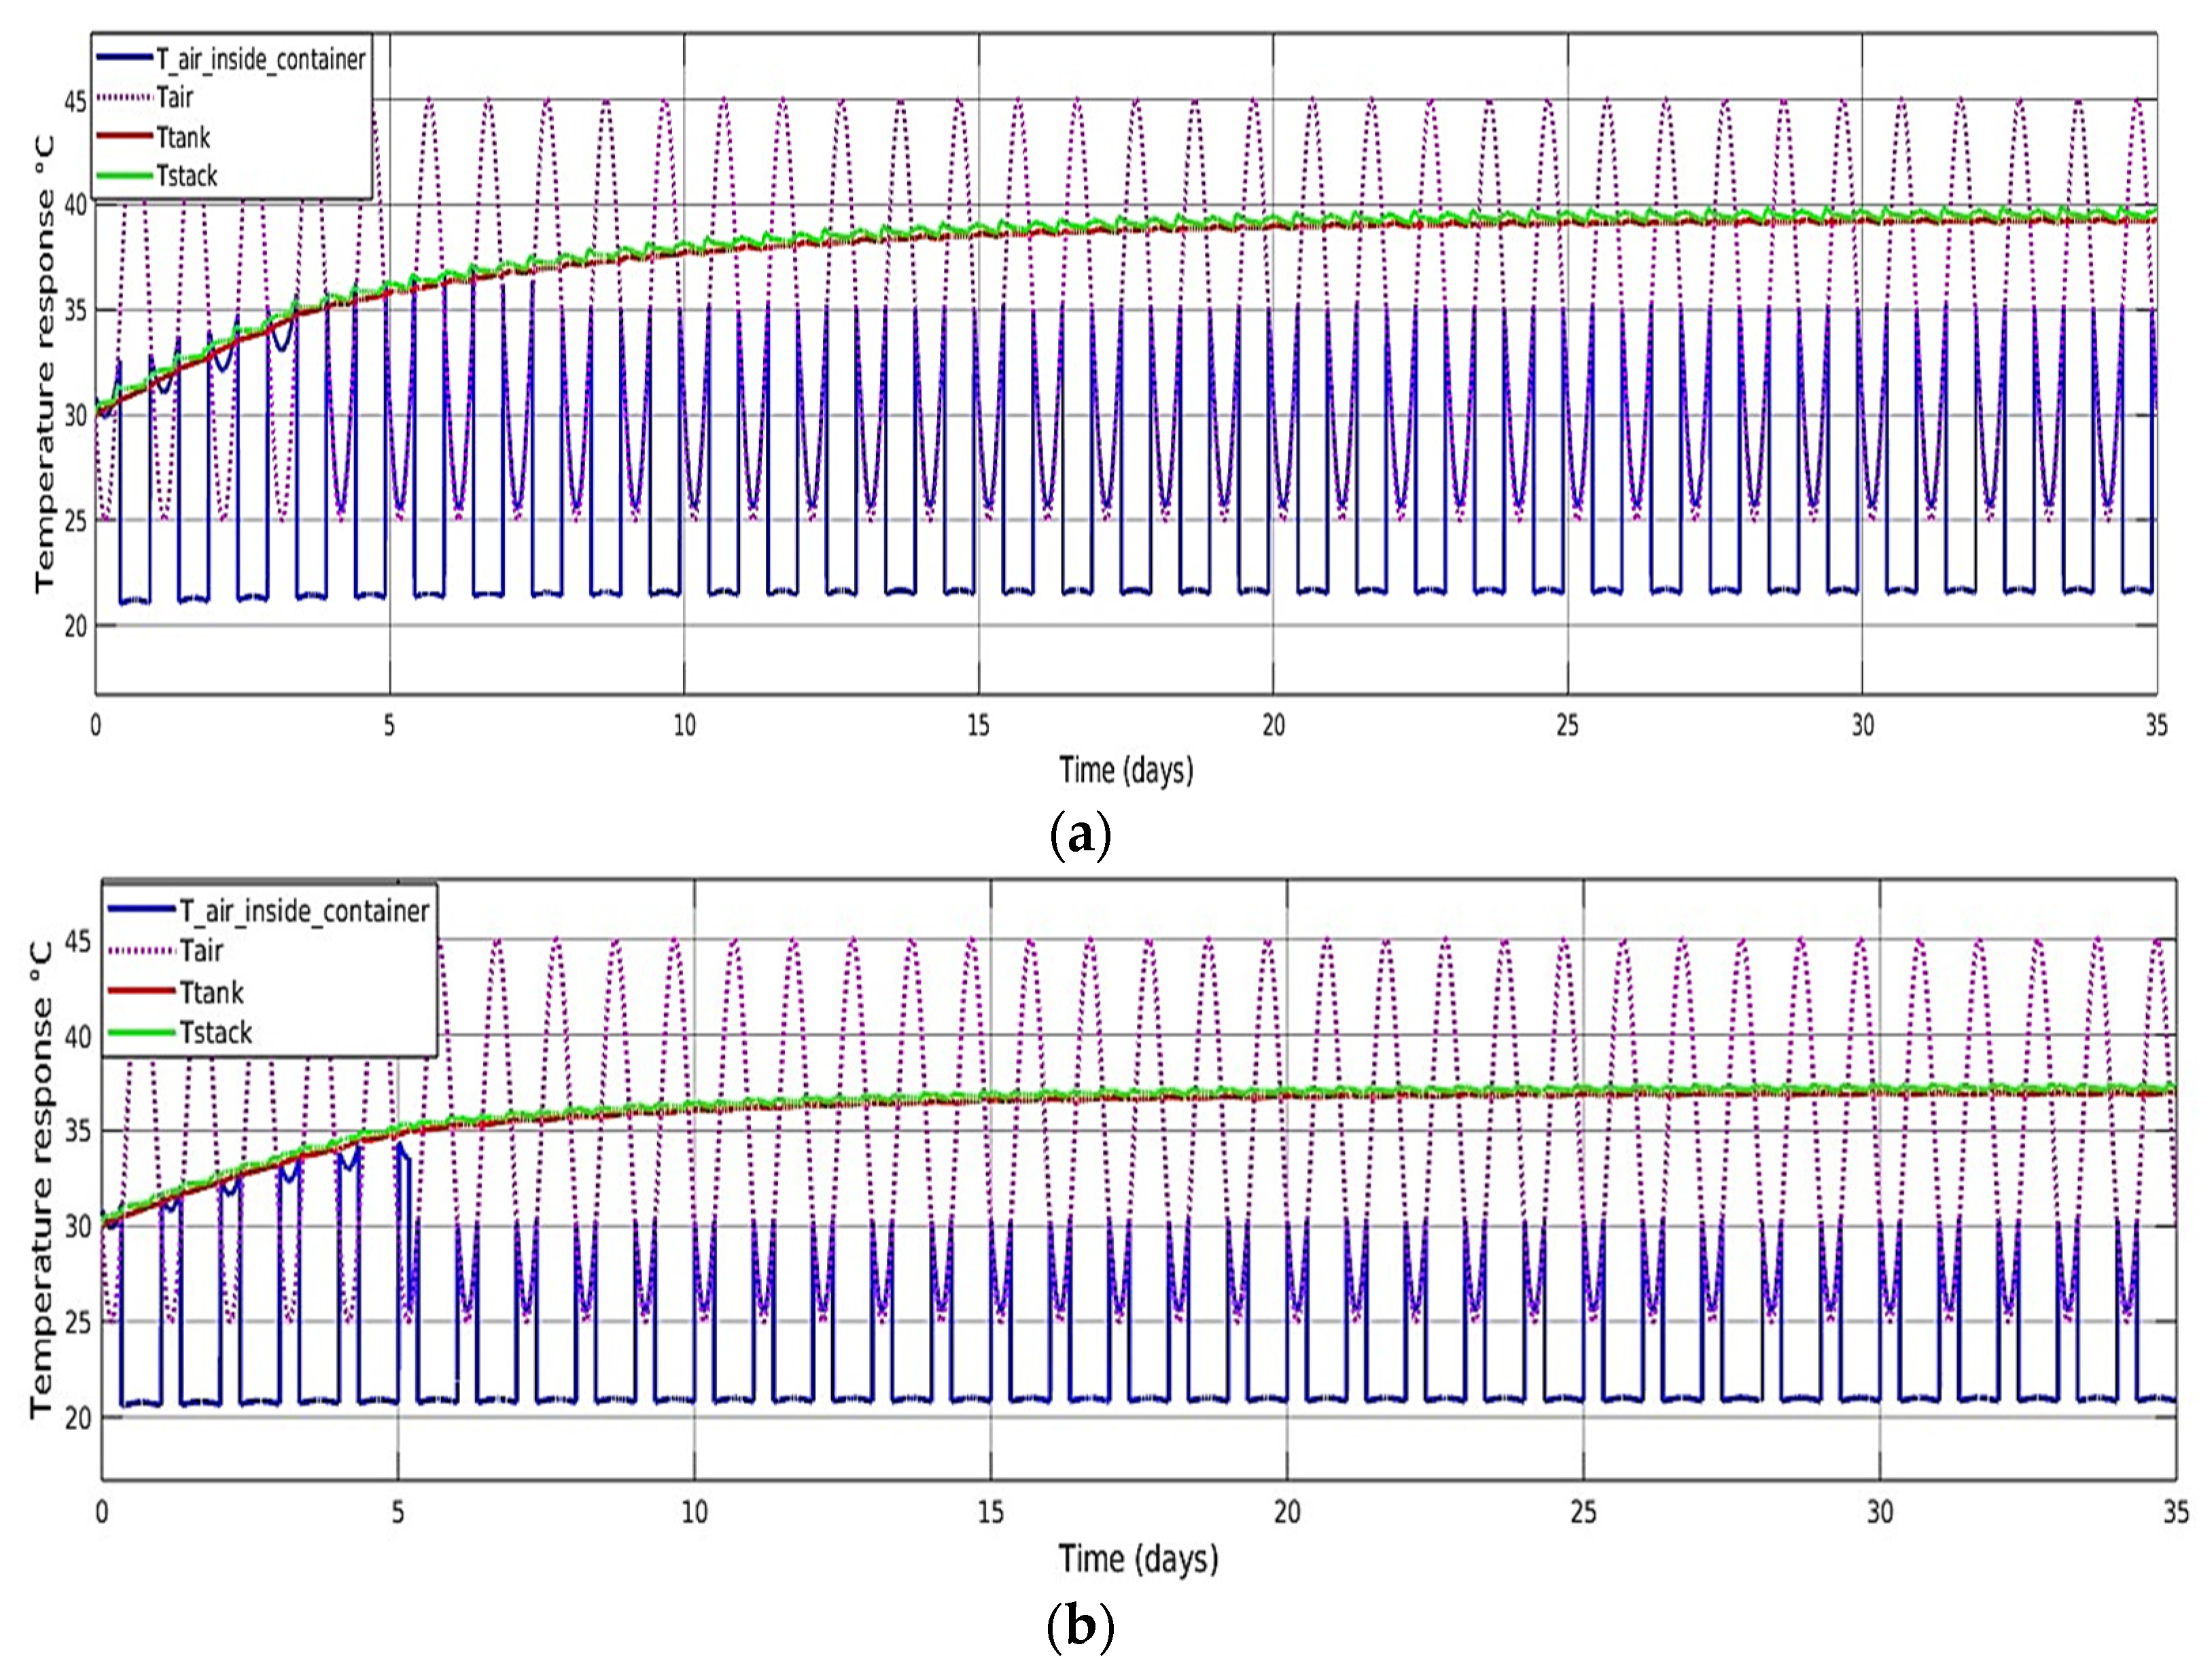
As demonstrated in
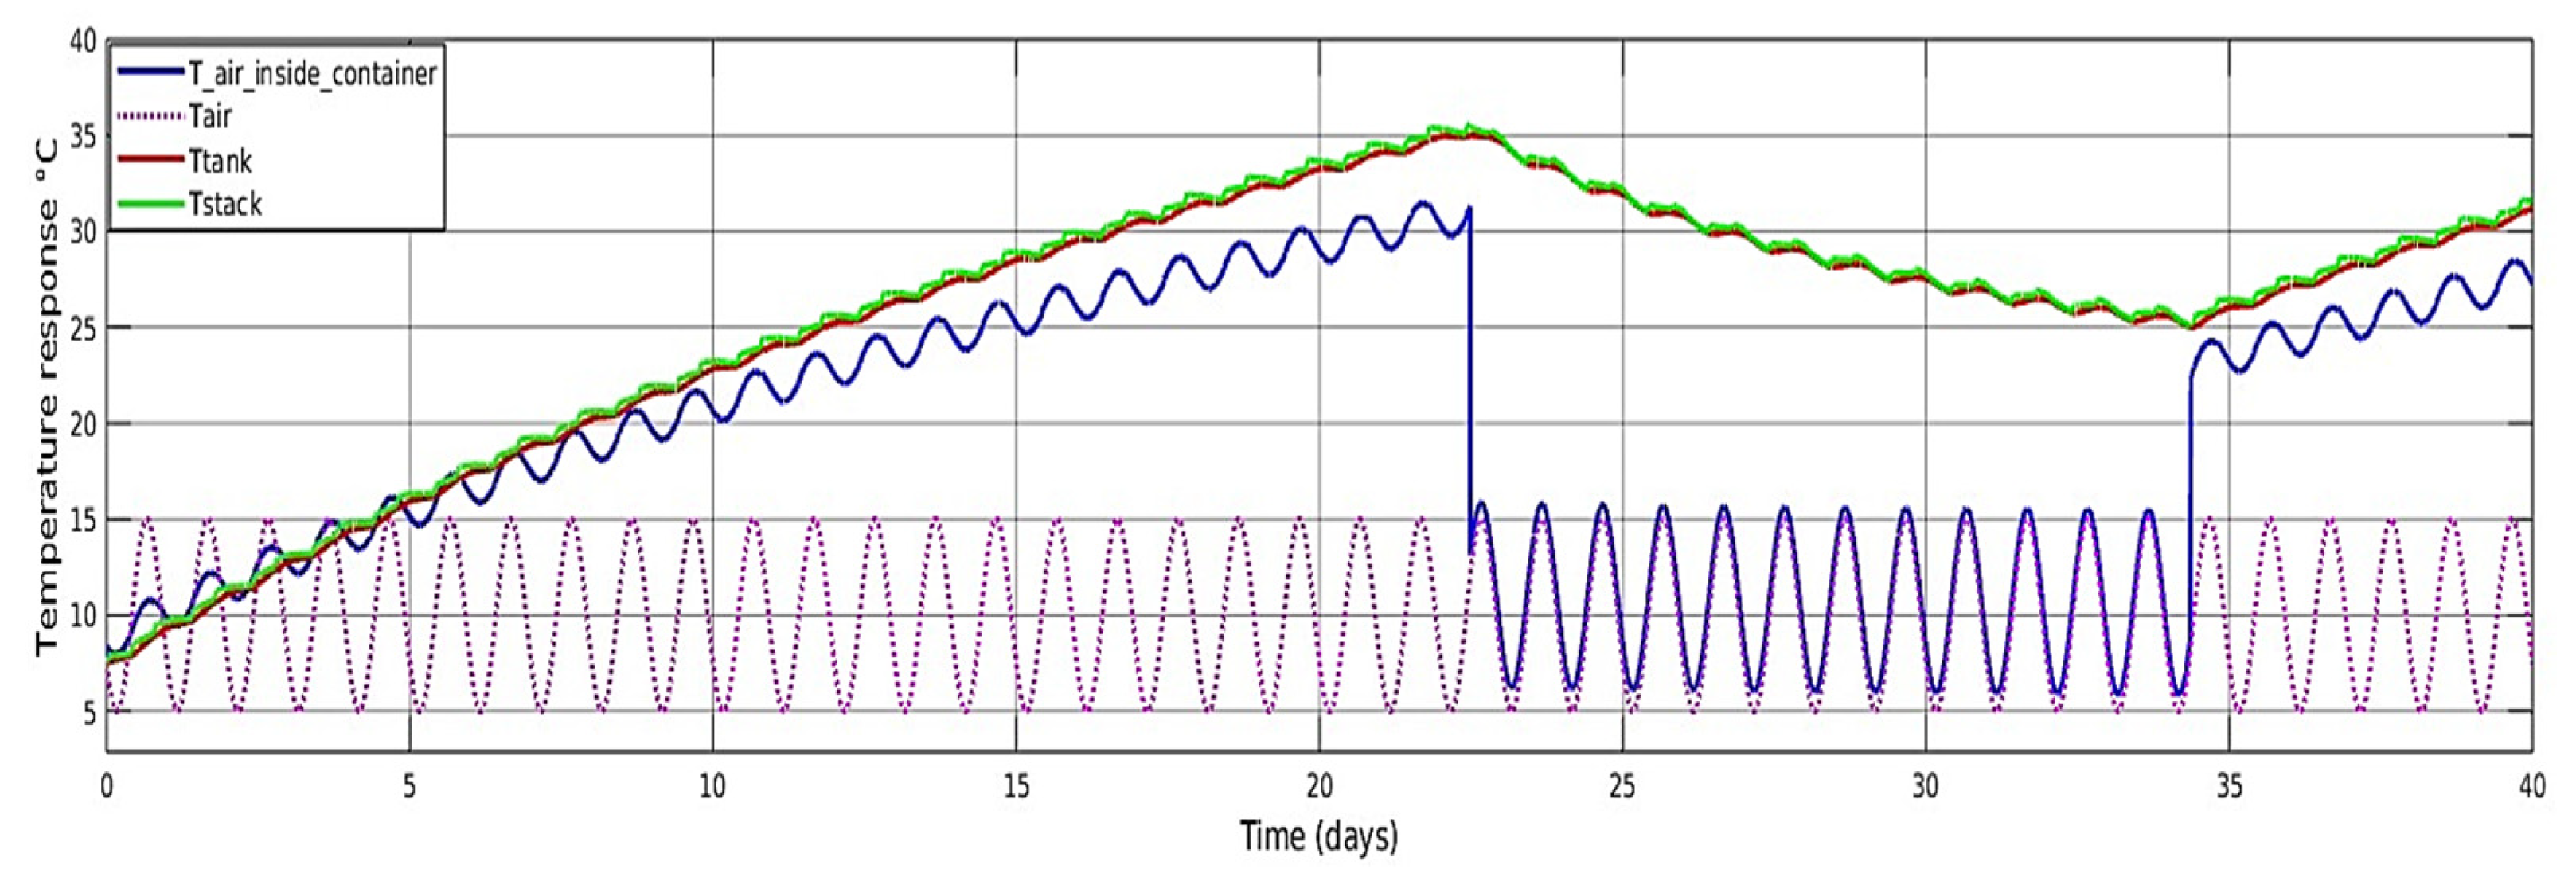
Figure 8, as the charging and discharging current increased, the issue of ohmic heating became increasingly prominent. This resulted in the final temperature of the stack and tank exceeding 40 °C. As illustrated in
Figure 8b, even with the inverter being isolated and without self-discharge, the final temperatures of the stack and tank exceeded 40 °C, which posed a risk of V(V) precipitation in the positive electrolyte. Hence, the implementation of suitable hybrid cooling techniques was necessary to facilitate additional cooling of the stacks and tanks.
For an 8 h containerised VFB system:
Figure 8.
Temperature response for an 8 h containerised VFB using the FAP-450 membrane for ambient temperature between 15 °C and 35 °C: (a) without insulation and fans, inverters are not isolated (); (b) without insulation and fans, inverters are isolated (); (c) with 0.02 m thick polyurethane insulation and passive cooling, inverters are isolated (); (d) with 0.02 m thick polyurethane insulation and passive cooling, inverters are not isolated ().
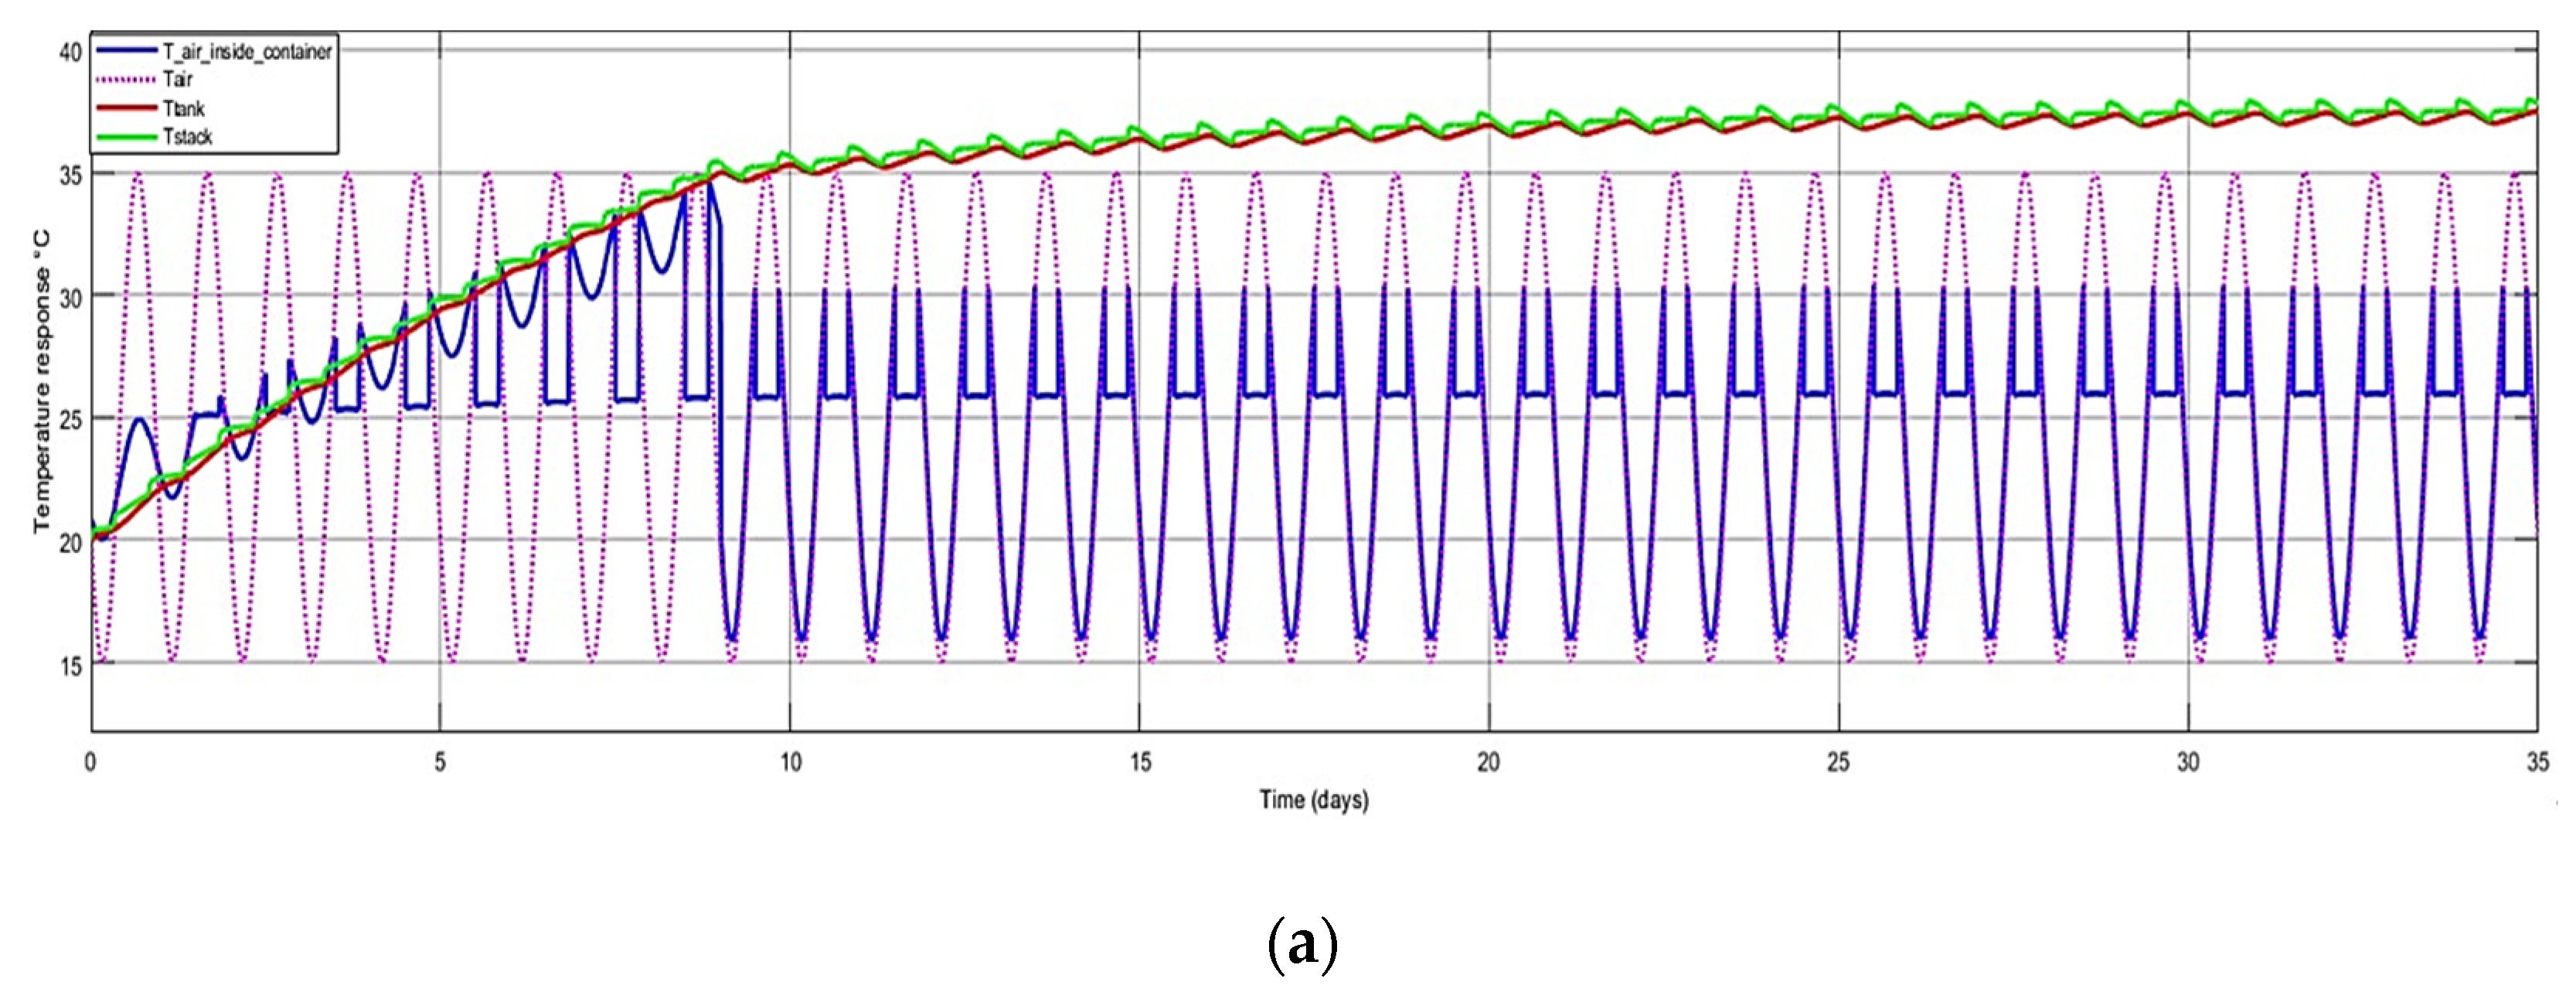
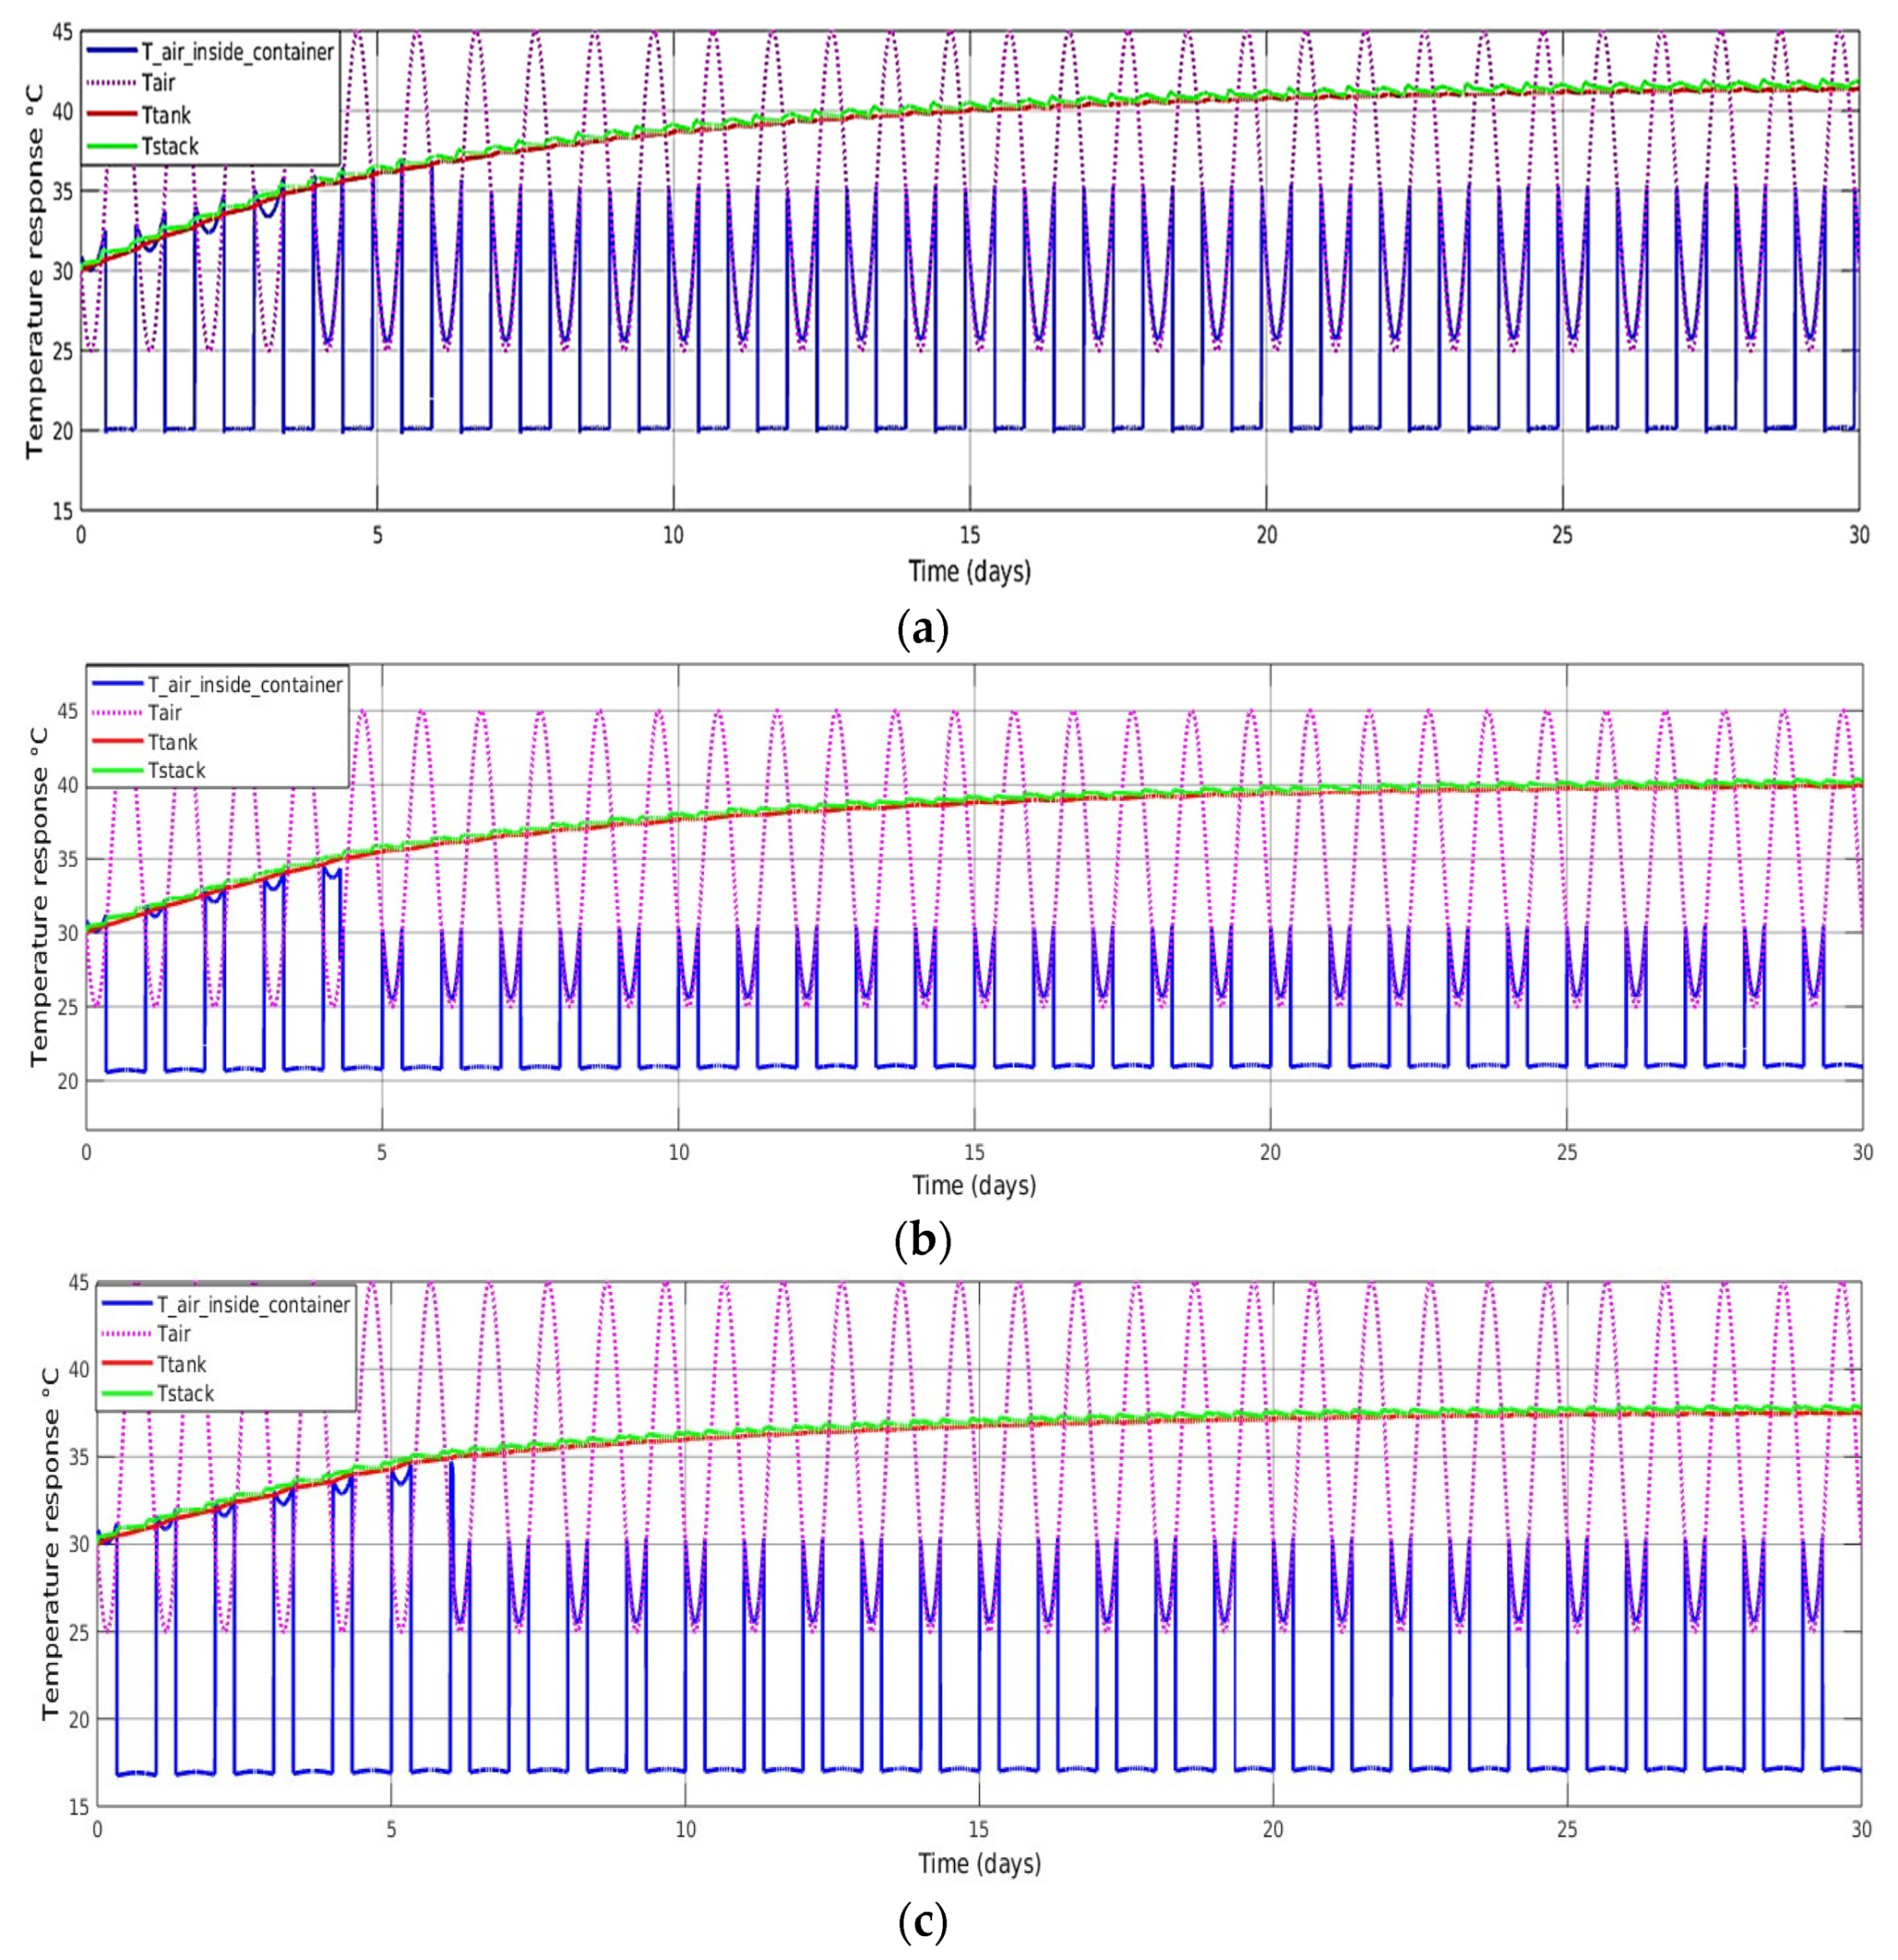
For air conditioning systems, the cooling capacity provided by manufacturers was, in fact, the maximum possible heat removal rate. The power consumption based on this parameter also represented the maximum possible power consumption. This was not a suitable reference for a dynamic model. Additionally, the heat removal rate (kW) was influenced by the temperature difference between the air entering and leaving the air conditioning system. As this study adopted a mixed cooling mode, using the average value to evaluate the power consumption of the air conditioner during operation was more accurate.
Based on the results depicted in
Figure 9, it was evident that an airflow rate of 1.0
was insufficient to attain the desired air temperature of 25 °C inside the container. The final air temperature inside the container was approximately 26 °C. However, the internal temperature was not a matter of concern. The focus was solely on ensuring that the temperature of the electrolyte in the stack and tank remained within the safe operation range.
Because of the set cold air temperature being 25 °C, which was much higher than the assumed minimum cold air temperature, and the operating duration being only 6 hours, the air conditioning system did not operate during the remaining 18 hours of each day. As shown in
Figure 9c,d, the scenarios represented by
Figure 9a,b had an average power consumption of less than 100 W over 30 days. Since the airflow rate in
Figure 9b was lower, its average power consumption was approximately 68 W, as illustrated in
Figure 9d. Additionally, from
Figure 9c,d, it can be observed that the air conditioning systems with 1.0
and 0.2
airflow rates, when set to a cold air temperature of 25 °C for cooling this containerised VFB system, had maximum power consumptions of 973 and 4741 W, respectively. This was similar to the rated power consumption listed in the manufacturer’s product information [
21].
To achieve effective cooling and ensure the proper operation of the battery, a cooling strategy that combined the air conditioning system with a fan-based passive cooling strategy was applied, stabilising the final temperature of the stacks and tanks at approximately 37 °C with an airflow rate of 1.0
(
Figure 9a).
When the airflow rate was reduced to 0.2
(
Figure 9b), the maximum stack temperature reached about 38.9 °C. However, the cooling effect of the air conditioning system was noticeably worse compared to an airflow rate of 1.0
, and the temperature was closer to the critical state. The air temperature inside the container when the air conditioner was turned on was approximately 28 °C. Therefore, it was worth considering increasing the airflow rate appropriately while also considering reducing the power consumption of the air conditioning system. A balance needed to be found between these two factors for this 8 h battery containerised system. The simulation results under two different airflow rates are given because the air conditioning system with an airflow rate between the two was easily found [
21,
22,
23].
As the charging and discharging currents of the 8 h system were significantly higher than those of the 6 h system, the ohmic heating rates of the 8 h battery during charging and discharging processes were 266 and 537 W higher, respectively, compared to the 6 h system. Additionally, the increased electrolyte volume resulted in a larger thermal mass for the 8 h system. These factors collectively contributed to the distinct temperature responses observed between the 6 h and 8 h batteries.
For an 8 h containerised VFB system with feasible hybrid cooling:
Figure 9.
Temperature response for an 8 h containerised VFB using the FAP-450 membrane for ambient temperature between 15 °C and 35 °C with active cooling: (a) air conditioning system opens with an airflow rate of 1.0 , , and , passive cooling applied during the rest of the time every 24 h, with 0.02 m insulation; (b) air conditioning system opens with an airflow rate of 0.2 (200 ), and , passive cooling applied during the rest of the time every 24 h, with 0.02 m insulation; (c) power consumption under (a) condition; (d) power consumption under (b) condition.
3.7.2. Case 2: Temperate Climate—Normal Winter
In many temperate regions of the world, the temperature during winter is between 5 °C and 15 °C. These include tropical, subtropical monsoon climates or Mediterranean climates. In some high-latitude regions, this temperature range can also be observed during summers. Because of the reduced daylight hours in temperate regions during winter compared to temperate or hot summers, we could not apply the load profile from
Figure 1 and
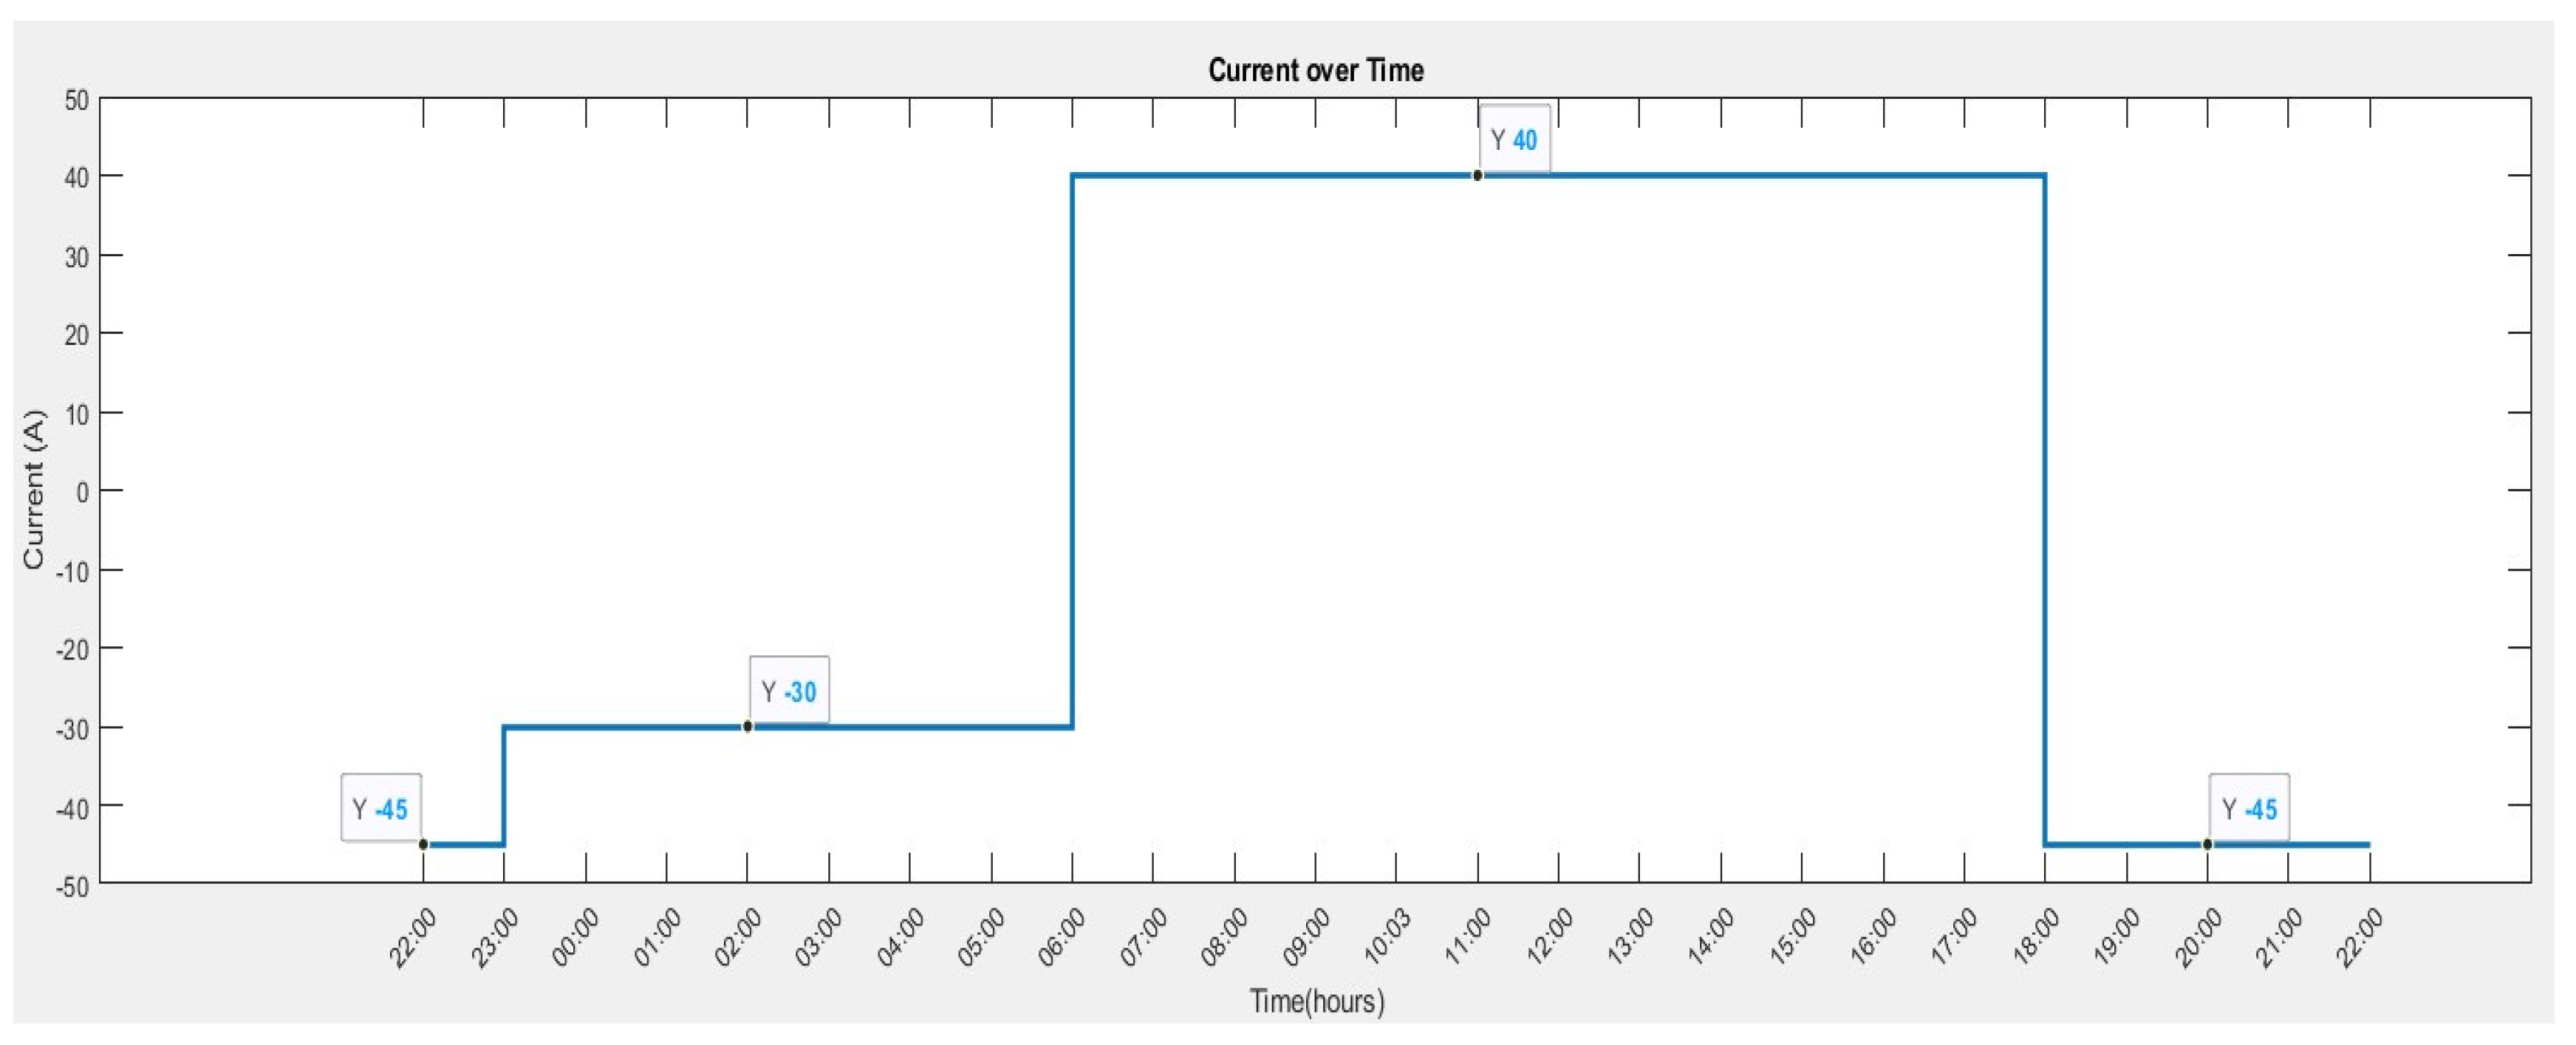
Figure 2 to this scenario. In addition, typical winter daylight hours in these regions typically fall between 8 am and 5 pm, so charging can only occur during these times. Consequently, for both 6 and 8 h batteries, their charging current will increase to accommodate the shorter daylight duration. Furthermore, before the peak electricity demand arrives around 6 pm, most appliances in residential buildings are in standby mode. Therefore, during this time period, the batteries should operate in a low current discharge mode as reflected in the proposed load profile presented in
Figure 3 and
Figure 4.
As shown in
Figure 10 and
Figure 11, when the ambient temperature was between 5 °C and 15 °C and insulation was applied with a shorter daytime, the final temperature of the stack and tank in both the 6 h and 8 h systems could still be stabilised at no more than 35 °C using only passive cooling. Because of the shorter daytime, charging currents rose to 40 and 55 A for the 6 h and 8 h systems, respectively. It can also be seen from the figure that the temperature of the stack and tank in the 8 h system increased more quickly. Because of the higher efficiency of passive cooling at a lower ambient temperature and control logic threshold settings, the stack and tank temperature can be seen to switch between 25 °C and 35 °C in these two figures. Consequently, active cooling was deemed unnecessary for this scenario when operating the 6 h or 8 h containerised VFB system.
For a 6 h containerised VFB system (30 kW–180 kWh):
Figure 10.
Temperature response of a 6 h system with only passive cooling, with 0.02 m thick polyurethane insulation material when the ambient temperature ranges from 5 °C to 15 °C, .
Figure 10.
Temperature response of a 6 h system with only passive cooling, with 0.02 m thick polyurethane insulation material when the ambient temperature ranges from 5 °C to 15 °C, .
For an 8 h containerised VFB system (30 kW–240 kWh):
Figure 11.
Temperature response of an 8 h system with only passive cooling, with 0.02 m thick polyurethane insulation material when the ambient temperature ranges from 5 °C to 15 °C, .
Figure 11.
Temperature response of an 8 h system with only passive cooling, with 0.02 m thick polyurethane insulation material when the ambient temperature ranges from 5 °C to 15 °C, .
3.7.3. Case 3: Extremely Cold Region Winter Climate
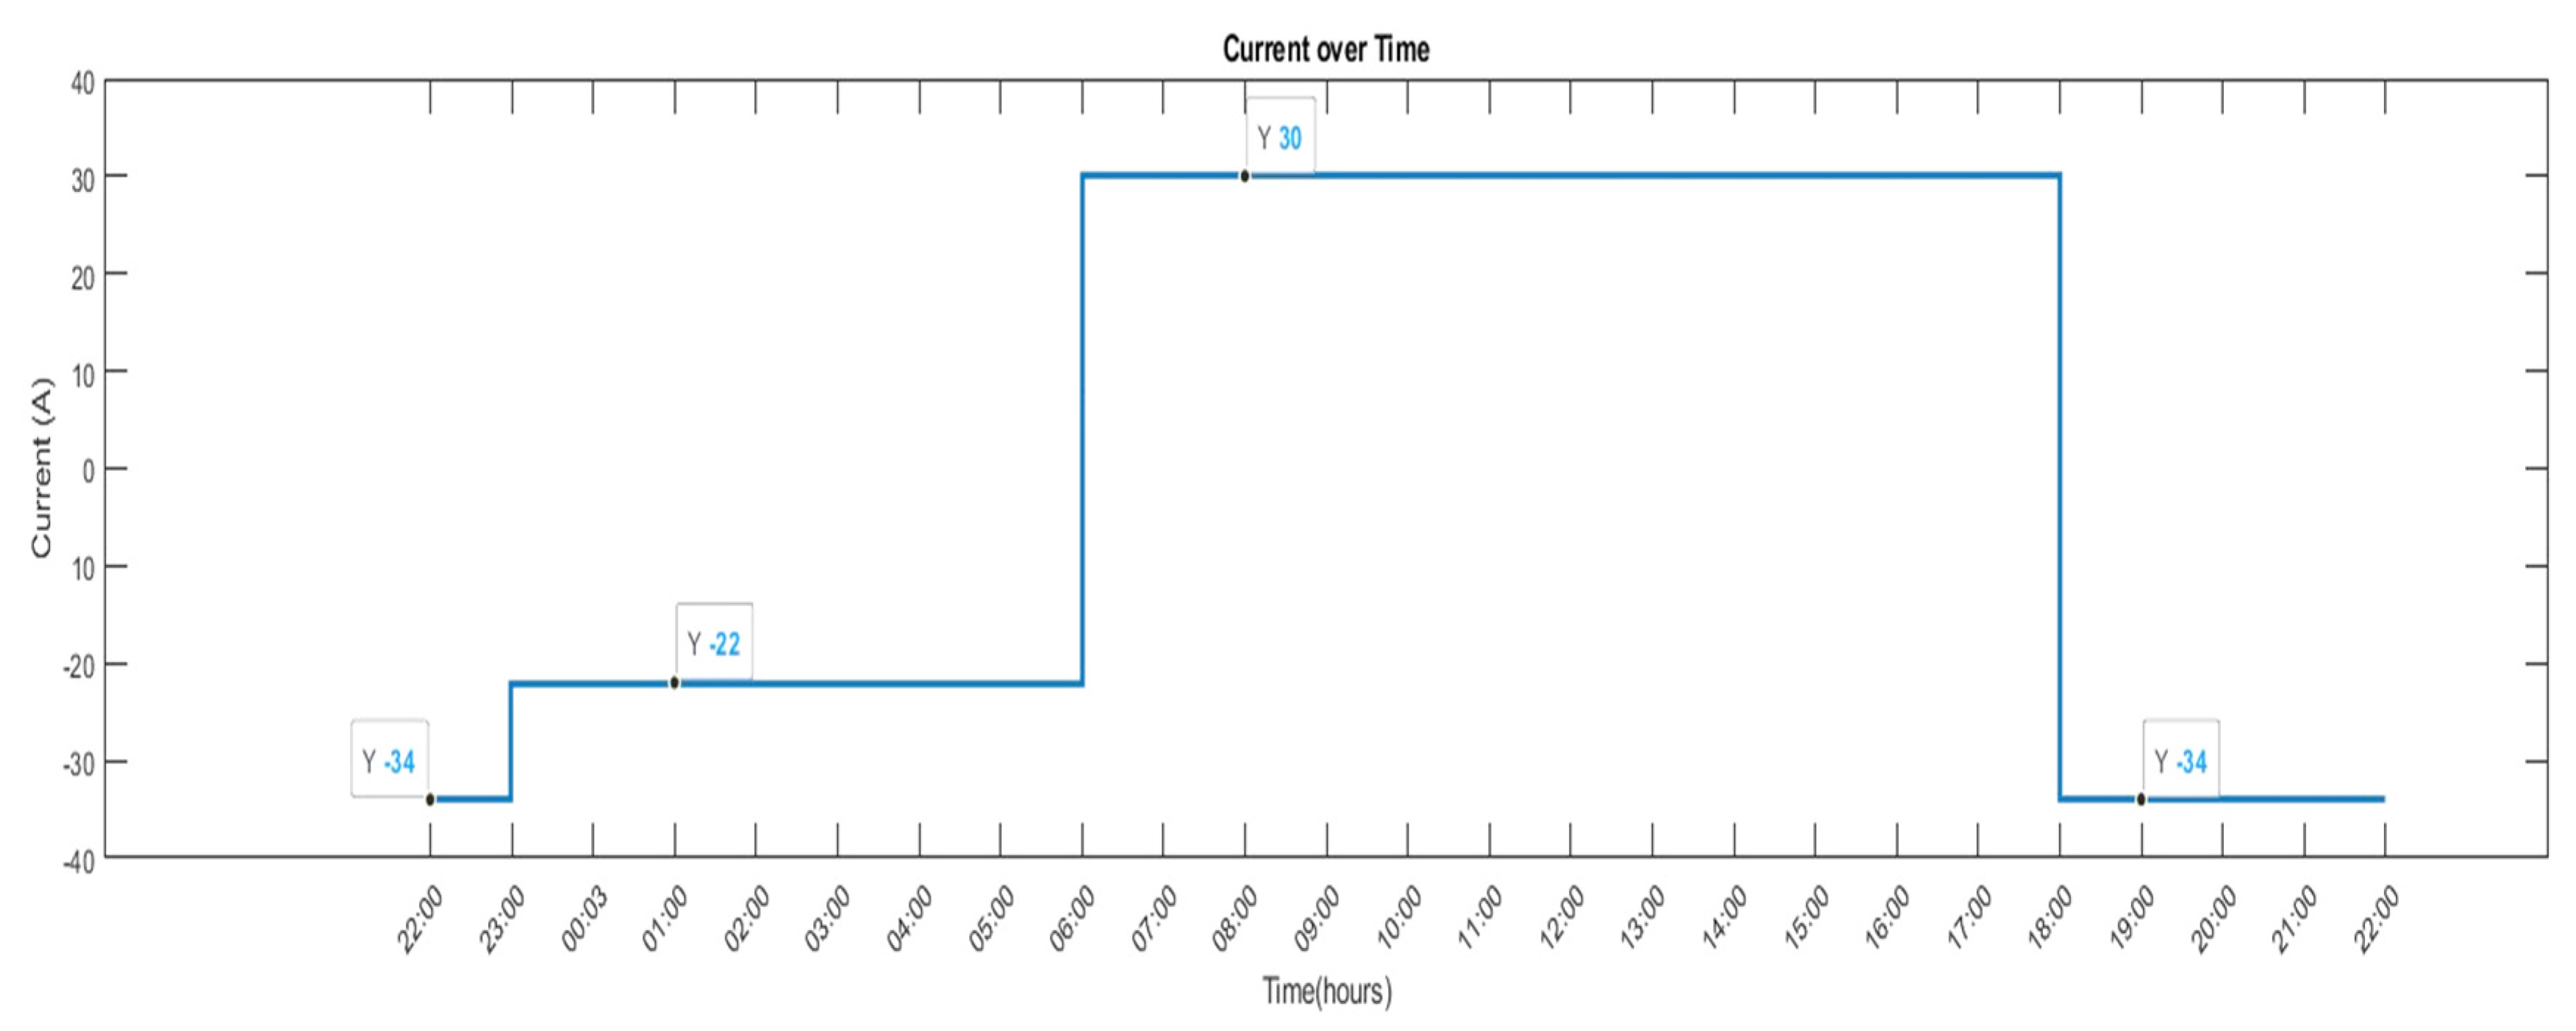
In high-latitude countries and regions, winter brings shorter daylight hours, and some may even experience polar nights. These areas typically exhibit sub-frigid coniferous forest climate, cold zone climate, or tundra climate, characterised by temperatures ranging below −10 °C. During the simulation, passive and active cooling were disabled, and initial temperature was set at 20 °C. Because of the shorter daylight hours in winter in high-latitude regions, the winter daylight duration is much shorter than the normal winter scenario. The ambient temperature profile of the coldest day in Edmonton (Canada) [
24] during December 2022 was chosen in the simulation, and daytime is typically between 9 am and 4 pm. This implied that batteries required a higher current in charging mode compared to the normal winter scenario. For the record, the temperature range was between −25 °C and −34 °C. From
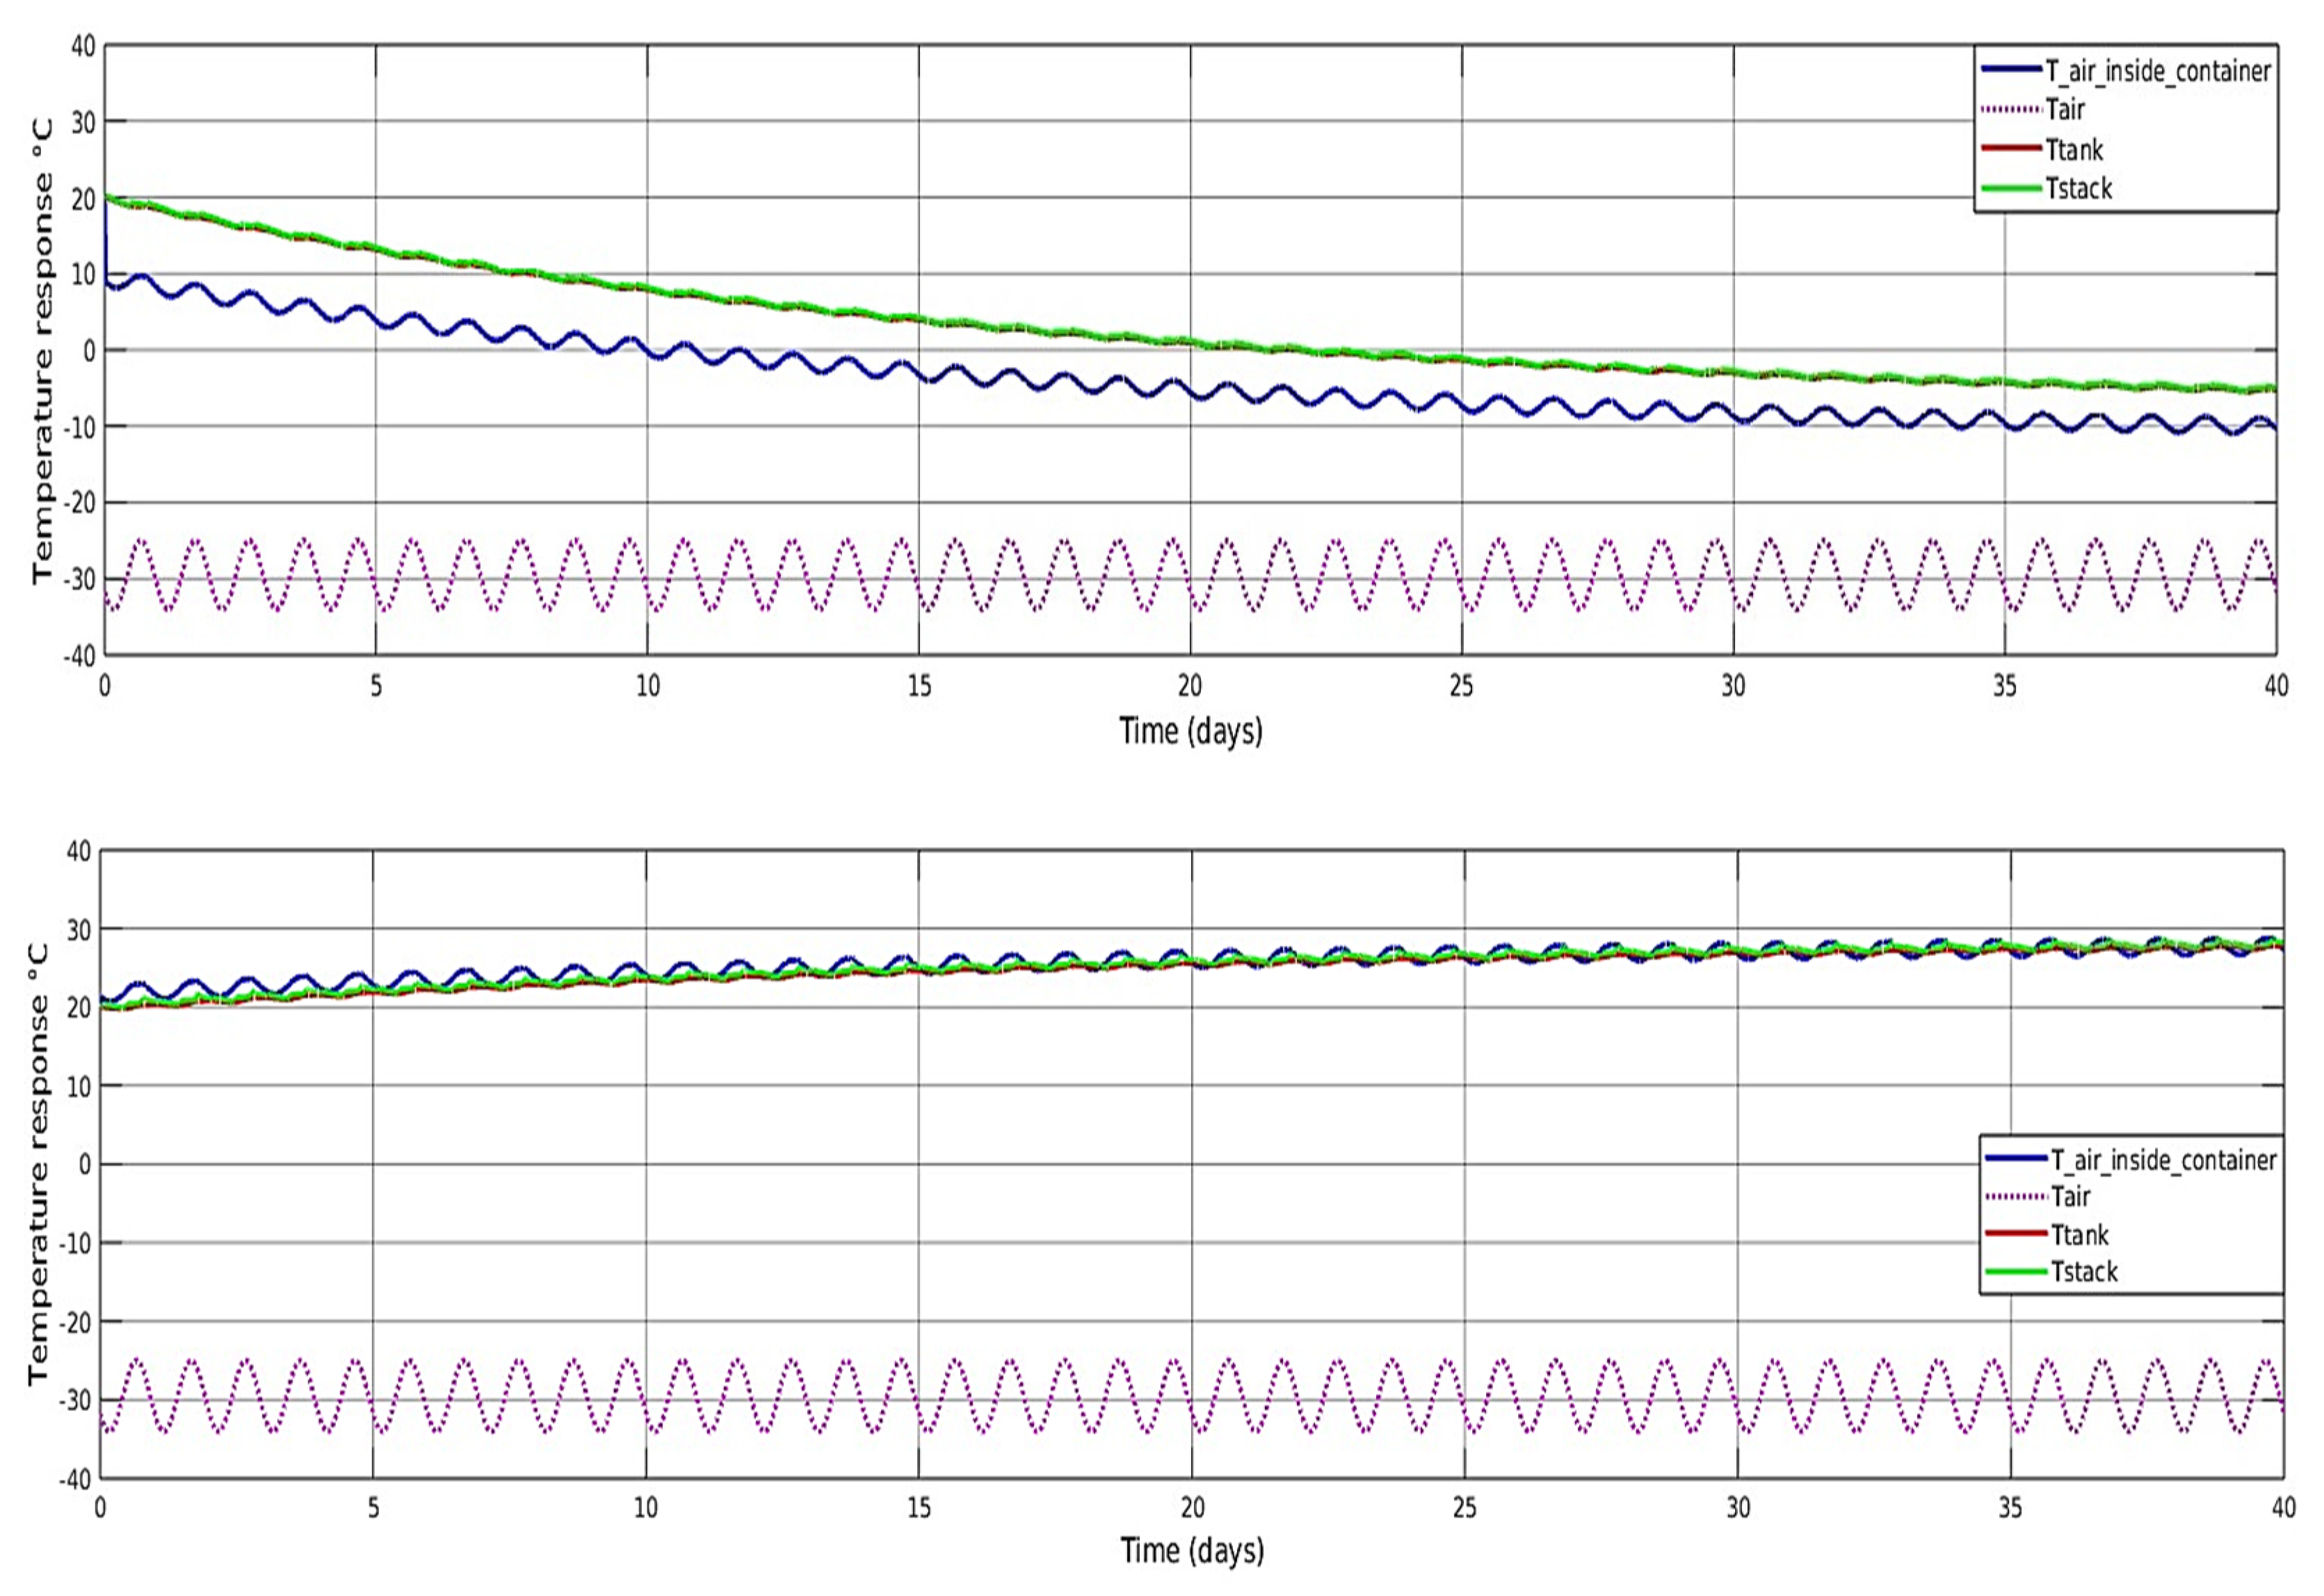
Figure 12 (top), when the inverters were isolated from the container, the 6 h system demonstrated a significant decrease in the stack and tank temperature, stabilising at below 0 °C. Consequently, in such a situation, the electrolyte is highly susceptible to freezing.
Figure 12 (bottom) illustrates that the stack and tank temperature for a 6 h containerised VFB system could be sustained at approximately 29.5 °C by incorporating inverters into the container. In this instance, the inverters also served as heaters to warm the interior environment of the container. As a result, the utilisation of inverters can reduce the requirement for active heating, resulting in energy cost savings for 6 h containerised VFB systems.
For a 6 h containerised VFB system (30 kW–180 kWh):
Figure 12.
Temperature response of a 6 h system without any cooling, with 0.02 m thick polyurethane insulation material when the ambient temperature ranges from −34 °C to −25 °C, (top) , (bottom) .
Figure 12.
Temperature response of a 6 h system without any cooling, with 0.02 m thick polyurethane insulation material when the ambient temperature ranges from −34 °C to −25 °C, (top) , (bottom) .
As seen in
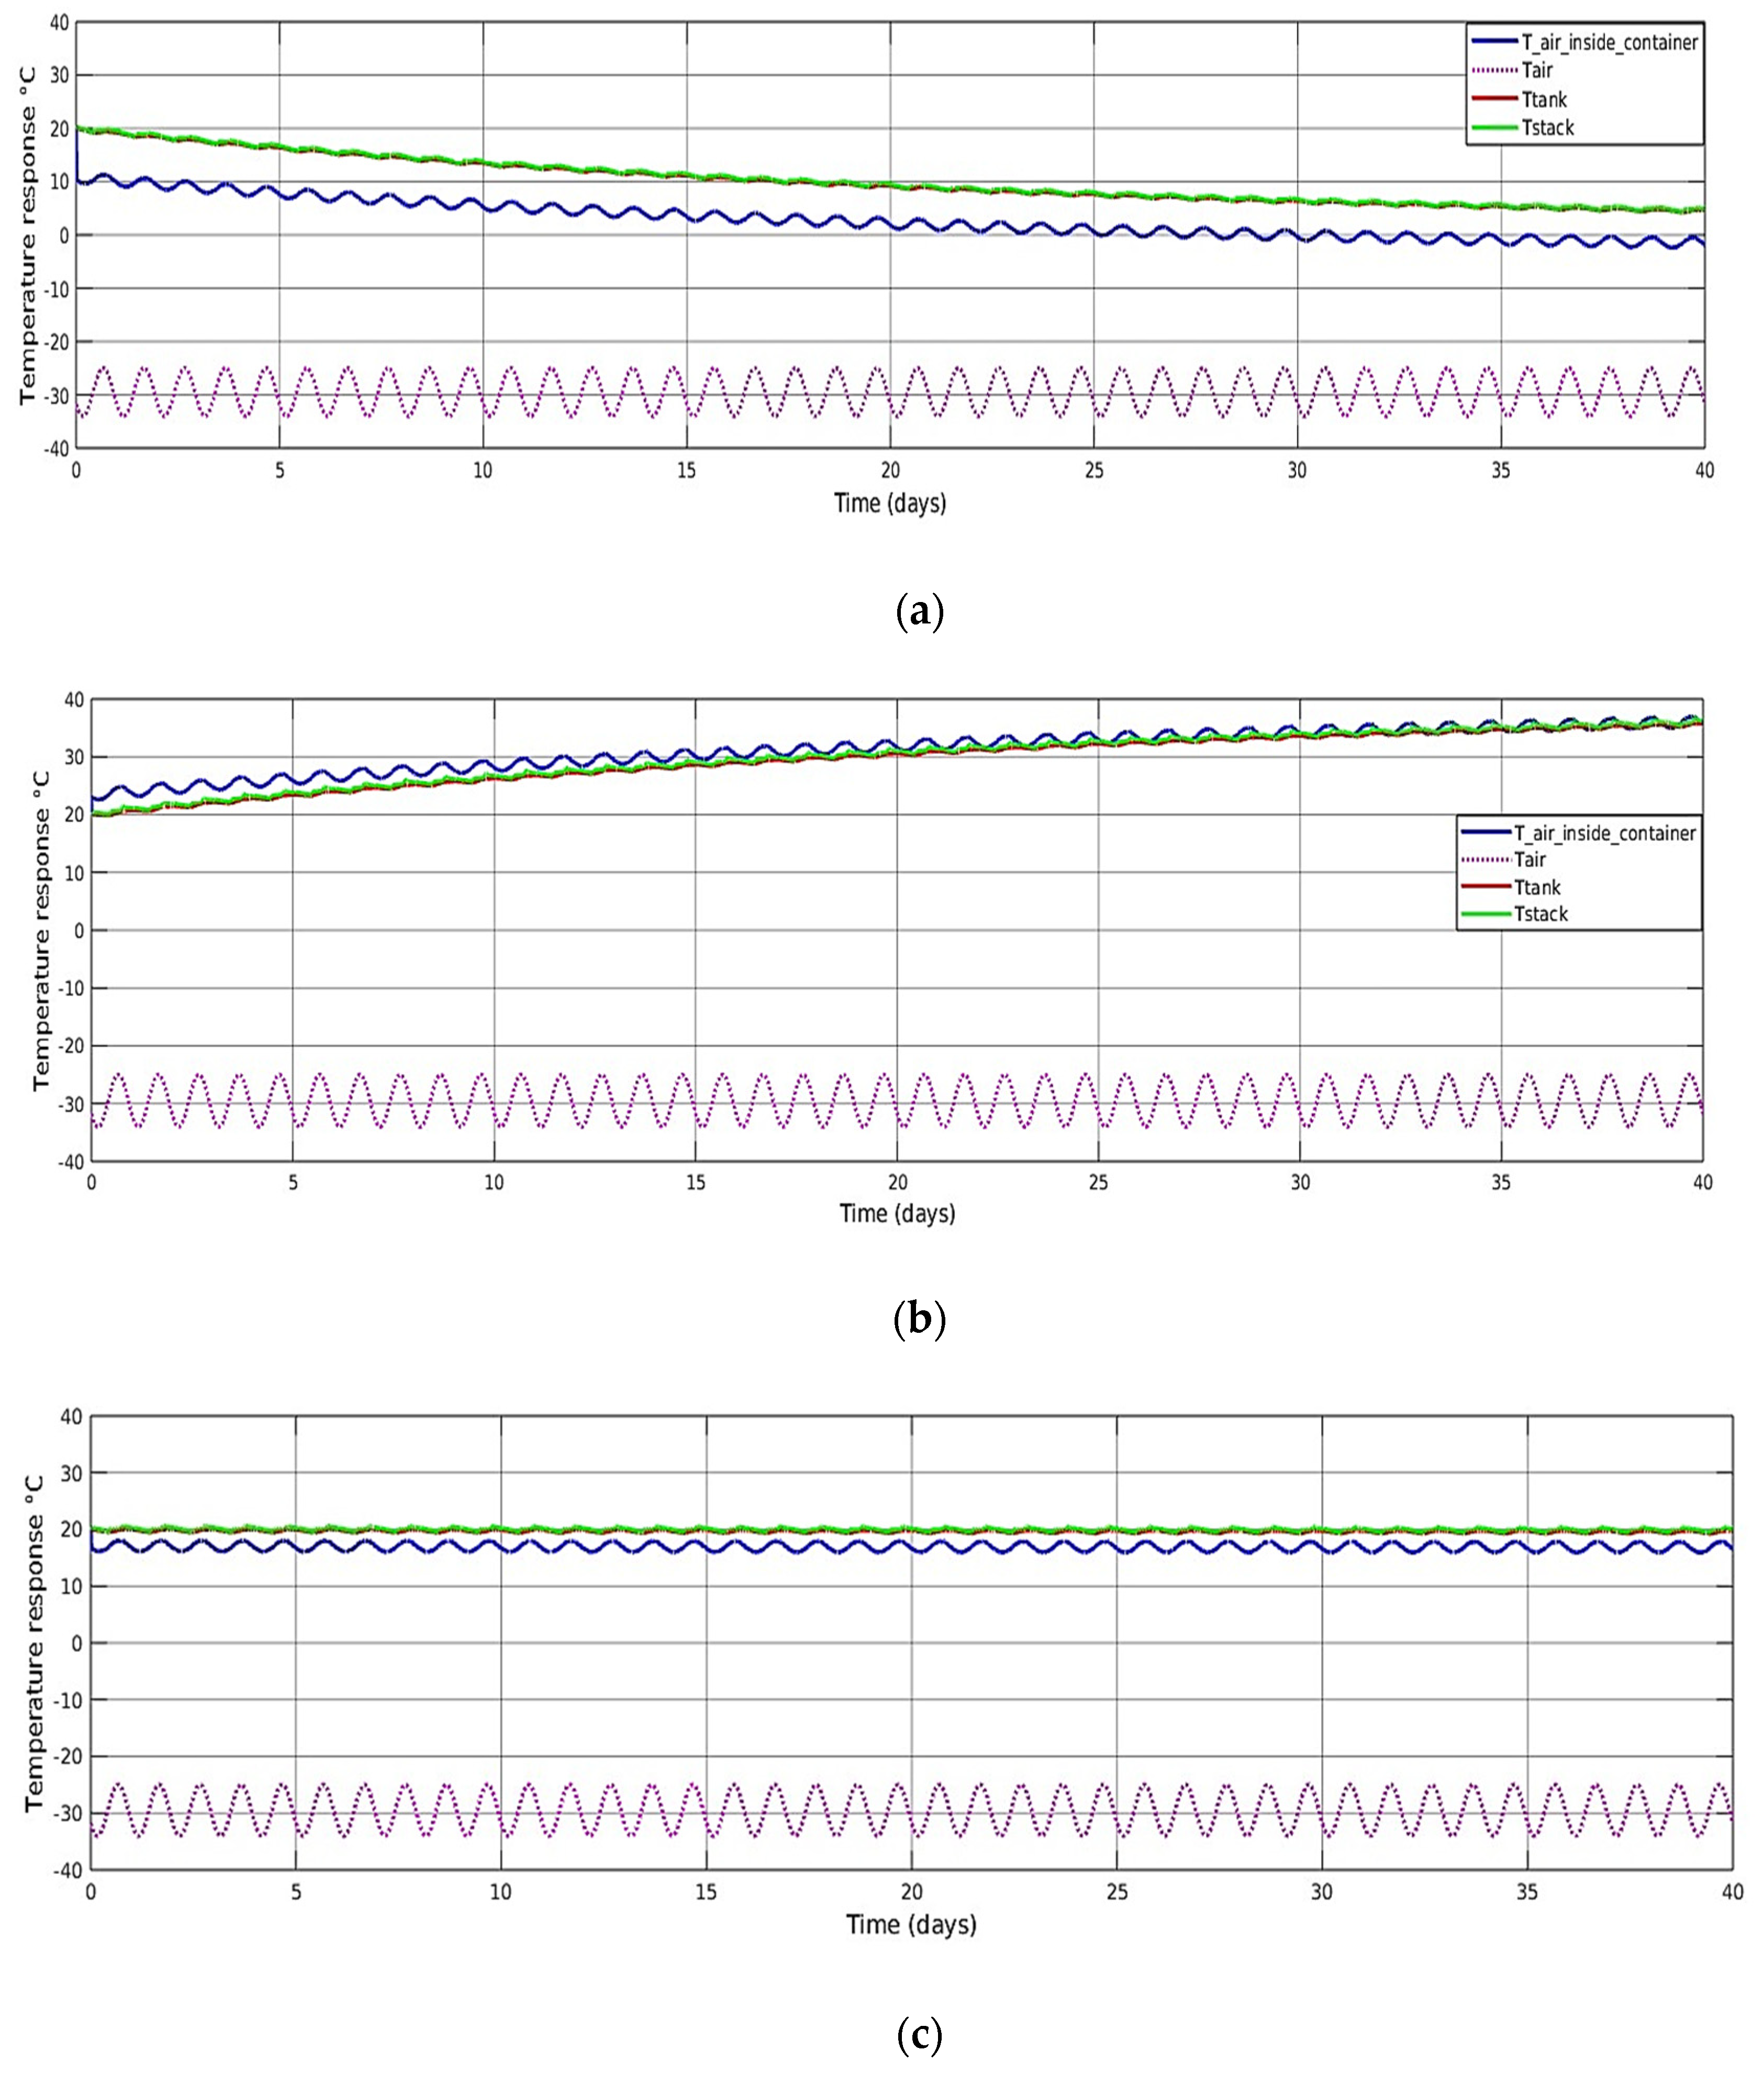
Figure 13a, by isolating inverters from the inner environment of the container, the stack and tank temperatures eventually stabilised at a value of 5 °C. This indicated that under this scenario, the vanadium electrolyte was at risk of reaching its freezing point.
Figure 13b illustrates the temperature response of the stack and tank when inverters were not isolated. In this scenario, the temperature of the stack and tank stabilised at around 38.5 °C at the end of the 40-day simulation, which was quite close to 40 °C, with a tendency to continue rising. Consequently, it is recommended that the inverter should be partially isolated from the inner environment of the container in such situations to maintain safe operation.
Figure 13c illustrates the temperature response of the stack and tank when half of the inverters were isolated, and the other half were not isolated. The stack and tank temperature eventually stabilised at around 20 °C. This suggested that for high-latitude regions, it is still possible to maintain the crucial components within the container at a safe operating temperature without the use of cooling or heating equipment, simply by accommodating a portion of the inverters inside the container.
Compared to the temperature response of a 6 h battery under the same ambient temperature conditions, the 8 h battery exhibited this temperature response owing to the increase in the charging current, resulting in higher ohmic heating. In comparison to the 6 h battery, the ohmic heating of the 8 h battery was approximately 756 W greater during charging and about 392 W higher during discharging. Moreover, since the 8 h battery had a larger electrolyte volume, its thermal mass was also much greater compared to the 6 h battery. As a result, the stack and tank temperature of the 8 h battery displayed this particular trend.
For an 8 h containerised VFB system (30 kW–240 kWh):
Figure 13.
Temperature response of an 8 h system without any cooling, with 0.02 m thick polyurethane insulation material when the ambient temperature ranges from −34 °C to −25 °C: (a) ; (b) ; (c) (half of the number of inverters are isolated).
Figure 13.
Temperature response of an 8 h system without any cooling, with 0.02 m thick polyurethane insulation material when the ambient temperature ranges from −34 °C to −25 °C: (a) ; (b) ; (c) (half of the number of inverters are isolated).
3.7.4. Case 4: Hot Arid Climate
Under identical ambient temperature conditions and without insulation, the final temperature of the stacks and tanks proposed in [
4] for a 30 kW–130 kWh system was observed to exceed 40 °C. As a result, to ensure the secure functioning of the containerised VFB system, introducing active cooling was imperative.
For a 4 h battery operating in an environment with temperatures between 25 °C and 45 °C, passive cooling was insufficient to maintain stack and tank temperatures below 40 °C. Therefore, for a 6 h containerised VFB system, active cooling must be used to further reduce the temperature of the stacks and tanks. As shown in
Figure 14a, when an air conditioning system with a flow rate of 1.0
was activated during the hottest 12 h of the day and passive cooling was used for the remaining 12 h, the stack and tank temperature levelled around 39.9 °C. Thus, there was still a risk of electrolyte precipitation.
Figure 14b depicts the simulation results when the air conditioning system operated for 16 h, while all other conditions remained unchanged. This implied that the air conditioning system would be active during the hottest 16 h of the day, and passive cooling would be employed for the remaining time. The results showed that the final temperature of the stacks and tanks was approximately 36.5 °C. This significantly ensured the safe operation of the battery system and maintained relatively low power consumption. This setting provided a certain temperature buffer to keep the battery functioning properly, even if extreme environmental temperatures occurred during certain periods.
For a 6 h containerised VFB system with feasible hybrid cooling:
Figure 14.
(a) Air conditioning system opens if necessary with an airflow rate of 1.0 , and , passive cooling applied during the rest of the time every 24 h, with 0.02 m insulation, ; (b) air conditioning system opens if necessary with an airflow rate of 1.0 , and , passive cooling applied during the rest of the time every 24 h, with 0.02 m insulation, .
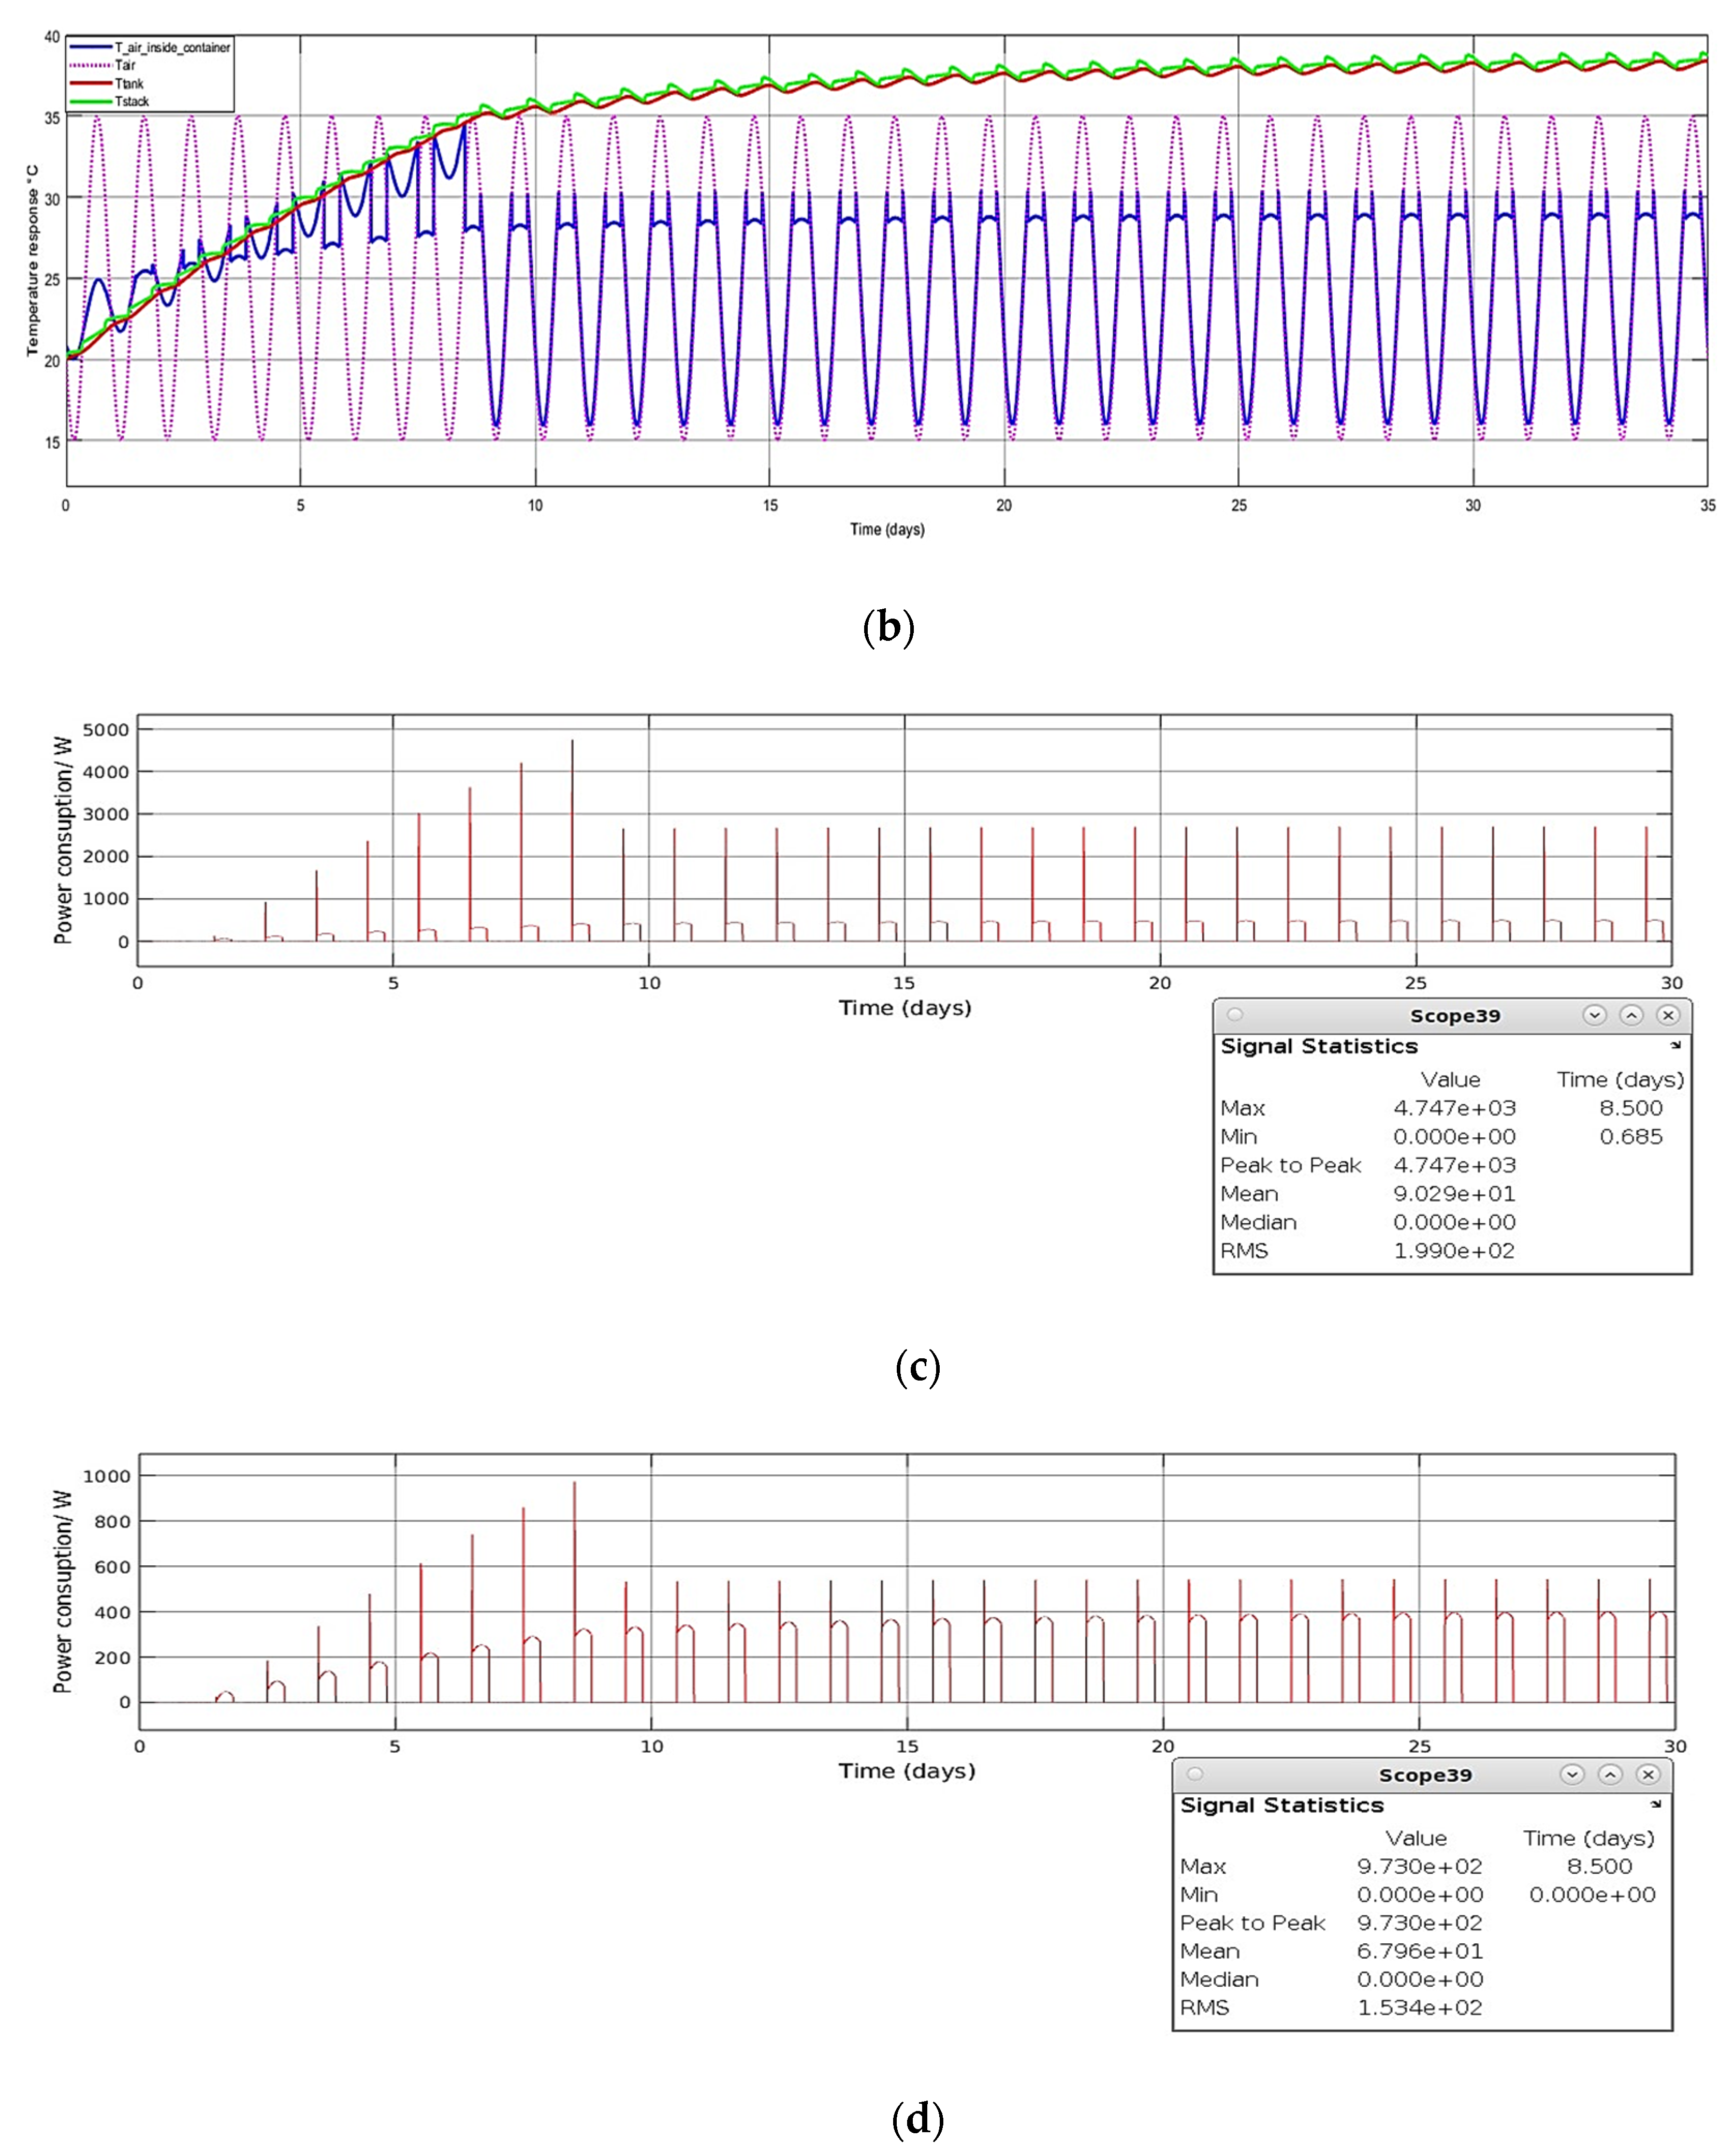
Figure 15a displays the simulation results for an 8 h battery with an air conditioning system active during the hottest 12 h of the day and passive cooling employed for the rest of the time, using a large airflow rate of 12.22
. Unfortunately, even with such a high airflow rate, the final temperature of the stacks and tanks reached 41.5 °C, which could not ensure the safe operation of the battery.
Figure 15b shows increasing the air conditioning system’s operating time to 16 h while reducing the airflow rate to 1.6
compared to
Figure 15a. The final temperature of the stacks and tanks in
Figure 15a,b was similar. Although the final temperature still exceeded 40 °C, the system’s demand for the air conditioning airflow rate significantly decreased because of the increase in the air conditioning system operation time.
Figure 15c is based on the condition in
Figure 15b but reduced the cold air temperature from the air conditioning system to 16 °C. The final temperature of the stacks and tanks was approximately 37.5 °C, significantly lower than before, which ensured the safe operation of the battery. Therefore, appropriately adjusting cold air temperature from the air conditioning system can effectively decrease the temperature of the stacks and tanks.
For an 8 h containerised VFB system with feasible hybrid cooling:
Figure 15.
(a) Air conditioning system opens if necessary with an airflow rate of 12.22 , and , passive cooling applied during the rest of the time every 24 h, without insulation, ; (b) air conditioning system opens if necessary, with an airflow rate of 1.6 , and , passive cooling applied during the rest of the time every 24 h, with 0.02 m insulation, ; (c) air conditioning system opens if necessary with an airflow rate of 1.6 , and , passive cooling applied during the rest of the time every 24 h, with 0.02 m insulation, .
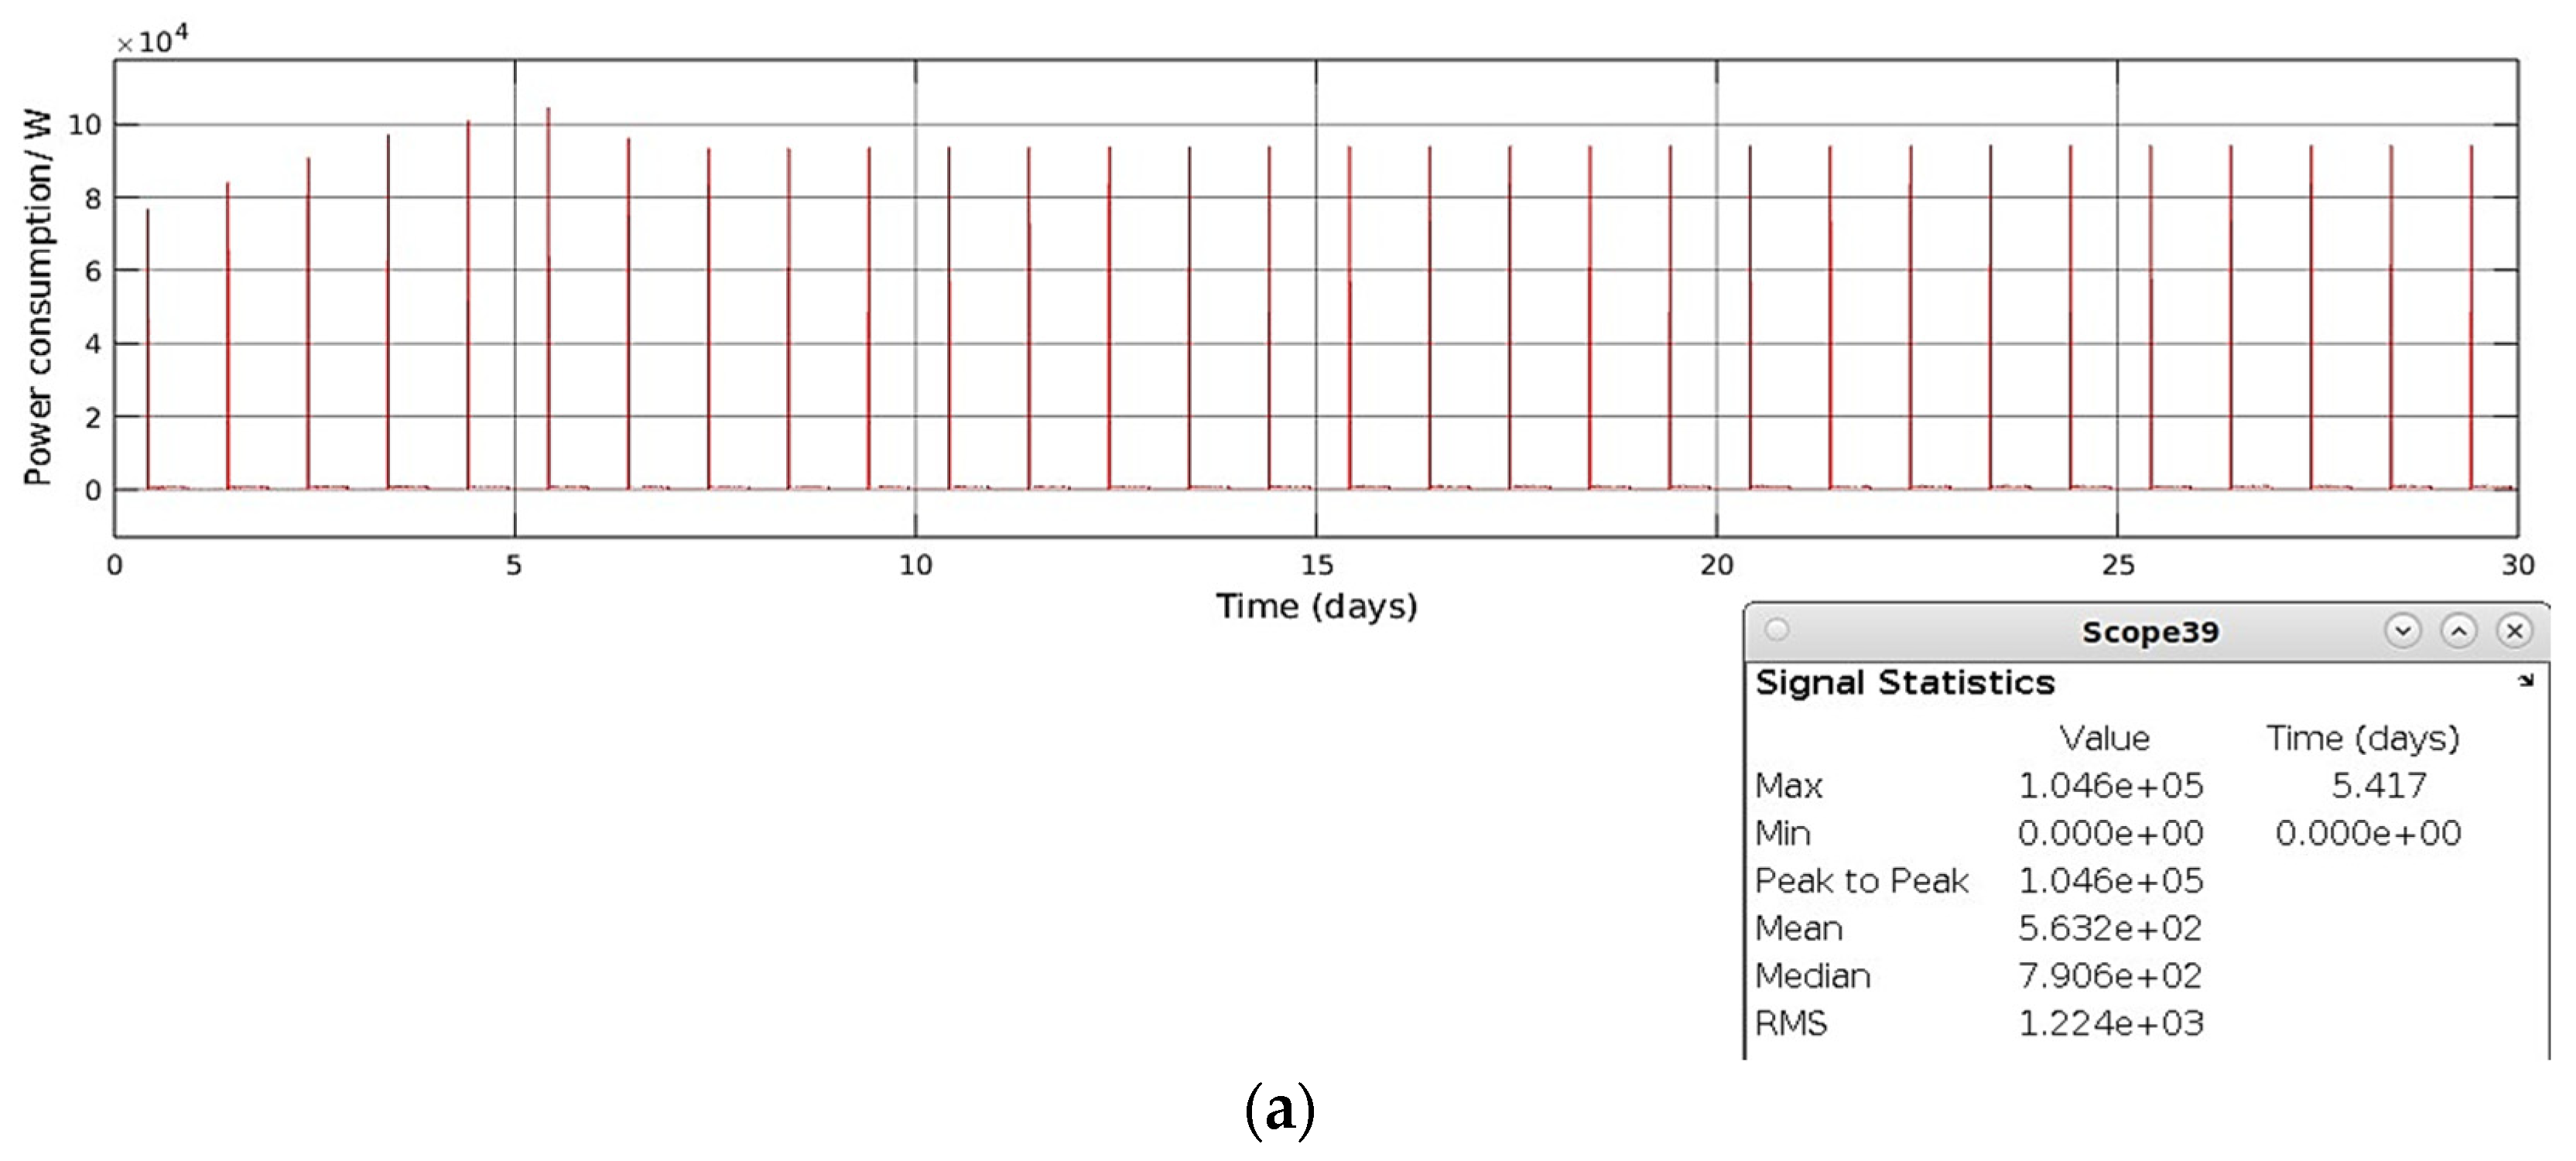
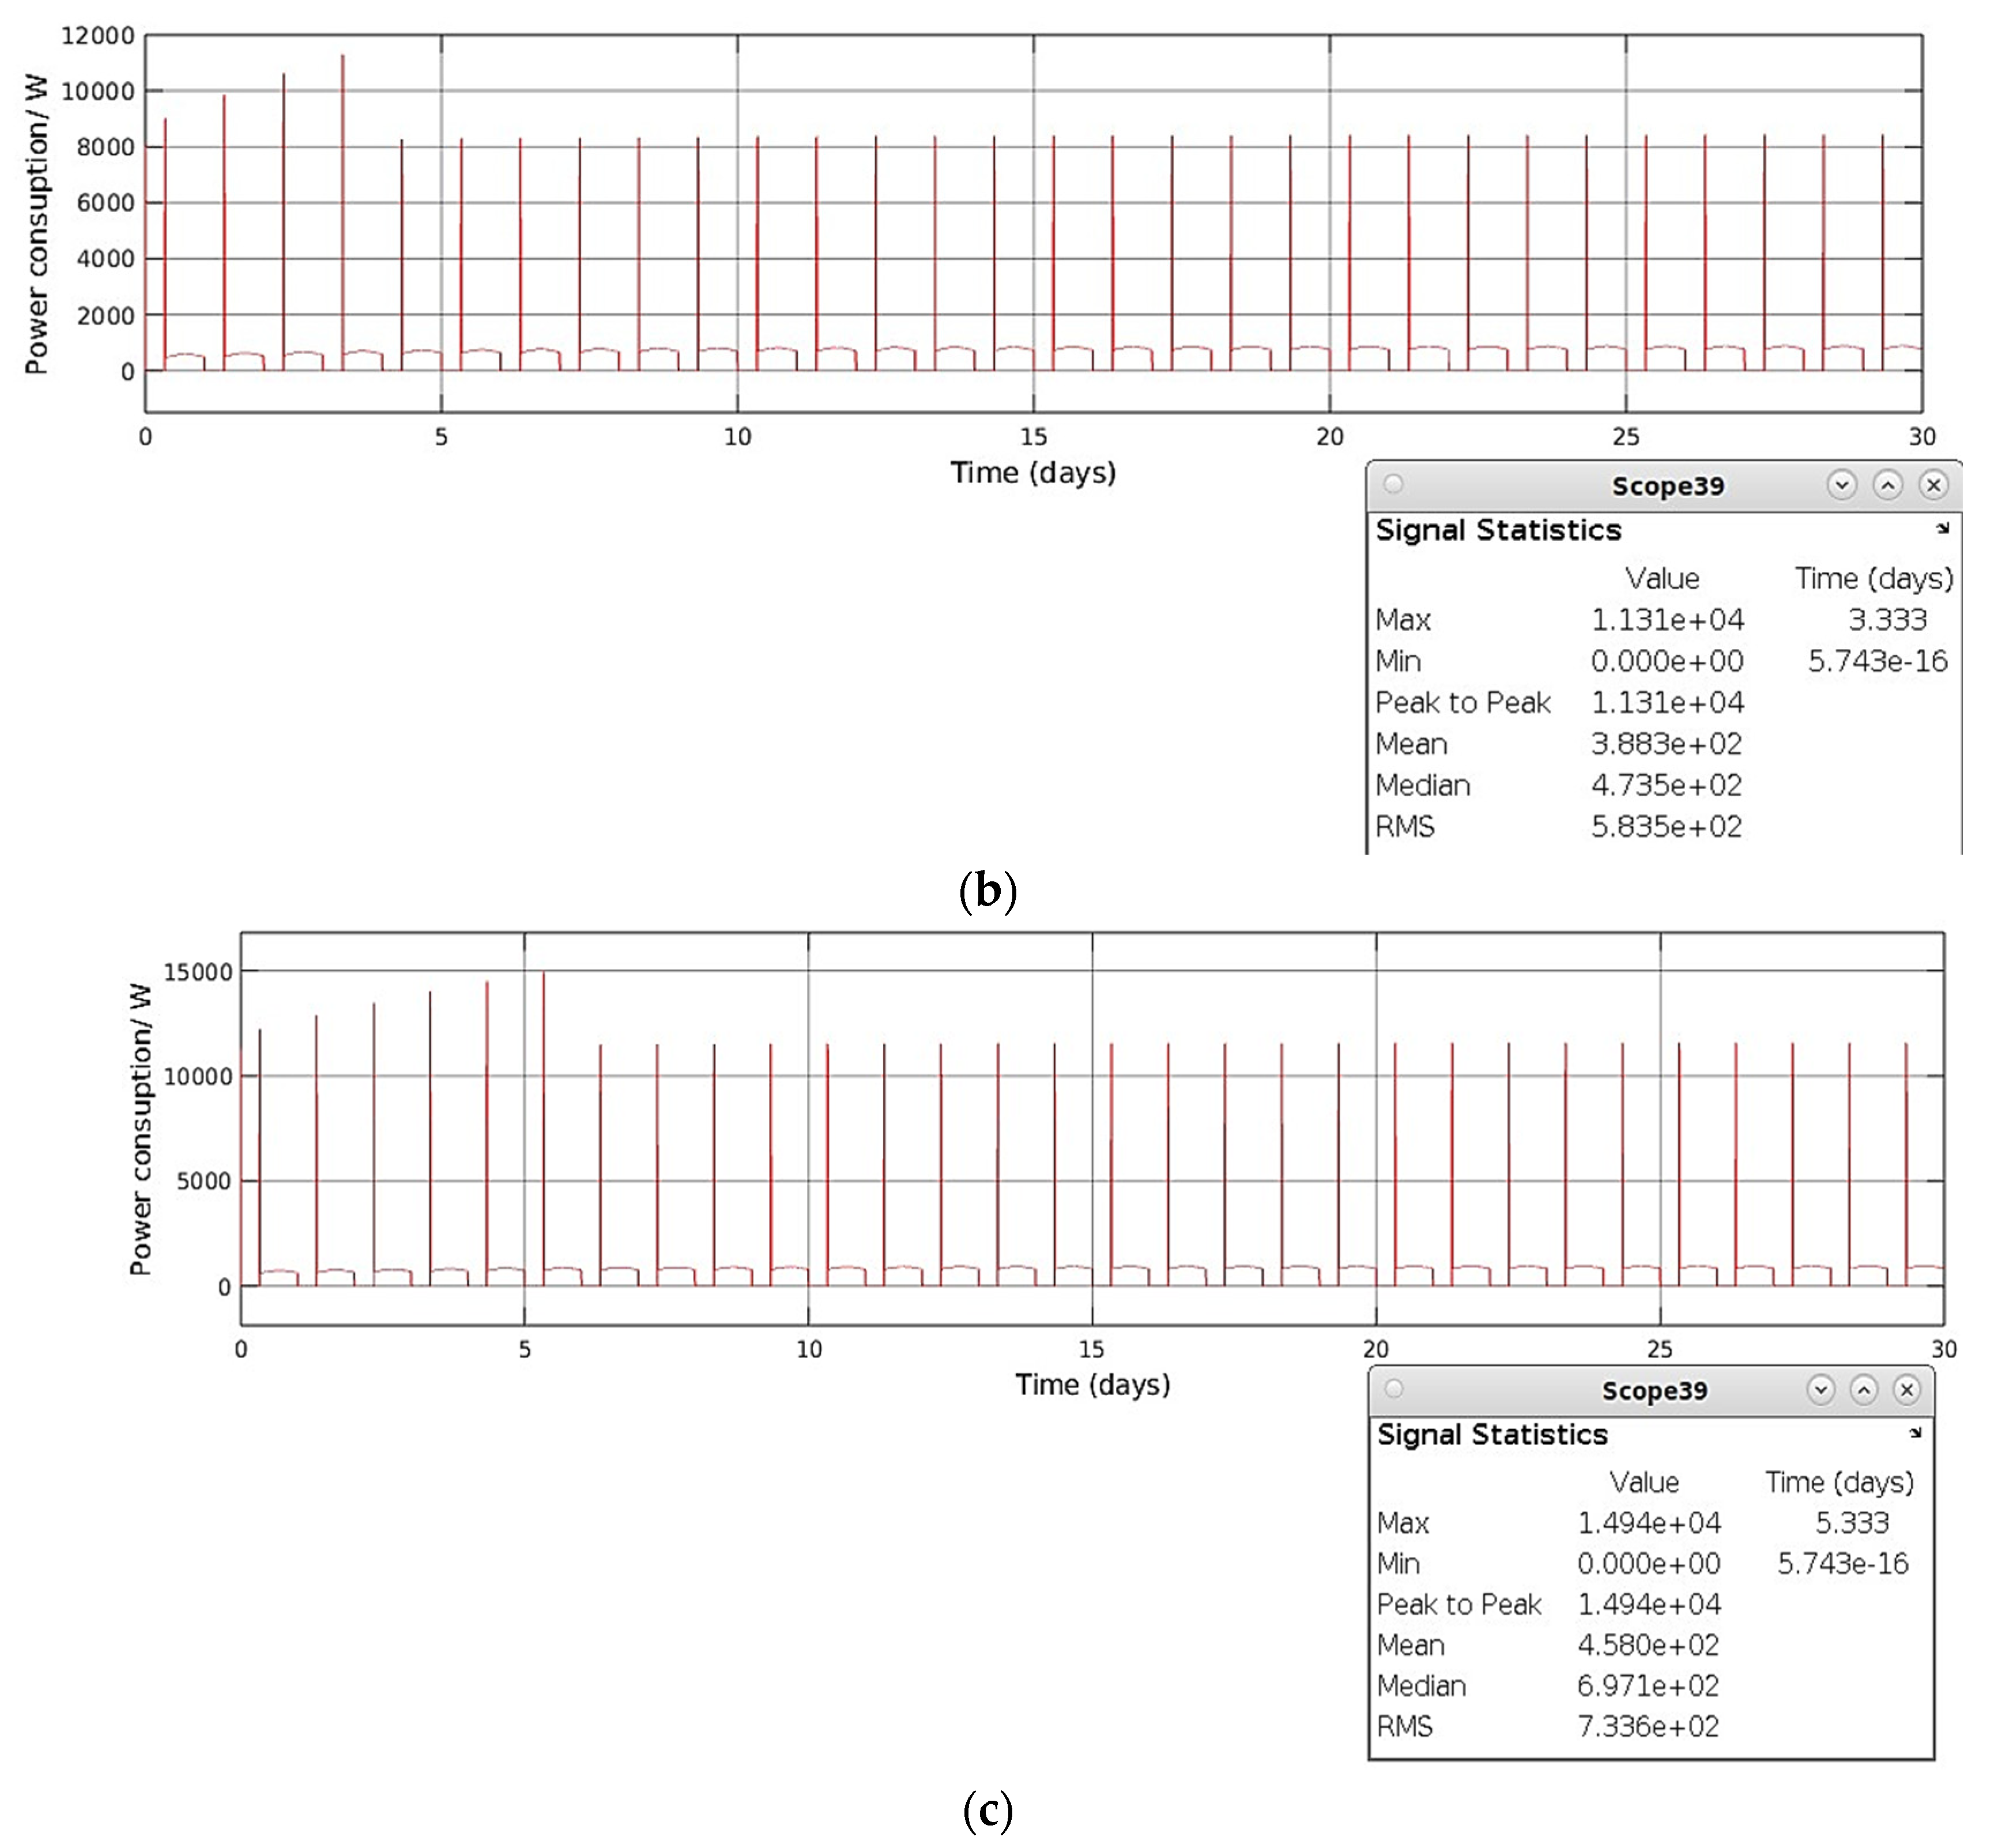
Figure 16 displays the power consumption of the air conditioning system over a 30-day period. As the power consumption was not constant, the mean value was employed to better reflect the actual power consumption situation. Compared to
Figure 16b, the results in
Figure 16a suggested that it is not advisable to blindly pursue a higher air conditioning system airflow rate, as the high flow rate air conditioning system with a shorter operating time consumes more power. Since the simulation conditions for
Figure 15b,c only differed in the temperature of the cold air supplied by the air conditioning system, and
Figure 16 shows that the average power consumption for
Figure 15c condition was higher, it can be reasonably inferred that if the cold air temperature in
Figure 15a were set to 16 °C and the air conditioning system operating time further extended, the stack and tank temperatures could be reduced to below safe operation range, but the power consumption would further increase, thereby raising operational costs.
The conditions in
Figure 15b,c utilised lower airflow rates, and by extending the air conditioning system’s operating time, their cooling effects were superior to that shown in
Figure 15a. Compared to
Figure 15b, by decreasing the temperature of the cold air from the air conditioning system, the stack and tank temperature was maintained below 38 °C. However, this setting also increased the power consumption to some extent. Even with such a setting, the average power consumption was 458 W or 10.99 kWh energy consumption over a 24-h period, which was still a relatively small value for a 30 kW–240 kWh containerised VFB system. Additionally, the results from
Figure 15a,b indicated that compared to pursuing a higher airflow rate, increasing the operating time of the air conditioning system proved to be more beneficial for the cooling effect.
Furthermore, although applying an airflow rate of 12.22
resulted in a maximum power consumption of around 104 kW (
Figure 16a), the average power consumption of this air conditioning system for a containerised 30 kW–240 kWh VFB system over 30 days was 563 W or 13.51 kWh energy consumption over a 24 h period. This implied that the electricity costs incurred from this condition were still relatively low.


