Article

Multi-Objective Optimization of Variable Density Multi-Layer Insulation for Liquid Hydrogen Containers Based on Reduced-Order Surrogate Model

Department of Refrigeration and Cryogenic Engineering, Xi’an Jiaotong University, No. 28, Xianning West Road, Xi’an 710049, China
*
Author to whom correspondence should be addressed.
Processes 2023, 11(5), 1383; https://doi.org/10.3390/pr11051383
Submission received: 21 March 2023 / Revised: 19 April 2023 / Accepted: 27 April 2023 / Published: 3 May 2023
(This article belongs to the Section Energy Systems)

Abstract

:
For liquid hydrogen transportation, thermal insulation materials that are lightweight, compact and exhibit high-performance have been pursued for several decades, and variable density multi-layer insulation (VD-MLI) has been regarded as a promising choice. The thermal insulation performance of the insulation materials is important, but is not at the top of the list; many constraints, such as the space and weight of the insulation structures, are imposed on the design of a VD-MLI. Consequently, this makes the optimization of VD-MLIs more complicated. The present authors conducted a multi-objective optimization of a VD-MLI stacked with specific insulation units. The number of repetitions of the basic insulation unit was regarded as the dimensionless design parameter of the VD-MLI. Based on the experimentally validated layer-by-layer (LBL) model for MLI design, the multi-objective optimization of VD-MLI for liquid hydrogen storage was conducted by the combination of proper orthogonal decomposition with a general regression neural network (POD-GRNN) surrogate model optimization framework. The results showed that the optimal solutions for VD-MLI configurations could be achieved under different constraints. The present optimization framework provides a new reference for the optimization of VD-MLI for cryogenic liquid storage.

1. Introduction

Liquid hydrogen (LH2) is usually stored and transported at 20 K under ambient pressure. The boil off of LH2 caused by heat leakage leads to a significant increase in the storage and transportation cost. Due to the excellent thermal insulation performance, variable density multi-layer insulation (VD-MLI) has been regarded as a basic insulation component for LH2 containers. There are different vehicles, such as cryogenic hydrogen–oxygen rockets, LH2 lorries, and LH2 cargo carriers, imposing stringent requirements on the space and weight of LH2 containers. We can easily understand that controlling the space and weight of a thermal insulation structure can improve the efficiency of LH2 transportation significantly. Therefore, the optimization of VD-MLI configurations has attracted more and more attention in the field of cryogenic engineering.
The existing VD-MLI optimization is mainly based on the Lockheed model [1], which is a semi-empirical equation obtained by fitting experimental data at temperatures above 77 K. The Lockheed model can not be employed directly to optimize the MLI configuration at LH2 temperature [2]. On the other hand, the layer-by-layer (LBL) model was used to calculate the heat leakage in VD-MLI structures at LH2 temperature [3]. It is assumed that the heat transfer between each layer of MLI consists of three independent heat fluxes, and each layer temperature can be determined separately. Thus, it is possible to develop VD-MLI optimization methods based on the LBL model. The layer density is chosen as the design parameter of VD-MLI in engineering applications.
Hastings [4] used the LBL model and modified Lockheed model to analyze the thermal insulation performance of a Foam/VD-MLI combination for orbital storage of LH2. The results demonstrated that VD-MLI exhibits an ideal thermal insulation performance with a significant reduction in weight. Johnson [5] compared several optimization models of VD-MLI based on the experimental results, and the Lockheed model, modified Lockheed model, NEW Q model and Mcintosh model were investigated. Wang [6] proposed a VD-MLI optimization method by inserting a reflector at the optimal positions, and an experimental validation was conducted. All the above works focus on the single-objective optimization with layer density as the design parameter and the heat flux as the objective. The multi-objective optimization of VD-MLI has rarely been reported.
In order to further improve the performance of the thermal insulation materials, the composite insulation systems composed of VD-MLI and other auxiliary components have attracted more and more attention. A Vapor Cooled Shield (VCS) is used to offset the heat intrusion by utilizing cooing capacity of boil-off gas in LH2 containers [7], and the insulation performance of the VD-MLI-based LH2 containers could be further improved [8]. For example, Jiang [9] developed a one-dimensional heat transfer model for the combination of Foam/VCS/VDMLI for orbital storage of LH2, and the position of VCS was optimized. The results showed that the heat flux into the LH2 tank is reduced by 59.6% when VCS is located at the optimal position as compared to the case without VCS. Huang [10] investigated the thermal insulation performance of Foam-VDMLI and VD-MLI under conventional atmospheric conditions and vacuum conditions (10−3 Pa), based on a liquid nitrogen boil-off calorimeter system. The results showed that the heat flux of Foam-VDMLI was only 30.58% compared to that of VD-MLI at atmospheric conditions. Shi [11] investigated a composite thermal insulation system consisting of variable-density multi-layer insulation (VD-MLI) and vapor-cooled shields (VCS) integrated with para-ortho hydrogen (P-O) conversion, which has been proposed for long-term storage of liquid hydrogen. The effect of VCS on heat flux density is discussed, and the optimal placement of VCS and the ultimate performance that can be achieved when VCS is combined with VD-MLI is obtained. The result shows that compared to that without VCS, the heat leak with multiple VCSs can be reduced by max of 79.9%. Wang [12] investigated the thermal insulation performance of Foam/Hollow Glass Microspheres (HGMs) combined with MLI/VD-MLI. The different heat fluxes in four insulation structures were analyzed, and the results showed that the thermal insulation performance of the MLI and VD-MLI systems were improved by 33% and 13%, respectively. Liu [13] investigated the variation of Foam/MLI thermal insulation performances based on an LBL model at boundary temperatures from 55 K to 700 K, and boundary pressures from 10−6 Pa to 105 Pa. The results indicated a complex variation of heat flux within Foam/MLI with different orbits of the spacecraft, but the variation of heat flux was not discussed when foam is combined with VD-MLI. Therefore, it is necessary to solve the optimal configuration of VD-MLI to enhance the thermal insulation performance. In addition, the existing VD-MLI optimization methods are mainly based on single-objective optimization, and it cannot be proven that the optimized configurations are globally optimal.
In Lockheed models, the layer density is implicitly related to the heat flux density. Some semi-empirical coefficients need to be corrected to improve the fitting accuracy. For example, Fesmirea [14] used a calorimeter to test six VD-MLI configurations at the temperature range of 78–293 K and ambient pressure range of 10−6 torr to 760 torr for 10–80 layers of MLI, and the coefficients of the Lockheed model were modified. A multi-dimensional parametric regression model can be employed to predict the performance of VD-MLI at the presence of multi-dimensional design parameters. Using a data dimensionality reduction method e.g., POD method [15], the best low-rank approximation of original sample set can be obtained through data dimensionality reduction, and the prediction performance is also excellent in the case of small sample size by no-linear regression of the orthogonal basis coefficient.
In view of the user-friendly interface communication of complex solvers, surrogate model is suitable for a high computational cost-optimizing problem. Joakim [16] present a novel SbNSGA-II ALM-surrogate-based NSGA-II. It is a robust and fast multi-objective optimization method based on kriging surrogate models and NSGA-II with Active Learning MacKay (ALM) design criteria. The SbNSGA-II ALM method is faster than the NSGA-II method, preserving the robustness and diversity of the Pareto front identified. Phiboon [17] developed an RBF/Kriging hybrid multi-fidelity surrogate model. A non-dominated sorting genetic algorithm II is selected to solve the airfoil design problem. The objective of the optimization problem is to minimize the aerodynamic drag and maximize the lift force. The results showed that the UAV airfoil shape and the selected optimum airfoil shape had been successfully obtained with the algorithm. The error of the aerodynamic lift and drag is less than 10% in comparison with the wind tunnel experiment results.
In this study, a VD-MLI optimization method is proposed by defining the number of repetitions of basic units as the design parameter and employing the proper orthogonal decomposition with general regression neural network [18] (POD-GRNN) as the surrogate model. A sample set of design parameters is generated by optimal Latin hypercube sampling, and the response parameters are obtained by solving the LBL equations. The sample set consists of the total thickness, number of layers, heat flux density, and design parameters of a VD-MLI. The optimal approximation of the low-rank distribution of the sample set is obtained by the POD, and the response parameters are obtained by regression of GRNN on design parameters and orthogonal basis coefficients. The generalization ability of the POD GRNN around the optimal solution is continuously improved by adding non-dominated solutions in the sample set. The optimization method theoretically proved the existence of a multi-objective optimal configuration for a VD-MLI.

2. Methodology

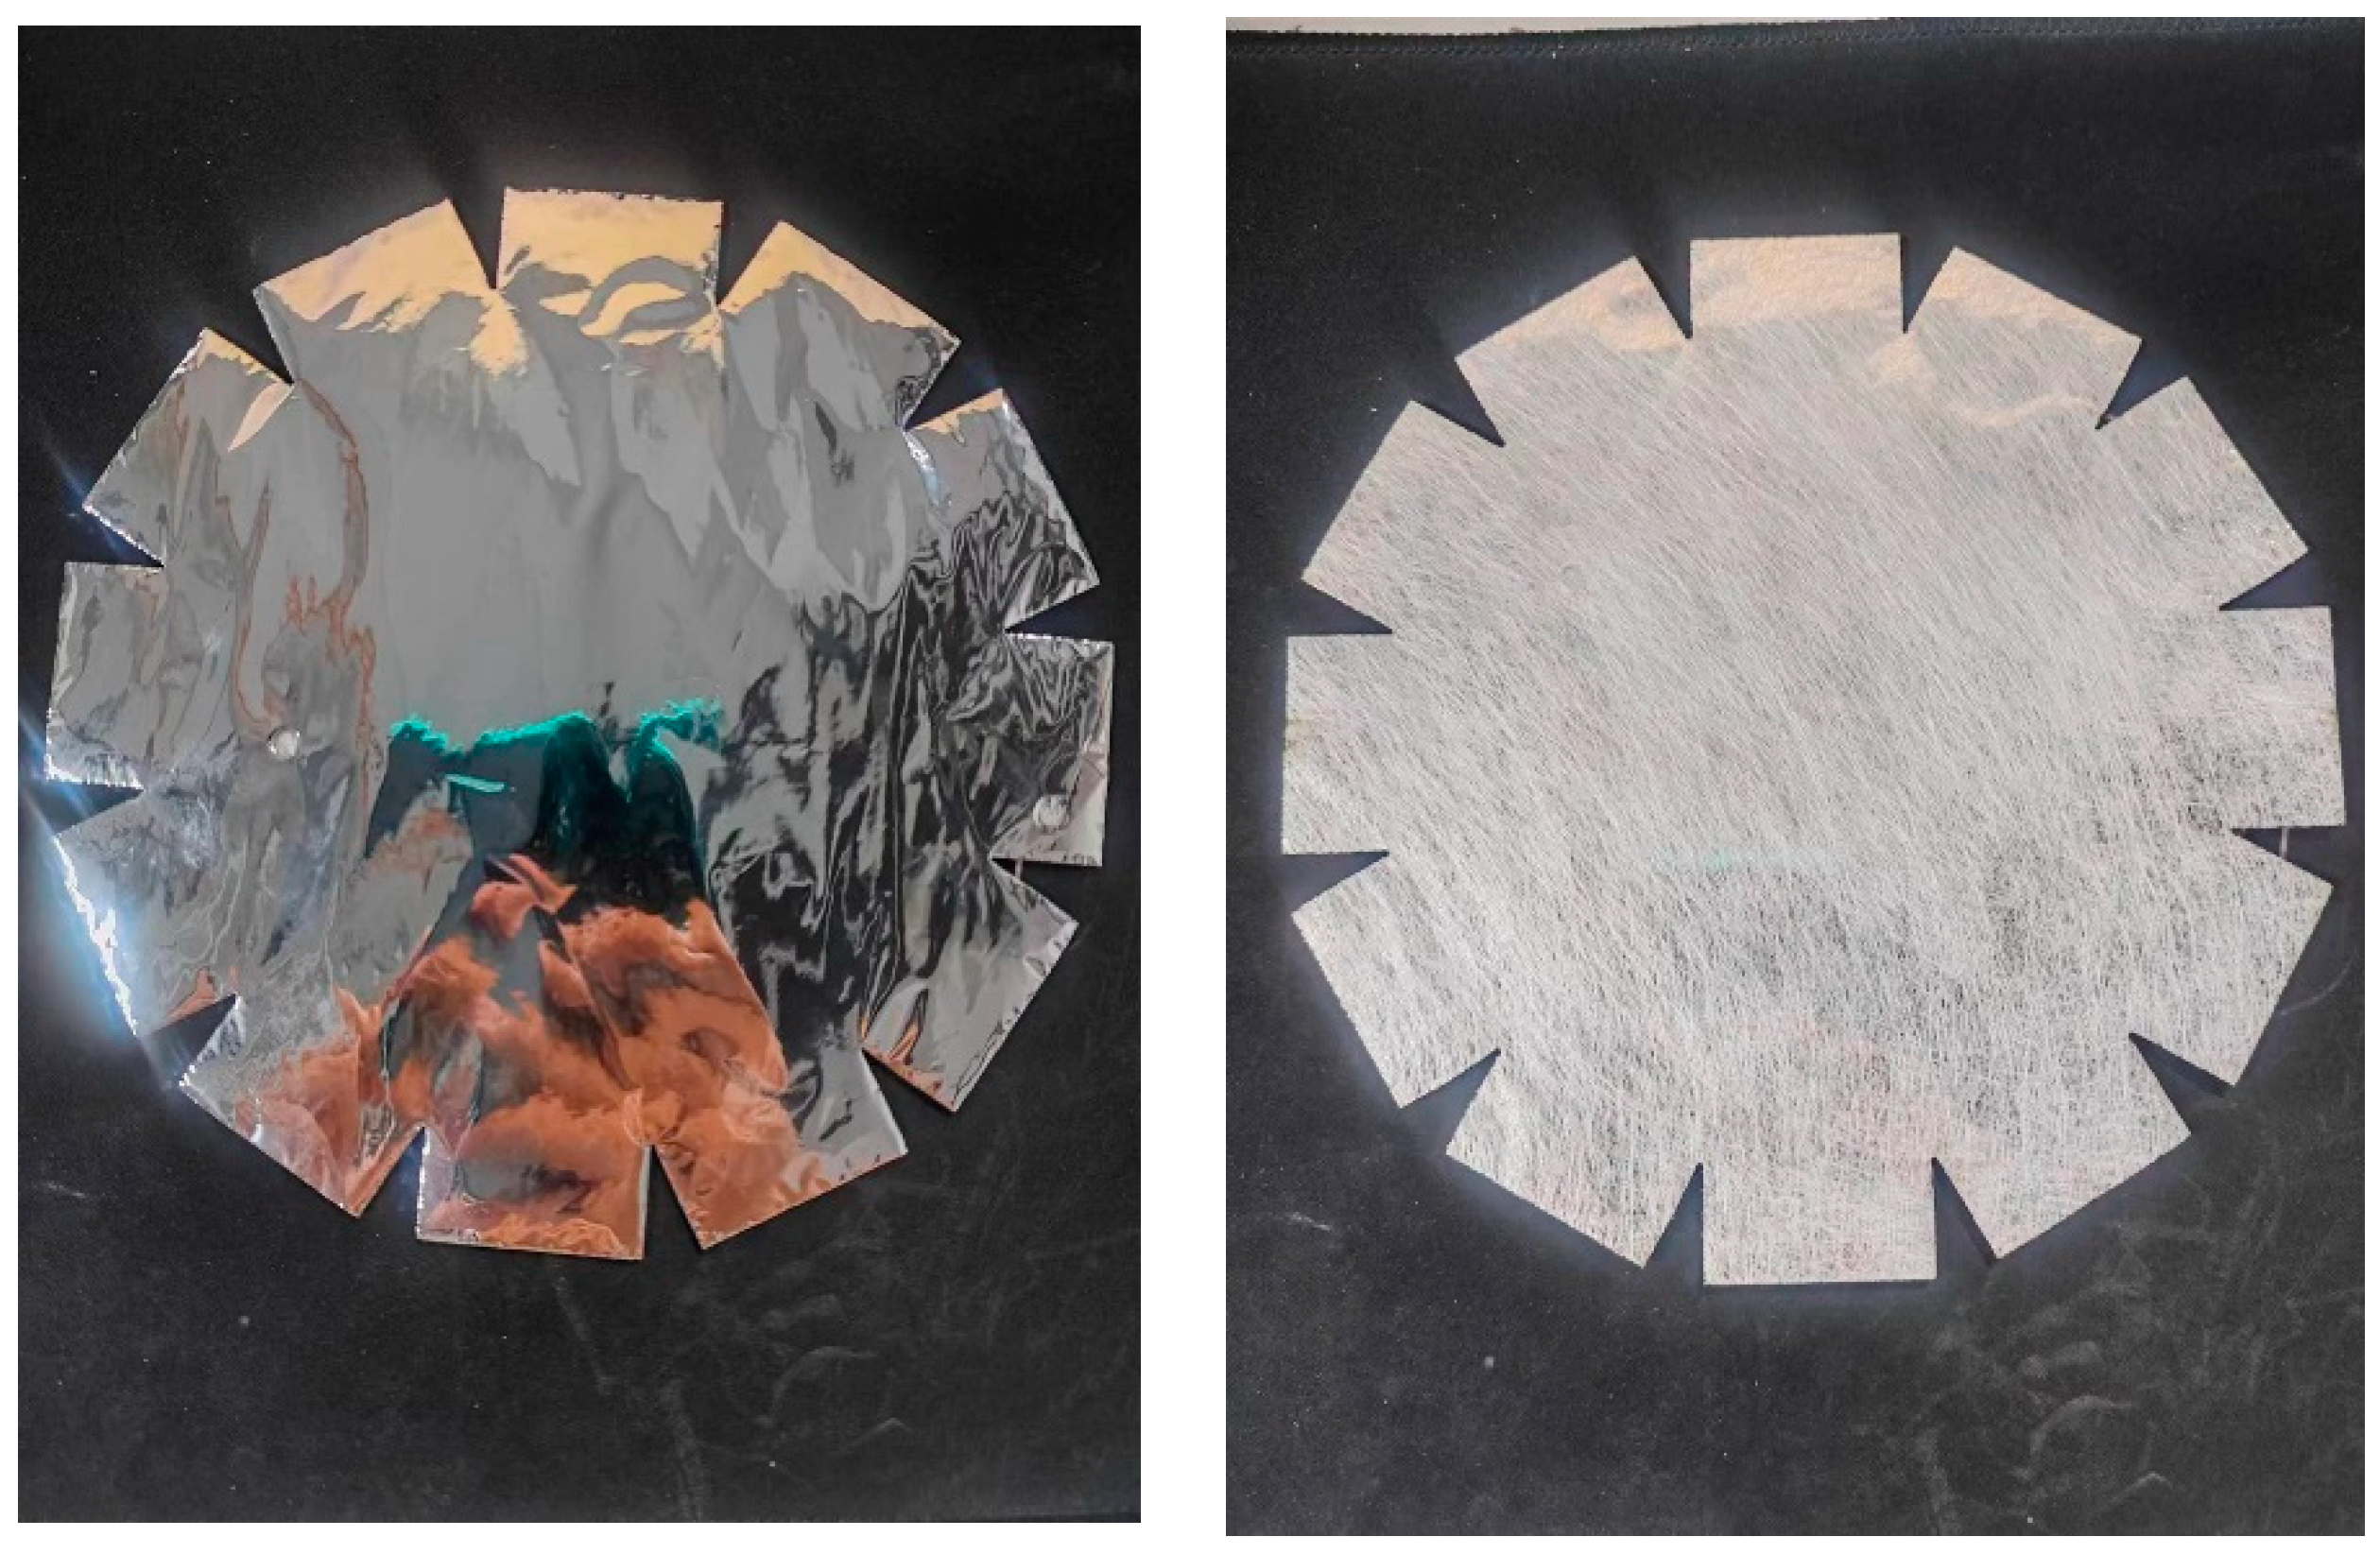
The VD-MLI can be implemented by stacking different layers of spacers, and the density of reflectors varies in different parts of the MLI. Due to the space limitation of the container, the total thickness and insulation performance of the VD-MLI can be set as optimization objectives. The reflector is made of aluminum foil and the spacer material is glass fiber. The emissivity of the reflector (ε) is 7.39 × 10⁻⁴  ×   T 2 / 3 and the thermal conductivity of the spacer (ks) is 8.823 × 10⁻⁶ + 1.04 × 10⁻⁷  ×   T W/m · K. The materials of this study are shown in Figure 1.
As shown in Figure 1, the reflector is used to reduce the radiation heat flux, and the spacer is made of porous material with low thermal conductivity to mitigate the heat leakage in the low temperature zone. The residual gas in MLIs can be evacuated from the porous structure. It is found that the residual gas pressure may be 10–50 times higher than the nominal vacuum pressure [19,20], and the interlayer pressure is variable at different layer positions. Thus, in order to improve the precision of the simulation model, the residual gas pressure is assumed as 5 × 10⁻² Pa for all layer positions when the pressure of the vacuum chamber is 10−3 Pa. The basic parameters of the VD-MLI are listed in Table 1.
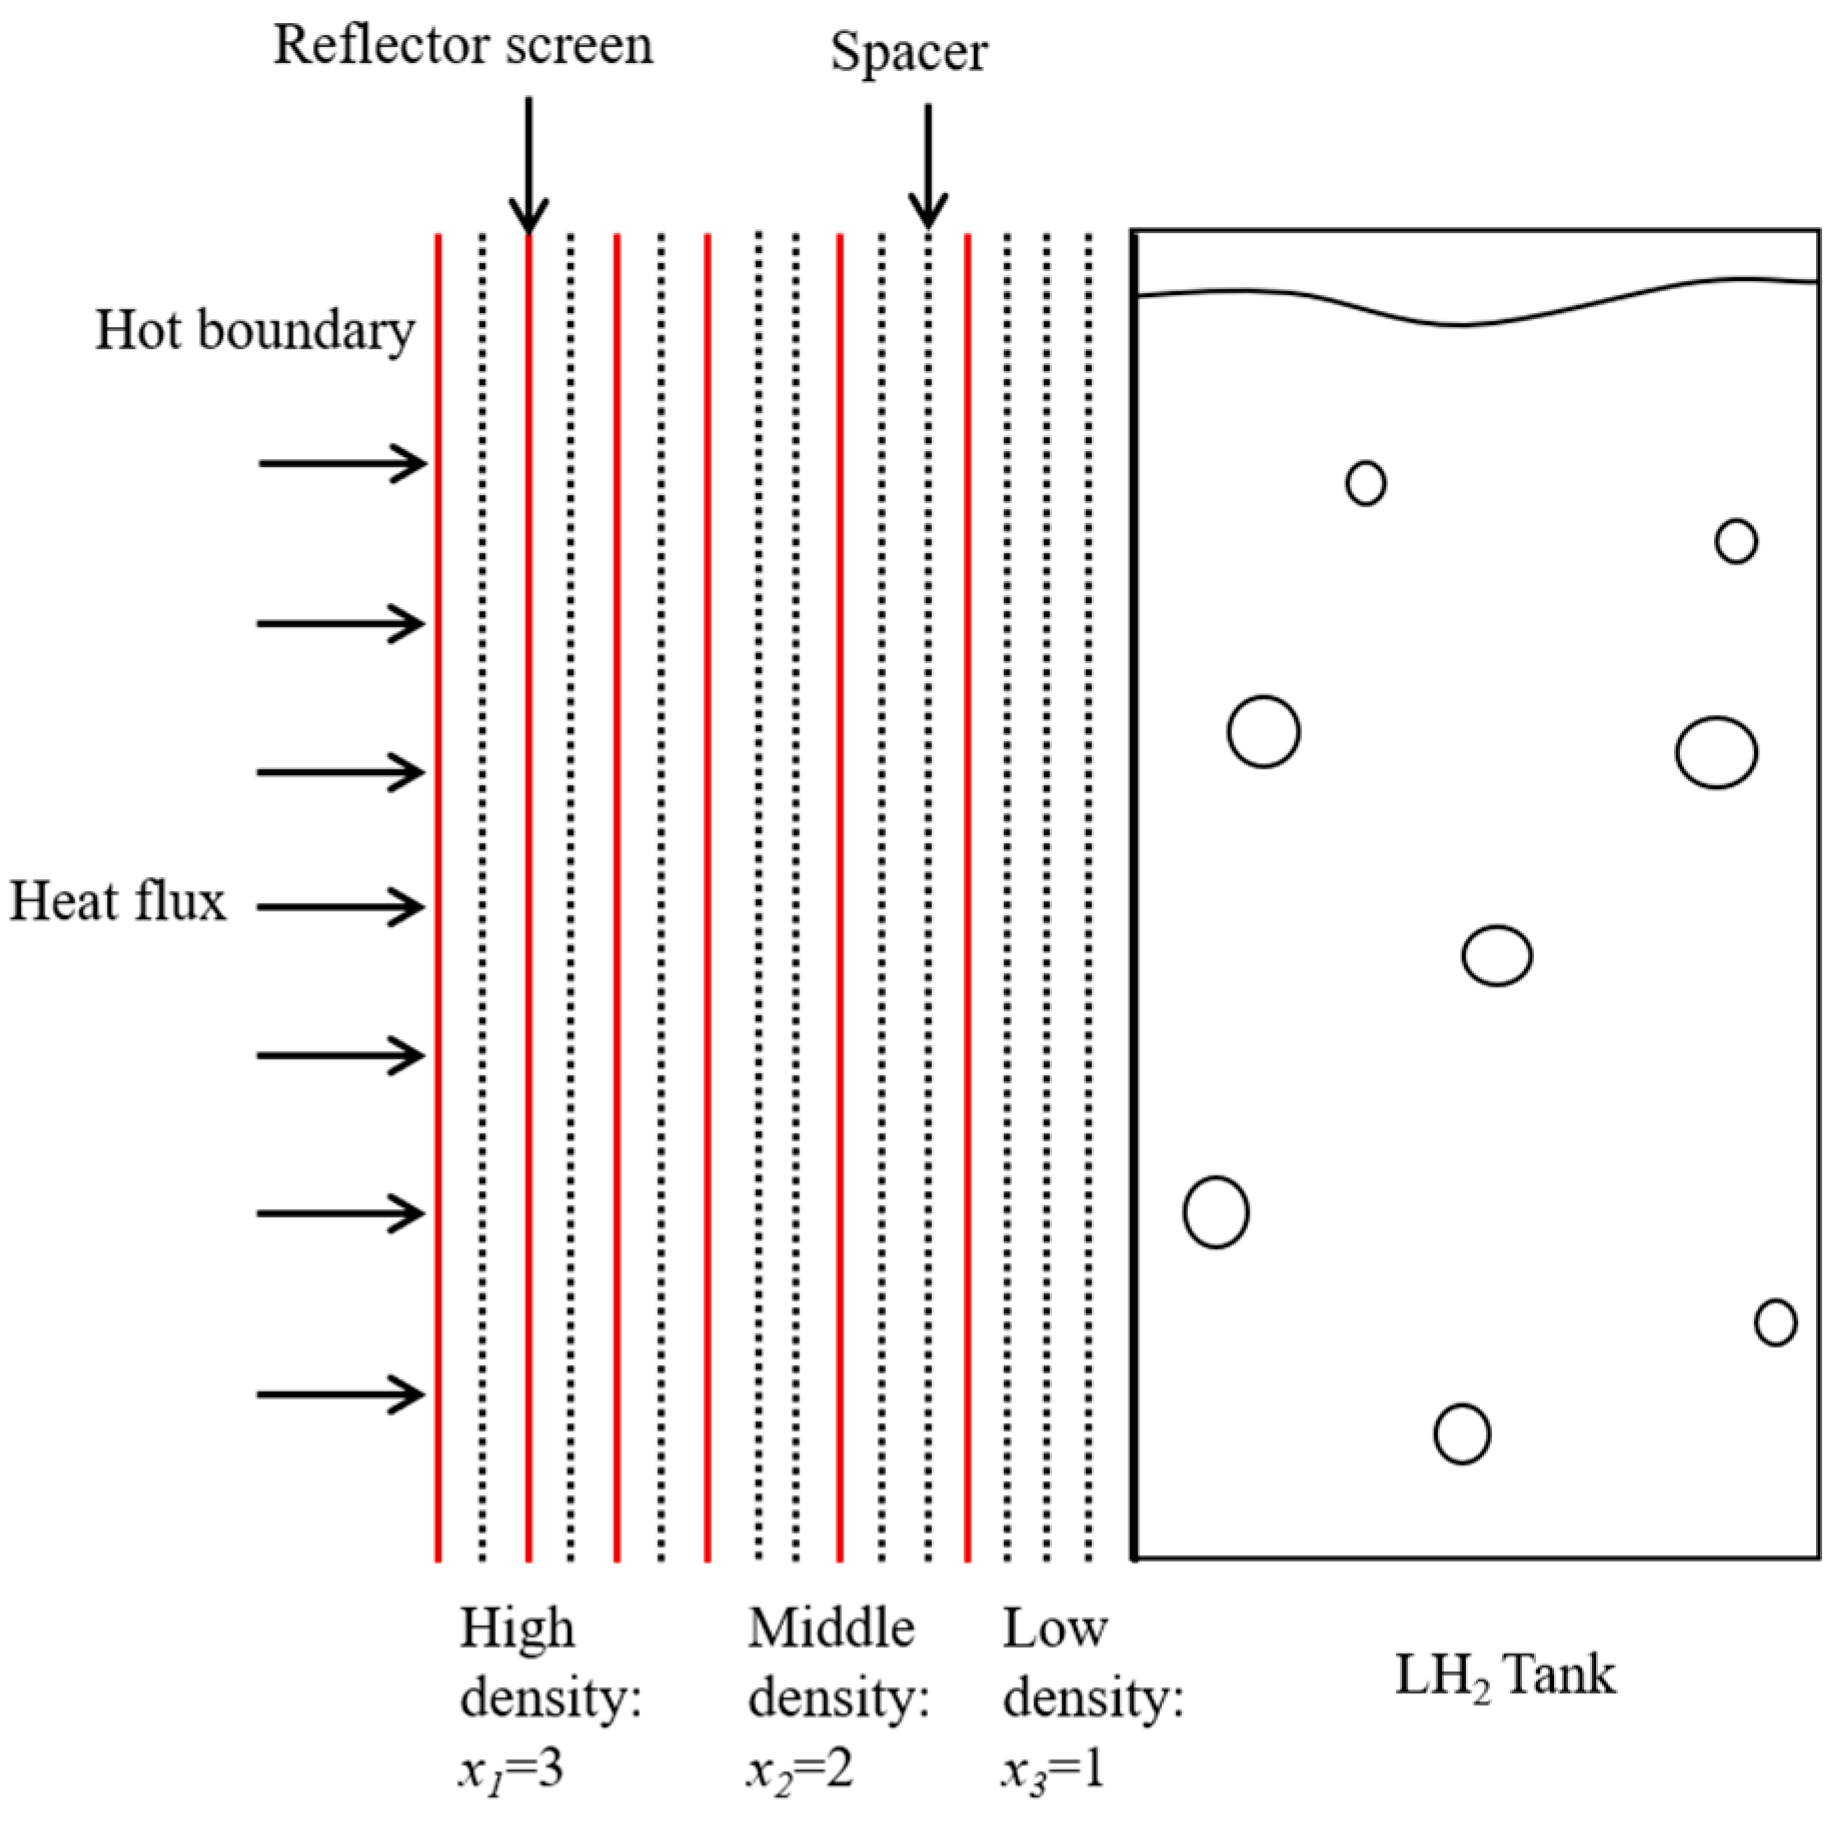
Figure 2 shows the schematic diagram of the VD-MLI configuration. It can be seen that the VD-MLI is composed of three zones: low density zone, medium density zone and high density zone. The spacing distances of adjacent reflectors are different at different zones, while the spacing distances are the same in a specific zone. It can be seen that the spacing distance between the adjacent reflectors increases by an integer multiple. In fact, this can be achieved by stacking the spacer elements in different manners, i.e., single stack, two stacks and three stacks. In the present multi-objective optimization of VD-MLI, the stacking manner of the reflectors and spacers are optimizing variables, and parameters such as weight, thickness and heat flux density of the VD-MLI are used as optimizing objectives.
Since the heat leakages near the hot and cold boundaries are dominated by radiation and conduction heat transfer, respectively, more reflectors are arranged near the hot boundary in order to cut down the radiation-dominated heat leakage. Additionally, more spacers are placed near the cold boundary. Thus, the specific configuration of a VD-MLI could be optimized to achieve the optimal insulation performance.

2.1. Layer-By-Layer Model

In the layer-by-layer (LBL) model, the heat flux between two adjacent layers is assumed to transfer in three mechanisms, i.e., thermal radiation, solid conduction and residual gas conduction, respectively. The solid conduction of spacers can be calculated by the following equation:
q s = C f k d s p T n + 1 T n 1
where, n is the current number of layers. C represents an empirical coefficient, f represents spacer density, k represents the thermal conductivity of the spacer and d s p represents the thickness of the spacer between two adjacent reflectors (m). T h and T c are the temperatures of the hot and cold reflectors, respectively (K). The residual gas conduction can be determined by the following equation:
q g = γ + 1 γ 1 R 8 π M T p α T n + 1 T n 1
where, R represents gas constant, 8.314 kJ/mol · K, γ represents specific heat ratio, M represents molecular weight of gas, kg/mol, p represents residual gas pressure, Pa, α represents accommodation coefficient. The thermal radiation can be calculated as follows:
q r = σ ε T n + 1 4 T n 1 4
where, ε = 1/(1/ ε 1 + 1 / ε 2 1 ), ε 1 and ε 2 are the emissivities of the hot and cold reflectors, respectively; σ represents the Stephan–Boltzmann constant (5.675 × 10⁻⁸ W/m2 · K4). The total heat flux can be determined as:
q t = q s + q g + q r
Based on the thermal resistance, the temperature and heat flux and layer temperature of each layer in the MLI can be calculated.
The total thermal resistance between adjacent reflectors can be determined by the total effective thermal conductivity between the two layers as:
R T = 1 K T
Total thermal resistance K T as:
K T = σ ε + γ + 1 γ 1 R 8 π M T m p i α + k
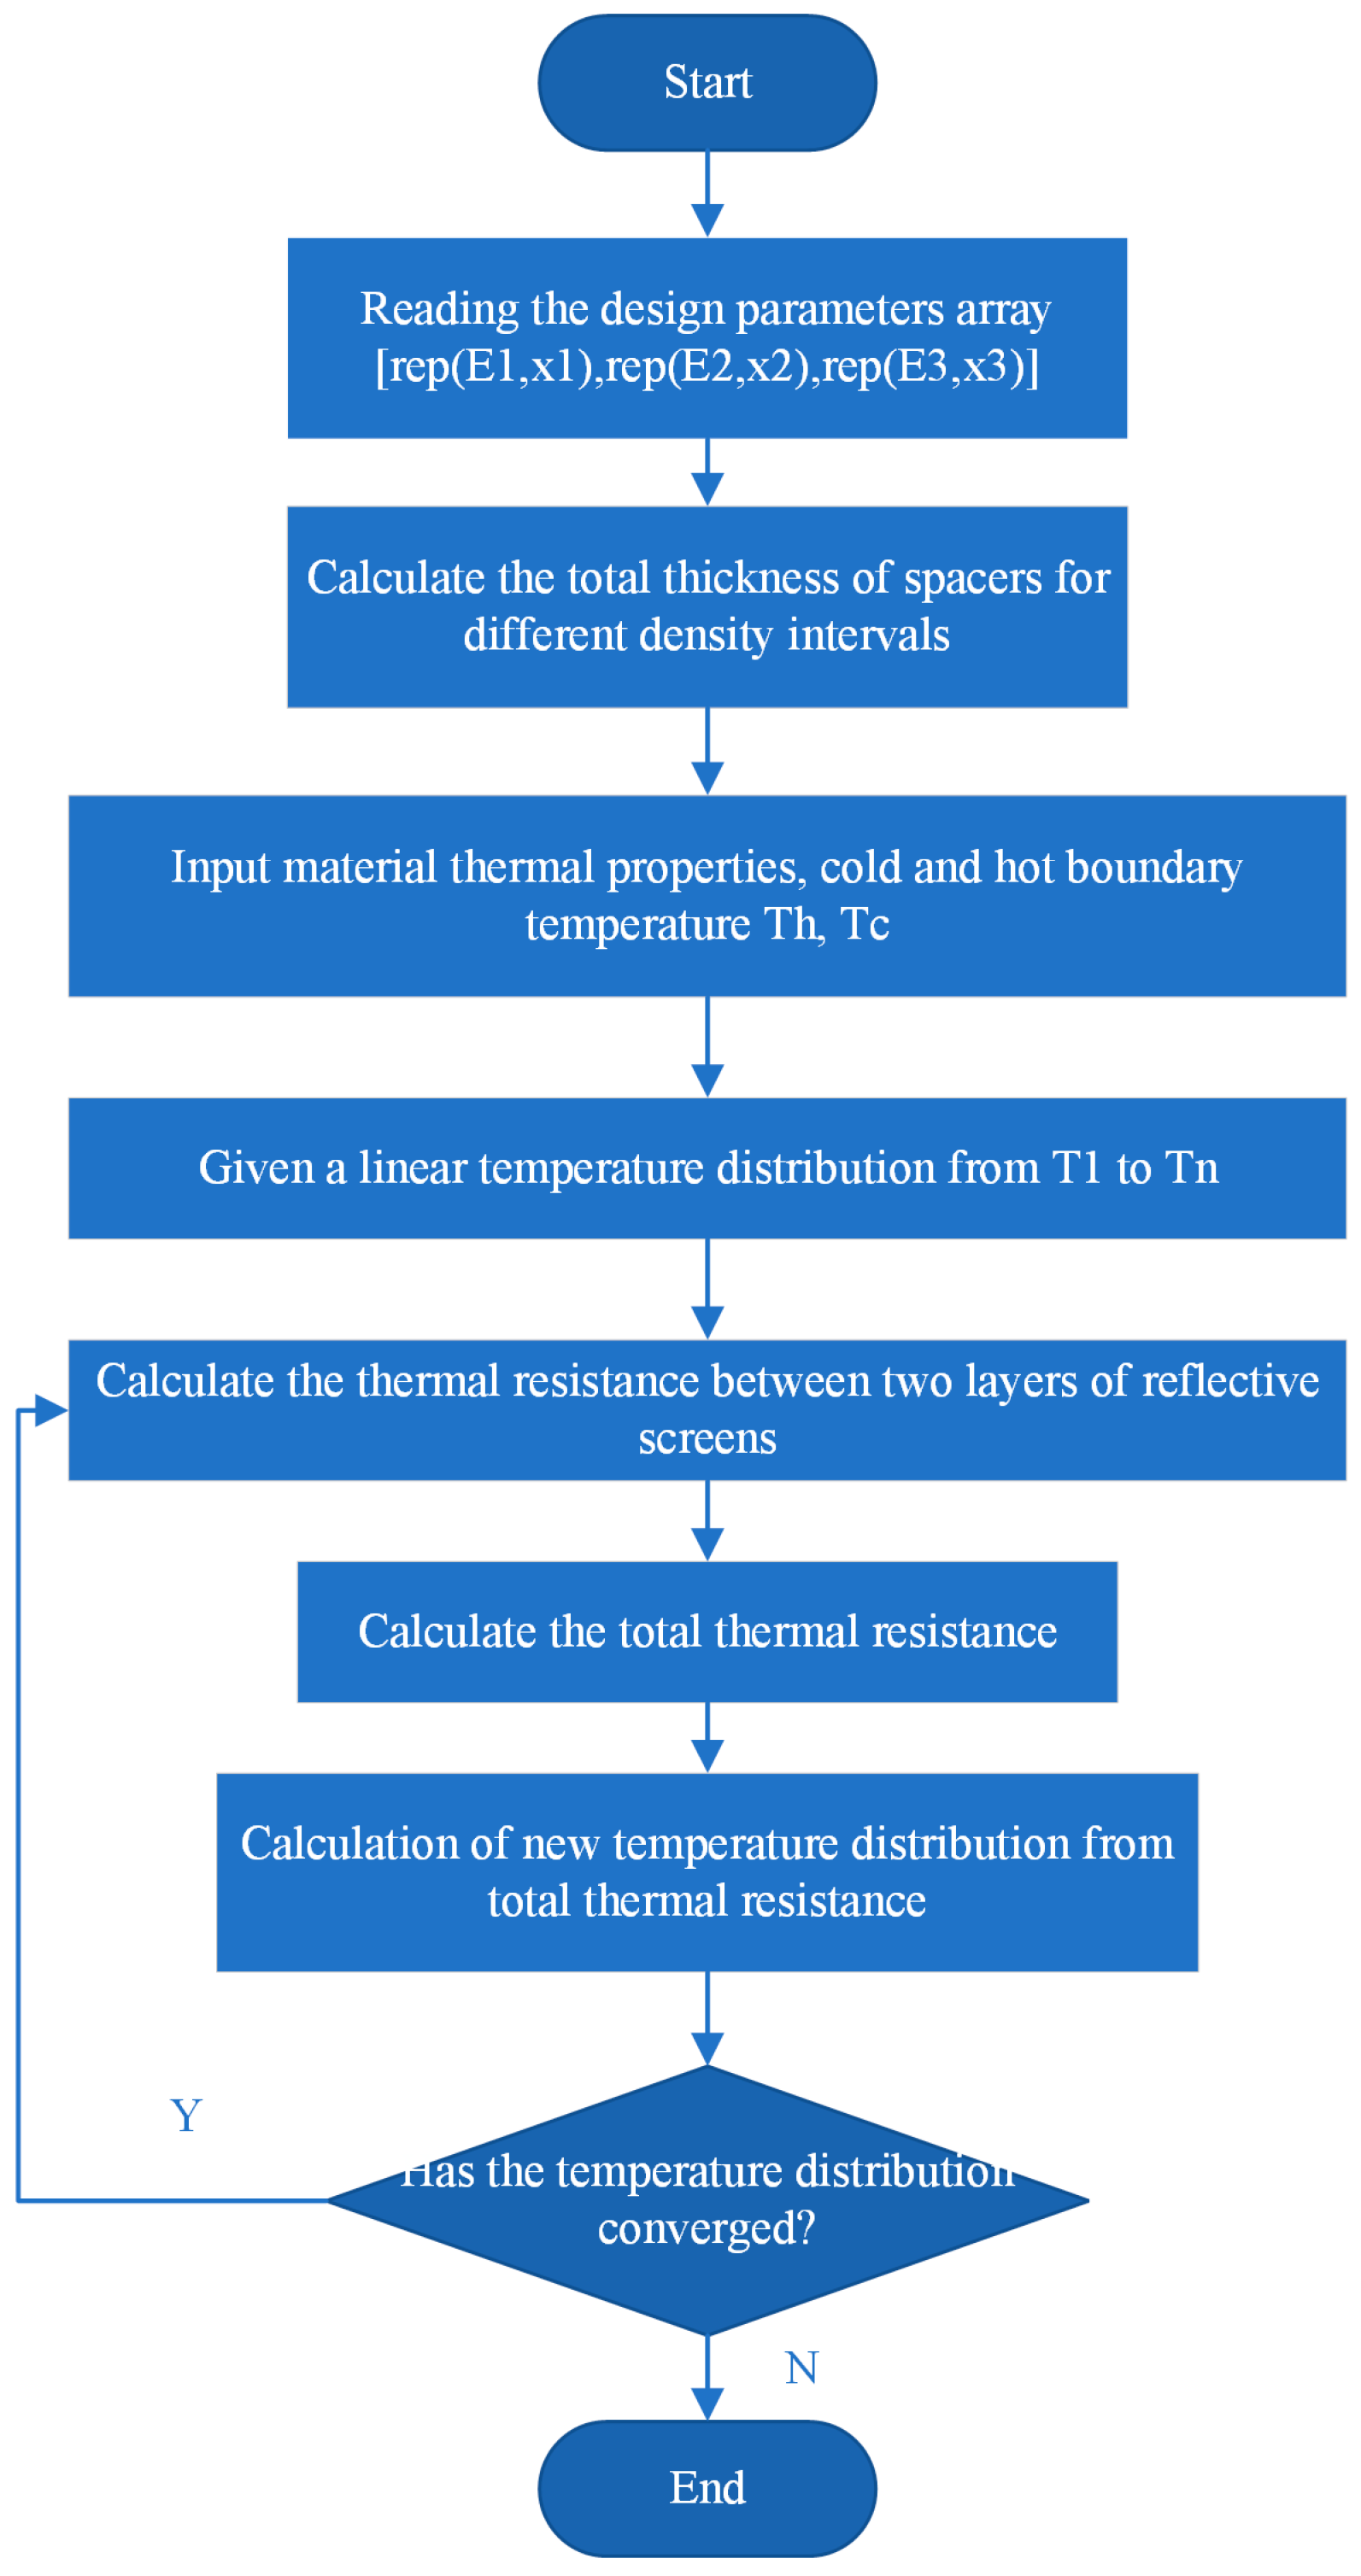
Equation (6) can be solved by iterative method. First the layer temperature initialized as a linear temperature distribution from the cold to the hot boundary, then calculate the thermal resistance between the two reflective screens. The new temperature distribution can be determined as:
T n = T C + i = 1 n     R i i = 1 N     R i T N T C
where,   R i is the thermal resistance between layer i − 1 and layer i, N is the number of layers ( T N = T H ), This is iterated until the temperature distribution converges. The temperature distribution and heat flow density on all layers are obtained.

2.2. Parameterization of VD-MLI

For the convenience of engineering implementation, the VD-MLI can be divided into three zones with different layer densities, as shown in Figure 1. The basic thermal insulation unit for the three zones (the high density zone, E1; the medium density zone, E2; the low density zone, E3) can be expressed as follows:
E1 = [1, 2], E2 = [1, 2, 2], E3 = [1, 2, 2, 2]
where, “1” represents the reflector and “2” represents the spacer. Therefore, the VD-MLI structure can be expressed as:
VD-MLI = [rep (E1, x1), rep (E2, x2), rep (E3, x3)]
where, “rep (E1, x1)” represents that the basic unit E1 was repeated x1 times. Then, x1, x2, x3 are the design parameters of VD-MLI. For example, the design parameters of the VD-MLI shown in Figure 1 are x1 = 3, x2 = 2, x3 = 1. The thickness of the VD-MLI (D) can be determined from the design parameters,
D = d s h n s h + d s p n s p
where, d s h is the thickness of a reflector layer (mm), n s h is the total number of reflectors, n = x 1 + x 2 + x 3 d s p is the thickness of the spacer element (mm) and n s p is the number of spacers. By reading the position and number of reflectors and spacers, the solid conduction via the total thickness of spacers between two adjacent reflectors and thermal radiation can be obtained using Equations (1) and (3), and given parameters such as residual gas pressure, the gas thermal conduction can be calculated by Equation (2). Based on the energy conservation of each layer, the insulation performance of the VD-MLI can be calculated.
The LBL model based on design parameters can be solved as shown in Figure 3. This study proposes a section on design parameterization, and the LBL model can be used to design a VD-MLI with the new method. It is a significant improvement of the conventional LBL model.

2.3. Optimization Objectives

Given the total number of reflector layers or the total thickness of VD-MLI, there are multiple configurations of the reflector and spacer layers, and these configurations present different insulation performances. The optimal configuration could be achieved in the aspects of thickness, total number of layers and heat flux. Optimization objectives can be expressed as:
m i n   [ | f 1 ( X ) - D | ,   | f 2 ( X ) - q t i | ,   | f 3 ( X ) - n s h |
where, X is the design parameter, X = [ x 1 , x 2 , x 3 ], f1(x) is the corresponding total thickness of the designed VD-MLI and [D] is the objective thickness which is a array with k dimensions [D1, D2, D3,…, Dk]. When the number of reflector layers is determined, a group of thicknesses are set as objectives and they can take the values between the minimum thickness Dmin and the maximum thickness Dmax. f2(X) is the corresponding heat flux density of the designed VD-MLI and f3(X) is the corresponding reflector layers of the design parameters. q t i is the desired heat flux of the VD-MLI. It can be set as a very small value.
The sample set of design parameters are generated by the sampling algorithm [21,22] to obtain the corresponding performance parameters [D], [ n s h ], [ q t ] by LBL simulations, the composition of the sample set is as follows, the detail of initial sample set is shown in Appendix A, which concludes 25 samples.
x 11 x 21 x 31 D 41 n s h 51 q t 61 x 12 x 22 x 32 D 42 n s h 52 q t 62 x 1 n x 2 n x 3 n D 4 n n s h 5 n q t 6 n
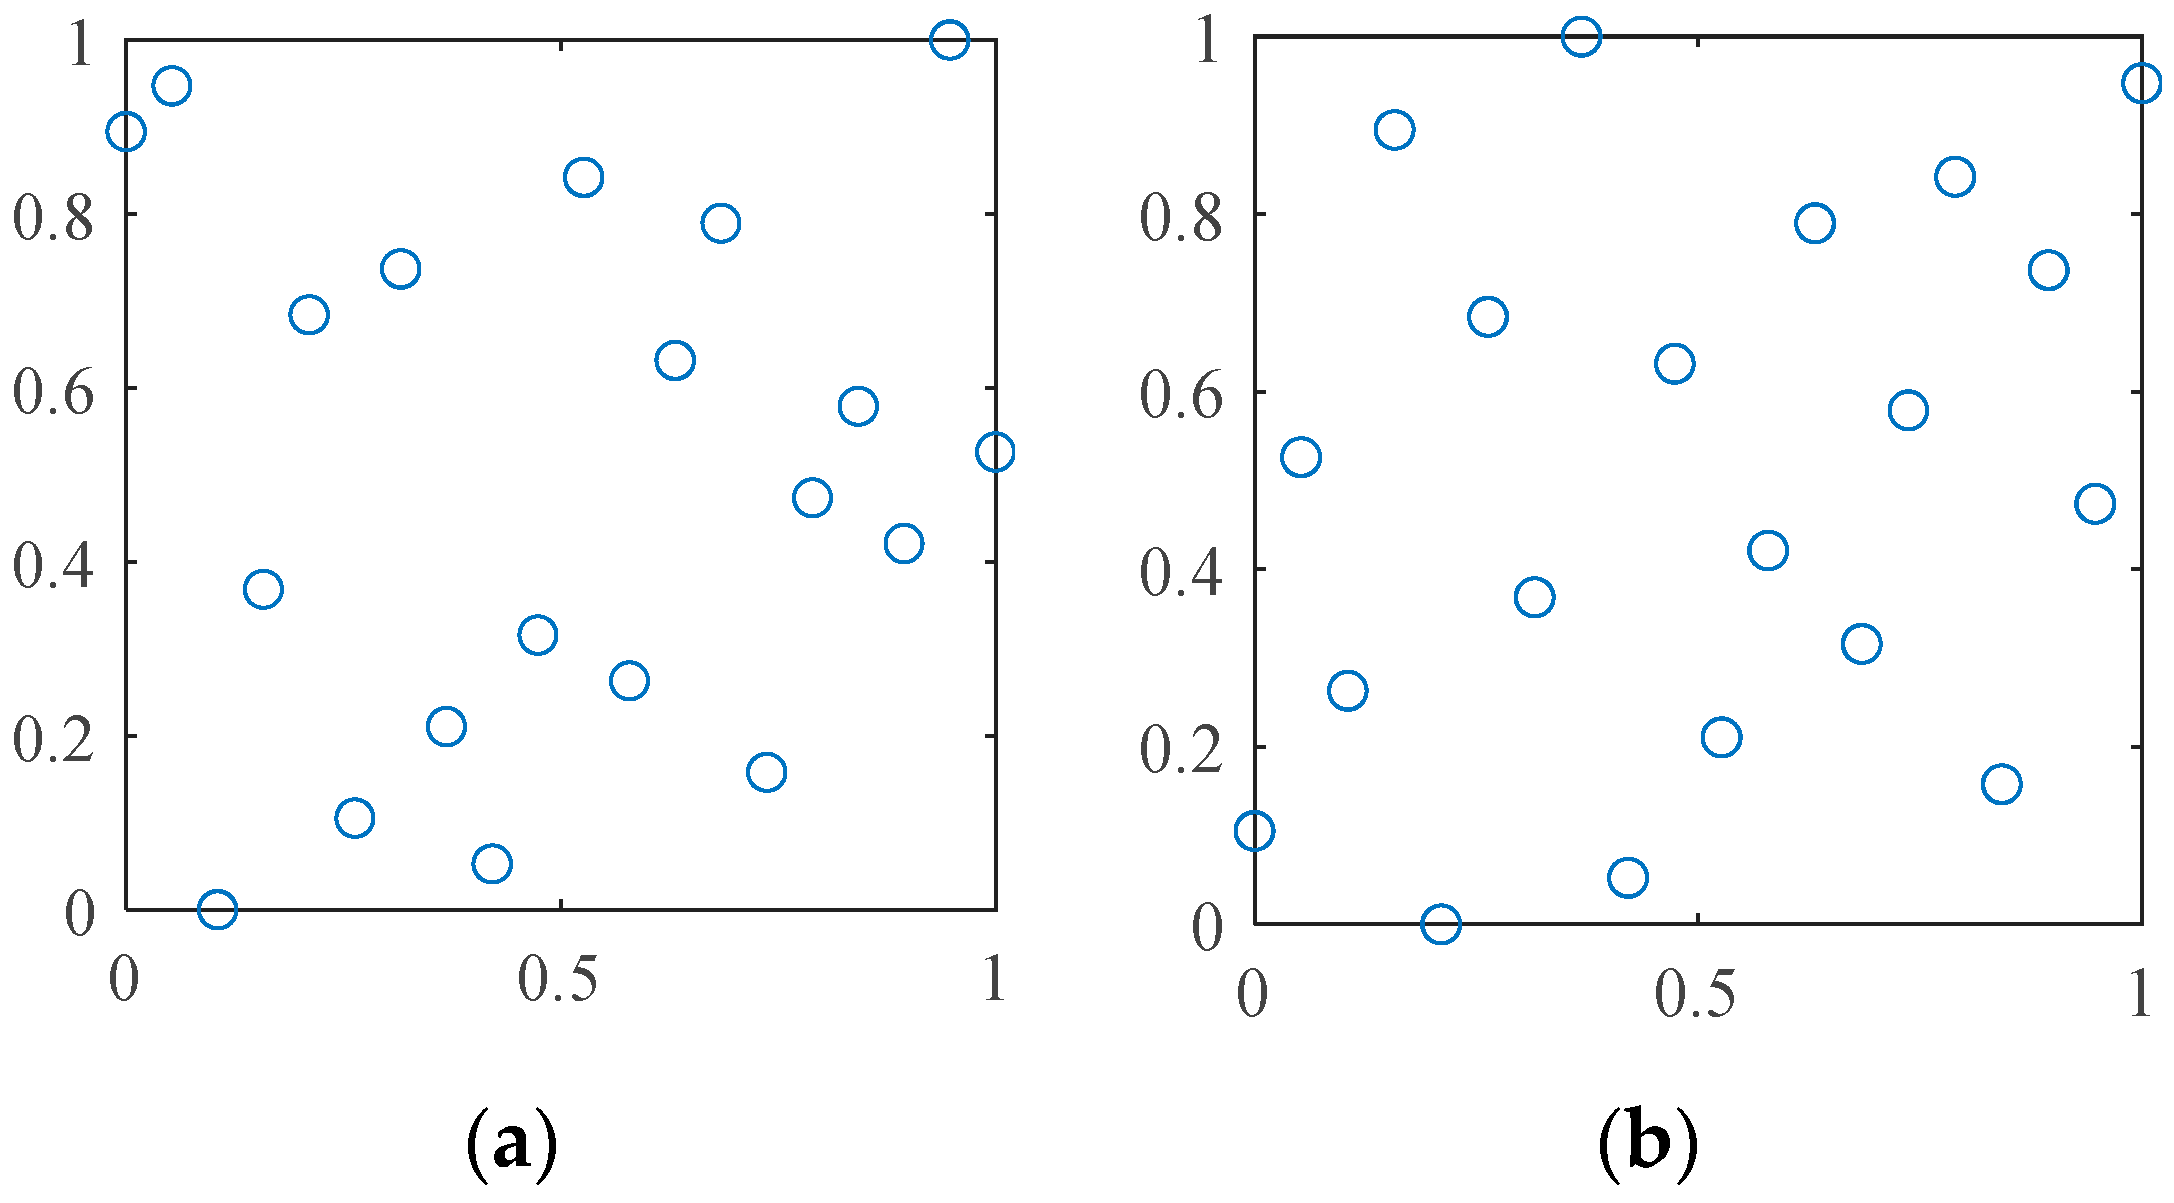
The optimal Latin hypercube sampling (OLHS) used in this paper is compared with the Latin hypercube sampling (LHS). The corresponding results are shown in Figure 4. Compared with the LHS, OLHS optimizes the spacing of the generated samples and the samples are distributed more evenly across the whole design domain.

2.4. POD GRNN Surrogate Model

Sample set matrix A m × n , A R m × n can be decomposed by Singular Value Decomposition (SVD) or Proper Orthogonal Decomposition (POD) as:
A m × n = U m × m Σ m × n V n × n T
where, U represents the orthogonal basis coefficient matrix, U = u 1 , u 2 , u m R m × m , Σ V T represents the basis matrix, Σ V T = Σ V T 1 , Σ V T 2 , Σ V T m R m × m and any one of the samples in A can be expressed as a linear combination of the unique set of orthogonal basis coefficients U with Σ V T .
Σ V T = Φ = Φ a , Φ b
where, Φ a is the orthogonal basis corresponding to the input parameters ( Φ a = [ Φ 1 , Φ 2 , , Φ k ] ), Φ b is the orthogonal basis corresponding to the output parameters ( Φ b = [ Φ k + 1 , Φ k + 2 , , Φ m ] ). The prediction of output parameters Y is as:
Y = j = 1 m   β j Φ b j
where, β is the orthogonal basis coefficient ( β = [ β 1 , β 2 , , β j ] ), which can be obtained by nonlinear regression of GRNN [18]. The details of the GRNN can be found in the relevant literature. GRNN is a kind of radial basis neural network (RBFNN) [23,24]. It has strong nonlinear mapping ability and flexible network structure as well as high fault tolerance and robustness. It is suitable for solving nonlinear problems. Moreover, GRNN has more advantages than RBF network in approximation ability and learning speed. The network finally converges to the global optimal with more sample size accumulation, and it can also be used to predict with limited sample data.
β j = S N j S D j = 1,2 , , m
where, S N j , S D are probability density function,
S N j = i = 1 n   U i j P i
S D = i = 1 n   P i
where, P i represents the Gaussian radial basis weight of the input parameters.
P i = exp X X i T X X i 2 σ 2 i = 1,2 , , n
where, σ represents the length scale for the input space, which can be performed by 5-fold cross-validation of the sample set.

2.5. Optimization Framework

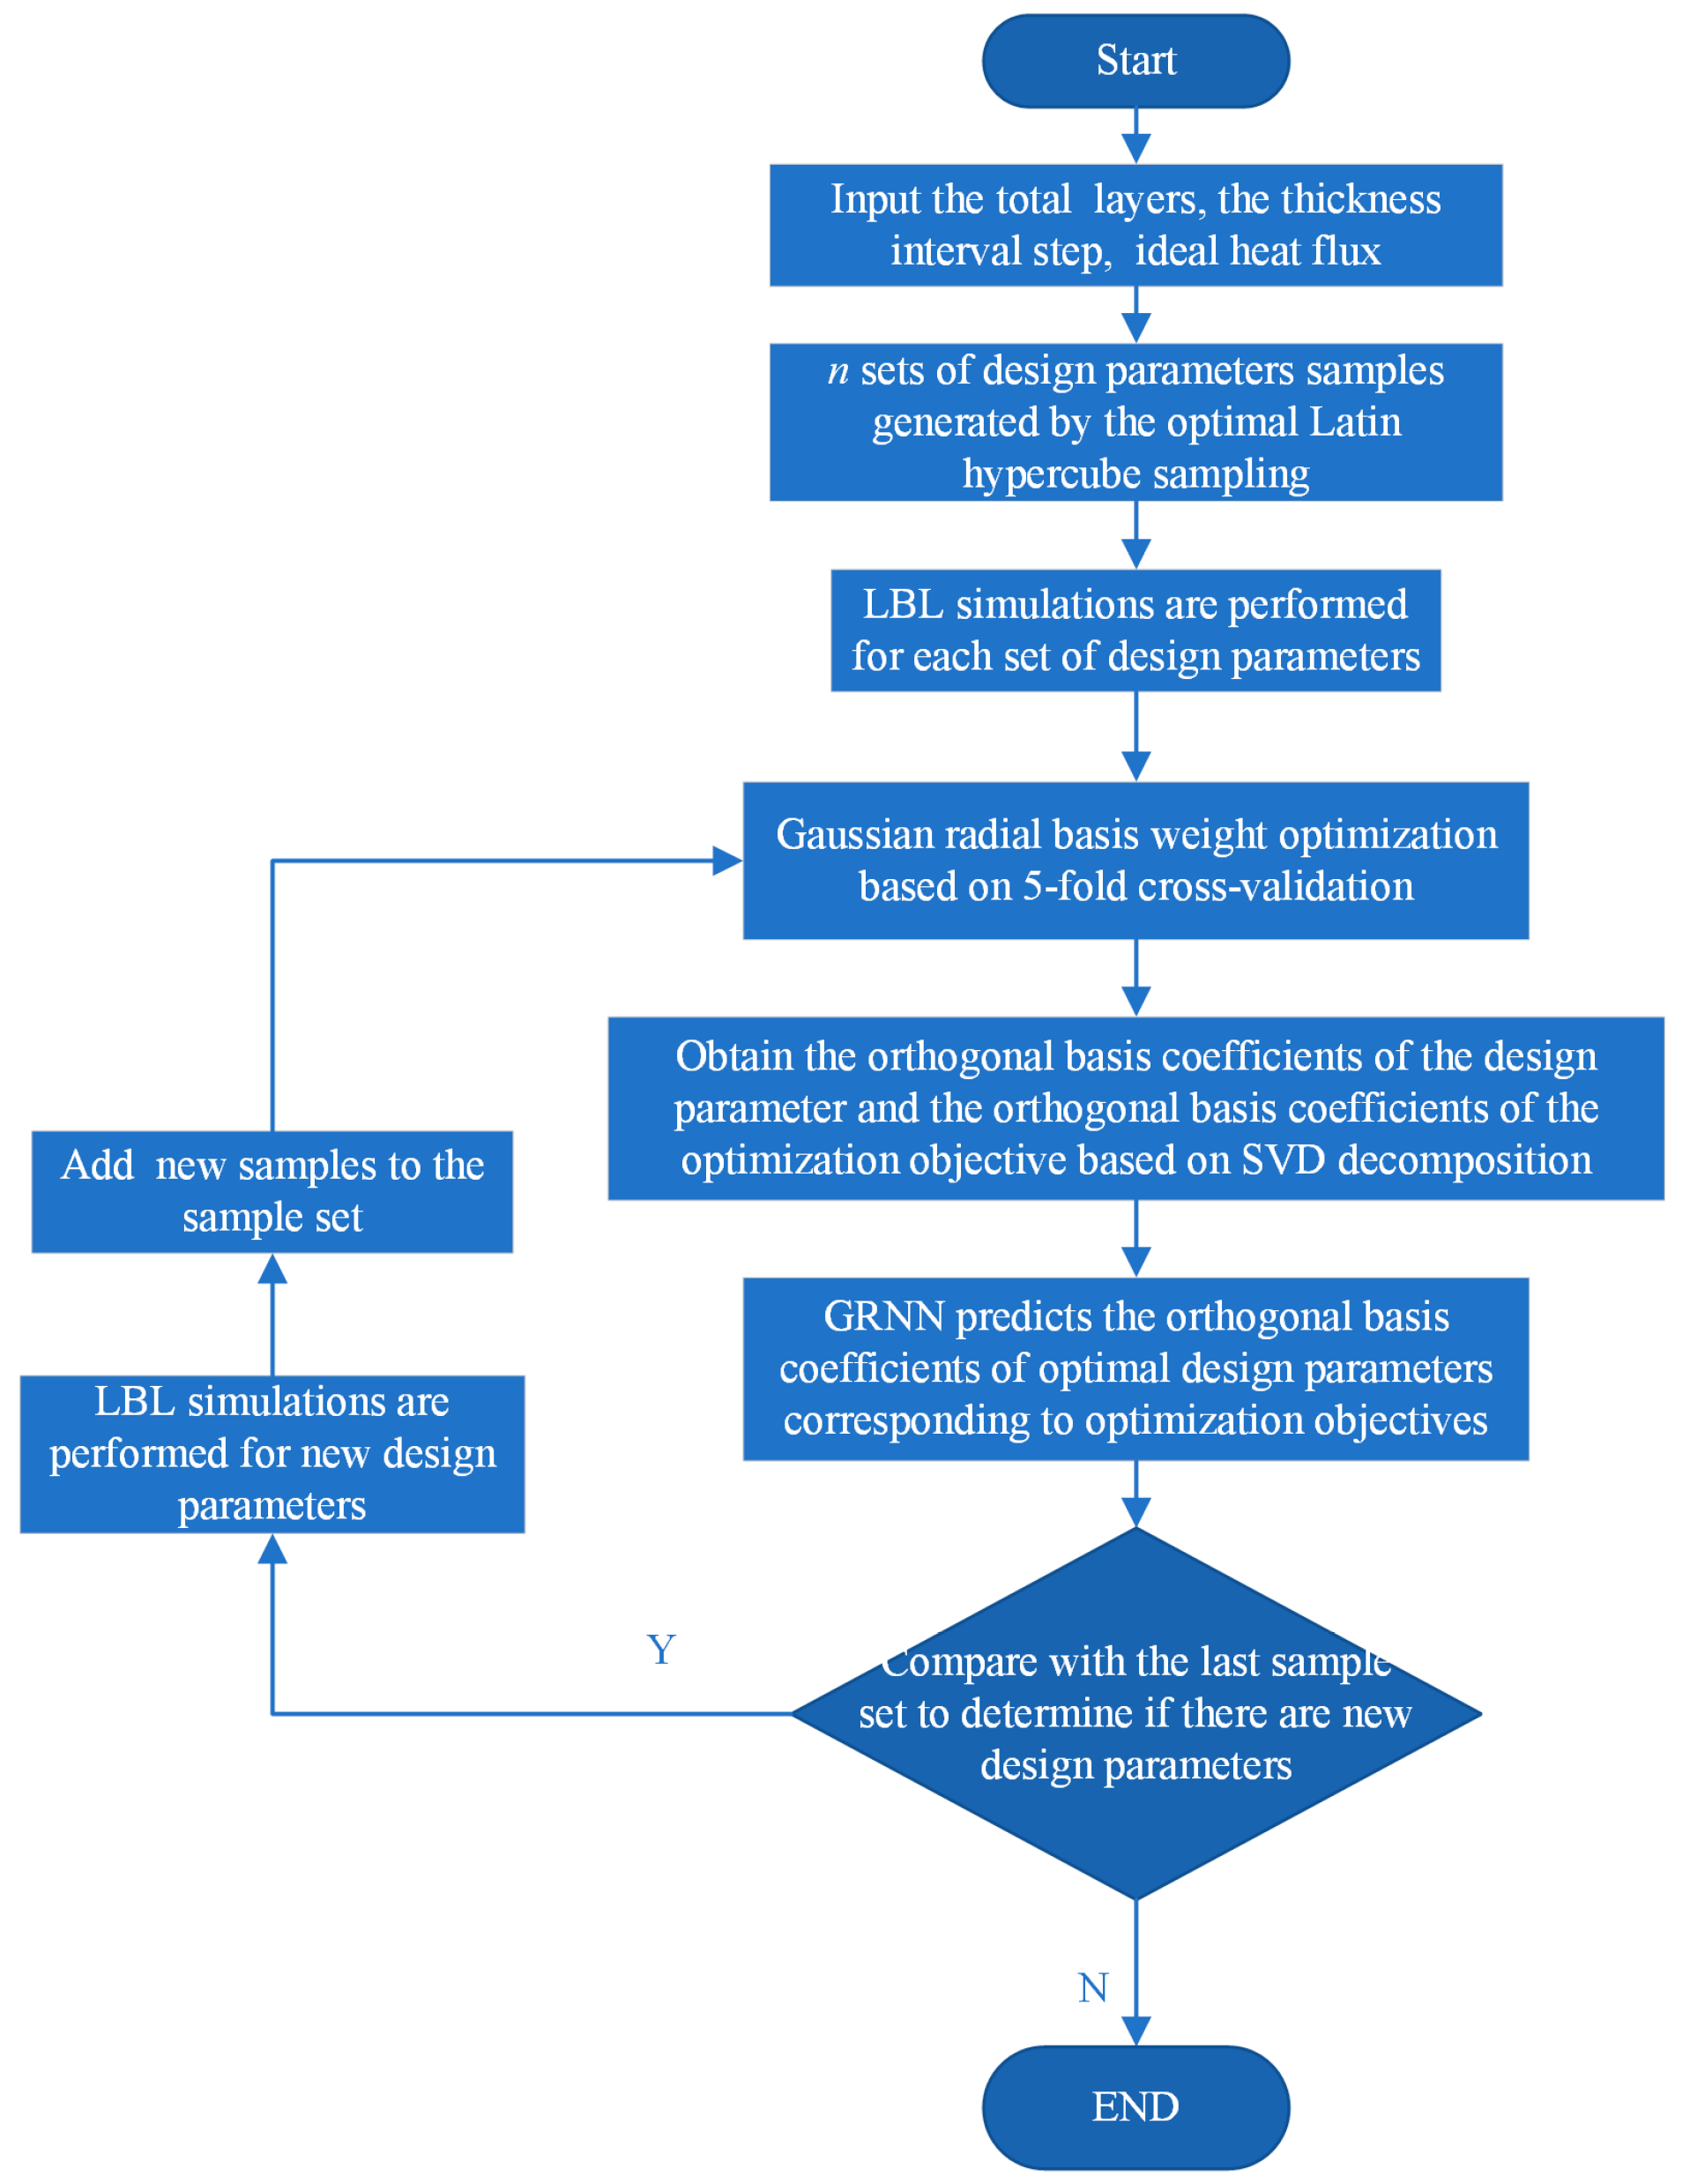
The optimization framework of this study is shown in Figure 5. The input parameter X in Equation (19) is the performance index of VD-MLI, including [D], [ n s h ], [qi]. The output parameters are the design parameters of VD-MLI, i.e., [ x 1 , x 2 , x 3 ]. The optimization objective is shown in Equation (11). The optimization can be conducted by the following steps.
Step 1 Input   objective   parameters   [ n s h 1 o b j , n s h 2 o b j , n s h n o b j ] ,   [ q t 1 o b j ,   q t 2 o b j …, q t n o b j ] ,   [ D 1 o b j ,   D 2 o b j ,   D n o b j ] ;
Step 2n   set   of   design   parameters   generated   by   the   optimal   Latin   hypercube   sampling   [ X 1 0 ; X 2 0 ;…; X n 0 ] ,   x 1 [ 0 , n s h ] ,   x 2 [ 0 , n s h ] ,   x 3 [ 0 , n s h ];
Step 3 LBL   model - based   simulation   are   performed   for   each   design   parameter   and   obtained   performance   parameters   [ n s h 1 0 , n s h 2 0 , n s h n 0 ] ,   [ q t 1 0 ,   q t 2 0 …, q t n 0 ] ,   [ D 1 0 ,   D 2 0 , ,   D n 0 ] ;
Step 4Design parameters and performance parameters are combined as initial sample set;
Step 5The sample set is divided into a validation set and a test set, and the Gaussian weights σ are determined by 5-fold cross-validation;
Step 6 SVD   decomposition   of   the   sample   set ,   obtained   the   basis   matrix   Σ V T = Φ = Φ a , Φ b ;   Φ a   represents   the   coefficients   of   design   parameters ,   Φ b represents the coefficients of performance parameters.
Step 7 Based   on   objective   parameters ,   obtain   Φ a   from   GRNN ,   and   reconstruct   the   optimal   design   parameter   matrix   [ X 1 1 ; X 2 1 ;…; X n 1 ] from Equation (15),
Step 8 Obtain   the   disjoint   parts   of   the   design   parameters   as   the   next   generation   of   optimal   design   parameters ,   [ X 1 n e w ; X 2 n e w ;…; X n n e w ] { [ X 1 1 ; X 2 1 ;…; X n 1 ] [ X 1 0 ; X 2 0 ; ;   X n 0 ] }
Step 9 LBL   model - based   simulation   of   the   new   design   parameters   to   obtain   the   corresponding   performance   parameters ,   [ n s h 1 n e w , n s h 2 n e w , n s h n n e w ] ,   [ q t 1 n e w ,   q t 2 n e w …, q t n n e w ] ,   [ D 1 n e w ,   D 2 n e w , ,   D n n e w ] ;
Step 10 Adding   [ X 1 n e w ; X 2 n e w ;…; X n n e w ], [ n s h 1 n e w , n s h 2 n e w , n s h n n e w ] ,   [ q t 1 n e w ,   q t 2 n e w …, q t n n e w ] ,   [ D 1 n e w ,   D 2 n e w , ,   D n n e w ] to the sample set;
Step 11Go to Step 5;
Step 12 If   there   are   no   new   design   parameters   obtained ,   [ X 1 n e w ; X 2 n e w ;…; X n n e w ] = , then finish the optimization;
Step 13Select the design parameter matrix from the sample set as the optimal result.
In this optimization process, the diversity of the sample set can be achieved by continuously adding new samples, and the prediction accuracy of GRNN can be enhanced. If the obtained optimal design parameters finish updating, it can be assumed that the optimization converges.
3. Results and Discussion

3.1. Validation of the Simulation Model

Zheng [25] provides a UD-MLI (uniform density MLI) composed of 50 layers of reflectors with a thickness of 42 mm. The thermal insulation performance of the MLI was tested with a liquid nitrogen calorimeter. The basic parameters are listed in Table 2. The experimental data in the literature are used to validate the LBL model in this study.
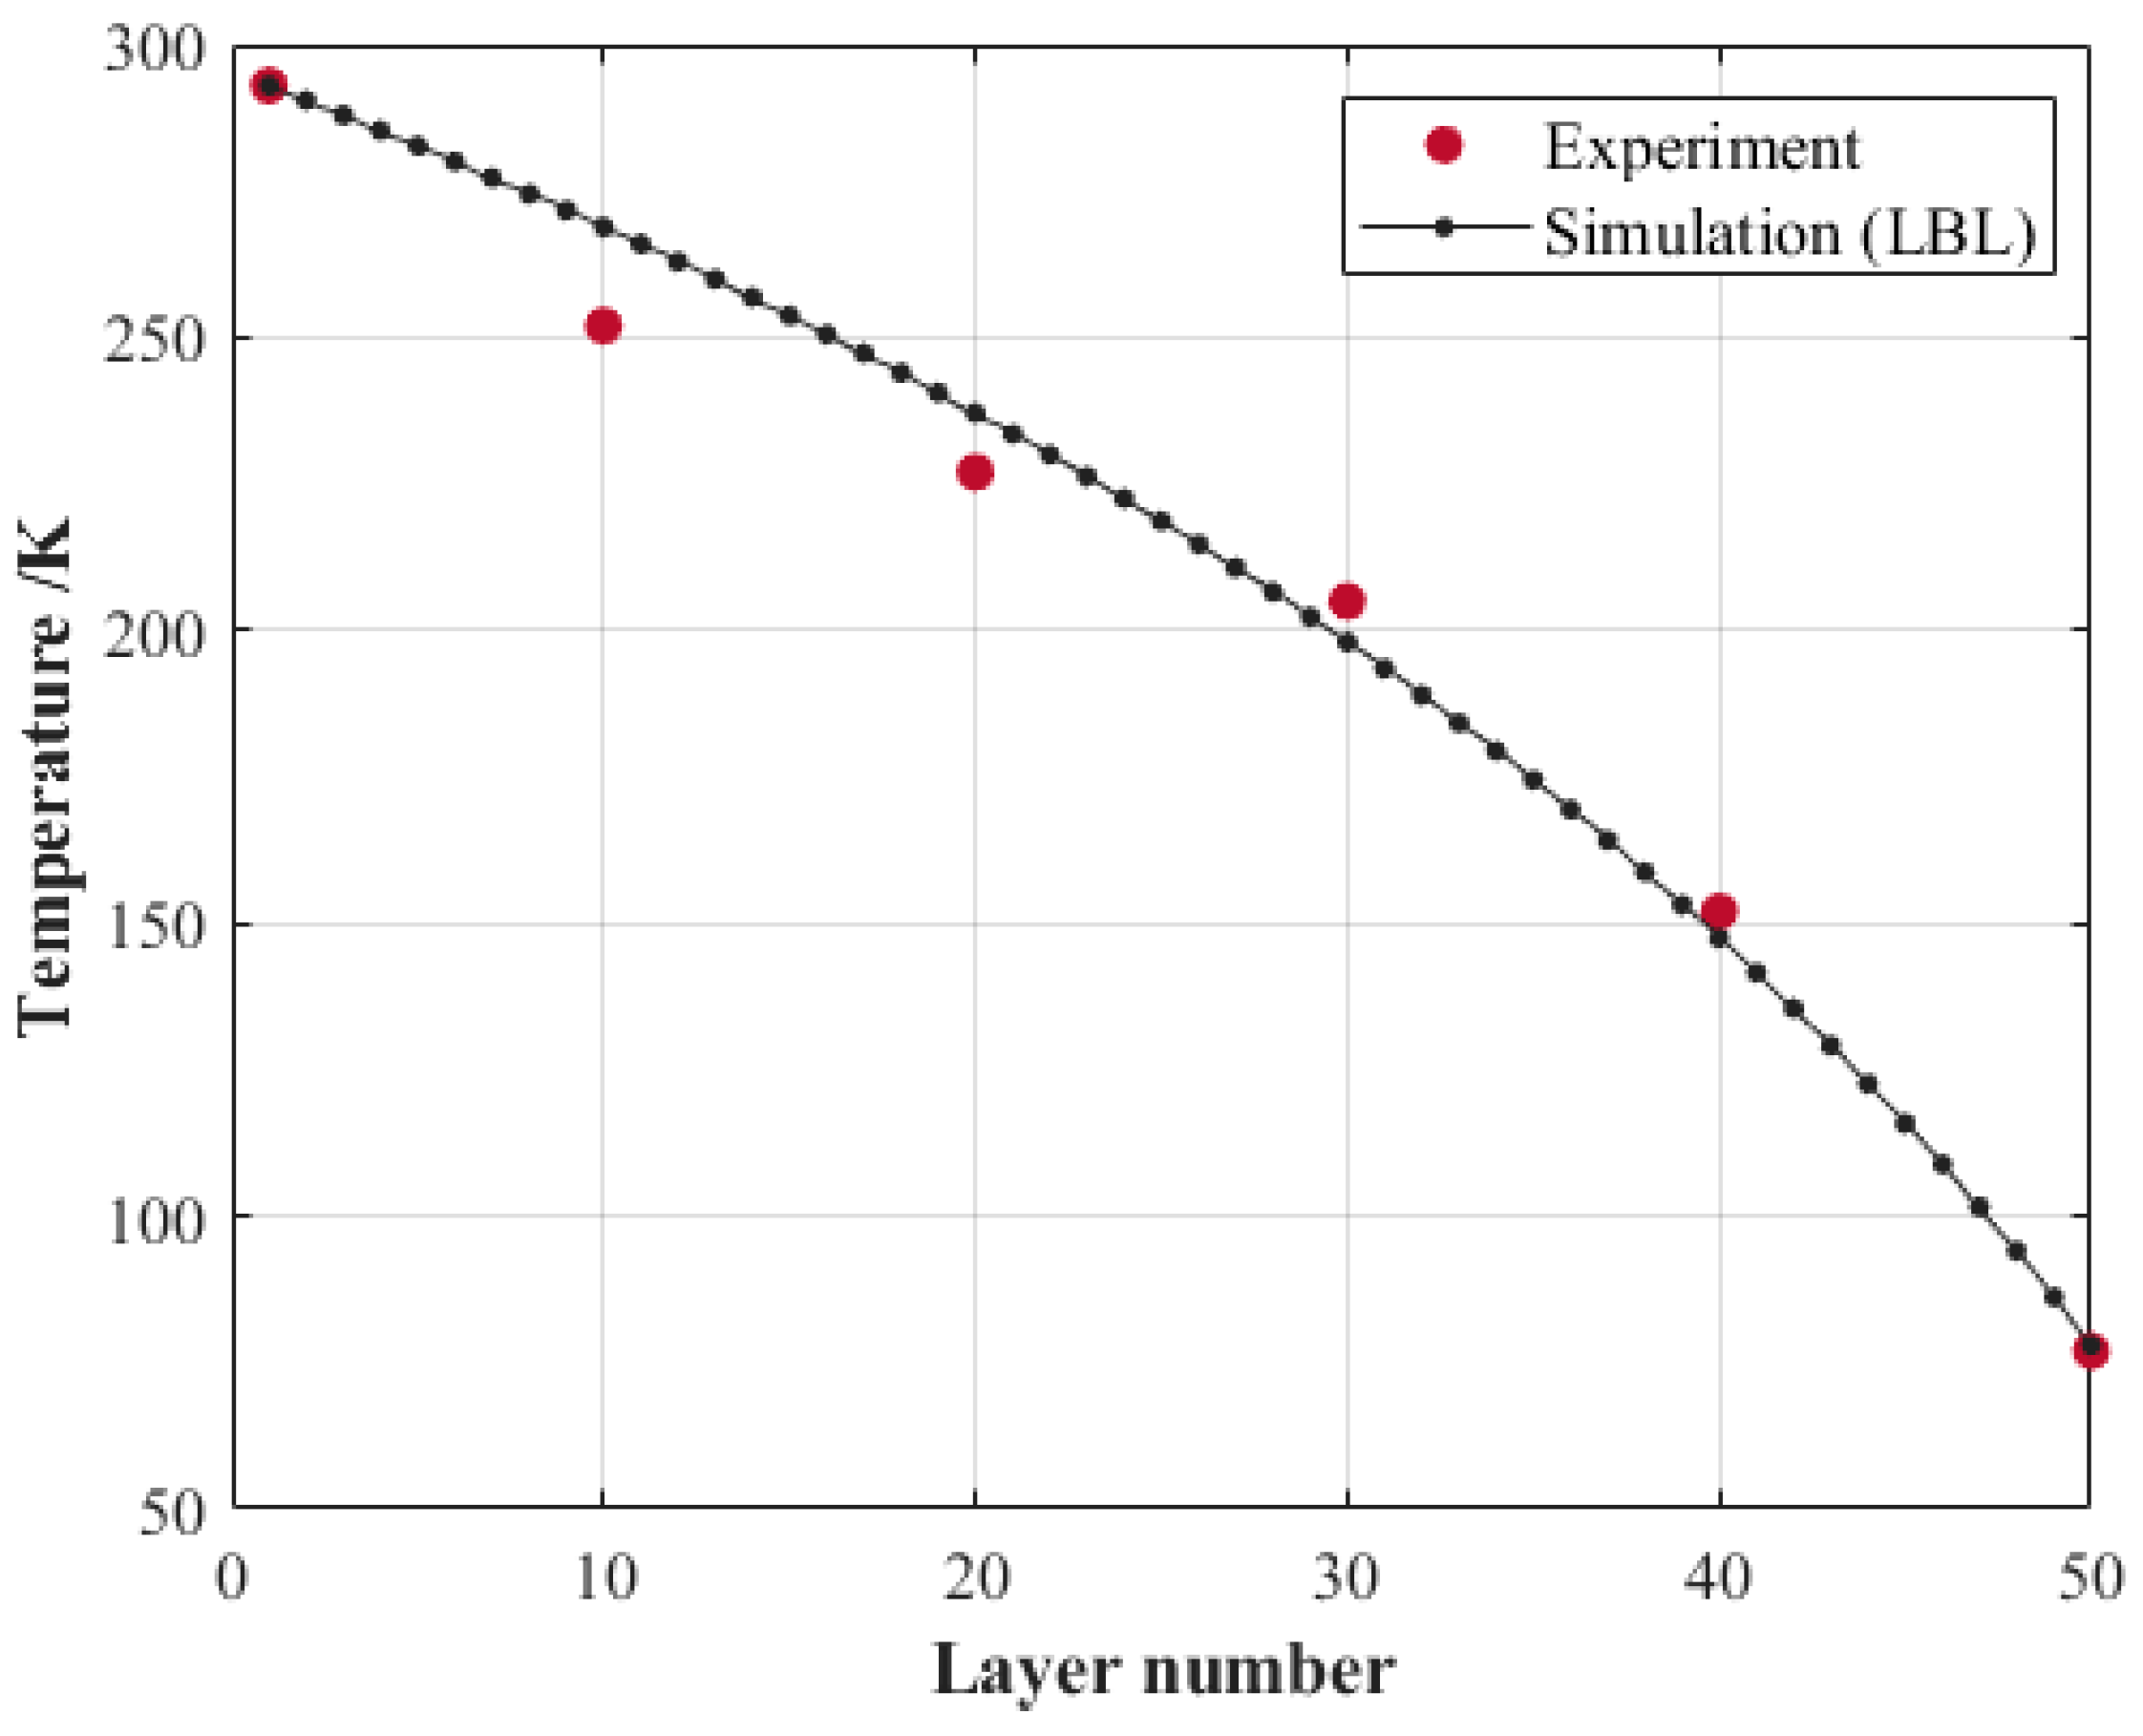
Using the design parameterization and LBL model, the simulated temperatures of the reflectors were compared with the experimental results, as is shown in Figure 6. In the experiment, the MLI reflector was polyester film with Al coating on both sides, and the perforation rate was between 0.05% and 0.1%. The spacer layer was made of polyester net and the internal pressure of the storage was 0.1 MPa. The temperature at six points were measured in layers 0, 10, 20, 30, 40 and 50, and the hot boundary (layer 0).
As shown in Figure 6, the simulated results are in a good agreement with the experimental data. The heat flux of the MLI is 0.5678 W/m2 in the experimental study. The simulated heat flux of the MLI is 0.555 W/m2, which deviates from the experimental result by less than 2.3%. It can be found that the simulation based on the LBL model is reliable for this study.

3.2. Multi-Objective Optimization of a VD-MLI

The number of the reflector layers of a VD-MLI is preset as 30, and the basic parameters are shown in Table 1. The minimum and maximum thicknesses of the VD-MLI are 14.58 mm for the configuration of [30, 0, 0] and 35.42 mm for the configuration of [0, 0, 30], respectively. The thickness of the VD-MLI varies in the range of 14.58 to 35.42 mm for different configurations and the thermal insulation performance of these configurations vary greatly. Given the objectives shown in Equation (11), the multi-objective optimization of the VD-MLI is conducted as the process shown in Figure 5. The optimal solutions at 16 thicknesses can be obtained, and are listed in Table 3.
IL (Interval length) indicates the interval thickness, where reflector density is 0.0463 g/cm2 and spacer density is 0.0598 g/cm2.
As can be seen in Table 3, the heat leakage of the VD-MLI is alleviated as the thickness increases and the density of the VD-MLI increases significantly as the thickness increases. When the thickness of the VD-MLI is in the range of 14.58 mm to 18.75 mm, only a few layers of the basic insulation units of E2 are used to replace the insulation unit E1. It can be seen that the heat leakage of the VD-MLI can be reduced. If the limited thickness of the VD-MLI is increased to the thickness range of 20.14 mm to 28.47 mm, more insulation units E2 could be used in the new configurations and the heat leakage could be reduced further. When the limited thickness of the VD-MLI is in the thickness range of 28.47 mm to 35.42 mm, more insulation units E3 should be used in the VD-MLI structure, and the heat leakage of the VD-MLI can be decreased.
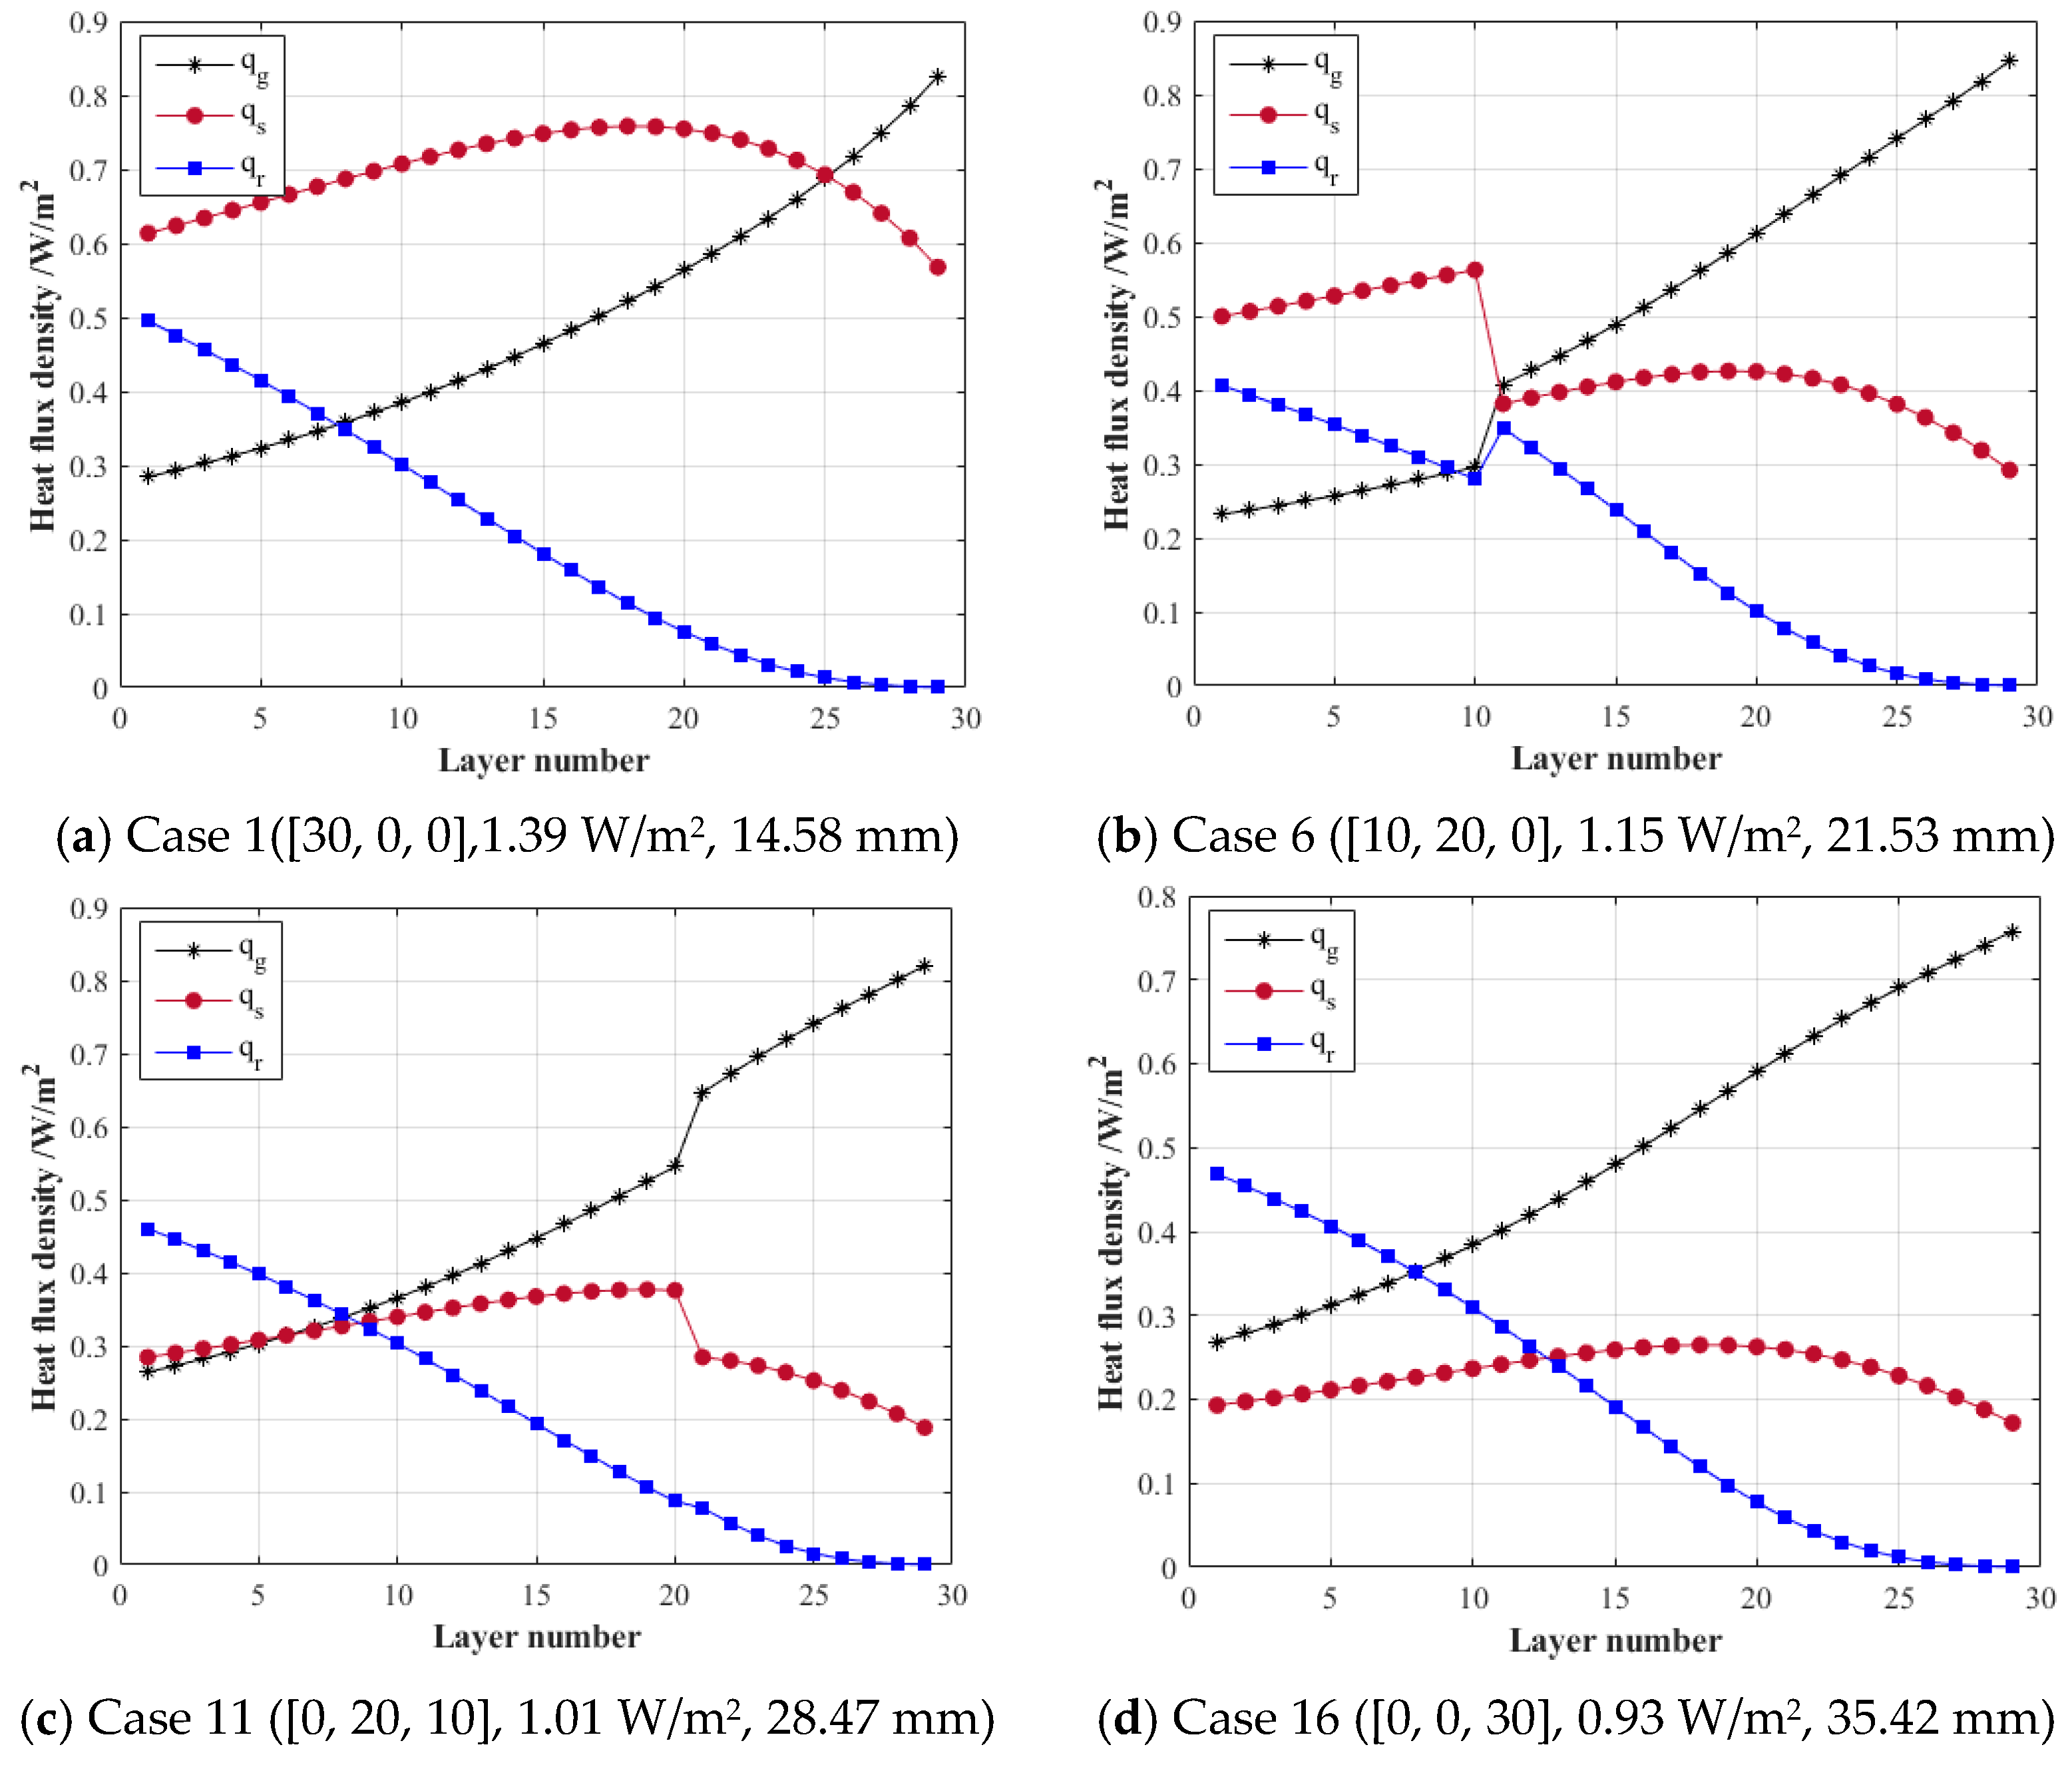
The heat fluxes of four configurations of the VD-MLI (Case 1, 6, 11 and 16 in Table 2) are displayed in Figure 7. It can be seen the heat flux of the radiation decreases and the residual gas conduction heat flux increases as the reflector temperature decreases. As shown in Figure 7a,d, the heat fluxes in the MLI with uniform density (i.e., Case 1 and Case 16) present the same variation trend. It can be seen that the heat fluxes of residual gas conduction and radiation are not affected by the increase in the spacer layers. While the heat flux of solid conduction was reduced significantly because more layers of spacer were applied in the MLI. For the VD-MLI composed of different insulation units, the heat fluxes in the VD-MLI present abrupt changes at the boundary of two adjacent zones. As shown in Figure 7b,c, abrupt changes of heat fluxes in the VD-MLI could be found due to the variation of spacer layers in the basic insulation units (E1, E2 and E3). It can be seen that the heat flux of solid conduction could be decreased considerably due to the using of the insulation units with more spacer layers.

3.3. The Optimization Results Based on the Reduce-Ordered Surrogate Model

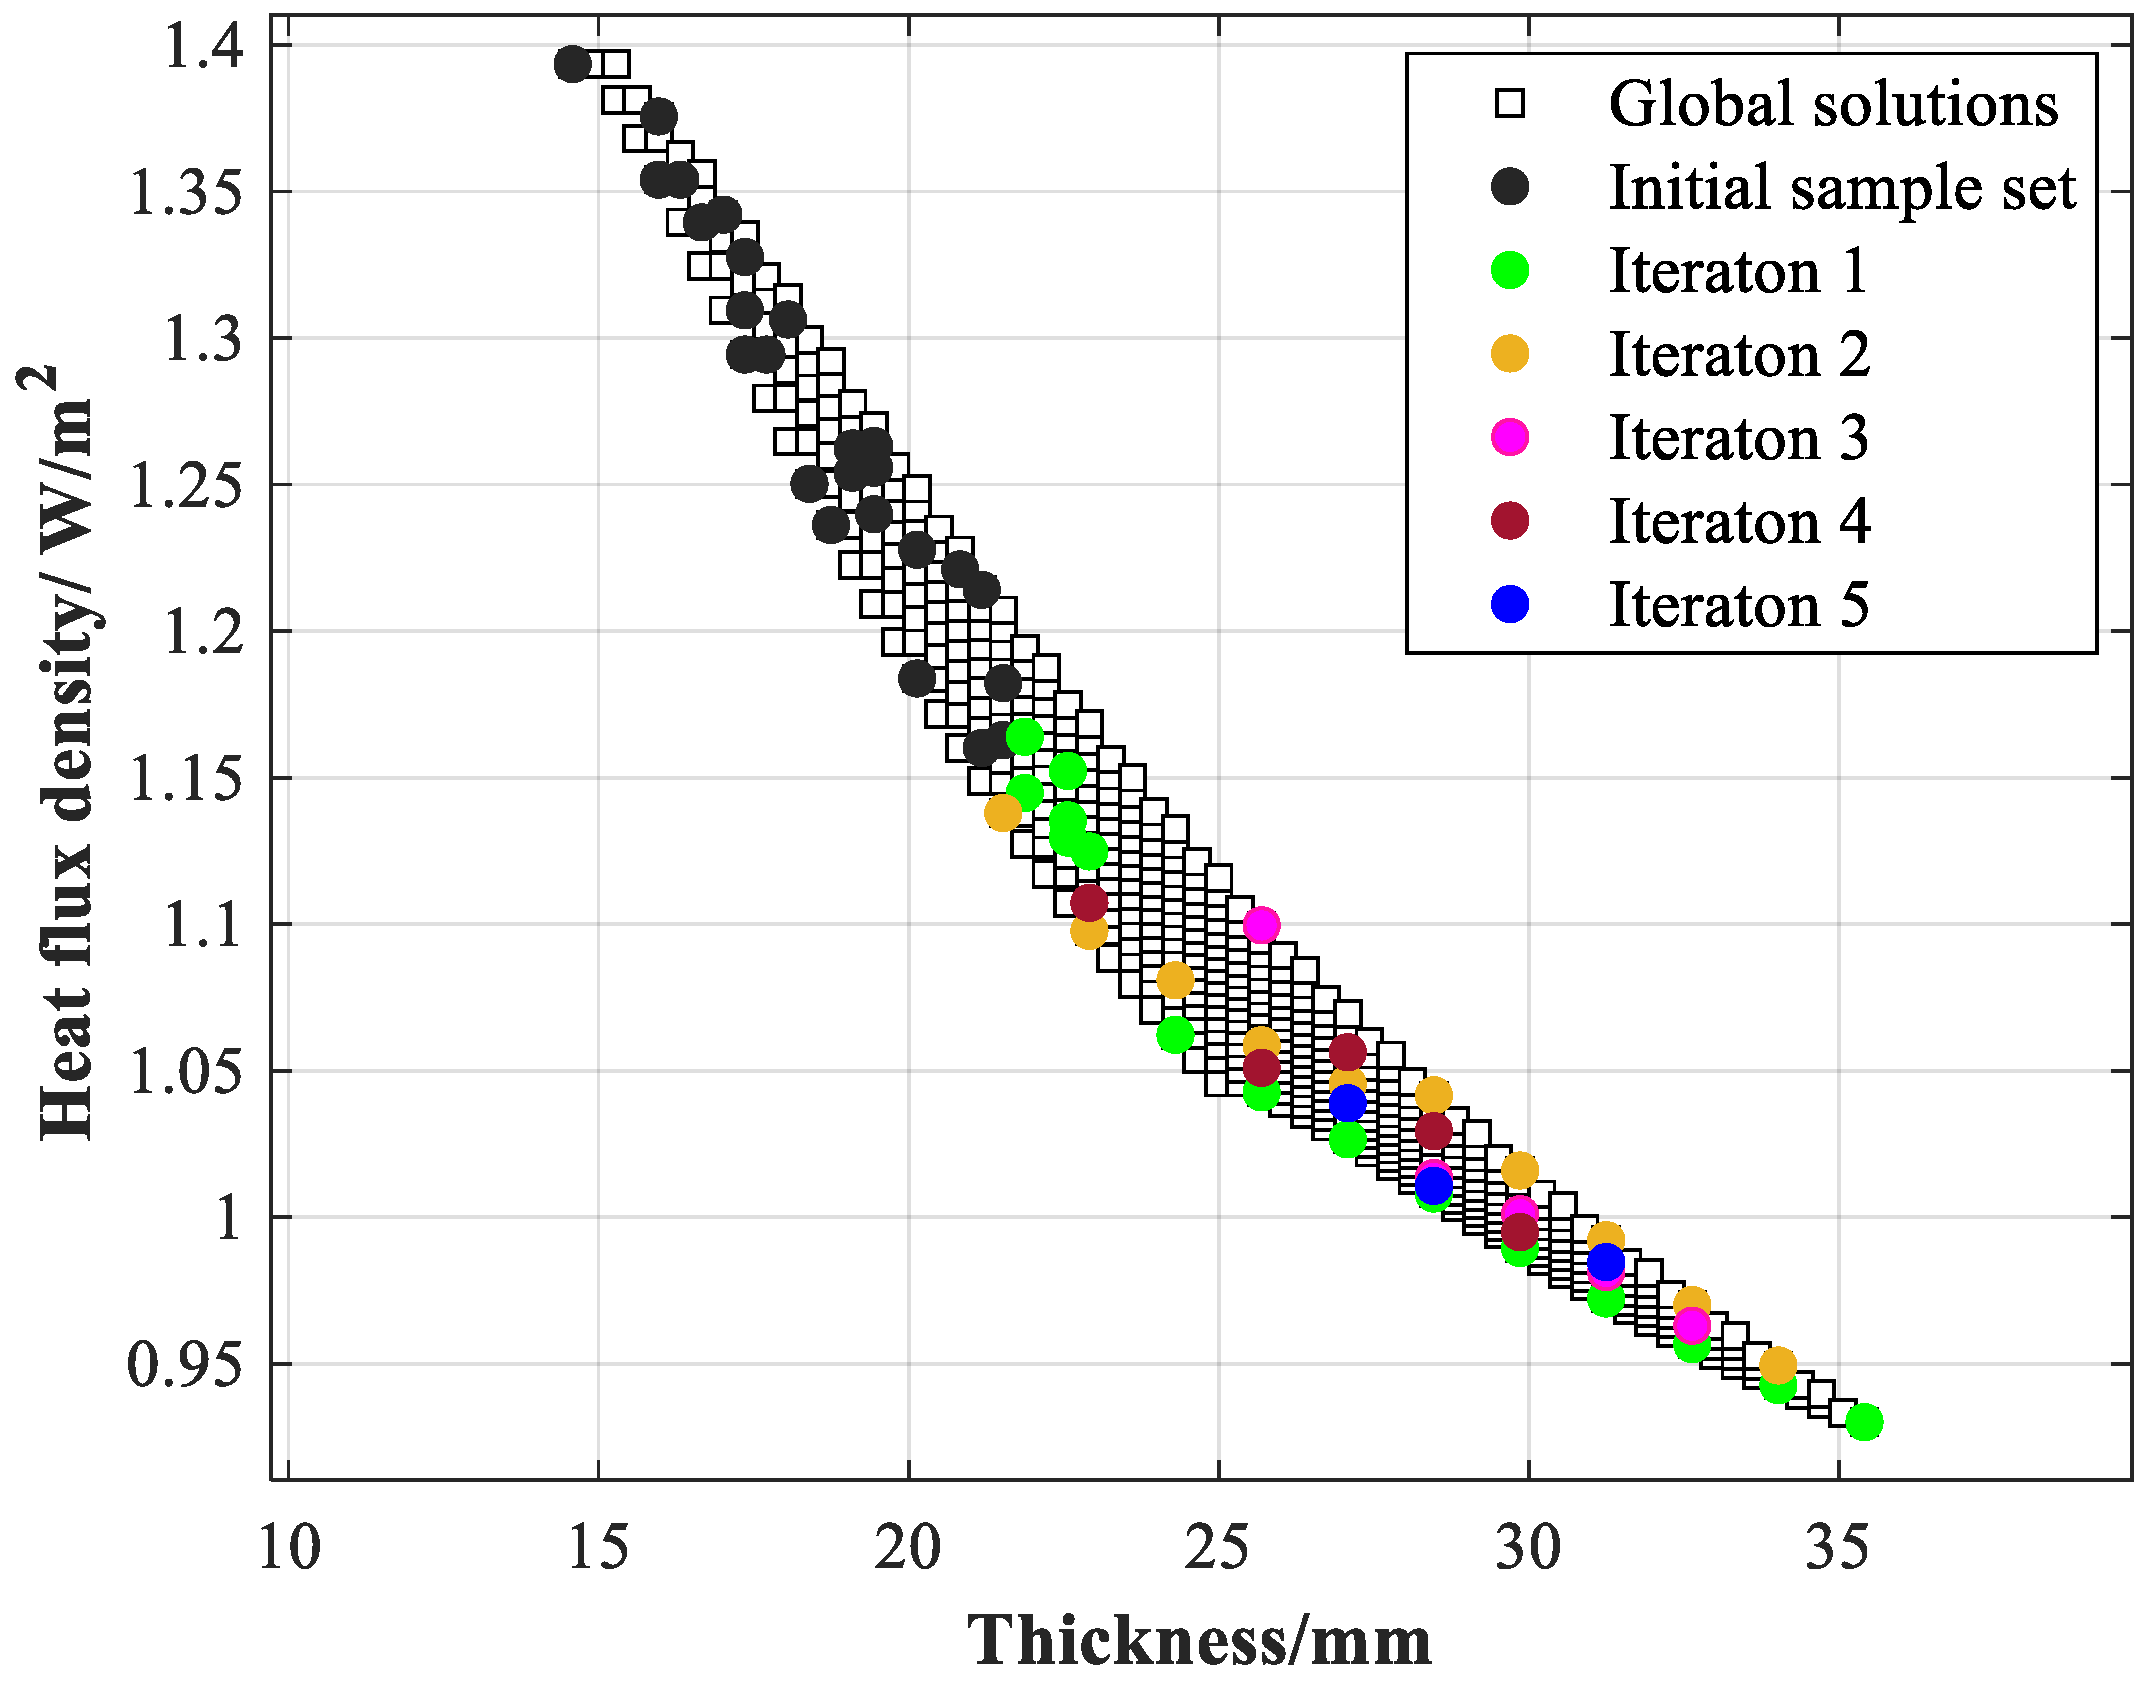
For an optimization of VD-MLI with a large number of reflectors and complicated configuration, an enumeration method is time consuming. In order to verify the optimal design results in Table 3, all configurations (496 configurations) of design parameters for x1 + x2 + x3 = 30, x1 ∈ [0, 30], x2 ∈ [0, 30] and x3 ∈ [0, 30] can be filtered by the enumeration method. LBL model-based simulation is performed for each configuration separately to determine the thermal insulation performance. The position of the optimization results in Table 3 in the global solutions and additional samples per iteration are shown in Figure 8.
In this study, the iterations were limited to less than 10 times. However, the optimization converged after five iterations. It can be seen in Figure 8 that the final sample set consists of 66 samples, of which, 25 are initial samples and 41 samples are added in the optimization iteration. A distribution of 15, 10, 5, 5 and 6 samples are added successively in the following iterations. It is worth noting that most of the optimal results are obtained in the first iteration. The samples obtained in following iterations can improve the diversity of the sample set, and the missing optimal results could be found by several iterations. Hence, the optimization mechanism of this study is effective enough for the optimization of VD-MLI design.
There are more than eight configurations at each thickness in the range of 20 mm to 30 mm, and the maximum heat flux difference is in the range of 0.05 to 0.1 W/m2. Nine iterations of the surrogate optimization are performed, and seventeen optimal configurations are found, corresponding to each thickness, with an optimal rate of 100%.
The optimal dimensionality reduction distribution of the original sample set is obtained by POD method. The General Regression Neural Network (GRNN) is used to achieve regression of orthogonal basis coefficients by the Gaussian kernel function. As the optimization progresses, the optimal points of the dimensionality reduction data gradually become close to the optimal results of the enumeration method, and the optimized samples are continuously added to the optimization frontier. It is proven that the optimization of the high-dimensional distribution data can be obtained indirectly through the surrogate optimization. The method is also applicable to the VD-MLI optimization with more complex limitations.

4. Conclusions

In this study, a multi-objective optimization of VD-MLI with complex constraints is conducted to improve the thermal insulation performance of the MLI in liquid hydrogen containers. A high-precision simulation model using a layer-by-layer (LBL) model is verified by experimental data. The number of repetitions of the basic insulation unit is used as the design parameter. A sample set consisting of multiple VD-MLI design parameters is obtained by sampling algorithms. The Proper Orthogonal Decomposition (POD) method is used to obtain the coefficient and the orthogonal basis on the sample set, and General Regression Neural Network (GRNN) is adopted to preform regression of orthogonal basis coefficients. The output parameters of the VD-MLI can be reconstructed by linear combination of regression. In single-objective and multi-objective optimization, the optimal design parameters can be obtained by a small number of iterations based on the prediction of POD GRNN.
For a VD-MLI with 30 layers of reflectors, the optimal configuration could be determined when the total thickness of the VD-MLI was limited. It can be found that the thermal insulation performance of the VD-MLI would be improved by applying more spacers in the low temperature zone. The POD GRNN surrogate optimization framework is used to obtain the optimal 16 design parameters among 496 global solutions after nine iterations. It is proven that the proposed method is applicable for VD-MLI multi-optimization. The optimal dimensionality reduction distribution of the original data distribution is obtained by GRNN regression of the POD orthogonal basis coefficient, and the optimal solution in the original dimension can be obtained indirectly by optimization of the low-dimensional data distribution. The proposed optimization method can be used to obtain the optimal design parameters for VD-MLI with more complex constraints, and it could be used for the design of other insulation structures for liquid hydrogen or liquid helium storage. The optimization framework can also be combined with other optimization algorithms to form a co-evolutionary mechanism, and it is suitable for more complicated insulation structures.

Author Contributions

Conceptualization, H.W. and H.T.; methodology, H.W.; software, H.W. and Z.X.; validation, H.W. and Z.X. and Y.L.; formal analysis, H.T.; investigation, H.T.; resources, H.W.; data curation, H.W.; writing—original draft preparation, H.W.; writing—review and editing, H.T.; visualization, H.W.; supervision, H.T. and Y.L.; project administration, H.T.; funding acquisition, H.T. All authors have read and agreed to the published version of the manuscript.

Funding

This research was funded by [National Key R&D Program of China] grant number [2020YFB1506203].

Institutional Review Board Statement

Not applicable.

Informed Consent Statement

Not applicable.

Data Availability Statement

The data have been published in the manuscript.

Conflicts of Interest

The authors declare no conflict of interest.

Nomenclature

A—sample set matrix
D—the objective thickness, m
d s h —the thickness of reflector, mm
d s p —the thickness of the spacer between two adjacent reflectors, mm
ks—the thermal conductivity of the spacer, W / m · K
M—molecular weight of residual gas, kg/mol
P i —the Gaussian radial basis of the input parameters
q r —radiation heat flux, W / m2
q s —solid conduction heat flux, W / m2
q g —gas conduction heat flux, W / m2
q t —total heat flux, W / m2
q t i —the ideal heat flux density, W / m2
R—gas constant, 8.314 kJ / mol · K
S N j —the probability density function
S D —the probability density function
T h —hot boundary temperature, K
T c —cold boundary temperature, K
T i —the temperature of adjacent reflectors, K
U—the orthogonal basis coefficient matrix
α —accommodation coefficient
β —the orthogonal basis coefficient obtained from regression of GRNN
γ —specific heat ratio,
ε —the emissivity of the hot and cold reflectors
σ s —the Stephan-Boltzmann constant, W / m · K
σ —the length scale for the input space
Σ V T —the basis matrix
Y—the prediction of output parameters
Φ —the orthogonal basis corresponding to the input parameters

Appendix A

Table A1. The initial sample set generated by the sampling method.
Case Numberx1x2x3qt (W/m2)nshTotal Thickness (mm)
128021.3803015.972
226311.3543016.319
326221.3483016.666
4181201.2363018.749
5171301.2223019.097
6171211.2223019.444
721451.2563019.444
820461.2353020.138
9131701.1723020.485
1021091.2283020.833
11151051.1763021.527
1217581.1823021.874
1382201.1173022.221
1492011.1273022.221
1515871.1643022.221
16182101.1813022.221
17111541.1353022.569
1862401.0983022.916
19121261.1363022.916
20164101.1573022.916
21101551.1203023.263
221211171.1303023.263
2313981.1353023.263
2491651.1103023.610
25101461.1153023.610

References

  1. Keller, C.W.; Cunnington, G.R.; Glassfor, A. Thermal Performance of Multi-Layer Insulations; Final Report; Contract NAS3-14377, Lockheed Missiles & Space Company: Littleton, CO, USA, 1974. [Google Scholar]
  2. Sagmiller, D.; Hartwig, J.; Colozza, A.; Landis, G.; Oleson, S. Thermal modeling for the Triton Hopper. Cryogenics 2021, 114, 103–146. [Google Scholar] [CrossRef]
  3. McIntosh, G.E. Layer by layer MLI calculation using a separated mode equation. In Advances in Cryogenic Engineering; Springer: Boston, MA, USA, 1994; pp. 1683–1690. [Google Scholar]
  4. Hastings, L.J.; Hedayat, A.; Brown, T. Analytical Modeling and Test Correlation of Variable Density Multilayer Insulation for Cryogenic Storage; NASA: Washington, DC, USA, 2004.
  5. Johnson, W.L. Thermal Performance of Cryogenic Multilayer Insulation at Various Layer Spacing; College of Engineering and Computer Science, University of Central Florida: Orlando, FL, USA, 2010. [Google Scholar]
  6. Wang, B.; Huang, Y.H.; Li, P.; Li, P.; Sun, P.J.; Chen, Z.C.; Wu, J.Y. Optimization of variable density multilayer insulation for cryogenic application and experimental validation. Cryogenics 2016, 80, 154–163. [Google Scholar] [CrossRef]
  7. Scott, R.B. Thermal design of large storage vessels for liquid hydrogen and helium. J. Res. Natl. Bur. Stand. 1957, 58, 317. [Google Scholar] [CrossRef]
  8. Zheng, J.P.; Chen, L.B.; Wang, J.; Xi, X.; Zhu, H.; Zhou, Y.; Wang, J. Thermodynamic analysis and comparison of four insulation schemes for liquid hydrogen storage tank. Energy Convers. Manag. 2019, 186, 526–634. [Google Scholar] [CrossRef]
  9. Jiang, W.B.; Zou, Z.Q.; Huang, Y.H.; Wang, B.; Sun, P.J.; Li, P. Coupling optimization of composite insulation and vapor-cooled reflector for on-orbit cryogenic storage tank. Cryogenics 2018, 96, 90–98. [Google Scholar] [CrossRef]
  10. Huang, Y.H.; Wang, B.; Zhou, S.H.; Wu, J.; Lei, G.; Li, P.; Sun, P. Modeling and experimental study on combination of foam and variable density multilayer insulation for cryogen storage. Energy 2017, 123, 487–498. [Google Scholar] [CrossRef]
  11. Shi, C.Y.; Zhu, S.L.; Wan, C.C.; Bao, S.; Zhi, X.; Qiu, L.; Wang, K. Performance analysis of vapor-cooled shield insulation integrated with para-ortho hydrogen conversion for liquid hydrogen tanks. Int. J. Hydrog. Energy 2023, 48, 3078–3090. [Google Scholar] [CrossRef]
  12. Wang, P.; Ji, L.; Yuan, J.; An, Z.; Yan, K.; Zhang, J. Modeling and optimization of composite thermal insulation system with HGMs and VDMLI for liquid hydrogen on orbit storage. Int. J. Hydrog. Energy 2020, 45, 88–97. [Google Scholar] [CrossRef]
  13. Liu, Z.; Li, Y.Z.; Xie, F.S.; Zhou, K. Thermal performance of foam/MLI for cryogenic liquid hydrogen tank during the ascent and on orbit period. Appl. Therm. Eng. 2016, 98, 430–4399. [Google Scholar] [CrossRef]
  14. Fesmirea, J.E.; Johnson, W.L. Cylindrical cryogenic calorimeter testing of six types of multilayer insulation systems. Cryogenics 2018, 89, 58–75. [Google Scholar] [CrossRef]
  15. Sirovich, L. Turbulence and the dynamics of coherent structures. I—Coherent structures. II—Symmetries and transformations. III—Dynamics and scaling. Q. Appl. Math. 1987, 45, 561–571. [Google Scholar] [CrossRef]
  16. Beck, J.; Friedrich, D.; Brandani, S.; Fraga, E.S. Multi-objective optimization using surrogate models for the design of VPSA systems. Comput. Chem. Eng. 2015, 82, 318–329. [Google Scholar] [CrossRef]
  17. Phiboon, T.; Khankwa, K.; Petcharat, N.; Phoksombat, N.; Kanazaki, M.; Kishi, Y.; Bureerat, S.; Ariyarit, A. Experiment and computation multi-fidelity multi-objective airfoil design optimization of fixed-wing UAV. J. Mech. Sci. Technol. 2021, 35, 4065–4072. [Google Scholar] [CrossRef]
  18. Specht, D.F. A general regression neural network. IEEE Trans Neutral Netw. 1991, 2, 568–576. [Google Scholar] [CrossRef] [PubMed]
  19. Jacob, S.; Kasthurirengan, S.; Karunanithi, R. Investigations into the thermal performance of multilayer insulation (300-77 K) Part 2: Thermal analysis. Cryogenics 1992, 32, 1147–1153. [Google Scholar] [CrossRef]
  20. Bapat, S.L.; Narayankhedkar, K.G.; Lukose, T.P. Experimental investigations of multilayer insulation. Cryogenics 1990, 30, 711–719. [Google Scholar] [CrossRef]
  21. Viana, F.A.C.; Venter, G.; Balabanov, V. An algorithm for fast optimal Latin hypercube design of experiments. Int. J. Numer. Methods Eng. 2010, 82, 135–156. [Google Scholar] [CrossRef]
  22. Pholdee, N.; Sujin, B. An efficient optimum Latin hypercube sampling technique based on sequencing optimization using simulated annealing. Int. J. Syst. Sci. 2015, 46, 1780–1789. [Google Scholar] [CrossRef]
  23. Prasad, K.V.; Hanumesh, V.; Kumar Swamy, K.; Renuka, S. Pumpkin Seeds Classification: Artificial Neural Network and Machine Learning Methods. J. Int. Acad. Phys. Sci. 2023, 27, 23–33. [Google Scholar]
  24. Mehrotra, K.; Mohan, C.; Ranka, S. Elements of Artificial Neural Networks; The MIT Press: Cambridge, UK, 1997. [Google Scholar]
  25. Zheng, J.P. Experimental Study of Composite Insulation System for Liquid Oxygen Storage; Institute of Physics and Chemistry, Chinese Academy of Sciences: Beijing, China, 2019. [Google Scholar]
Figure 1. The reflector and spacer of the MLI.
Processes 11 01383 g001
Figure 2. The schematic diagram of the VD-MLI.
Processes 11 01383 g002
Figure 3. LBL model based on design parameters.
Processes 11 01383 g003
Figure 4. Sampling effect with LHS and OLHS methods: (a) LHS; (b) OLHS.
Processes 11 01383 g004
Figure 5. The optimization framework of this study.
Processes 11 01383 g005
Figure 6. A comparison of the simulated reflectors’ temperature with the experimental results.
Processes 11 01383 g006
Figure 7. Variation of heat flux density in different configurations.
Processes 11 01383 g007
Figure 8. The optimal configuration of the VD-MLI in the global solution set.
Processes 11 01383 g008
Table 1. The basic parameters of the VD-MLI.
ParametersValue
d s h ( m m ) 0.1389
d s p ( m m ) 0.3472
T h ( K ) 293
T c ( K ) 20
ε 7.39   ×   10 4   ×   T 2 / 3
k s   ( W / m · K) 8.823   ×   10 6 + 1.04   ×   10 7   ×   T
Residual gasHelium (5 × 10⁻² Pa)
Table 2. The basic parameters of MLI in Ref. [25].
ParameterValue
x142
x20
x30
d s h ( m m ) 0.56
d s p ( m m ) 0.28
T h ( K ) 293
T c ( K ) 77
ε0.04
ks ( W / m · K)4.5 × 10⁻⁶ ×   ( T 10 ) 0.5
Residual gasHelium (10−3 Pa)
Table 3. The parameters of the VD-MLI with optimal configurations.
Case Numberx1x2x3IL 1 (mm)IL 2 (mm)IL 3 (mm)qt (W/m2)Total Thickness
(mm)
Density
(g/cm2)
1300014.6001.3914.583.18
2264012.63.301.3515.973.42
Original261312.60.83.51.3417.013.60
3228010.76.701.2917.363.66
4181208.710.001.2418.753.90
5141606.813.301.1820.144.14
6102004.916.701.1421.534.38
762402.920.001.1022.924.62
822801.023.301.0624.304.86
90282023.32.41.0425.695.10
100246020.07.11.0327.085.34
1102010016.711.81.0128.475.58
1201614013.316.50.9929.865.82
1301218010.021.20.9731.256.06
14082206.726.00.9632.646.29
15042603.330.70.9434.036.53
1600300035.40.9335.426.77
Disclaimer/Publisher’s Note: The statements, opinions and data contained in all publications are solely those of the individual author(s) and contributor(s) and not of MDPI and/or the editor(s). MDPI and/or the editor(s) disclaim responsibility for any injury to people or property resulting from any ideas, methods, instructions or products referred to in the content.