Article

Experimental Study on Ratio Optimization of Similar Materials for Underground Mining of Shendong Coalfield: A Case Study of Shangwan Coal Mine

1
State Key Laboratory of Water Resource Protection and Utilization in Coal Mining, National Institute of Clean and Low Carbon Energy, Beijing 102209, China
2
School of Energy and Mining Engineering, China University of Mining and Technology-Beijing, Beijing 100083, China
3
China Construction Communications Engineering Group Co., Ltd., Beijing 100166, China
*
Author to whom correspondence should be addressed.
Processes 2023, 11(5), 1352; https://doi.org/10.3390/pr11051352
Submission received: 29 March 2023 / Revised: 16 April 2023 / Accepted: 25 April 2023 / Published: 27 April 2023
(This article belongs to the Special Issue Advanced Technologies of Deep Mining)

Abstract

:
Physical simulation is one of the effective methods to study mining problems, but the selection and proportion of simulation materials are greatly affected by the regional environment. This paper is based on a multilevel orthogonal design test scheme using sand, lime, and gypsum as the materials in the Shangwan coal mine in the Shendong coalfield, with the sand to cement ratio, paste to ash ratio, and maintenance days as variables. The effect of the polar difference method on the strength and density of gypsum was used as a reference for physical simulation in the Shendong coalfield. The sensitivity analysis of each factor was carried out by the polar difference method, and the influencing factors on density were, in descending order, sand to mortar ratio, mortar to ash ratio, and the number of maintenance days; the influencing factors on strength were, in descending order, mortar to ash ratio, maintenance days, and sand to mortar ratio. The sand cement ratio was negatively correlated with strength and density, the paste to ash ratio was positively correlated with strength and density, and the number of maintenance days was positively correlated with strength and negatively correlated with density. The multivariate non-linear regression analysis of sand to cement ratio and paste to ash ratio identified similar material proportioning test equations for the Shendong coalfield, which can improve the accuracy of physical simulation and be used to guide physical simulation experiments in the Shendong coalfield.

1. Introduction

Coal is a fundamental energy source essential for national development [1,2]. As depicted in Figure 1, coal production and consumption are critical components of the major energy powers worldwide, highlighting the significant role of the coal industry in advanced countries’ energy development. Despite its economic benefits, coal mining is plagued by disasters that can severely impact communities [3,4].
The prevention and control of coal mining disasters have been the focus of numerous studies conducted by experts and scholars, yielding significant results [5,6]. A key aspect of disaster prevention is the prediction of potential accidents in coal mines [7]. However, conducting in situ experiments in coal mines presents several challenges, including the difficulty of extracting rock from the underground environment and the variation in rock types obtained. To overcome these challenges, physical simulation experiments offer a viable approach. Nonetheless, selecting the appropriate ratio of similar materials is crucial prior to conducting physical model experiments. Researchers must create similar materials that closely replicate the conditions of the coal mine to observe the movement and fracture of the rock layer above the coal mining and develop countermeasures to ensure safe coal mining practices. Physical simulation experiments can typically replicate the actual conditions of a coal mine using similar materials. [8]. Through such experiments, researchers can calculate the actual roof break distance at a coal mine site and the load required by the support. The physical simulation experiment is a common research tool in the study of mining engineering problems, which can visually reflect the evolution characteristics of mine pressure in the coal mining process [9]. Its intent is to make a model similar to the prototype in the laboratory according to the similarity principle, and to observe the mechanical parameters and their distribution patterns in the model with the help of testing instruments, so as to infer the mechanical phenomena that may occur in the prototype and the patterns of pressure distribution in the rock mass [10,11]. The model can be used to solve practical problems in rock engineering production.
Physical simulation experiments were first introduced in the Soviet Union and rapidly developed in China [12,13]. Based on the dynamic characteristics of the stress distribution in the quarry, the stress distribution characteristics and collapse characteristics of the quarry, overburdened under different coal column widths, were studied by using the laboratory similar material simulation method [14]. In response to the concept of coordinated development of groundwater resource protection in western mining areas, the bottom plate permeation simulation test system was developed, and the change law of pore water pressure and seepage volume of groundwater reservoirs in the Shendong coalfield was studied [15]. Application of fiber optics to physical simulation experiments yielded the developmental extent of the water-conducting fracture zone [16,17]. Physical simulation experiments were used to simulate the evolution of rock structures and fracture development characteristics during mining [18,19]. The ratio selection of similar materials for marl at different weathering levels was derived from the experimental study [20]. Based on similarity, three theorems—the overburden breaking, incoming pressure step and bracing resistance, and periodic incoming pressure law of the working face under large mining height integrated mining conditions in shallow buried extra-thick coal seams—are studied in the laboratory using the plane similarity simulation method [21]. As the main method of preventing coal and gas prominence, the influence of upper protective layer mining on the permeability of lower coal seam was studied by physical simulation experiments, and the change rate of pressure relief gas seepage during the mining of protective layer was determined [22]. Using physical simulation and field monitoring methods, the overburden movement patterns of variable angle working face, and single angle working face, comprehensive mining of large inclined coal seams were compared and studied [23]. In order to reasonably and correctly estimate the pressure law and mineral pressure behavior of the roof, a physical simulation experiment was used to study the working surface mining pressure, roof movement, and roofing law [24]. Deformation failure of surface wells in mining areas is a key problem faced by surface well gas extraction technology, and based on three-dimensional physical similarity simulation and key layer theory, the deformation and failure of surface wells of different materials under the influence of the movement of mining rock mass were analyzed [25]. In terms of new materials, relying on the field exploration data of the Qingdao Jiaozhou Bay undersea tunnel, a new flow-solid coupled similar material (SCVO) consisting of sand, barite powder, talcum powder, cement, petroleum jelly, silicone oil, and the appropriate amount of mixing water, was developed by applying the flow-solid coupled similar theory of geomechanical model test [26]. Based on the research of solid model materials, a new solid-flow coupled similar material (PSTO) was developed by applying the solid-flow coupled similar theory and through extensive proportioning tests [27]. Based on the similar principle of geomechanical model test, a new type of iron crystal sand colloidal geotechnical similar material was developed by conducting a large number of mechanical tests [28].
However, determining the proportion of the mixture in each layer of rock before conducting such experiments can be a time- and resource-intensive task. This study aimed to conduct a basic experimental investigation on this situation, providing a foundation for researchers to select parameters in future experiments and avoid repetition. It is important to note that due to the complexity of mining geology and the variability of conditions from mine to mine, it is challenging to develop a universal model. The selection of similar material ratios is influenced by the region and environment, and the materials of the same ratio, different regions and different times may also have large differences, so the selection of similar material ratios should be studied according to the region. As such, a systematic study was conducted on Shangwan coal mine, which is a typical mine in Shendong coalfield, the largest integrated coal field in China with proven reserves accounting for 25 percent of the country’s total. By focusing on this specific mine, the researchers were able to develop more precise and reliable data, which can help to inform safe coal mining practices in the future. Finally, a three-dimensional physical model experiment of Shangwan coal mine 12,401 working face in Shendong coalfield was carried out by using the similar material ratio studied in this paper, which verifies the correctness and reliability of the similar material ratio in this paper.

2. Similar Material Proportioning Orthogonal Test Scheme

Mechanical analysis of the test specimens with various similar material ratios by orthogonal design method with material allocation based on similarity theory [29,30]. The similar material is a mixture of aggregate and cementitious material; the aggregate includes river sand, mica powder, etc., and the cementitious material includes gypsum, lime, etc. The strength of the similar material depends on the strength of the cement. The strength of the binder depends on the ratio of aggregate and binder and the ratio of the binder composition, that is, the material proportion, so before the model test, a large number of similar material proportioning work must be carried out. The mechanical properties of each material proportion should be measured, and it is necessary to configure a variety of similar materials. In the test, the aggregate mass/cement mass (sand to cement ratio), gypsum mass/lime mass (paste to ash ratio), and moisture content of the specimen (substituted by the number of days the specimen was placed in maintenance) were used as the three influencing factors [31,32] in the orthogonal test. The test specimens were cubic specimens of 100 mm side length [33,34] for uniaxial compressive strength test and density test; the specific levels are specified in Table 1. The model was made in strict accordance with the prescribed ratios and the error of aggregate weighing was 1% to ensure the accuracy and rigor of the test.

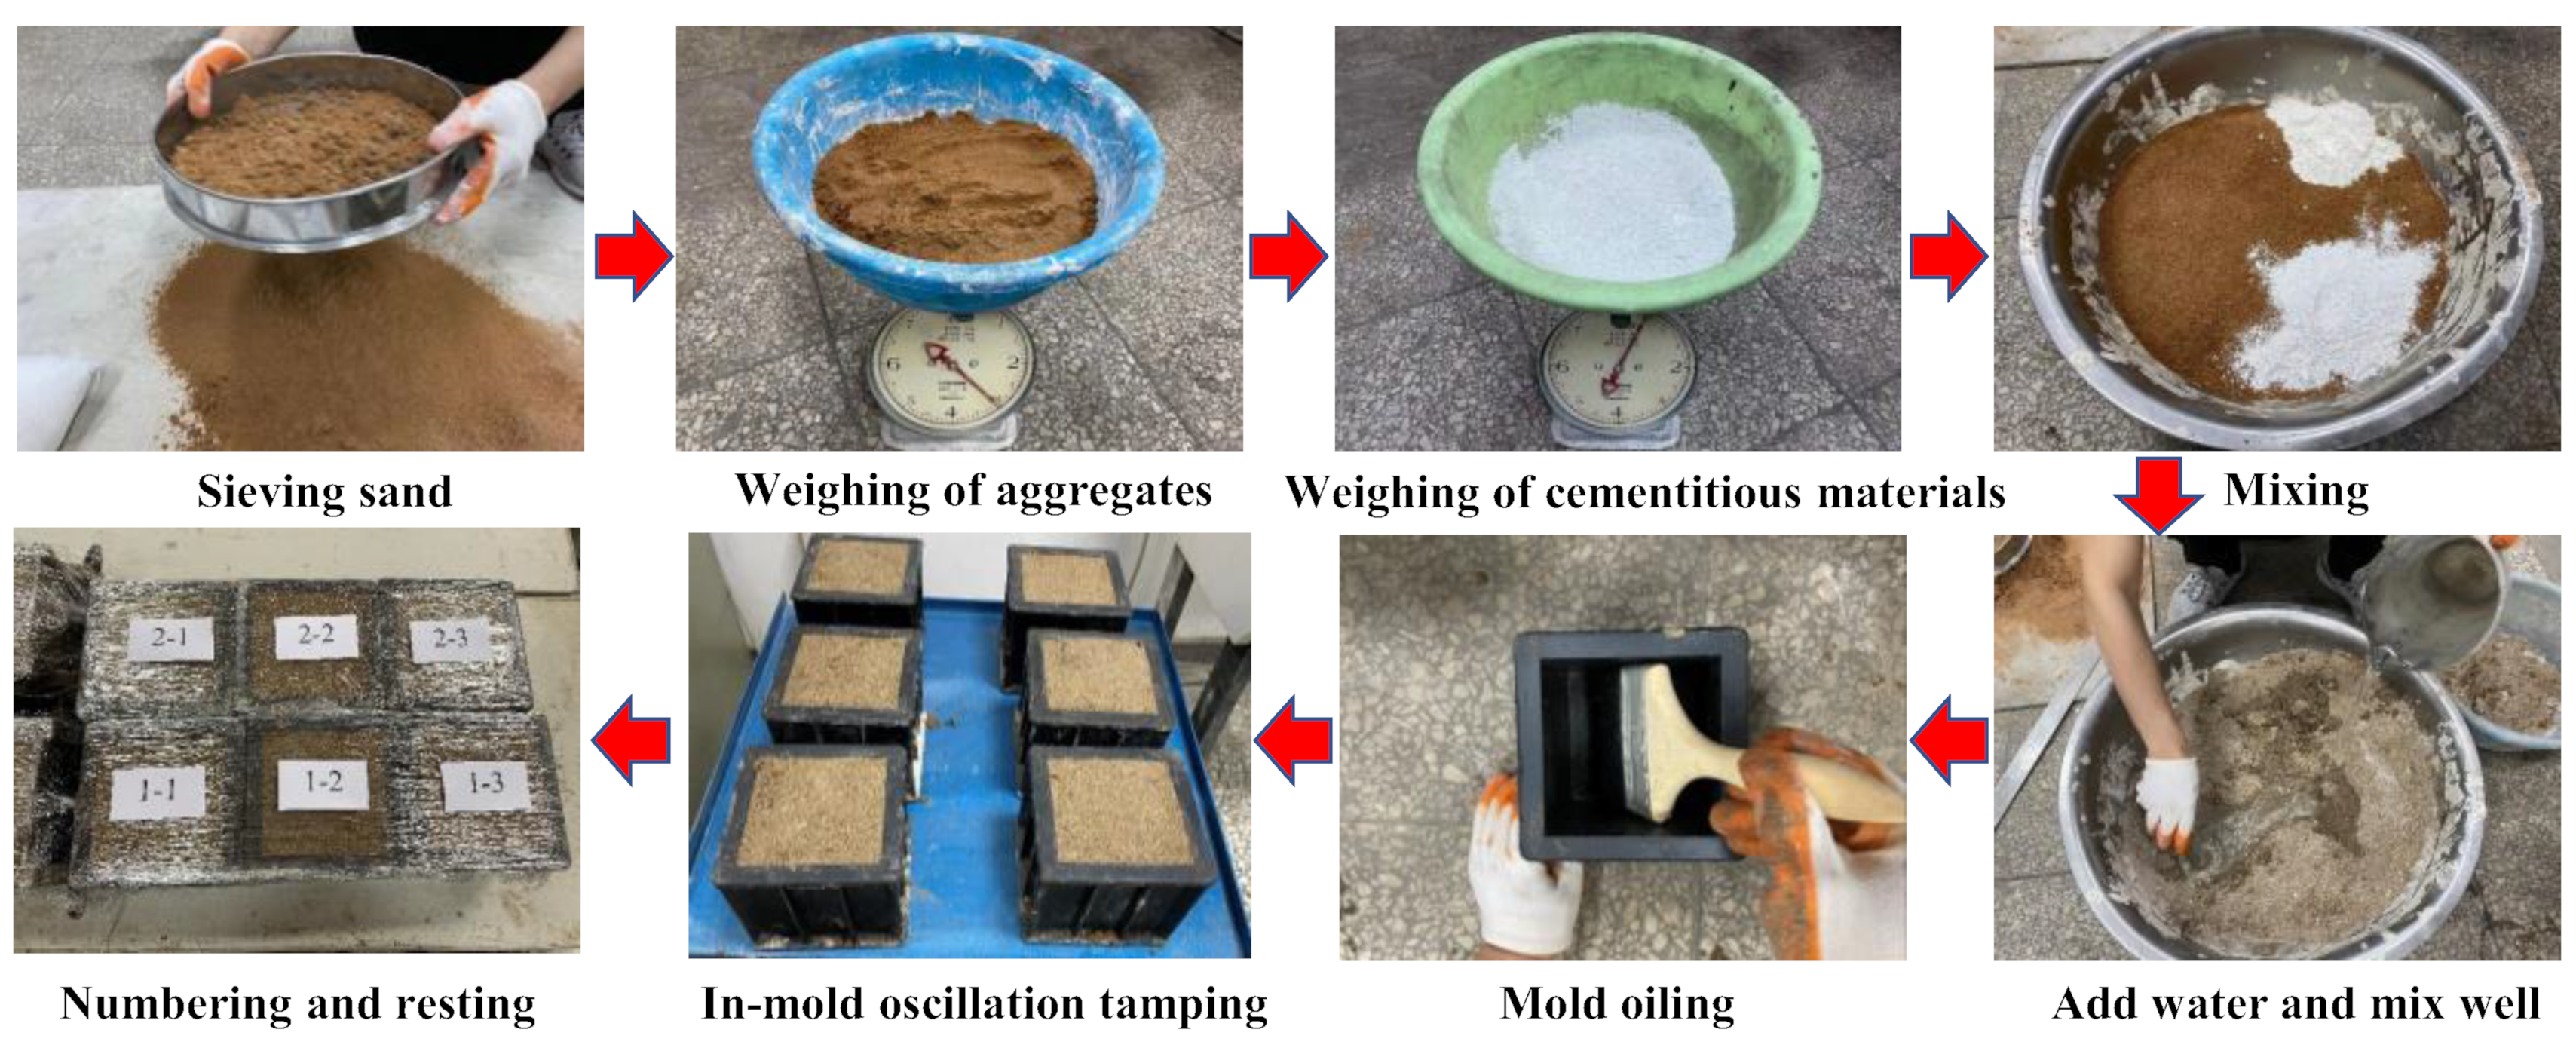
3. Specimen Production

The sample is made by sieving sand to ensure that the sand is uniform and the particle size is within a reasonable range, weighing the mass of the corresponding materials accurately according to the ingredient list, then pouring the aggregates and cementing materials into the mixing container in turn to mix evenly. Add water into the container at a uniform speed to mix—the water mass is 10% of the total mass of the mixture—constantly stirring during the process of adding water to prevent similar materials from clumping and affecting the test results, and continuing to stir until completely mixed after all the water solution is poured in. After pouring the water solution, continue stirring until it is completely mixed. Before pouring the material into the mold, use a brush to apply a layer of lubricant evenly on the inner wall of the mold for easy demolding, then fill the square mold with the mixed material, followed by shaking of the mold to ensure uniformity inside, seal the surface of the specimen with cling film after the shaking is finished, and finally, record the label on top of the cling film for easy identification at a later stage; the specific production process is shown in Figure 2. The samples were carefully prepared to minimize any roughness, and we used sand that was appropriately screened to remove any large particles that could cause surface irregularities. In cases where the sample surface was not smooth enough, we carefully selected another surface for loading or used a tool to smooth the surface. The molds were demolded after standing for 24 h at room temperature, then placed in categories according to the aggregate ratios and maintained for 7 days under dry conditions at room temperature. The volume and mass of the similar simulation model were measured in the laboratory (Figure 3), The weighing scale has a range of 200 g to 8 kg on its dial and a graduation value of 50 g; the density magnitude is the mass divided by the volume to obtain the density distribution of the similar simulation material. Additionally, in order to study the effect of moisture content on the strength of the specimens, one of the ratios, 828 (which indicates sand to cement ratio of 8:1 and paste to ash ratio of 2:8), was selected for example and maintained for 2, 5, 7, 9, and 14 days.

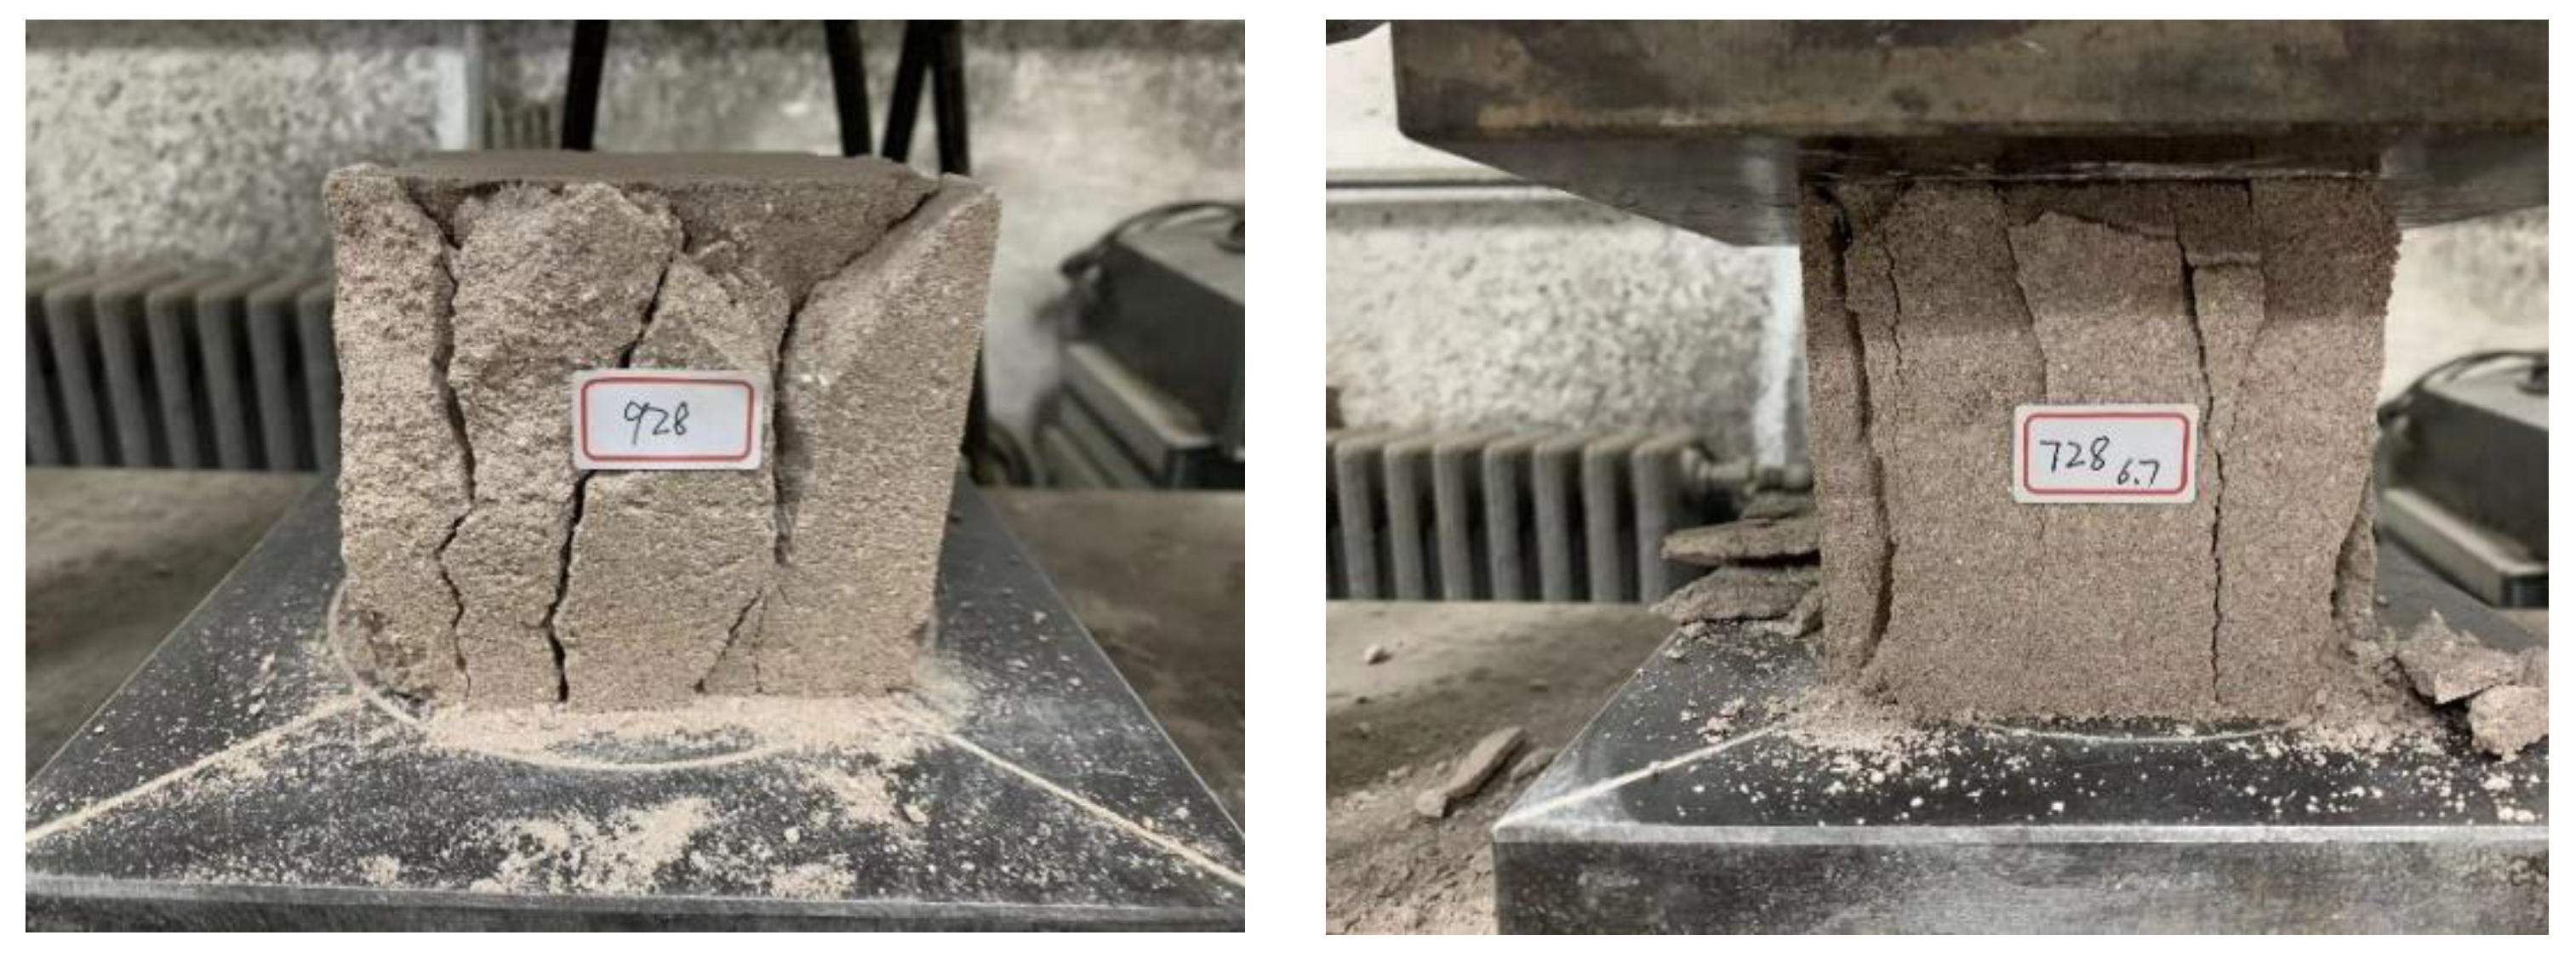
4. Analysis of Experimental Results

The TAW-200 micro-computer-controlled electrohydraulic servo universal testing machine was used in this study, as shown in Figure 4. The device can be regarded as a rigid test machine because the failure strengths of similar material are very small in relation to the measurement range of the test apparatus. The uniaxial compressive tests were performed with strain-control, and the loading rate was 0.5 mm/min. More detailed parameters are shown in Table 2. The selection of capacity loadcell for the experimental equipment is appropriate.
The physical and mechanical properties of the simulated materials with different ratios were obtained by measuring the mass, dimensions, and uniaxial compressive strength of various ratios of similar materials. During the test, the stress and strain were measured, and the elastic modulus was calculated as the slope of the stress-strain curve within the linear elastic region. The compressed specimens were not completely destroyed, but resembled splitting damage and still had residual strength after reaching the strength limit, as shown in Figure 5. The test results show that the density distribution of the simulated materials ranged from 1.64 to 1.75 g/cm3, the compressive strength distribution ranged from 0.203 to 0.917 MPa; the results of similar material ratios are shown in Table 3. The different ratios selected in this test can basically meet the requirements of similar materials needed for most of the simulated experiments in the Shendong coalfield. According to the requirements of physical and mechanical properties of materials for different simulated experiments, by determining reasonable similar ratios, we can find the material ratio scheme that meets or approximately meets the experimental requirements through Table 3.

5. Sensitivity and Multiple Regression Analysis

Statistics on the effect of different factors on density, strength, and elastic modulus at different levels, as shown in Table 4, Table 5 and Table 6, and the degree of sensitivity of each factor on density and strength, were analyzed using the extreme difference analysis [35,36]. At the same time, the sensitivity of density and strength was further analyzed by analysis of variance. Meanwhile, the degree of influence of the sand-cement ratio, paste-cement ratio, and maintenance days on density and strength were plotted as curves, and the equations were fitted by software, as seen in Figure 6, Figure 7 and Figure 8.
From the extreme difference analysis and the variance analysis, it can be seen that the sensitivity of density is from high to low for sand to mortar ratio > mortar to ash ratio > maintenance days, and the sensitivity of strength is from high to low for mortar to ash ratio > maintenance days > mortar to ash ratio. The sensitivity of elastic modulus is from high to low for sand to cement ratio > maintenance days > paste to ash ratio. In the material proportioning selection, the factors with higher sensitivity should be determined first, then the final required results should be adjusted in a small range by the factors with lower sensitivity. In addition, from Figure 6, it can be found that the mortar ratio is negatively correlated with both strength and density, and the mortar ratio has a greater influence on strength than density, and the fitting equations are all third order functions with a fit greater than 0.99. From Figure 7, it can be seen that the paste-cement ratio is positively correlated with both strength and density, and with the increase of paste-cement, the strength of the specimen increases approximately linearly, which indicates that the strength of similar materials is mainly provided by gypsum. Figure 8 shows that the number of maintenance days is positively correlated with strength and negatively correlated with density. The strength and density fluctuate more when the number of maintenance days is small. The density and strength are relatively stable when the number of maintenance days is about 7 days, the time cost increases after the larger maintenance days, and at the same time, the change of strength and density is small, so the selection of maintenance days should be moderate, according to Figure 8, it can be seen that the effect of maintenance time in 5~10 days is more stable for density and strength.
Since more attention is paid to the compressive strength of the model in physical simulation experiment, we only analyze the relationship between the effects of multiple factors on strength here. Additionally, from Figure 8, it is known that the number of maintenance days has a reasonable interval, which is not suitable to be used as the independent variable in the multi-factor, so a benchmark should be selected to analyze the influence of sand to cement ratio and paste to ash ratio on the strength under this benchmark; the maintenance days of 7 days is selected here as the benchmark. The data from Table 3 are plotted into a three-dimensional surface to produce Figure 9. It is obvious that the highest point of strength is at the top left of the curve, the strength is negatively and positively correlated with the sand-cement ratio and the paste-ash ratio, respectively, but the observation of the image shows that it is not linear. In the literature [37], there is a certain error in fitting it as linear, so the non-linear equation is used for higher order fitting, and Equations (1)–(4) are obtained.
y 1 = 0.01 x 1 + 0.12 x 2 + 0.43
y 2 = 0.03 x 1 2 + 0.53 x 1 0.03 x 2 2 + 0.26 x 2 1.64
y 3 = 0.081 x 1 3 0.22 x 1 2 + 1.94 x 1 + 0.01 x 2 3 0.14 x 2 2 + 0.42 x 2 5.15
y 4 = 0.01 x 1 4 0.41 x 1 3 + 4.49 x 1 2 21.23 x 1 1 0.003 x 2 4 + 0.004 x 2 3 0.19 x 2 2 + 0.47 x 2 + 37.42
where ym is the fitted equation, m is the order, m = 1, 2, 3, 4. x1 is the sand to cement ratio, x2 is the paste to ash ratio. Figure 10 shows the influence relationship between sand-cement ratio and paste to ash ratio on strength based on the equation of high-order fitting, and compared with the original data, it can be found that the fitted surfaces of different orders are generally in good agreement with the original data, but the fitted equations of different orders have different correlation coefficients R2. Generally speaking, the higher the fitting order, the higher the correlation coefficient, the correlation coefficient of the first order fitted surface is 0.7671, with the increase of the fitting order, the correlation coefficient also increases. The correlation coefficient of the first-order fitted surface is 0.7671. With the increase of the fitting order, the correlation coefficient also increases. The comparison between the correlation coefficients of the third-order and fourth-order fitting equations reveals that the former is only marginally less numerically than the latter, differing by a mere 0.0001. However, the simplicity of the third-order equation’s expression renders it more convenient for conventional calculations. Given that mining is an engineering problem that does not demand extreme precision and can tolerate a certain degree of error, the third-order fitting equation can provide a more effective reflection of the correlation between the ratios of mineral sand, cement, gypsum, and lime, and their corresponding strengths in the Shendong coalfield.

6. Discussion

We apply the research results of this paper to carry out the 3D physical similarity simulation experiment of 12,401 working face of Shangwan coal mine in Shendong coalfield. The laying process of the model is determined according to the law of similarity and the material ratio (sand to cement ratio, paste to ash ratio, etc.) mentioned above. Among them, the size similarity ratio is 1:150, the density similarity ratio is 1:1.5, the stress similarity ratio is 1:150, and the time similarity ratio is 1:12. According to the above experimental results and the original data of rock strata, we have given the ratio of specific rock strata as shown in Figure 11.
During the laying process of the model, each layer is laid according to the designed sand to cement ratio and paste to ash ratio; the laying process is shown in Figure 12. After the laying of the model, the excavation experiment is carried out. Figure 13 is the stress nephogram of coal seam during excavation. The variable x represents the advancing distance of the working face, while y denotes the length of the working face. Based on the results obtained in Figure 13, it can be concluded that the stress in the roof of the coal seam decreases when the excavation is made at a length of 1.2 m to 1.35 m. This suggests that periodic rupture occurs in the roof during this excavation, and the periodic pressing step is 15 cm. Using the dimensional similarity ratio, it was determined that the in situ pressing step is 22.5 m. The distribution characteristics of abutment pressure on the working face are large in the middle and small on both sides. The graph presented in Figure 14 displays the predicted periodic pressure step distance of 12,401 working face in Shangwan coal mine in comparison to the other literature. It is evident that the data obtained in this study closely align with the results from the previous literature, providing evidence for the accuracy of the similar material ratio utilized in this paper [38,39,40,41].
It is important to note that this study has some limitations. Firstly, the material in this study is from Shendong coalfield, and the physical model is laid according to the 12,401 working face of Shangwan coal mine in Shendong coalfield, so the research results may not be applicable to coal mines outside Shendong coalfield. Therefore, future studies can expand the number of physical models to include other coalfield to verify the findings of this study. Secondly, the sample size of similar materials is relatively small, which may lead to errors in the fitting equation in this paper. While the polynomial equation used in this study provided a satisfactory degree of fitting, it should be acknowledged that there may be other more complex functions that can offer even better fitting results. However, in mining engineering, certain errors are allowed in the physical model test and in situ. Therefore, using the polynomial fitting equation in physical similarity simulation experiments in mining is both convenient and accurate. Further investigations are warranted to explore the potential of alternative fitting equations in the context of the present study. In this paper, the longest drying time is 14 days, which has a certain impact on the strength, density, and elastic modulus of the model. The mechanical properties of the model with a longer duration can be further studied in the subsequent research. Finally, this study does not take into account other factors such as temperature, molding pressure, and environment, which can also affect the physical properties of similar materials.

7. Conclusions

  • Our research has demonstrated the effectiveness of the polynomial model in fitting mining engineering data for material analysis. Through increasing the polynomial degree, we were able to improve the accuracy of the model while maintaining an acceptable error margin. Our findings indicate that the sand to cement ratio, paste to ash ratio, and maintenance days are primary variables influencing material behavior, and that our methodology can guide the creation of physical models of Shendong coalfield. While we acknowledge that other factors may play a role in this process, our study highlights the importance of these variables in material analysis.
  • Sensitivity analyses conducted using the methods of polar difference analysis and variance analysis revealed that the sand to cement ratio, paste to ash ratio, and maintenance days had the greatest influence on density, while the paste to ash ratio, maintenance days, and sand to cement ratio had the greatest influence on strength. Single-factor analysis indicated that sand to cement ratio was negatively correlated with both strength and density, while paste to ash ratio was positively correlated with both. Maintenance days were found to be positively correlated with strength and negatively correlated with density. Based on our findings, we suggest that the reasonable range of maintenance days is between 5–10 days. Furthermore, we derived a higher order fitting equation for the effect of sand to cement ratio and paste to ash ratio on strength, determining that the third-order fitting equation could be used to guide the proportion selection of physical simulation experiments in the Shendong coalfield.
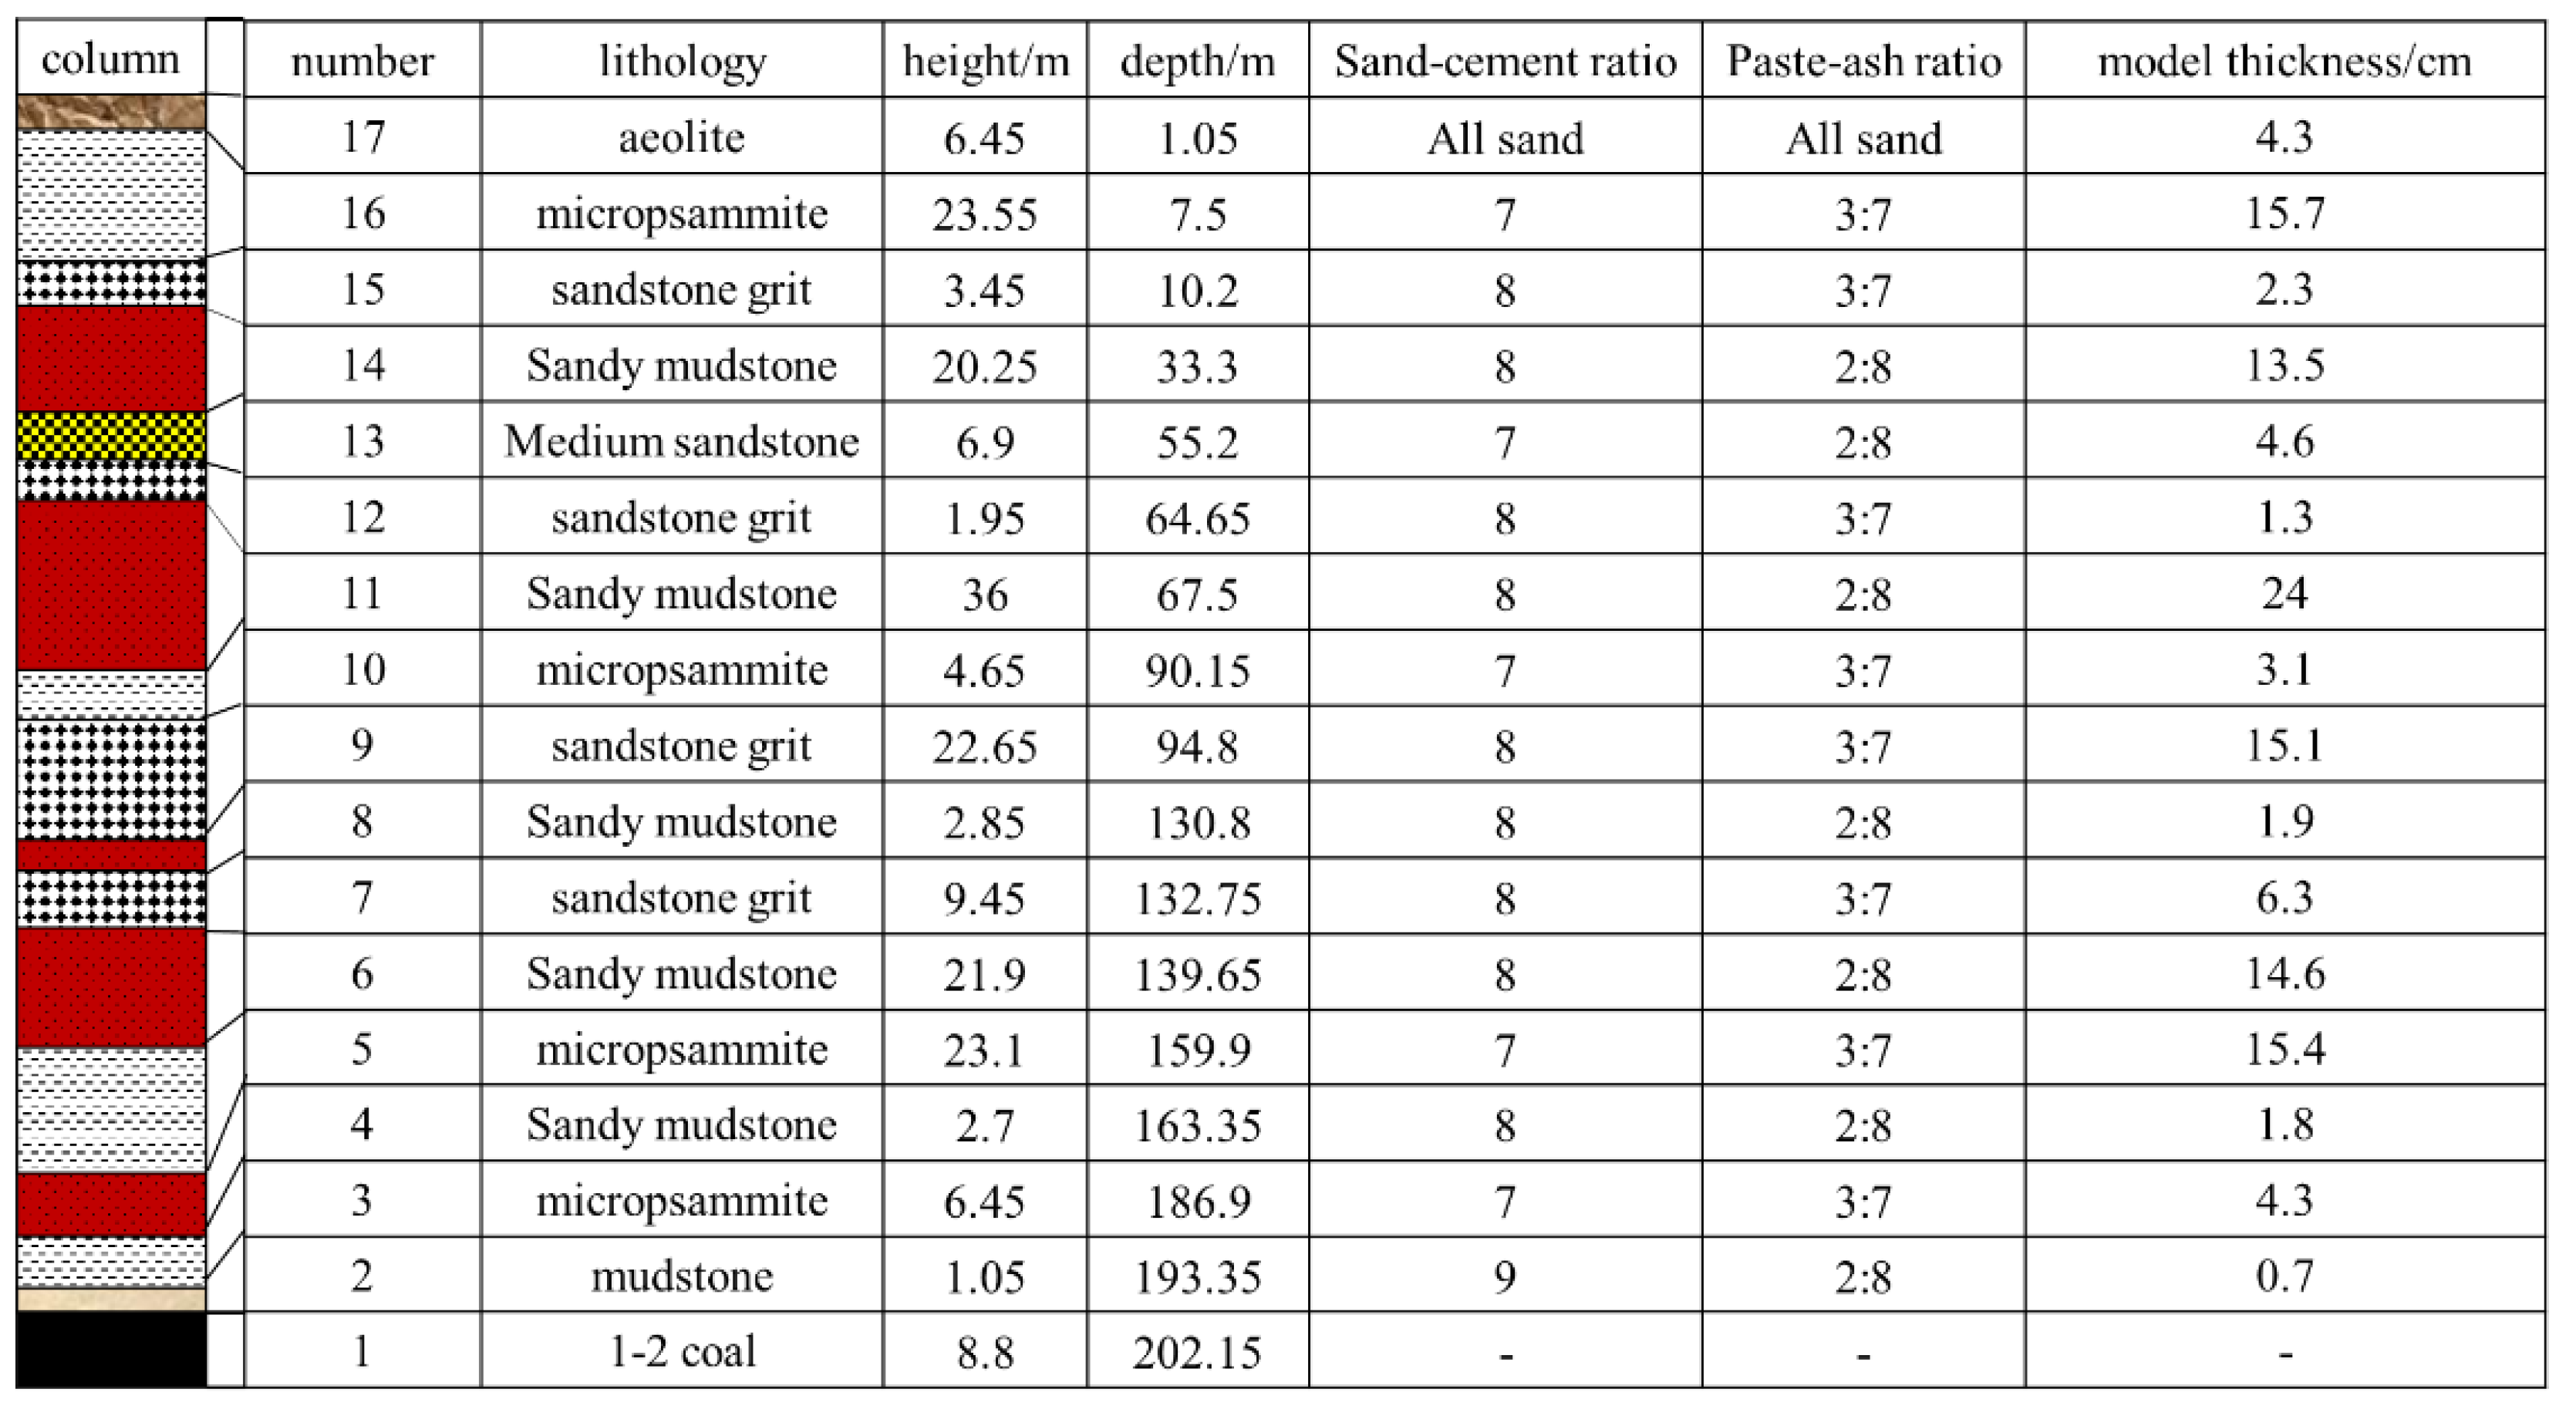
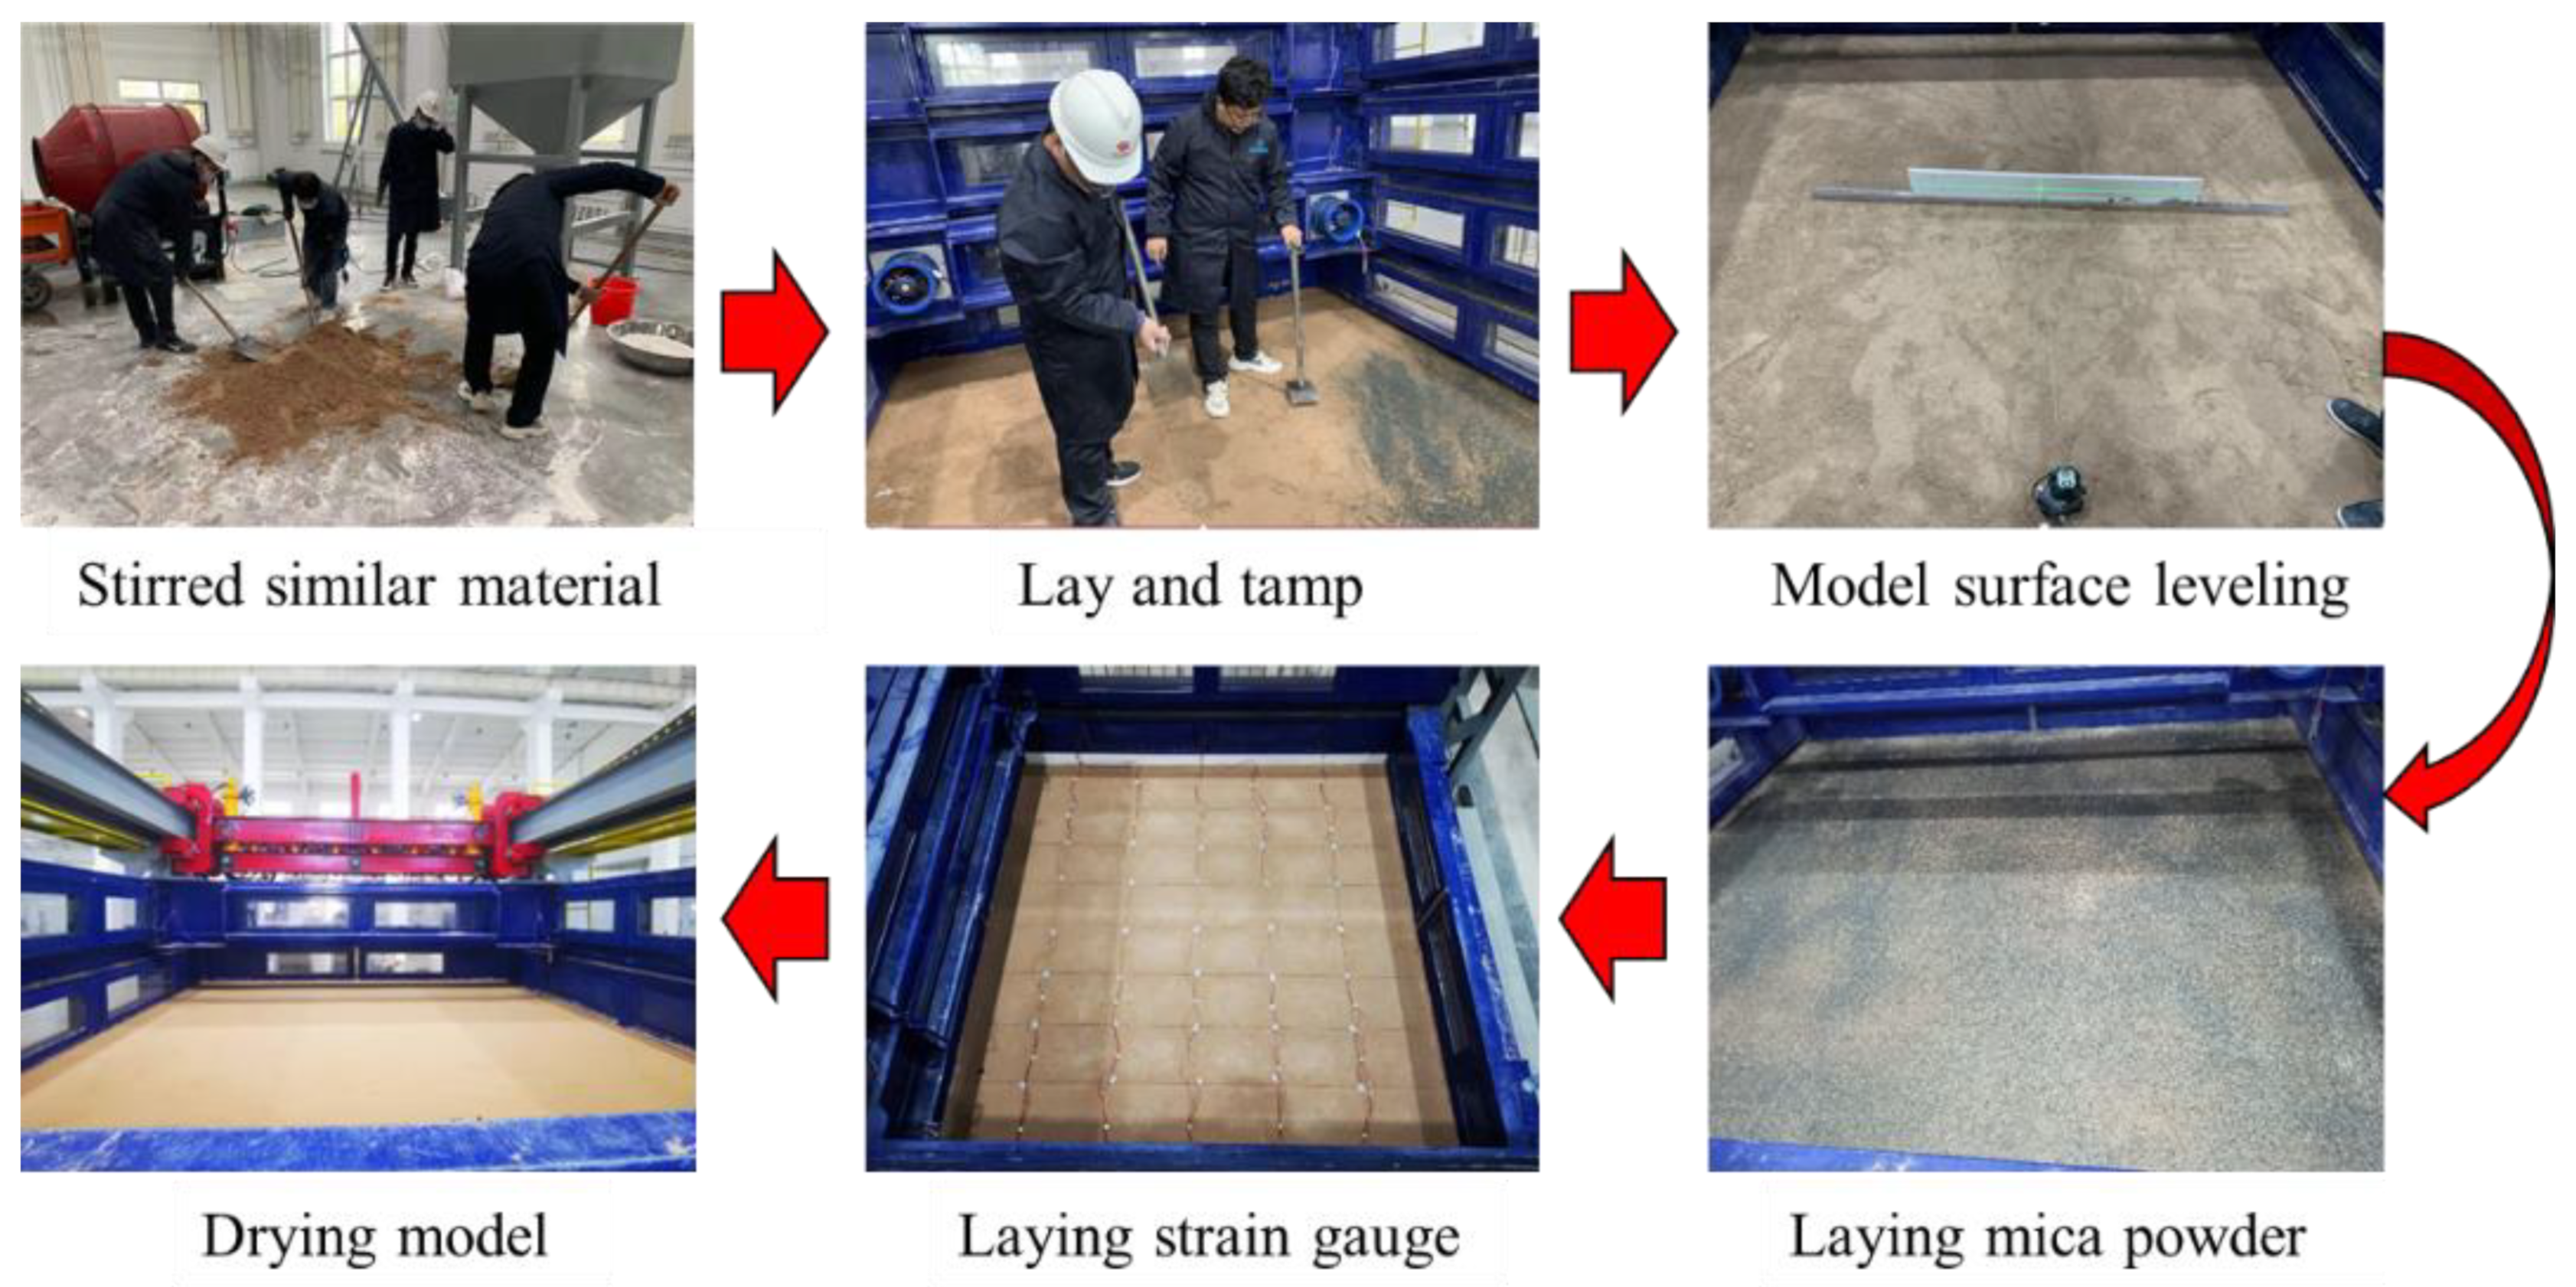
  • Using the similar material ratio presented in our study, we constructed a physical model of Shangwan coal mine. From this model, we obtained valuable insights into the periodic weighting distance and stress nephogram of the coal seam. Our research contributes to the advancement of mining engineering by providing insights into material analysis and physical modeling techniques and offers guidance for future research and development in this field.

Author Contributions

Conceptualization, Y.Y.; Methodology, H.Y.; Software, Y.Z.; Validation, Z.W.; Investigation, W.Y.; Writing—original draft preparation, S.Z. and J.Z. All authors have read and agreed to the published version of the manuscript.

Funding

This paper was supported by the National Natural Science Foundation of China (51974320, 52121003, and 52004012), the Natural Science Foundation of Hebei (E2020402041), the “State Key Laboratory of Coal Mining Water Conservation and Utilization” 2017 Open Fund Project Grant (SHJT-17-42.4), the National Natural Science Foundation of China (No. 52004012), and the Science and Technology Innovation Project of China Energy Investment Corporation (SHJT-17-38).

Data Availability Statement

The data used to support the findings of this study are included within the article.

Conflicts of Interest

The authors declare that this research was conducted in the absence of any commercial or financial relationships that could be construed as a potential conflict of interest.

References

  1. Das, D.; Das, S.K.; Parhi, P.K.; Dan, A.K.; Mishra, S.; Misra, P.K. Green strategies in formulating, stabilizing and pipeline transportation of coal water slurry in the framework of water-energy nexus: A state of the art review. Energy Nexus 2021, 4, 100025. [Google Scholar] [CrossRef]
  2. Kidd, S. Coal—Is it a competitor to new nuclear? Nucl. Eng. Int. 2009, 665, 12–13. [Google Scholar]
  3. Ray, S.K.; Khan, A.M.; Mohalik, N.K.; Mishra, D.; Mandal, S.; Pandey, J.K. Review of preventive and constructive measures for coal mine explosions: An Indian perspective. Int. J. Min. Sci. Technol. 2022, 32, 471–485. [Google Scholar] [CrossRef]
  4. Hosseini, N. Evaluation of the rockburst potential in longwall coal mining using passive seismic velocity tomography and image subtraction technique. J. Seismol. 2017, 21, 1101–1110. [Google Scholar] [CrossRef]
  5. Martirosyan, A.V.; Ilyushin, Y.V. The Development of the Toxic and Flammable Gases Concentration Monitoring System for Coalmines. Energies 2022, 15, 8917. [Google Scholar] [CrossRef]
  6. Fuławka, K.; Pytel, W.; Mertuszka, P. The effect of selected rockburst prevention measures on seismic activity—Case study from the Rudna copper mine. J. Sustain. Min. 2018, 17, 1–10. [Google Scholar] [CrossRef]
  7. Khademian, Z.; Ugur, O. Computational framework for simulating rock burst in shear and compression. Int. J. Rock Mech. Min. Sci. 2018, 110, 279–290. [Google Scholar] [CrossRef]
  8. He, C.; Lu, W.; Zha, W.; Wang, F. A geomechanical method for predicting the height of a water-flowing fractured zone in a layered overburden of longwall coal mining. Int. J. Rock Mech. Min. Sci. 2021, 143, 104798. [Google Scholar] [CrossRef]
  9. Wang, J.C. Theory and Technology of Thick Seam Mining; Metallurgy Industry Press: Beijing, China, 2019; pp. 1–10. [Google Scholar]
  10. Wang, J.C.; Wang, Z.H.; Tang, Y.S.; Li, M.; Chang, K.L.; Gong, H.; Xu, G.L. Experimental study on mining-induced dynamic impact effect of main roofs in deeply buried thick coal seams with weakly consolidated thin bed rock. Chin. J. Rock Mech. Eng. 2021, 40, 2377–2391. [Google Scholar]
  11. Yang, S.L.; Wang, J.C.; Yang, J.H. Physical analog simulation analysis and its mechanical explanation on dynamic load impact. J. China Coal Soc. 2017, 42, 335–343. [Google Scholar]
  12. Feng, X.W.; Wang, M.K.; Xue, F.; Zhao, T.Y.; Song, W.X.; Wei, Q.; Zhu, Y.C. Investigation on mine physical simulation model embedded with iso-strength scaled 3D printed support system. J. China Univ. Min. Technol. 2022, 51, 232–243 + 256. [Google Scholar]
  13. Zhao, X.Y.; Zhang, X.Y.; Han, Z.H.; Han, G. Simulation study on spatial structure evolution characteristics of coal seam mining with hard overbburden rock. Min. Res. Dev. 2022, 42, 6–10. [Google Scholar]
  14. Zhang, X.Y.; Xie, G.X. 3D analog simulation of pillar width effect of stress and caving height of overlying strata. Coal Min. Technol. 2010, 15, 14–17 + 114. [Google Scholar]
  15. Wen, Z.J.; Jiang, P.F.; Jing, S.L.; Cao, Z.G.; Guang, Y.T. Development and verification of simulation testing system for floor seepage in coal mine underground reservoir. J. China Coal Soc. 2021, 46, 1487–1497. [Google Scholar]
  16. Chai, J.; Liu, Y.L.; Yuan, Q.; Zhang, D.D.; Do, W.G.; Han, Z.C.; Ma, Z.; Lei, W.L. Theory−technology and application of optical fiber sensing on deformation and failure of mine surrounding rock. Coal Sci. Technol. 2021, 49, 208–217. [Google Scholar]
  17. Chai, J.; Do, W.G.; Lei, W.L.; Peng, Y.B. Water-resisting key strata stability detected by optic fiber sensing in shallow-buried coal seam. J. Min. Saf. Eng. 2020, 37, 731–740. [Google Scholar]
  18. Qin, G.P.; Cao, J.; Wang, C.; Wu, S.; Zhai, M.H. Characteristics of Stratum Structure and Fracture Evolution in Stratified Mining of Shallow Buried High-Gas-Thick Coal Seam by Similarity Simulation. Geofluids 2021, 2021, 5555451. [Google Scholar]
  19. Ye, Q.; Wang, G.; Jia, Z.Z.; Zheng, C.S.; Wang, W.J. Similarity simulation of mining-crack-evolution characteristics of overburden strata in deep coal mining with large dip. J. Pet. Sci. Eng. 2018, 165, 477–487. [Google Scholar] [CrossRef]
  20. Liu, Y.L.; Zhou, W.Z.; Guo, B.; Ma, Q.; Xiao, H.L. Study on marl similar materials in similar simulation test. Chin. J. Rock Mech. Eng. 2020, 39, 2795–2803. [Google Scholar]
  21. Xiao, J.; Wu, J.J.; Shao, Y.W.; Yang, H. Similar simulation study on mine pressure behavior law of 8.5 m high mining face. Coal Sci. Technol. 2019, 47, 106–111. [Google Scholar]
  22. Ma, J.H.; Hou, C.; Hou, J.T. Numerical and Similarity Simulation Study on the Protection Effect of Composite Protective Layer Mining with Gently Inclined Thick Coal Seam. Shock Vib. 2021, 2021, 6679199. [Google Scholar] [CrossRef]
  23. Gao, X.C.; Wu, Y.P.; Cao, P.P.; Wang, H.W.; Yin, J.H. Overlying strata movement property of fully mechanized caving angle-varied workface in steep dipping seam. J. Min. Saf. Eng. 2016, 33, 381–386. [Google Scholar]
  24. Shi, J.J.; Feng, J.C. Research on the Regular of Underground Pressure by Similarity Simulation. Geotech. Geol. Eng. 2021, 39, 5359–5364. [Google Scholar]
  25. Fu, J.H.; Sun, H.T.; Wen, G.C.; Li, R.F. Three-Dimensional Physical Similarity Simulation of the Deformation and Failure of a Gas Extraction Surface Well in a Mining Area. Adv. Civ. Eng. 2020, 2020, 8834199. [Google Scholar] [CrossRef]
  26. Li, S.C.; Zhou, Y.L.; Li, P. Development and application of a new similar material for underground engineering fluid-solid coupling model test. Chin. J. Rock Mech. Eng. 2012, 31, 1128–1137. [Google Scholar]
  27. Li, S.C.; Feng, X.D.; Li, S.C.; Li, L.P.; Li, G.Y. Research and development of a new similar material for solid-fluid coupling and its application. Chin. J. Rock Mech. Eng. 2010, 29, 281–288. [Google Scholar]
  28. Zhang, Q.Y.; Xiang, W.; Zhang, Y.; Wang, C.; Liu, C.C. Development and application of ultra high pressure 3D loading model test system with intelligent numerical control function. Chin. J. Rock Mech. Eng. 2016, 35, 1628–1637. [Google Scholar]
  29. Sidorenko, A.A.; Ivanov, V.V.; Sidorenko, S.A. Numerical simulation of rock massif stress state at normal fault at underground longwall coal mining. Int. J. Civ. Eng. Technol. 2018, 10, 844–851. [Google Scholar]
  30. Bagarello, V.; Ferro, V.; Keesstra, S.; Comino, J.R.; Pulido, M.; Cerdà, A. Testing simple scaling in soil erosion processes at plot scale. Catena 2018, 167, 171–180. [Google Scholar] [CrossRef]
  31. Gomathi, K.A.; Rajagopal, A.; Reddy, K.S.S.; Ramakrishna, B. Plasticity based material model for concrete subjected to dynamic loadings. Int. J. Impact Eng. 2020, 142, 103581. [Google Scholar] [CrossRef]
  32. Moussaei, N.; Sharifzadeh, M.; Sahriar, K.; Sahriar, K.; Khosravi, M.H. A new classification of failure mechanisms at tunnels in stratified rock masses through physical and numerical modeling. Tunn. Undergr. Space Technol. 2019, 91, 103017. [Google Scholar] [CrossRef]
  33. Shen, Z.; Huang, X.M. Test study on the Solidified Fly Ash. J. Highw. Transp. Res. Dev. 2007, 1, 26–29. [Google Scholar]
  34. Liang, X.Z.; Wang, H. Experimental Research on Roadway Filling with Skeleton Type Based on Construction Waste. Met. Mine 2011, 40, 62–64. [Google Scholar]
  35. Berredjem, T.; Benidir, M. Bearing faults diagnosis using fuzzy expert system relying on an Improved Range Overlaps and Similarity method. Expert Syst. Appl. 2018, 108, 134–142. [Google Scholar] [CrossRef]
  36. Galdames, F.J.; Perez, C.A.; Estévez, P.A.; Adams, M. Rock lithological classification by hyperspectral, range 3D and color images. Chemom. Intell. Lab. Syst. 2019, 189, 138–148. [Google Scholar] [CrossRef]
  37. Zhang, X.Y.; Luo, L.; Xu, L.F.; Zhao, M. Research on quantitative determination method of similar materials ratio. Saf. Coal Mines 2019, 50, 45–48 + 53. [Google Scholar]
  38. Liu, Y.; Wang, H.; Qi, Q.; Wang, A.H.; Zhao, Y.X. Dynamic evolution law of overburden rock in shallow-buried super-high fully mechanized working face and determination of support strength. Shock Vib. 2021, 2021, 7649459. [Google Scholar] [CrossRef]
  39. Zeng, X.T.; Wang, N.; Jiang, C.; Zhang, Y.Y.; Cheng, G. The three-dimensional similar simulation of stress regular pattern of roof of large mining height. In Advanced Materials Research; Trans Tech Publications Ltd.: Baech, Switzerland, 2014; Volume 945, pp. 1190–1195. [Google Scholar]
  40. Bai, E.H.; Guo, W.B.; Zhang, D.; Yi, T.; Guo, M.J.; Zhao, G.B. Using the magnetotelluric method for detecting aquifer failure characteristics under high-intensity mining of thick coal seams. Energies 2019, 12, 4397. [Google Scholar] [CrossRef]
  41. Jia, S.Y.; Hu, T.F.; Lu, G.Z. Application of algorithm for simulation of overburden movement and analysis of ground pressure law in 8.8 m high mining face in Shangwan Coal Mine. Coal Sci. Technol. 2021, 49 (Suppl. S1), 1–6. [Google Scholar]
Figure 1. Coal production and consumption in major countries around the world.
Processes 11 01352 g001
Figure 2. Proportioning process of similar material specimens.
Processes 11 01352 g002
Figure 3. Density measuring.
Processes 11 01352 g003
Figure 4. Experimental equipment.
Processes 11 01352 g004
Figure 5. Specimen damage pattern.
Processes 11 01352 g005
Figure 6. Effect of sand to cement ratio on strength and density.
Processes 11 01352 g006
Figure 7. Effect of paste to ash ratio on strength and density.
Processes 11 01352 g007
Figure 8. Effect of maintenance days on strength and density.
Processes 11 01352 g008
Figure 9. Relationship between sand to cement ratio and paste to ash ratio and strength.
Processes 11 01352 g009
Figure 10. Effect of sand-to-cement ratio and paste-to-ash ratio on strength under different orders of fitting.
Processes 11 01352 g010aProcesses 11 01352 g010b
Figure 11. The ratio of specific rock strata.
Processes 11 01352 g011
Figure 12. Physical model laying process.
Processes 11 01352 g012
Figure 13. Stress nephogram of coal seam after excavation of physical model.
Processes 11 01352 g013
Figure 14. The periodic weighting distance of this paper and the other literature.
Processes 11 01352 g014
Table 1. Similar material design levels.
Number of Horizontal GroupsSand to Cement RatioPaste to Ash RatioMaintenance Days
I6:12:82
II7:13:75
III8:14:67
IV9:15:59
V-6:414
VI-7:3-
VII-8:2-
Table 2. Key parameters of WAM-600B.
ParameterValue
Displacement range150 mm
Displacement accuracy±1%
Displacement resolution0.001 mm
Axial force range600 kN
Axial force accuracy±1%
Axial force resolution0.01 kN
Table 3. Similar material proportioning results.
TestSand to Cement RatioPaste to Ash
Ratio
Maintenance TimeDensity/
g·cm−3
Compressive Strength/MPaElastic Modulus/
MPa
Number of Horizontal Groups
1IVVIIIII1.670.644358.53
2IVVIIII1.690.602329.29
3IVVIII1.690.567305.75
4IVIVIII1.730.497273.98
5IVIIIIII1.750.455256.73
6IVIIIII1.740.336237.18
7IVIIII1.780.203208.07
8IIIVIIIII1.650.693384.93
9IIIVIIII1.670.665365.03
10IIIVIII1.690.571341.15
11IIIIVIII1.710.509319.32
12IIIIIIIII1.710.483289.58
13IIIIIIII1.720.399258.77
14IIIIIII1.740.327235.14
15IIVIIII1.650.882412.73
16IIVIII1.640.721389.06
17IIIVIII1.650.581357.74
18IIIIIIII1.680.528318.96
19IIIIIII1.720.491284.86
20IIIIII1.710.423255.69
21IIVIIIII1.720.392241.46
22IVIIII1.640.917583.74
23IVIII1.640.772548.36
24IIVIII1.650.688501.83
25IIIIIII1.650.578472.07
26IIIIII1.660.457452.49
27IIIII1.680.422438.39
28IVIIII1.680.387395.81
29IVVIII1.710.375285.03
30IVVIIII1.680.621321.83
31IVVIIIII1.670.644358.53
32IVVIIIV1.670.653392.57
33IVVIIV1.650.712463.02
Note: The data in the table for sand to cement ratio, paste to ash ratio, and maintenance days, all indicate different levels and are reflected in Table 1.
Table 4. Effect of different factors on density.
Horizontal
Groups
Density Mean Value/g·cm−3Polar DifferenceVariance
Influencing
Factors
IIIIIIIVVVIVII
Sand to cement ratio1.6171.6811.6981.721---0.1040.00149
Paste to ash ratio1.7301.7131.7101.6931.6701.6601.6530.0770.00074
Maintenance days1.7101.6801.6701.6701.650--0.0600.00038
Table 5. Effect of different factors on strength.
Horizontal
Groups
Uniaxial Compressive Strength/MPaPolar DifferenceVariance
Influencing
Factors
IIIIIIIVVVIVII
Sand to cement ratio0.6030.5740.54670.472---0.1310.00237
Paste to ash ratio0.3270.3950.4720.5530.6220.6900.7840.4570.02277
Maintenance days0.3750.6210.6440.6530.712--0.3370.01342
Table 6. Effect of different factors on elastic modulus.
Horizontal
Groups
Elastic Modulus Mean Value/MPaPolar DifferenceVariance
Influencing
Factors
IIIIIIIVVVIVII
Sand to cement ratio484.67322.93313.42281.36---203.31203.31
Paste to ash ratio270.12297.51320.92346.08376.62407.94434.98164.86164.86
Maintenance days285.03321.83358.53392.57463.02--177.99177.99
Disclaimer/Publisher’s Note: The statements, opinions and data contained in all publications are solely those of the individual author(s) and contributor(s) and not of MDPI and/or the editor(s). MDPI and/or the editor(s) disclaim responsibility for any injury to people or property resulting from any ideas, methods, instructions or products referred to in the content.

