Article

A Facile Hydrothermal Synthesis of S-VO2-Cellulose Nanocomposite for Photocatalytic Degradation of Methylene Blue Dye

Chemistry Department, Faculty of Science, Benha University, Benha 13518, Egypt
*
Authors to whom correspondence should be addressed.
Processes 2023, 11(5), 1322; https://doi.org/10.3390/pr11051322
Submission received: 21 March 2023 / Revised: 4 April 2023 / Accepted: 11 April 2023 / Published: 24 April 2023
(This article belongs to the Section Materials Processes)

Abstract

:
A novel UV-light-active MCC/S-VO2 photocatalyst was successfully synthesized by a simple and reliable hydrothermal route. XRD, FT-IR, Raman analysis, XPS, FE-SEM, EDX, TEM, DRS, and thermal analysis techniques were utilized for the characterization of the as-prepared photocatalysts. The photocatalytic activities of the V2O5, doped S-VO2, and MCC/S-VO2 nanostructures were investigated by monitoring the fading out of the methylene blue (MB) concentration under UV-light irradiation. The results revealed that the photocatalytic degradation of MB via MCC/S-VO2 was superior compared with that exhibited by pure V2O5 and doped S-VO2. It was found that 72.3% of MB (100 mL; 20 mg·L−1) was degraded after 6 h in contact with MCC/S-VO2. Interestingly, the photodegradation of MB dye was enhanced dramatically by adding H2O2, while 92.5% of MB was degraded within 55 min. The kinetic studies revealed that the MB degradation followed the pseudo-first-order model with a rate constant (kobs) of 3.9 × 10⁻² min−1. The effect of several active species scavengers on the photocatalytic degradation process was investigated. The data exhibited that hydroxyl radicals and positive holes were the key active species during the degradation process. The stability and reusability of the as-prepared nanostructures were examined, and the results displayed its applicability for the removal of MB dye from aqueous media.

1. Introduction

Since the emergence of the nanotechnology era, scientists have raced to sculpt the ultimate nanocomposite materials to serve industrial needs. Nanocomposite material revealed the magnificence behind the hidden power of the bulk structure. Nowadays, water pollution is considered to be one of the most crucial issues all over the world [1,2]. Synthetic dyes have a complex aromatic molecular structure, are more stable and hard to degrade, and show potential toxicity, mutagenicity, and carcinogenicity [3]. Therefore, these dyes are potentially harmful and cause serious health hazards [4]. Methylene blue dye (MB) (λmax = 664 nm) has been widely used in the dying process of cotton fabrics, wood, and silk. The effluent disposal of the textile, tanning industries, and others, containing organic synthetic dyes, such as MB dye, without appropriate treatment are regarded as a severe source of environmental problems because of their high stability and long permanence in the environment [5]. Hence, the development of environmental and effective technologies for the destruction of these types of organic pollutants in wastewater is imperative [6]. Traditional treatment methods such as ion exchange, precipitation, coagulation, flocculation, membrane filtration, electrochemical, and biological techniques have been investigated and applied as potential solutions [7,8,9,10,11]. Possible treatment methods of textile organic wastes with advantages and disadvantages are listed in Table 1. However, owing to their limited success and disadvantages such as incomplete degradation of the organic pollutants and production of secondary hazardous waste [12], scientific society is seeking safer and more efficient methods. It is well-known that electrons are promoted from the valence band (VB) to the conduction band (CB) by the absorption of photons with an energy equal to or higher than the band gap, producing a large number of holes in the VB. If this active charge (holes and electrons) separation is achieved, the generated holes and electrons can be employed for the photocatalytic degradation of several organic pollutants [13].
As a green functional technique for water purification, water disinfection, hazardous waste remediation, and self-cleaning, semiconductor photocatalysis has attracted much attention, and more investigations have been paid to fit industrial uses [14]. Advanced oxidation processes have superiority over traditional techniques due to their effectiveness under mild experimental conditions in the plenary destruction of organic pollutants into CO2 and H2O [15,16,17]. Hydroxyl radical (OH) based advanced oxidation technologies (e.g., H2O2/UV, photo-Fenton [18,19]) have proven to have perfect efficiency in the field of wastewater treatment. Such treatment involves the production of highly reactive, powerful oxidants and non-selective reagent hydroxyl radicals (OH) [20], which work on the degradation of the organics by several mechanisms [18]. A novel generation of hybrid nanostructured materials called bio-nanocomposites (BNCs) refers to those naturally occurring polymers (e.g., cellulose, etc.) that are combined with inorganic materials and exhibit the nanometer scale at least for one dimension [21]. Cellulose material has been used as an efficient pattern or support for mineral synthesis due to its unique properties among natural polymers including biodegradability, eco-friendliness, and being a plentiful natural resource [22,23]. Cellulose nanocomposites and their derivatives have been used in various fields of science, as they are characterized by low cost, high chemical and thermal stability, good mechanical properties, availability, and low toxicity. These kinds of materials are used as appropriate alternate adsorbents in analytical methods [22,24]. When crystalline cellulose undergoes acid hydrolysis to dissolve the amorphous parts of native cellulose, microcrystalline cellulose (MCC) is formed [25]. Due to the low degree of polymerization and relatively large specific surface area of MCC, it provides a polymeric matrix to produce cellulosic-based nanocomposite materials by accommodating inorganic fillers [17]. These composites exhibit promising features by introducing the bio-interfaces offered by cellulose fibers along with the inherent functionalities of the fillers [26,27]. Many efforts have been exerted to modify semiconductor photocatalysts for enhanced water purification performance. Yan et al. reported the synthesis of Ag@AgCl-reinforced cellulose composites, which exhibited excellent photocatalytic degradation performance for methylene blue dye [28]. Wang et al. reported the synthesis of CuS-functionalized cellulose biocatalysts for the removal of organic dye [29]. There is another work on TiO2 photocatalyst immobilization in the cellulose matrix to decompose phenol under UV light irradiation [30]. Photocatalytic decomposition of organic dyes with semiconductor-based nanomaterials has enticed fundamental attention because it suggests a feasible solution to environmental pollution problems [13].
Amongst the vanadium oxides family, vanadium dioxide (VO2), which is a characteristic semiconductor with narrow band gap energy and is well-known for its phase transition from semiconductor (monoclinic structure) to metal (tetragonal structure) at ~68 °C, leading to evident changes in the properties of the semiconductor [31,32]. For that, VO2 is considered a promising material for a wide range of technological applications in thermochromic smart windows [33], electrochromic [34], Li-ion batteries [35,36], data storage media [37], etc. There are many polymorph phases of V-O systems; the most interesting one is VO2 (B), owing to its layered structure and promising applications in the energy conversation field [38]. However, VO2 is still rarely studied for its photocatalytic activity toward organic dye degradation. Despite the low band gap energy for some semiconductors, they show poor photocatalytic performance due to the high rate of electron/hole pair recombination [39]. Therefore, several methodologies have been utilized to slow the recombination of the electron–hole pair and improve catalytic activity. One of these methodologies is doping with nonmetals [40]. Doping of the semiconductor with non-metal atoms with high ionization energies and high electronegativity, such as nitrogen (N) [41,42], carbon (C) [43], boron (B) [44], and sulfur (S) [45], modifies the electronic structure, and the photocatalytic performance deteriorates as the doped ions introduce additional energy levels into the band structure, which can be used to trap electrons or holes to separate carriers from the bands, thus allowing more carriers to successfully diffuse to the surface [46]. These dopants act as a separator for the charge carriers to stimulate absorption in the visible region [47].
Our work sheds light on the preparation conditions for the optimization of photocatalysts, as well their photocatalytic experimental conditions. To the best of our knowledge, doped S-VO2 was prepared, for the first time, from V2O5 and sulfur, employing a facile hydrothermal route where the MCC was utilized to well-disperse the as-prepared S-VO2 nanoparticles, producing a hybrid nanostructured composite MCC/S-VO2, which shows promising chemical, physical, and optical properties. MCC/S-VO2 was applied as a photocatalyst for the photocatalytic degradation of MB dye under UV irradiation. The effect of different scavengers on the photocatalytic degradation process was studied in the presence of H2O2. Changing the band gaps of photocatalysts upon doping was estimated by theoretical calculations, and the prospective mechanism for the photocatalysis process was proposed and discussed.
Table 1. Methods of textile pollutant treatment, their advantages, and disadvantages [48,49].
Methods of Textile Pollutant TreatmentAdvantages Disadvantages
Coagulation or flocculationEconomically convenientExcess sludge production
Biological treatmentLow costsLow bio decomposition of dyes
Adsorption Low cost of preparation methods and uses Poor capacity for organic pollutants, and adsorbents demand disposal
Ion exchangeHigh capacity for dyesHigh costs
Oxidation Effective decolonizationGeneration of sludge
Membrane processLow pressureInsufficient quality of the treated pollutants

2. Experimental Methods

2.1. Materials

All the chemicals were of analytical grade and used without further purification. Vanadium pentoxide 99.6% (V2O5), methylene blue (MB), elemental sulfur 99.9% (S), Diethanolamide (DEA) nonionic surfactant 99%, and isopropyl alcohol 99% (IPA; C3H8O) were purchased from Sigma-Aldrich Chemical Co. Hydrochloric acid 32% (HCl), hydrogen peroxide 50 wt.% (H2O2), Ascorbic acid (AA; C6H8O6), and ethylenediaminetetraacetic acid disodium salt 99% (EDTA.2Na; C10H16N2Na2O82+) were supplied by El Nasr Pharmaceutical Chemicals (Adwic) Co, Cairo, Egypt. All reagent solutions were prepared using deoxygenated deionized (DDI) water, which was prepared by passing pure nitrogen gas through DI water at a flow rate 100 mL per minute for 2 h.

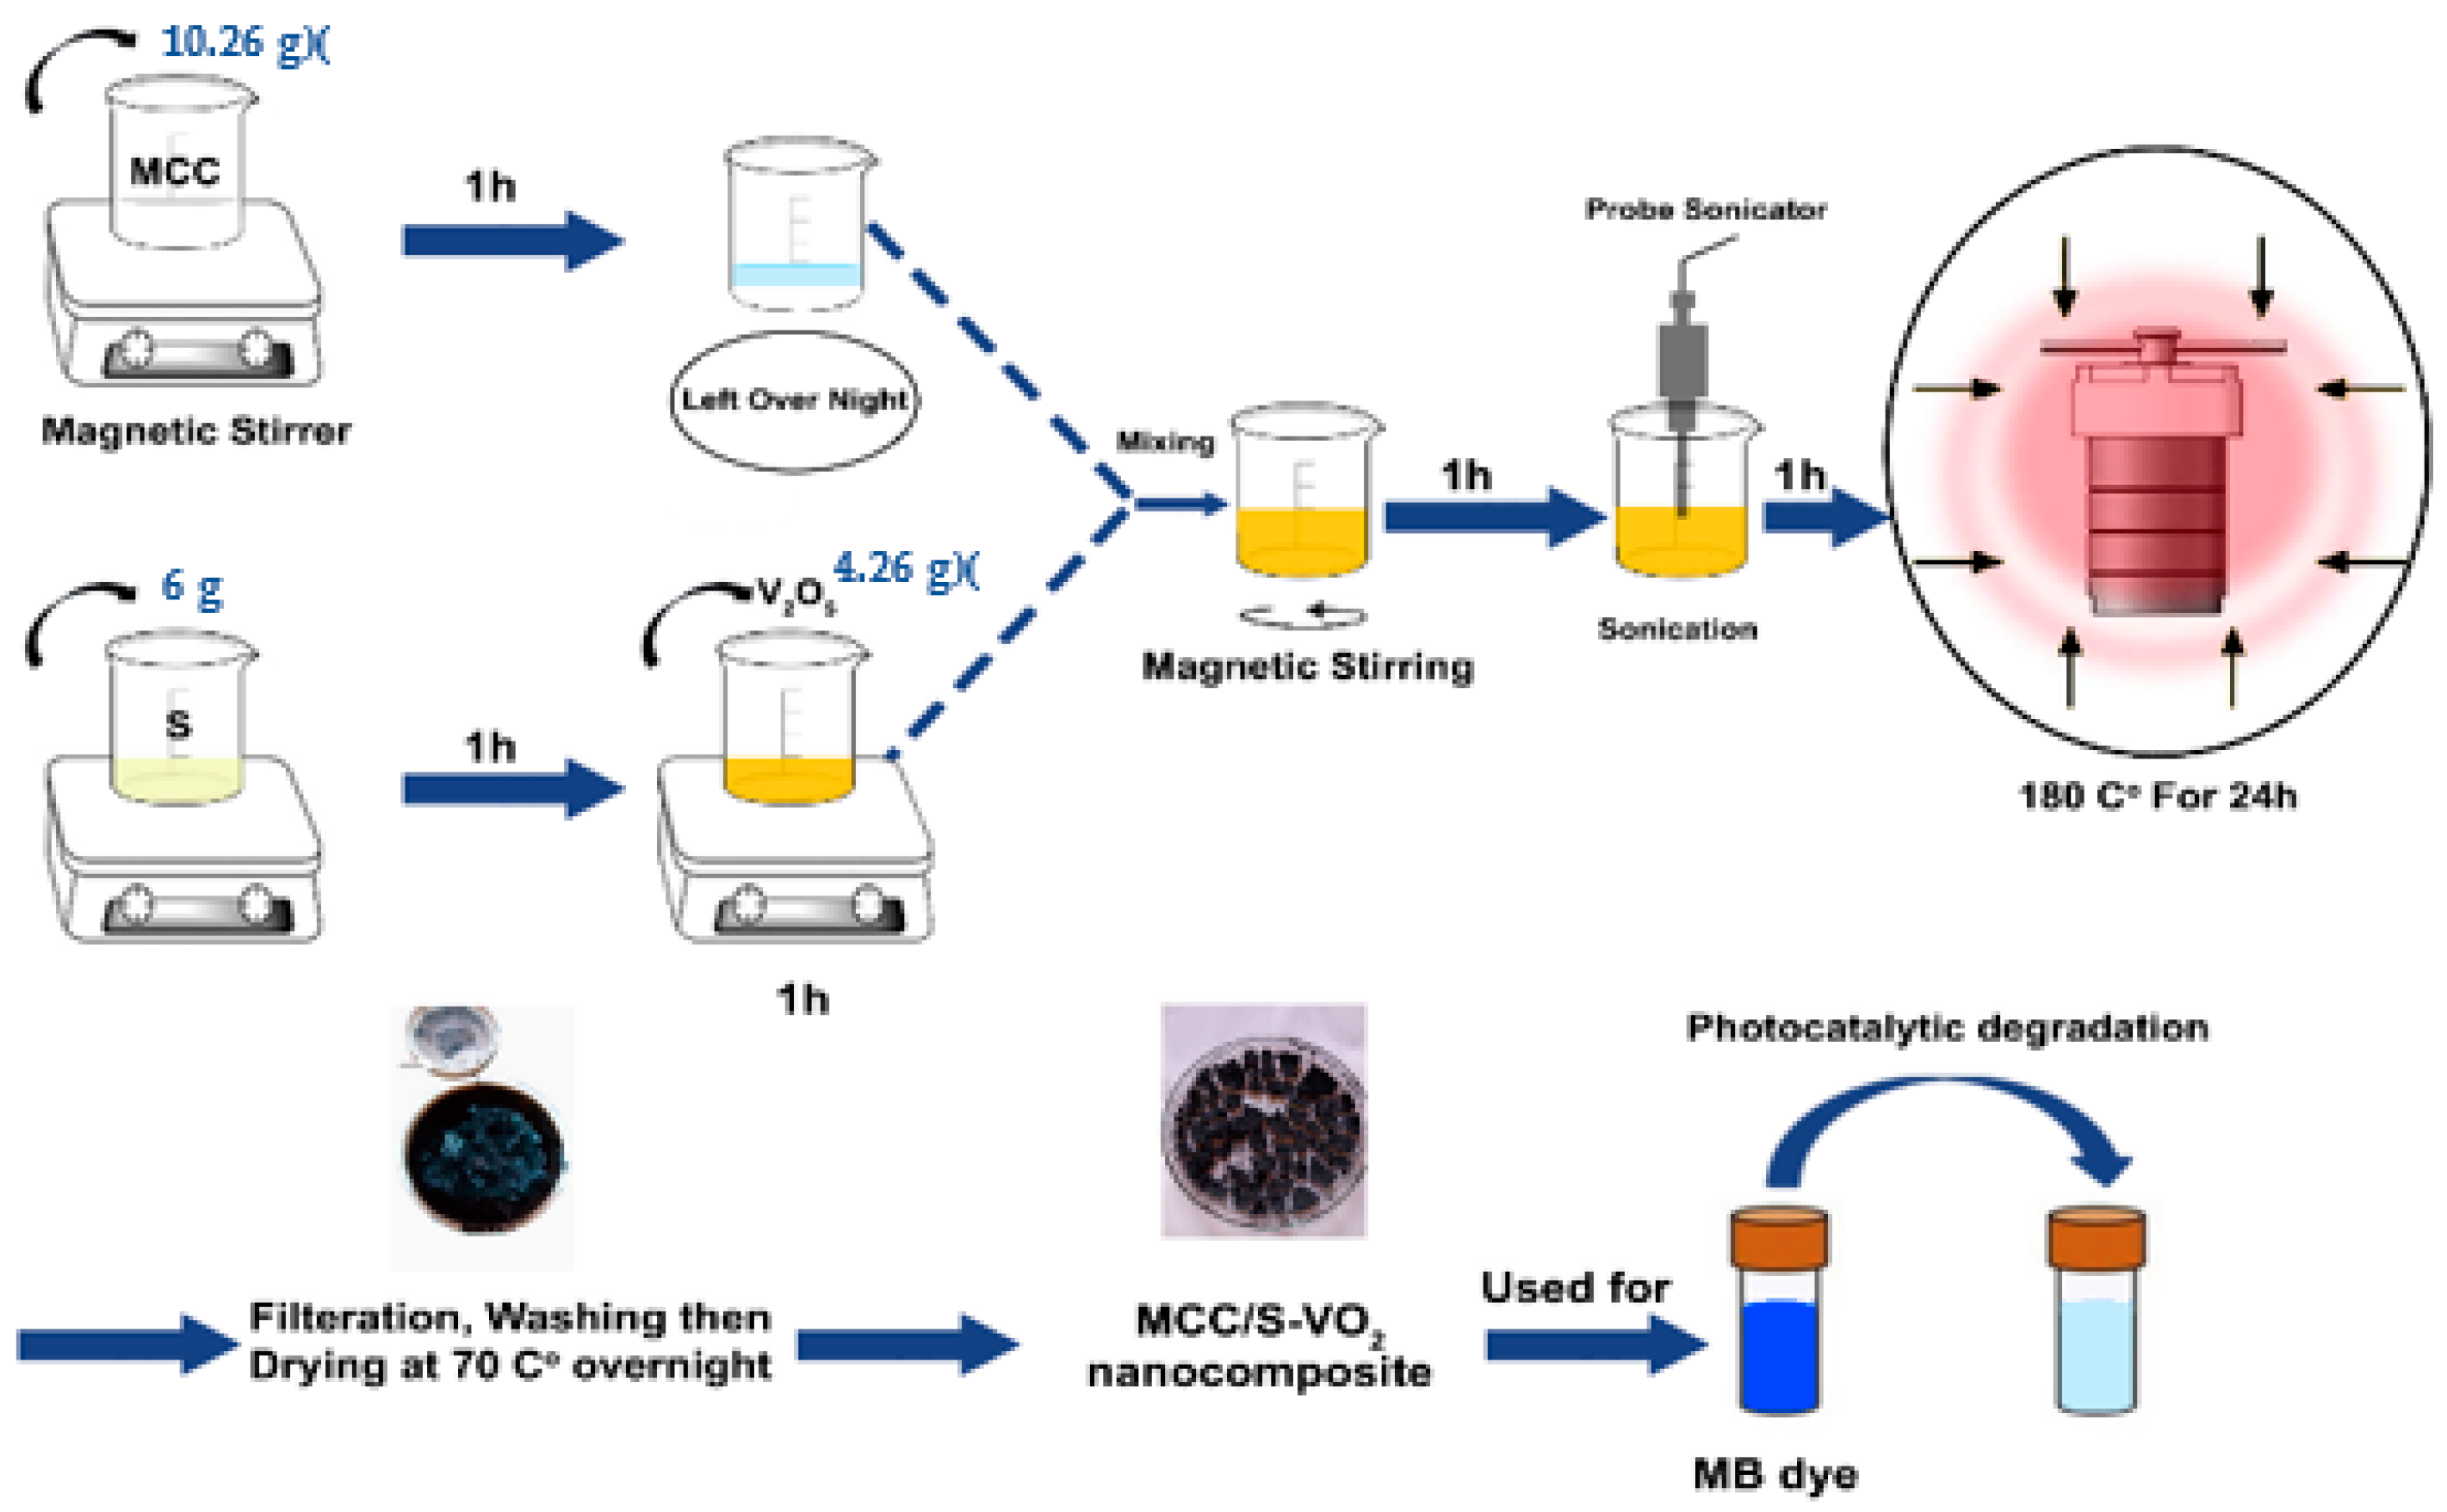
2.2. Synthesis of the Products

2.2.1. Synthesis of Microcrystalline Cellulose (MCC)

MCC was synthesized via acid hydrolysis method [50]. Briefly, 10 g of cotton fibers was soaked in 500 mL HCl (2 M). The mixture was refluxed for 2 h. The product was filtered with the aid of a centrifuge, rinsed several times with DDI water, then dried at 60 °C for 24 h.

2.2.2. Synthesis of S-VO2 and MCC/S-VO2 Nanocomposite

MCC/S-VO2 nanocomposite was prepared with weight ratios of 1:1.4 for V2O5/S and 1:1 for MCC/(V2O5+S), respectively. A total of 10.26 g of MCC powder was added into 50 mL of DDI water, stirred for 1 h, and left to stand overnight. Six grams of sulfur was added into 50 mL of DDI water containing a drop of diethanolamide (non-ionic surfactant) to ensure the homogenous distribution of sulfur, and the suspension was stirred for 1 h; then, 4.26 g of V2O5 was added and stirred for another hour. The MCC suspension was added to V2O5-S mixture and uniformly mixed by using a mechanical stirrer at 600 rpm for 1 h. The resultant mixture was sonicated for 1 h and stirred overnight at 400 rpm to maintain the distribution homogeneity of the components. Finally, the mixture at neutral pH was transferred into a Teflon-lined stainless-steel autoclave and maintained at 180 °C for 24 h. The obtained black product was separated and washed several times with DDI water and ethanol. The final product was dried under vacuum at 70 °C overnight and stored in a vacuum desiccator until use. For comparison, the same procedure was followed without MCC to prepare doped S-VO2 nanoparticles. Scheme 1 presents the steps of MCC/S-VO2 preparation.

2.3. Photocatalytic Degradation Experiments

The photocatalytic performance of the as-prepared products was evaluated by the photodegradation of aqueous methylene blue solution at room temperature under the illumination of UV light using UV lamps (Philips 3 × 20 watt, λmax = 365 nm). Typically, 20 mg of the as-prepared photocatalyst was well dispersed into 100 mL of MB solution (20 mg L−1) and stirred for 45 min in the dark to ensure the homogenous adsorption of MB toward the catalyst active sites. After that, the stirring suspension was exposed to UV irradiation at a fixed distance from the dye solution, 20 cm. Three milliliters of aliquots was taken at pre-determined time intervals and centrifuged to separate the solid particles. The remnant MB solution concentration was spectrophotometrically measured at the maximum absorption around λmax = 664 nm. The decolorization efficiency (DE) was calculated using the following Equation (1):
D E = C 0 C t C 0 × 100
where C 0 and C t are the initial concentration of the dye at zero time and the remaining concentration after time t, respectively. The catalytic activity of photocatalysts in a combined system (photocatalyst + H2O2) was performed at the same photocatalysis conditions (20 mg of photocatalyst, 100 mL of MB solution (20 mg L−1)) by the addition of 0.05 mL H2O2 (50 wt.%) into the suspension before turning on the UV lamps.
Recycling experiments of photocatalysts under the same photocatalysis conditions were carried out. Each cycle lasted for 55 min with fresh MB solution. The photocatalyst was gathered after each cycle by centrifugation, then double washed with DDI water and ethanol and oven dried at 70 °C for 2 h. The sample was reused for posterior degradation. To obtain deep insight into the responsible active species for the MB degradation process in the presence of H2O2, a set of scavenging experiments was performed. The scavengers were added at a 20-fold molar concentration relative to the initial MB concentration (20 mg of photocatalyst, 100 mL of MB solution (20 mg L−1)). Ascorbic acid (AA) as O2 scavenger [51], EDTA–2Na as h+ scavenger [52], and isopropyl alcohol (IPA) as OH scavenger [53] were separately added in an exemplary degradation process.

2.4. Instruments

The structure of the as-prepared samples was characterized by X-ray diffractometer (XRD), Bruker model D8 Advance, with Cu-Kα radiation and 0.02° step interval s−1. The crystalline phase of the nanoparticles was identified by comparing the major peak positions with standard JCPDS files. The main functional groups were characterized using Fourier transform infrared (FT-IR), Thermo Scientific, model Nicolet iS10, at 4000–400 cm−1 range, and Raman analysis was measured with a dispersive Raman spectrometer (BRUKER-SENTERRA, Bruker Optics, Billerica, United States) equipped with an integral microscope (Olympos); the excitation source was Nd/YAl G laser (784 nm). The surface composition and chemical state of the nanocomposite were characterized by X-ray photoelectron spectroscopy (XPS), Thermo Fisher Scientific, USA, with monochromatic X-ray Al K-alpha radiation −10 to 1350 eV. The morphology of the products was examined by a field emission scanning electron microscope (FE-SEM) (Quanta 250 FEG, Field Emission Gun) equipped with energy dispersive X-ray (EDX) at an accelerating voltage of 30 kV and a high-resolution transmission electron microscope (HR-TEM; JEM-2100) operated at an accelerating voltage of 200 kV. The thermal stability of the composite was studied under N2 atmosphere, employing a thermal analyzer (Shimadzu, TA-60WS, Kyoto, Japan) at a heating rate of 10 °C min−1. Jasco UV-Visible spectrophotometer model (V670) supplied with integral sphere model (ISN-723) using barium sulfate as a reference was employed to measure the diffuse reflectance spectra (DRS) of the as-prepared samples and the concentration of the MB dye at λmax = 664 nm.

3. Results and Discussion

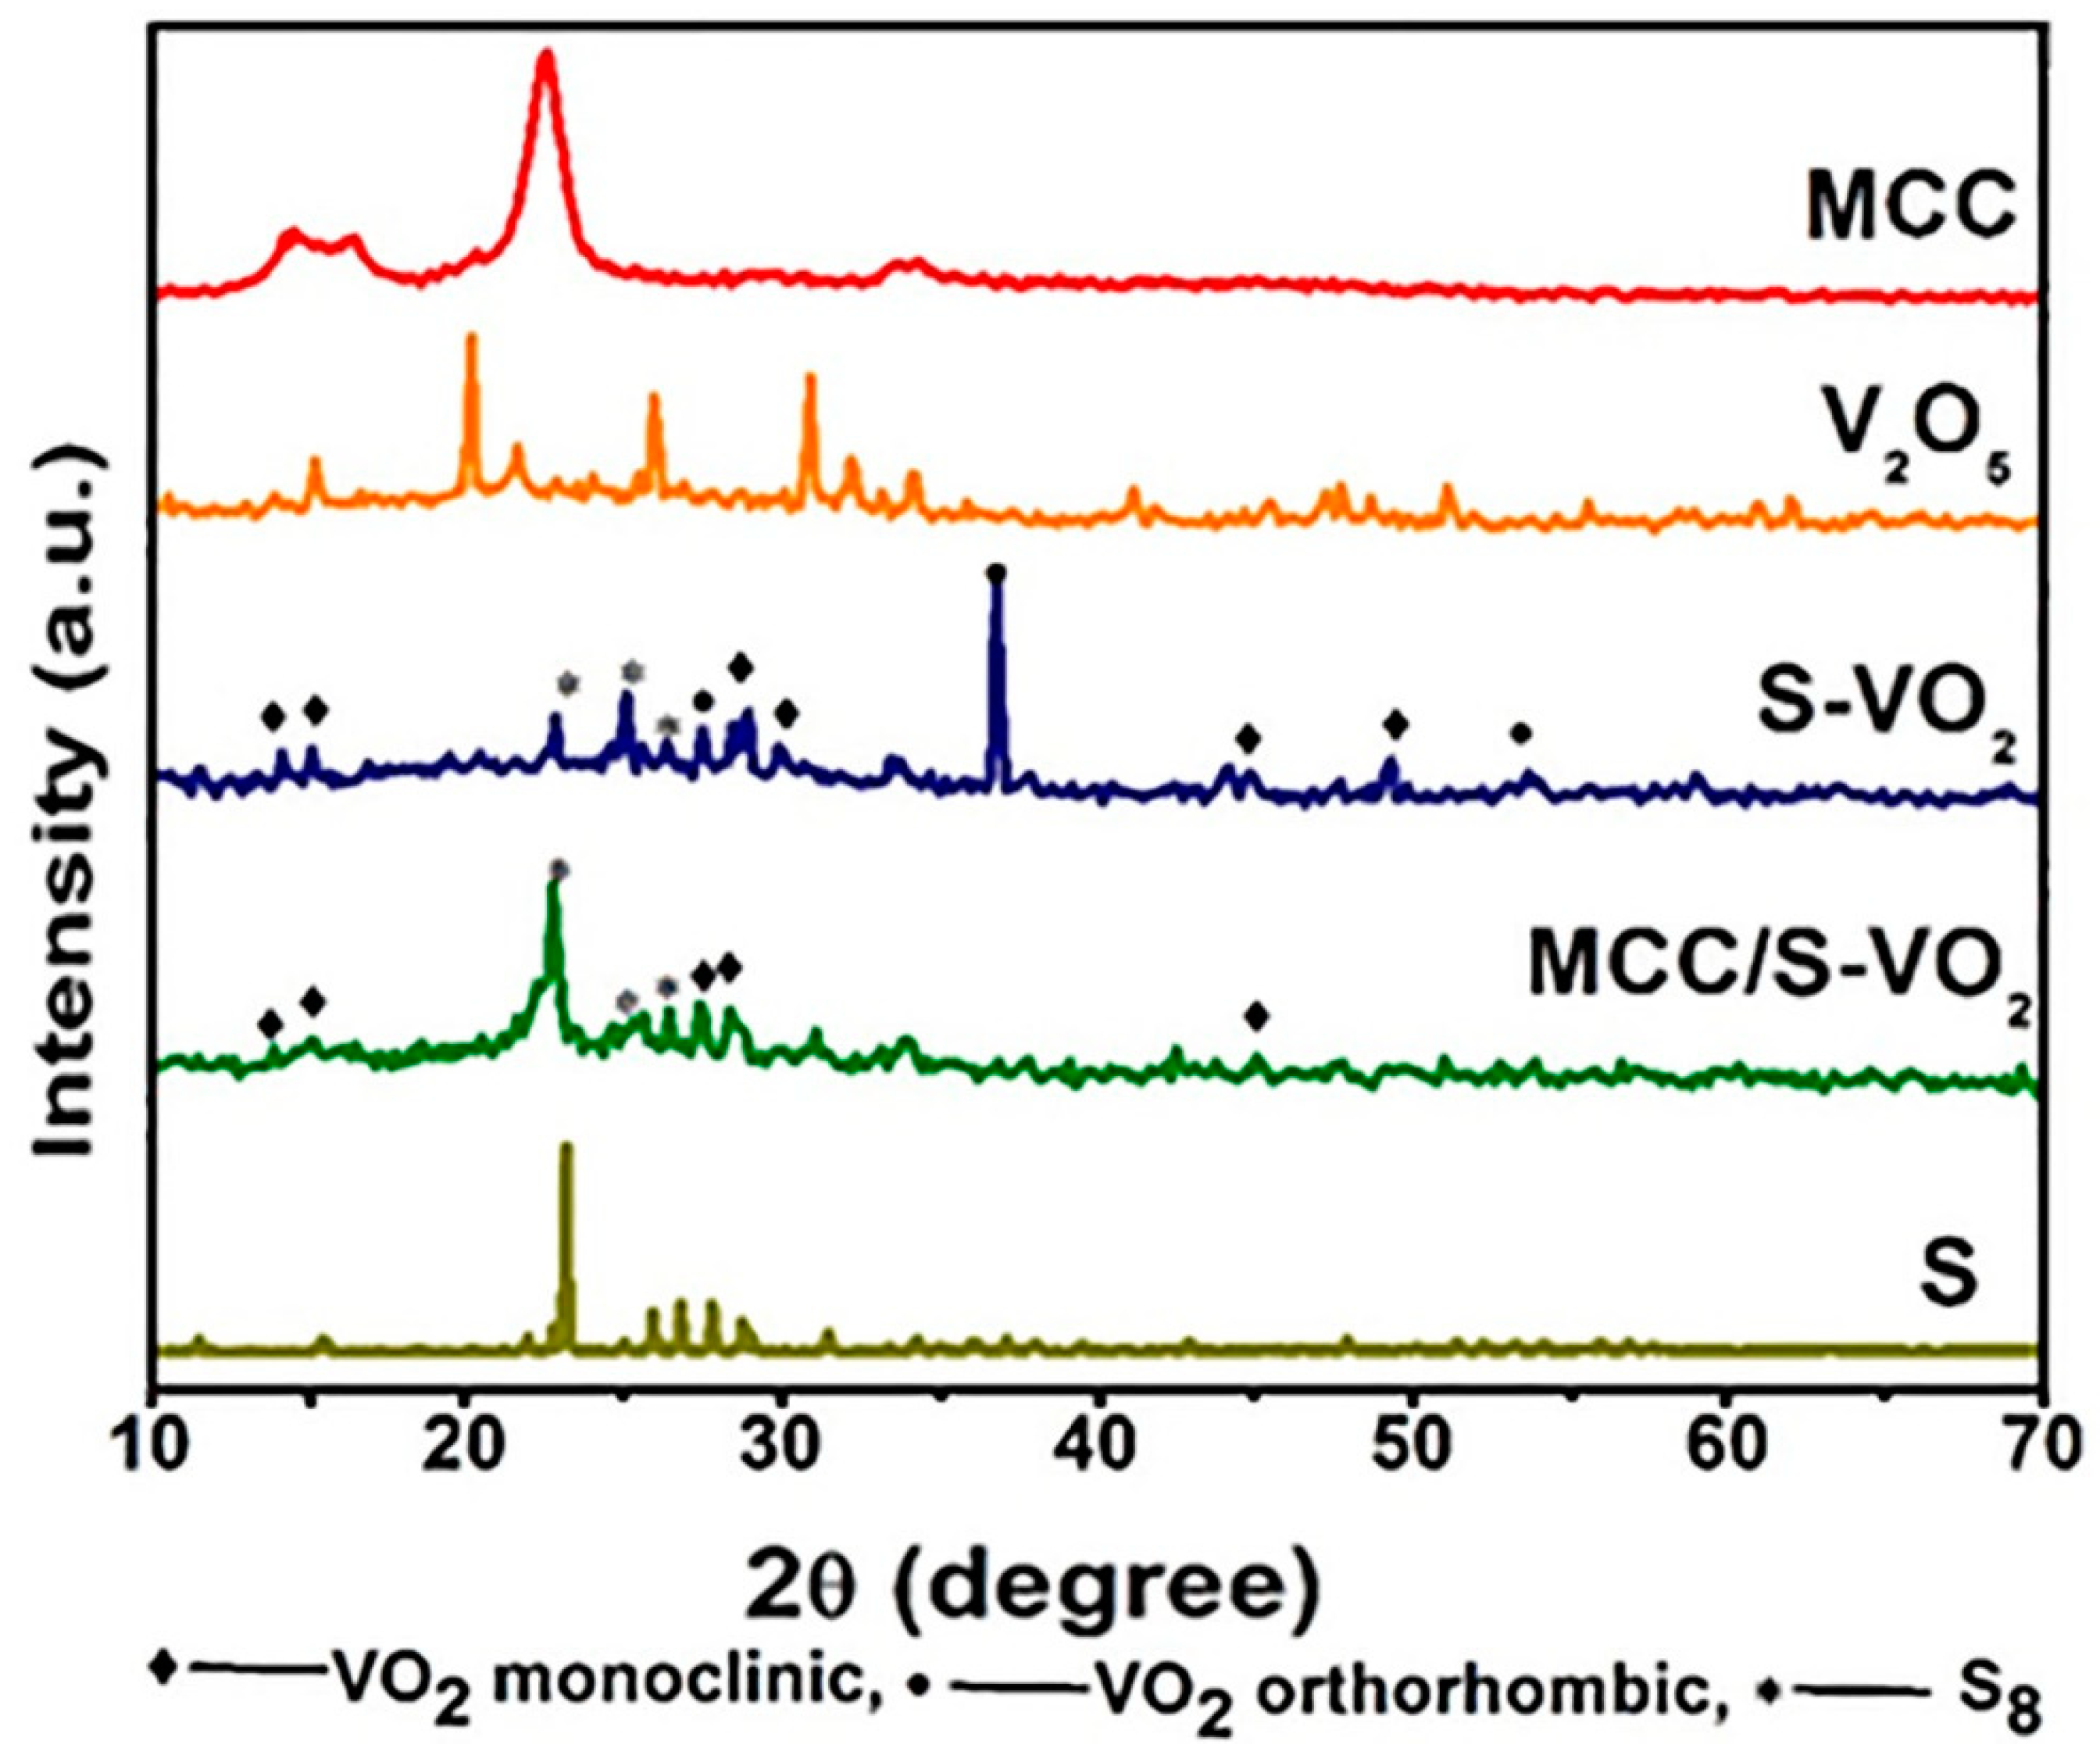
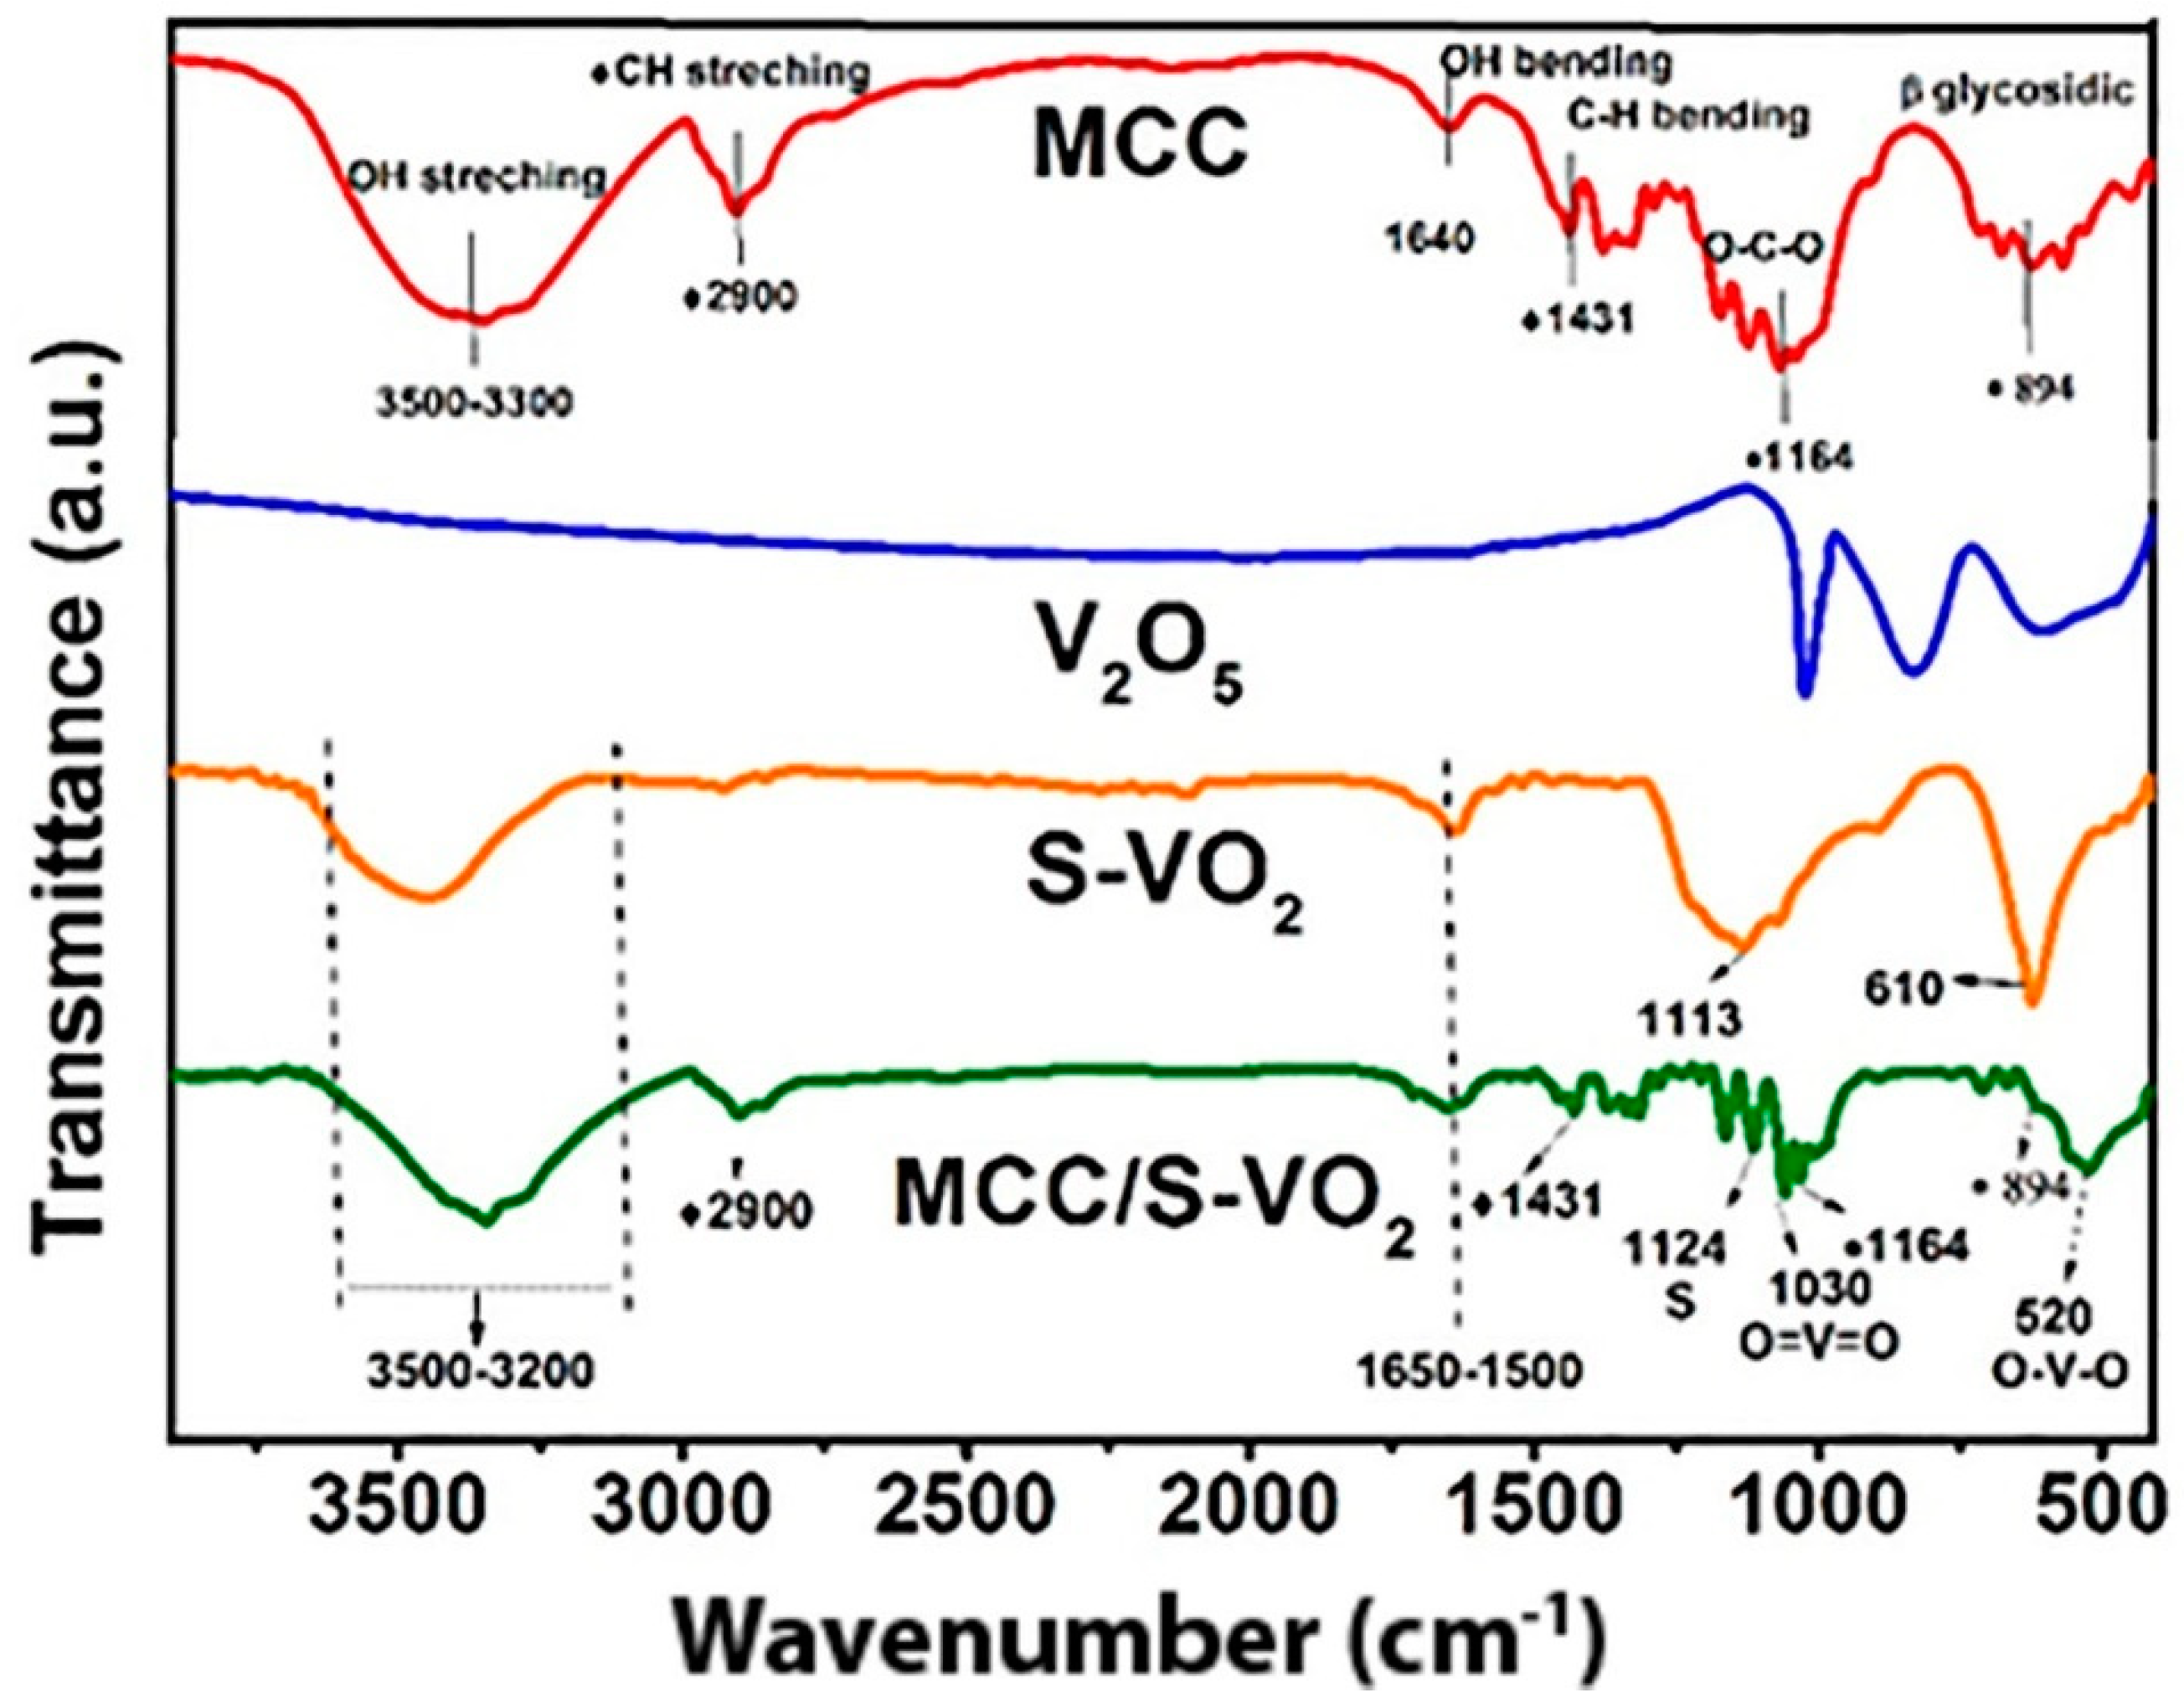
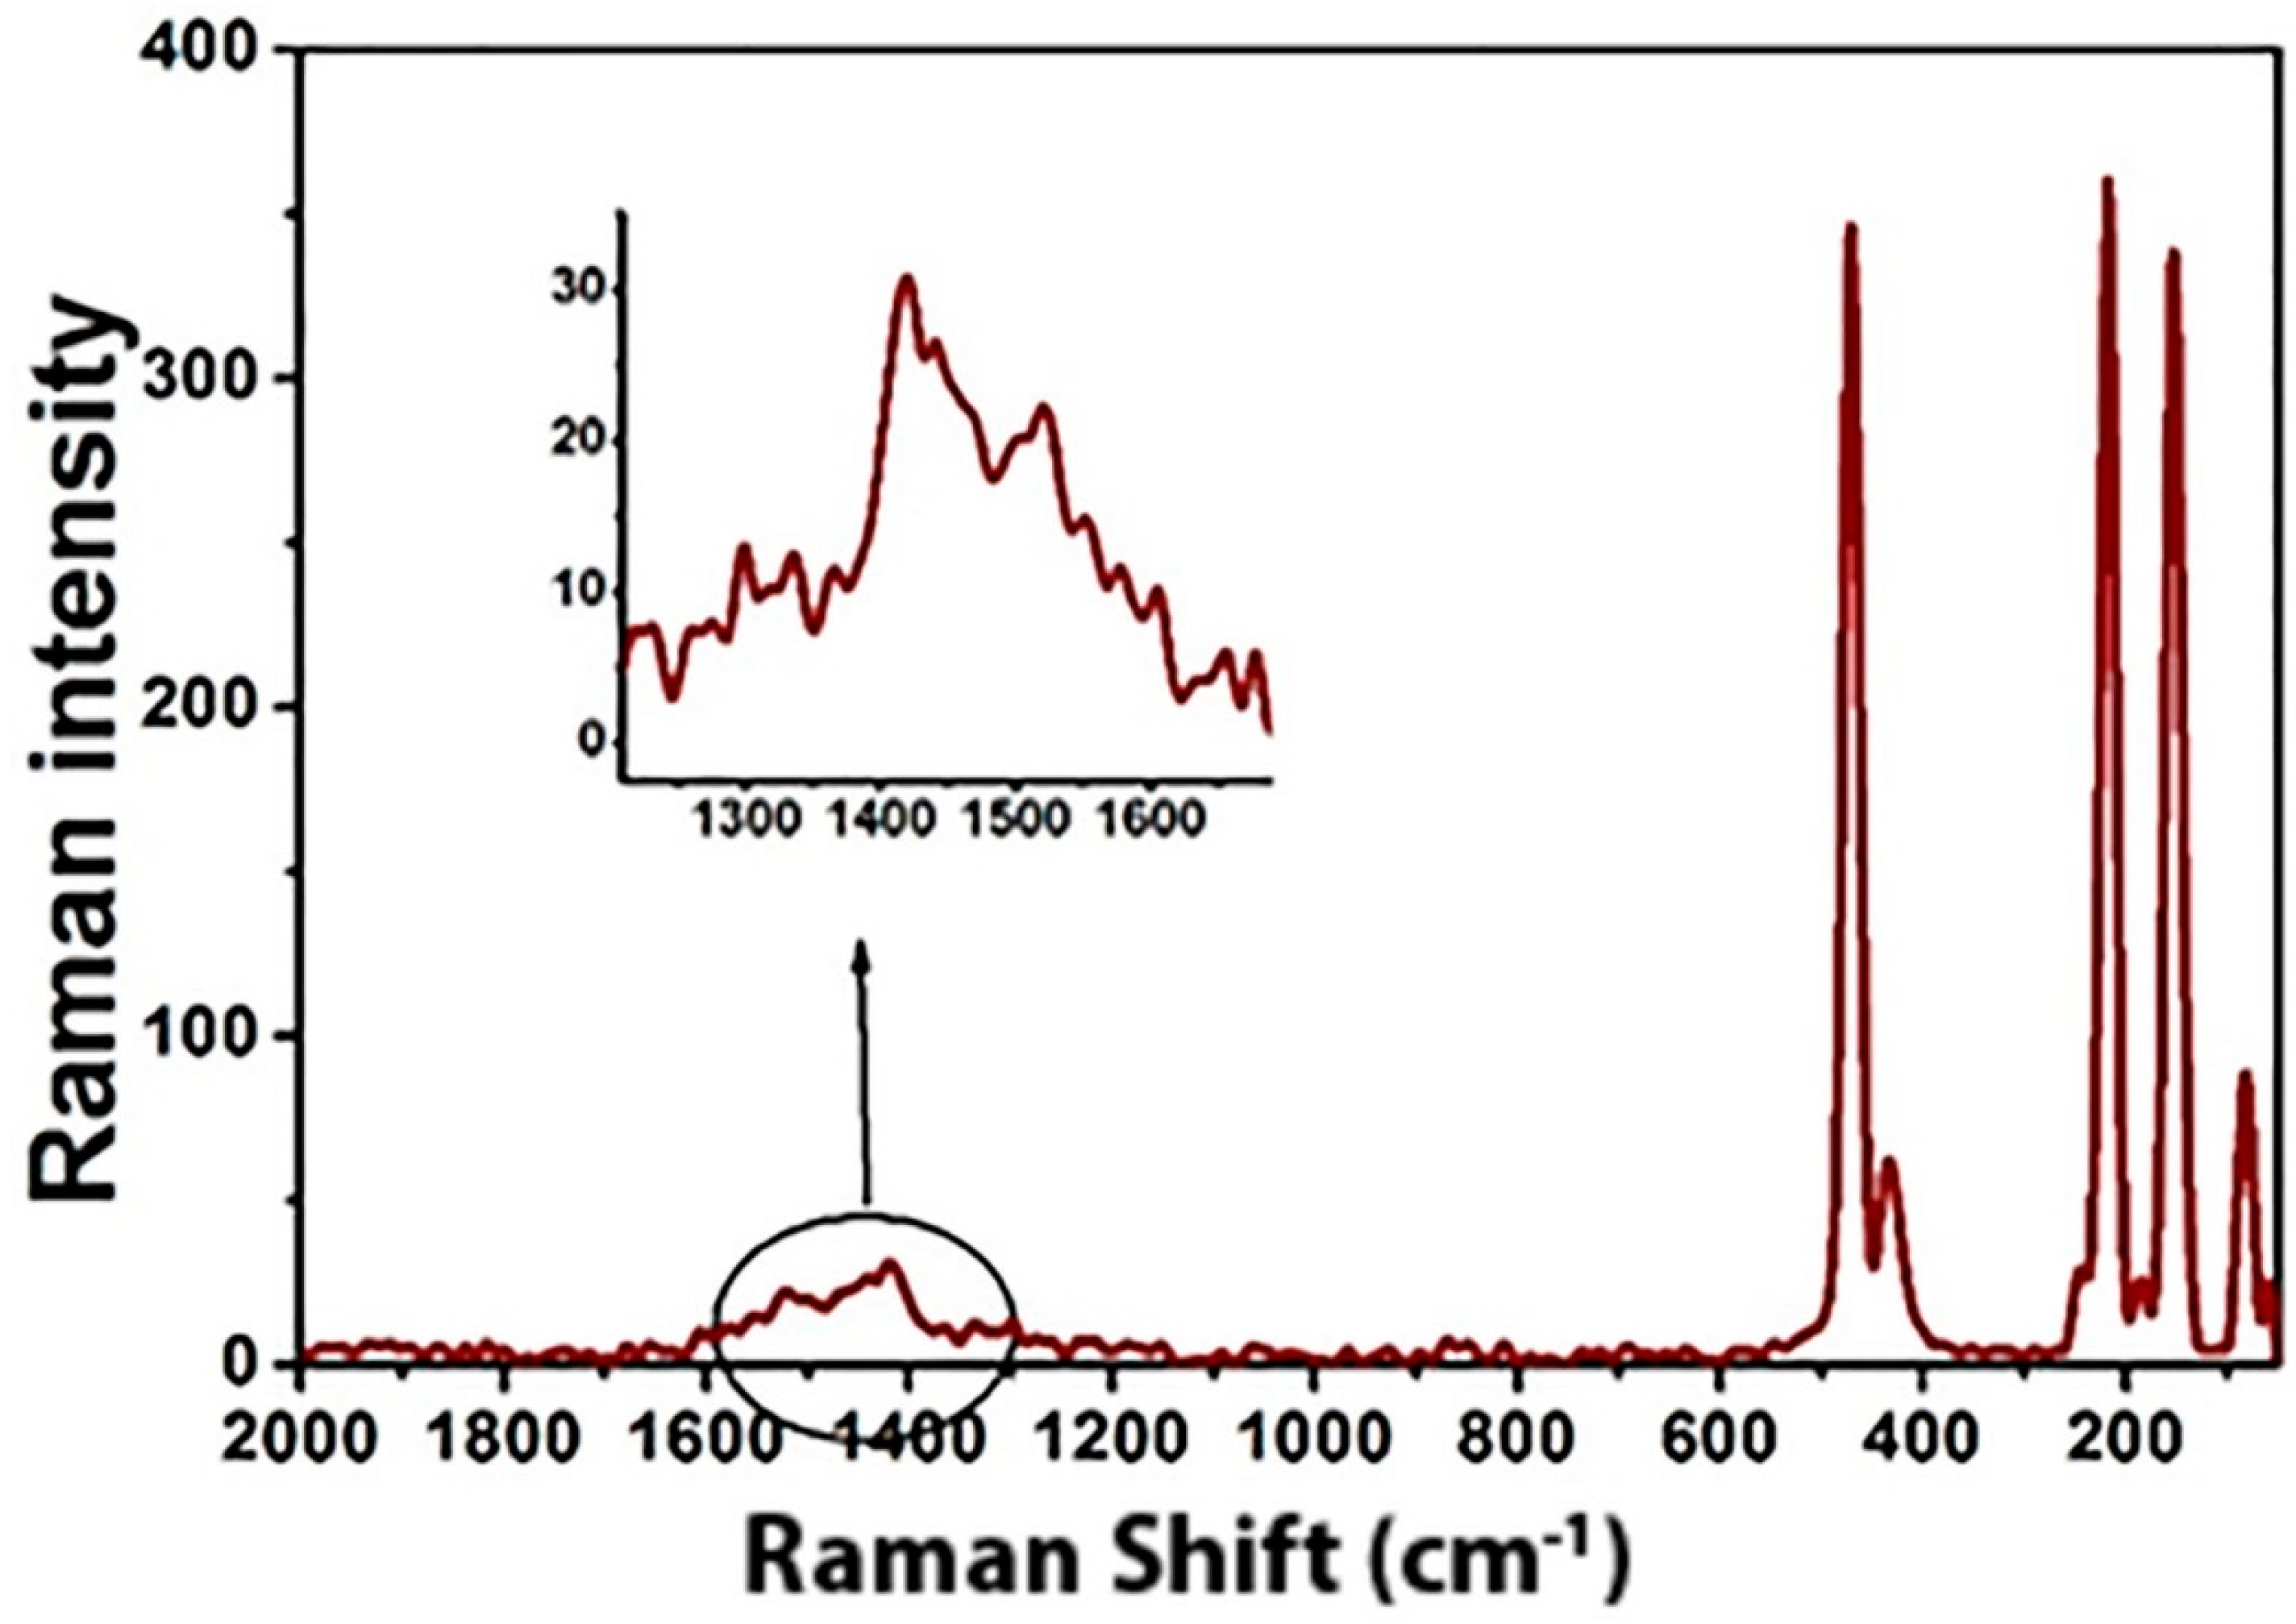
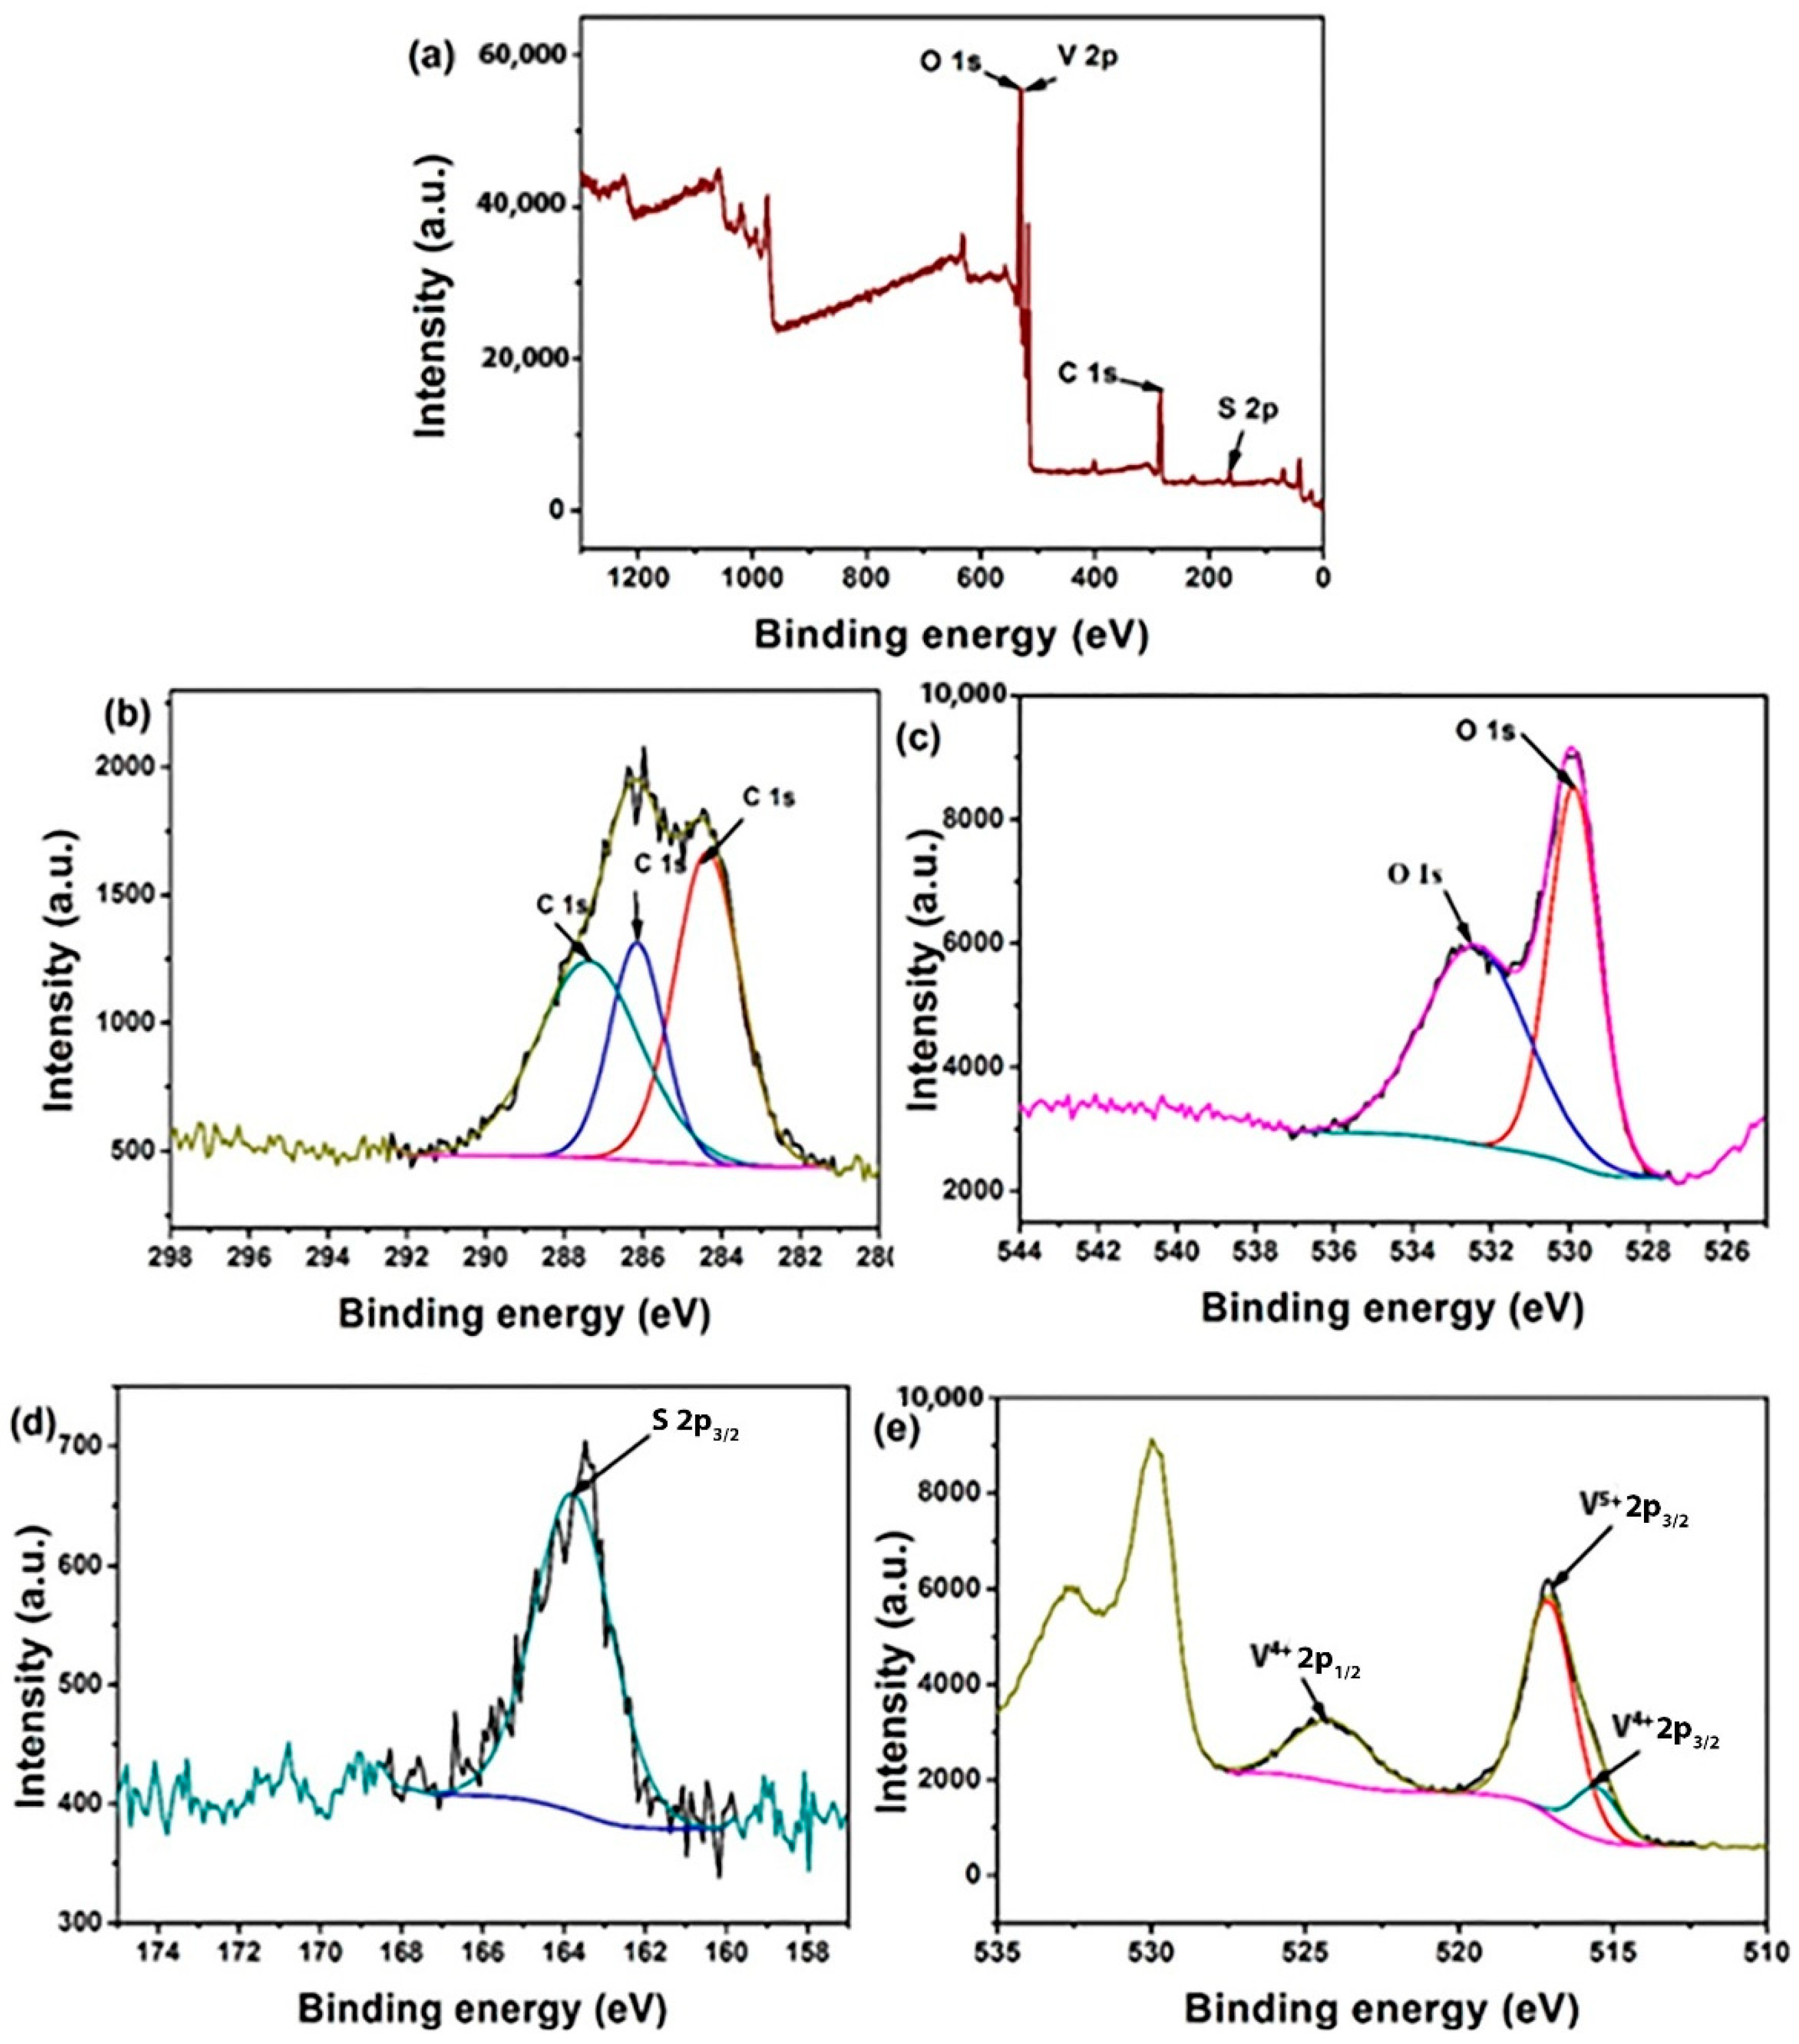
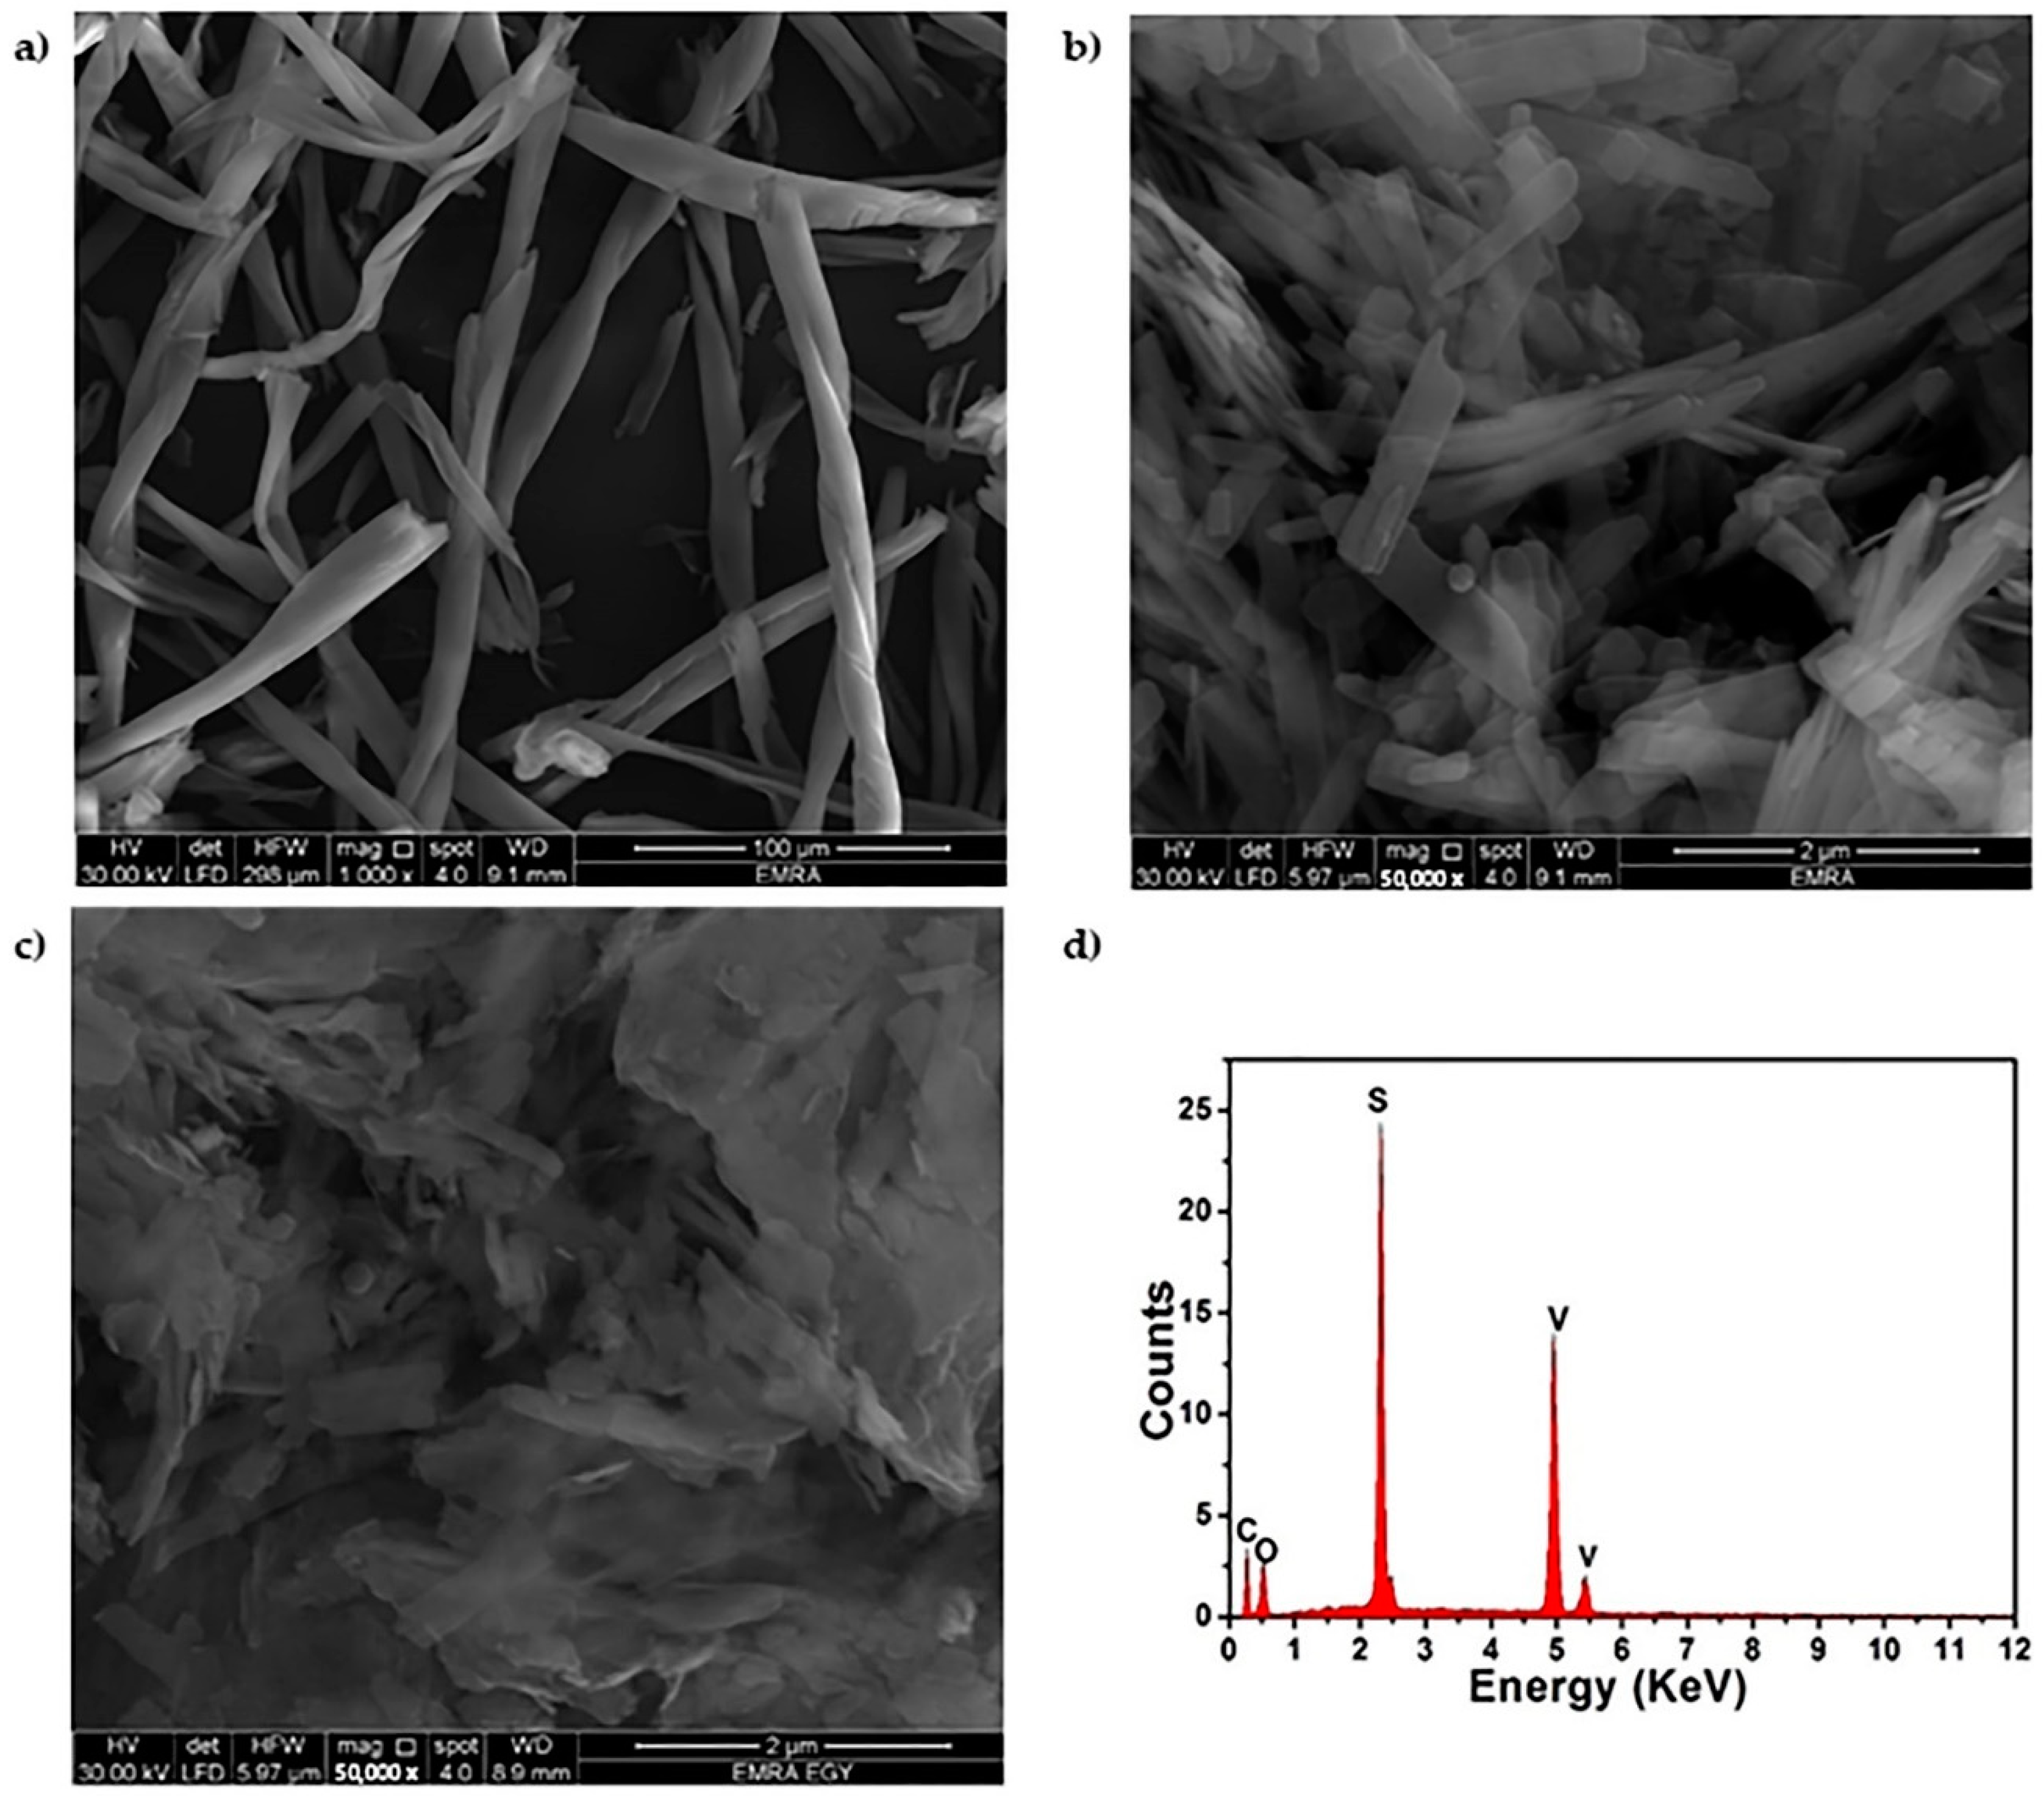
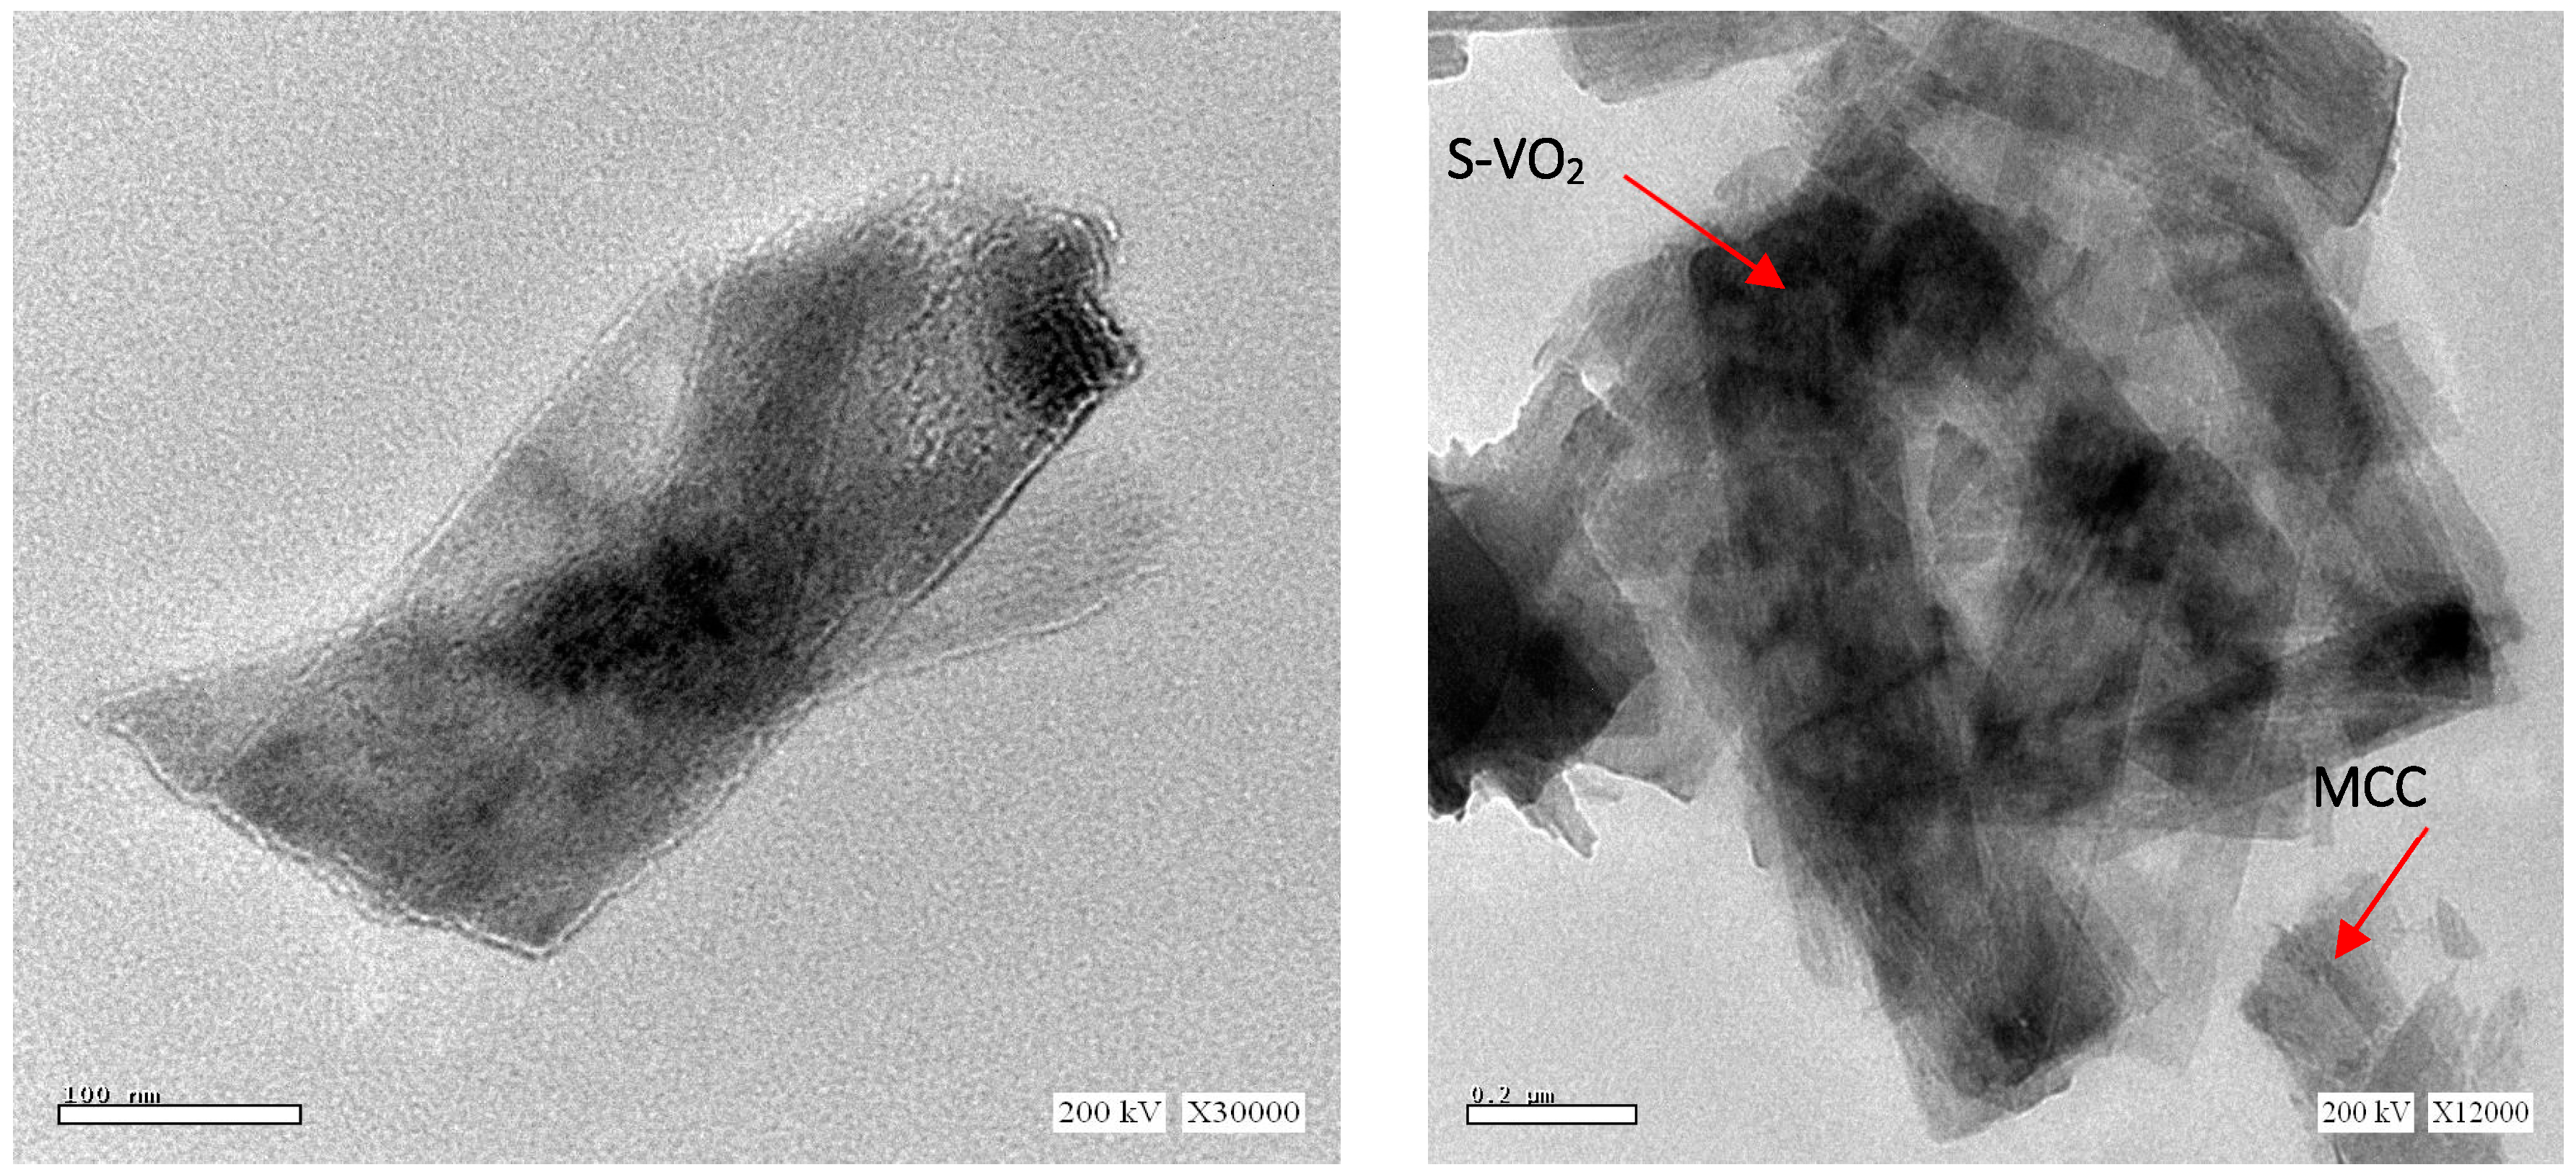
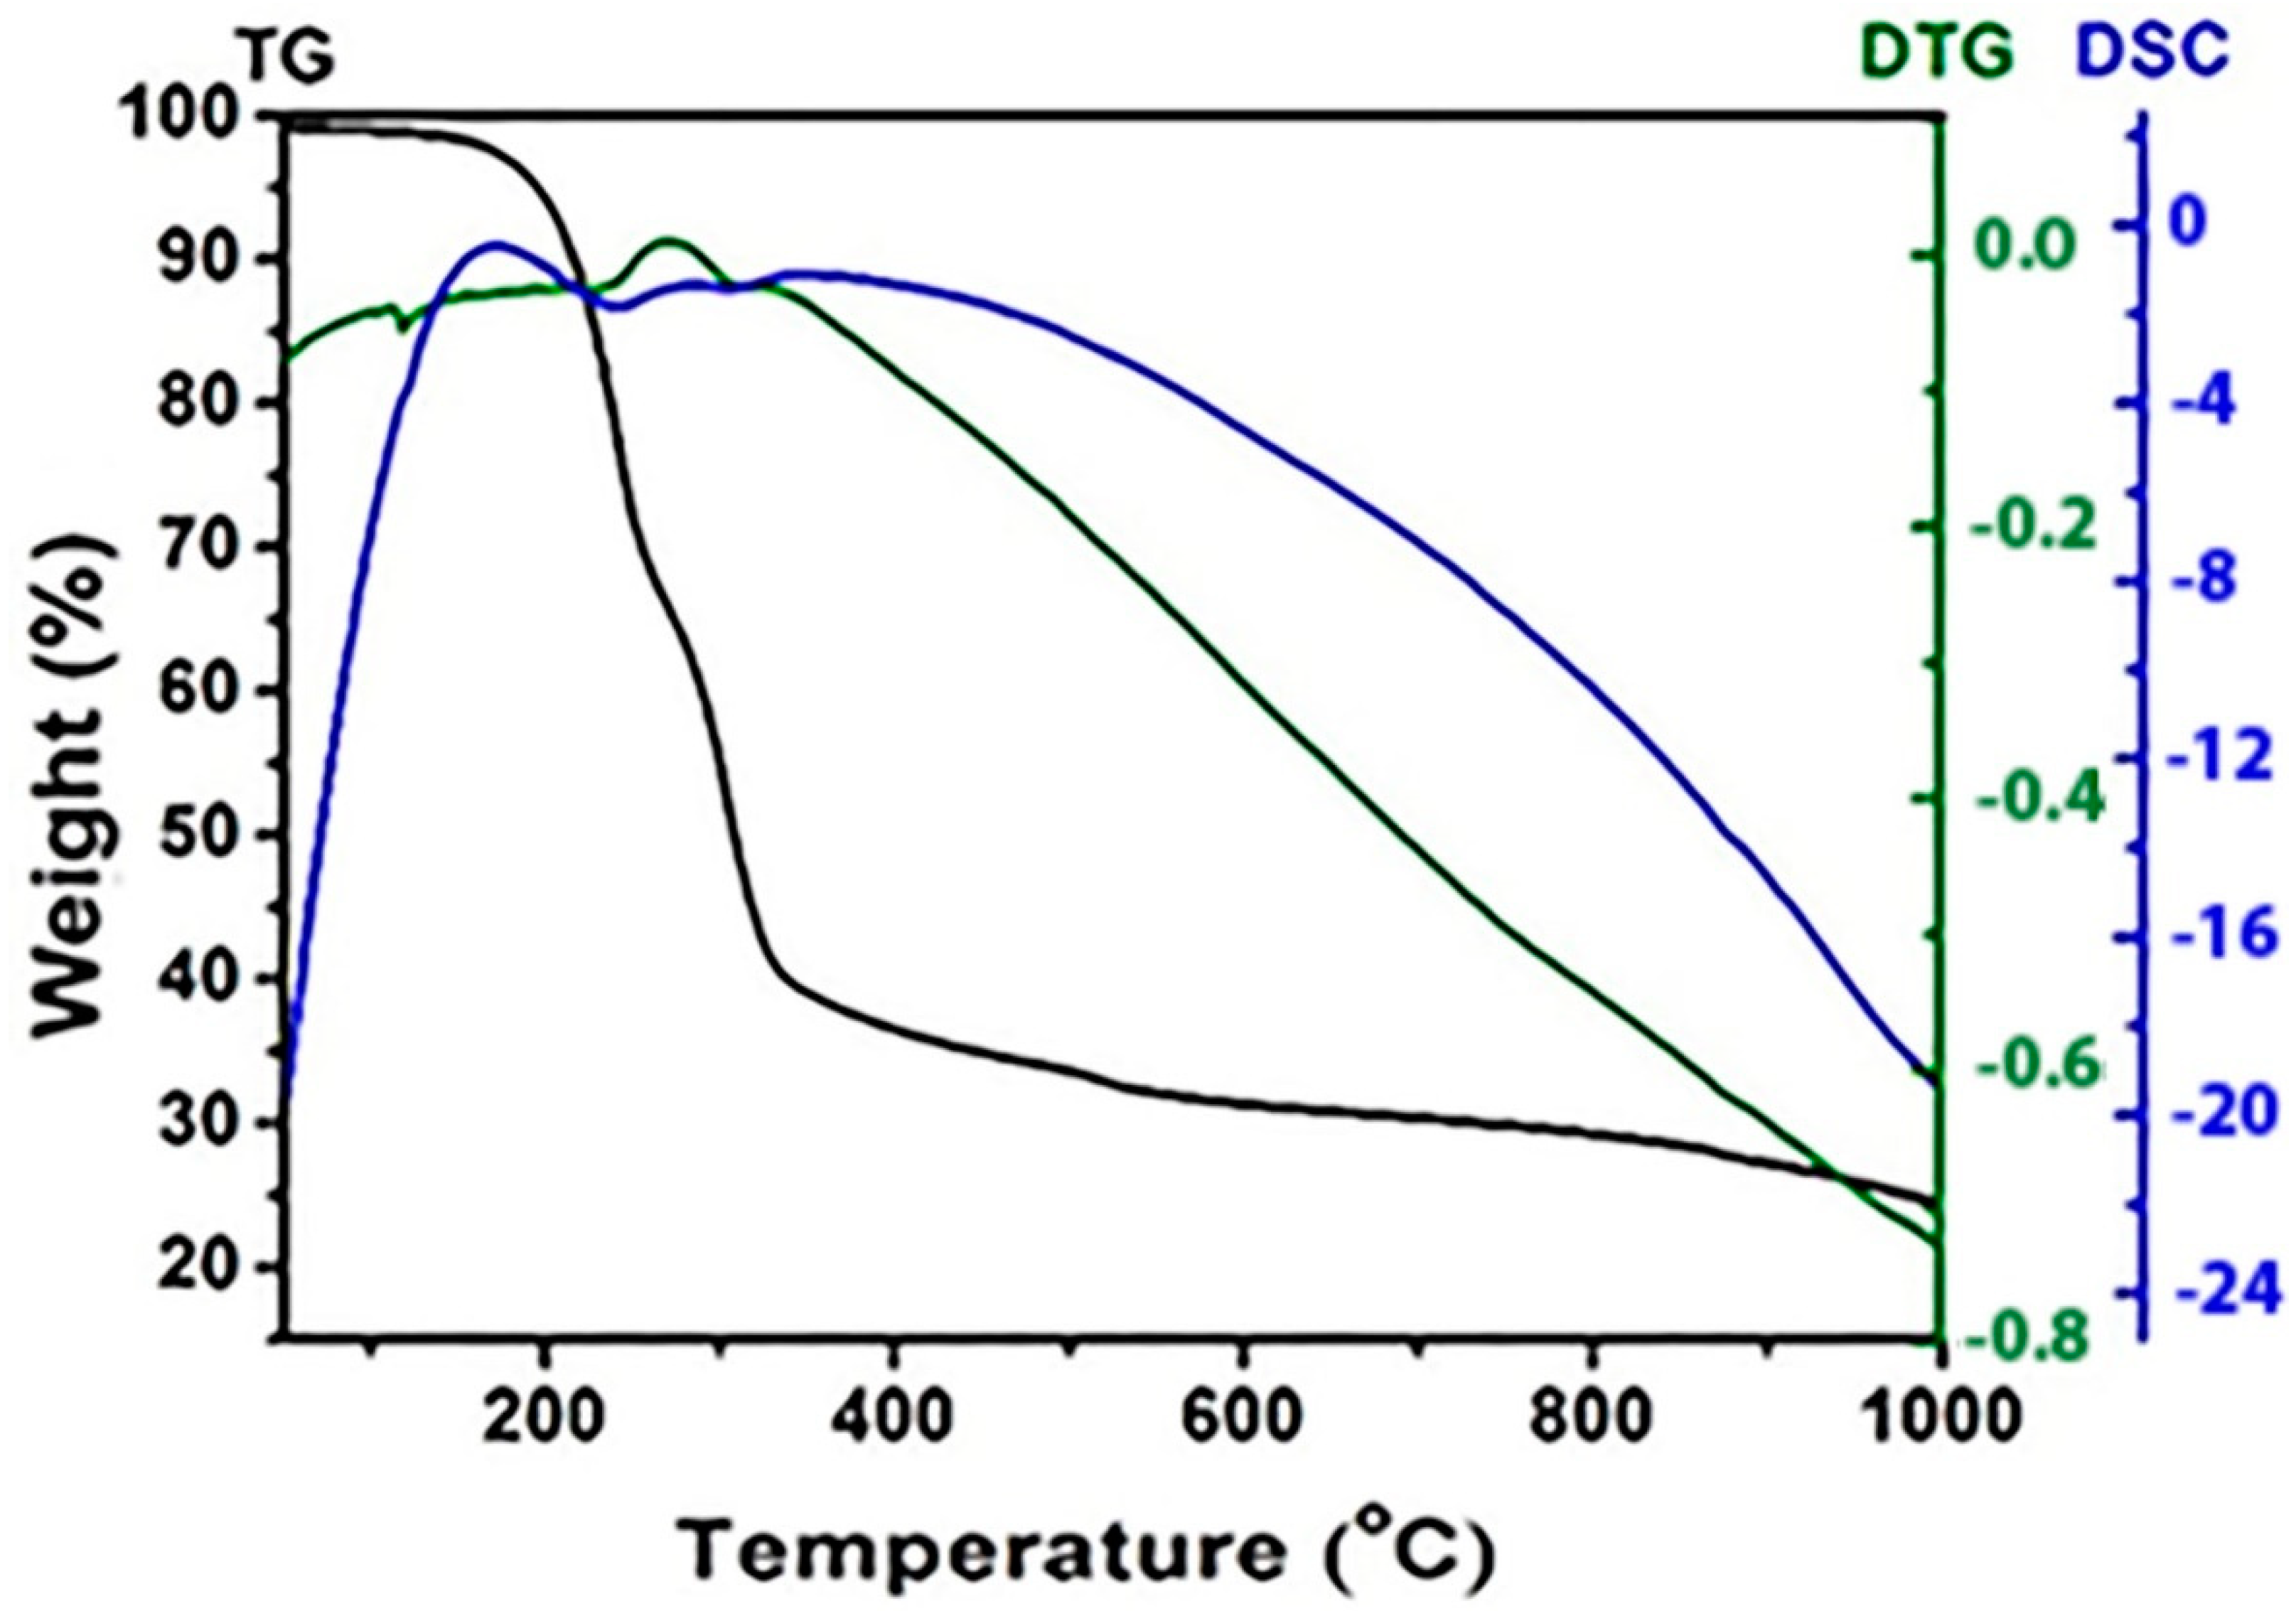
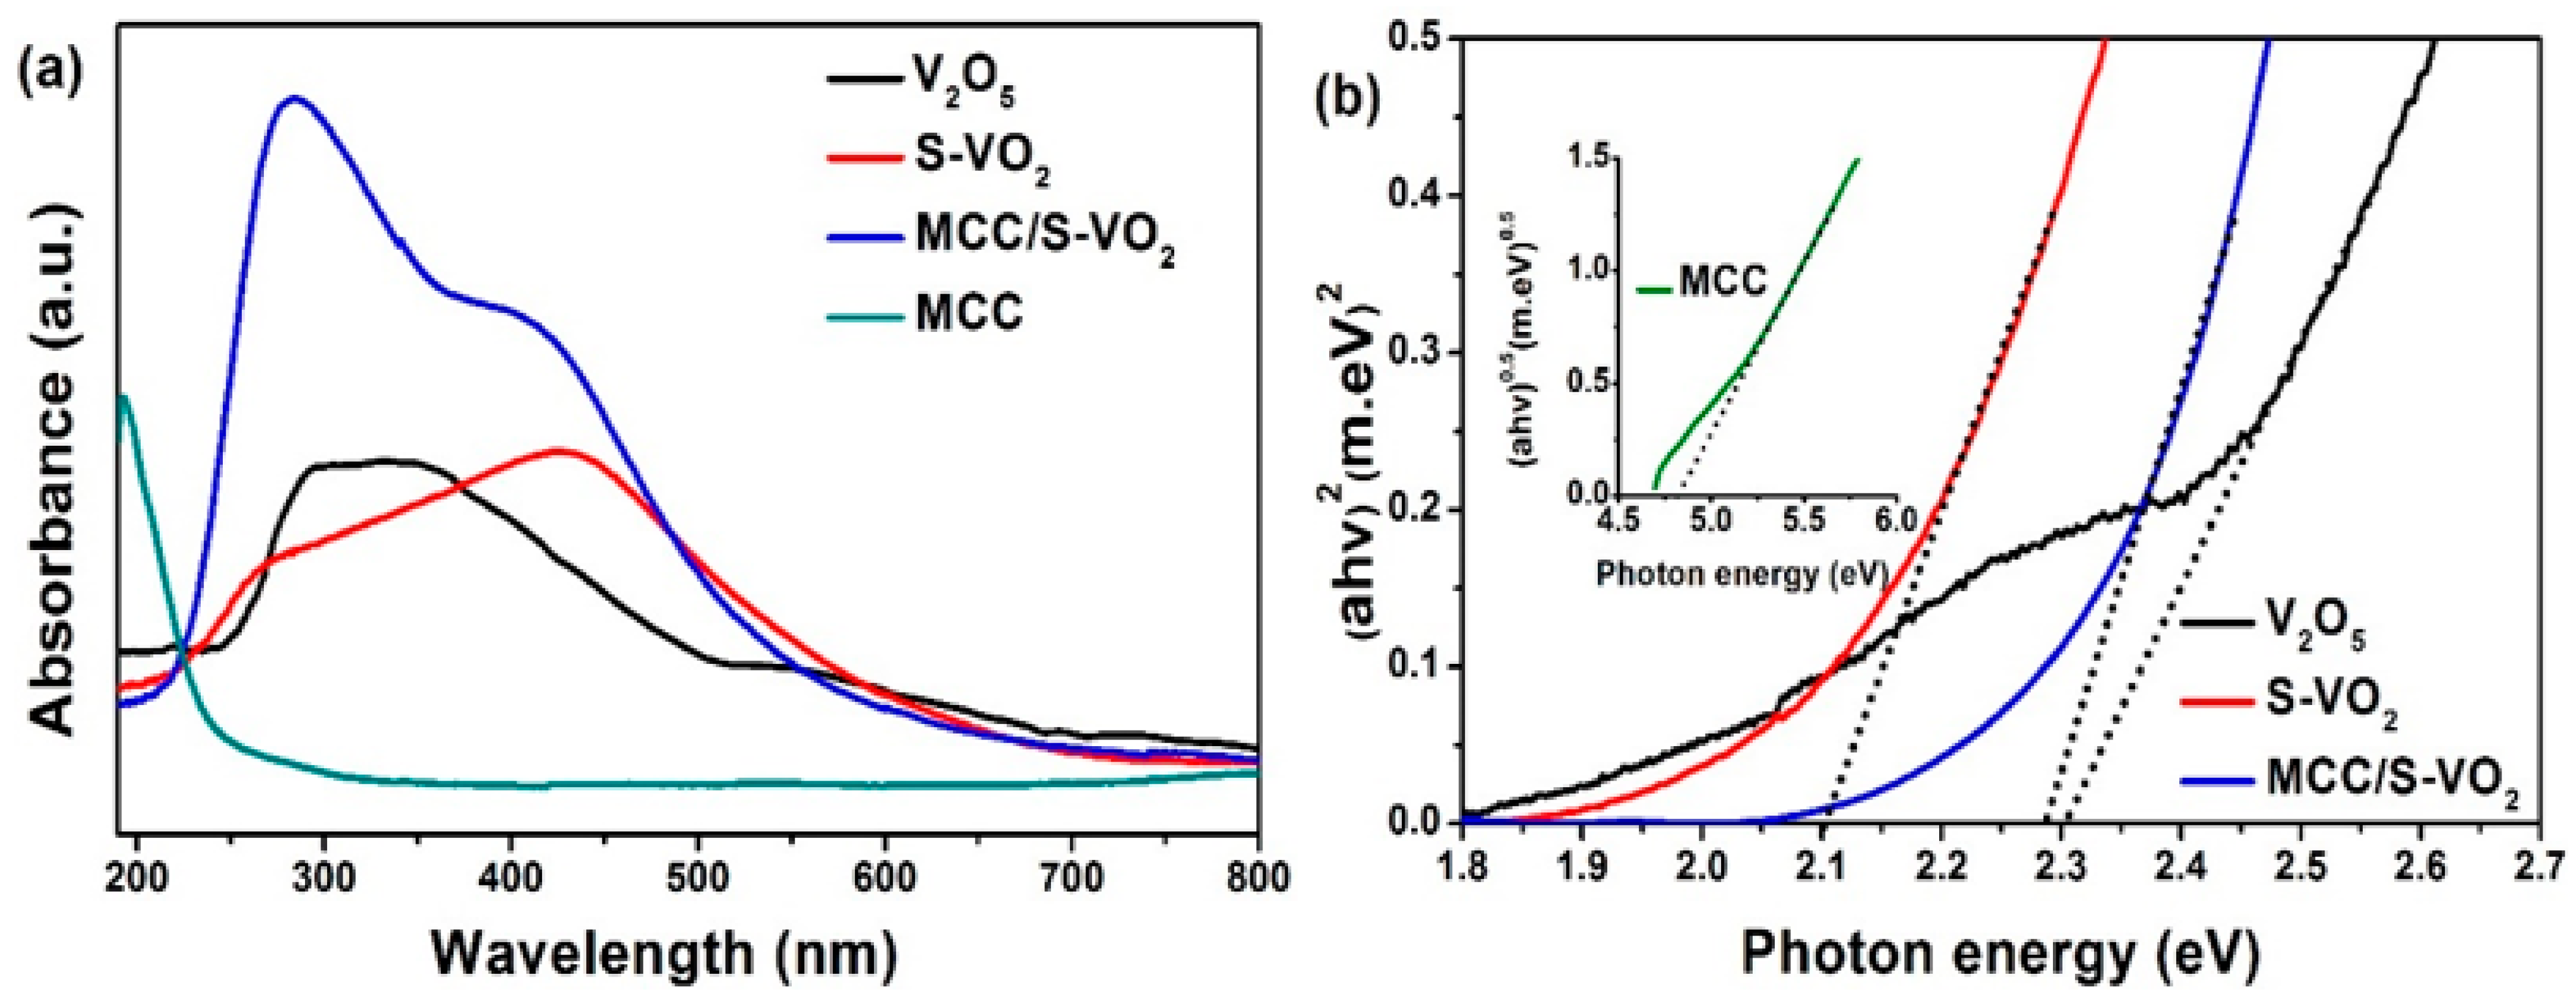
3.1. Characterization of the As-Prepared Products

Figure 1 shows the X-ray diffraction patterns of V2O5, MCC, S, S-VO2, and MCC/S-VO2 products. The XRD pattern of V2O5 nanoparticles corresponds well to the orthorhombic structure with lattice parameters of a = 3.564 Å, b = 11.516 Å, and c = 4.373 Å (JCPDS No 85-0601). The XRD pattern of S is in good agreement with the S8 orthorhombic structure with lattice parameters of a = 10.384 Å, b = 12.755 Å, and c = 24.4098 Å (JCPDS No 83-2285). The XRD pattern for MCC shows diffraction profiles characteristic of cellulose I (JCPDS No. 50-2241) [54]. No peaks from other crystalline impurities were detected, indicating the high purity of the prepared MCC. In comparison, the XRD patterns of S-VO2 and MCC/S-VO2 revealed that no diffraction peaks corresponding to the V2O5 precursor appeared. This can be attributed to the effective reduction of the bulk V2O5 using a hydrothermal method in the presence of relatively high sulfur content, and the reduction of V5+ to V4+ may be formulated as follows:
2V2O5 + S → 4VO2 + SO2
For S-VO2, the characteristic diffraction peaks for VO2 displayed with a hybrid phase were as follows: a monoclinic VO2 (JCPDS No. 81-2392) [55] at 2θ = 14.4°, 15.4°, 25.2°, 29.0°, 30.0°, 33.5°, 44.6°, 45.0°, and 49.1° via elaborating the crystal planes (001), (200), (100), (022), (401), (310), (003), (601), and (020), respectively; and an orthorhombic VO2 (JCPDS No. 76-0676) at 2θ = 27.48°, 28.44°, 36.8°, and 53.88° corresponding to the (222), (400), (040), and (062) crystal planes, respectively, while the XRD pattern of the MCC/S-VO2 composite showed characteristic diffraction peaks indexed to a monoclinic crystalline phase of VO2 (JCPDS No. 81-2392), as well as the distinctive peaks related to MCC at 2θ = 15.0°, 16.6°, and 22.8°. This observation can be attributed to the fine dispersion of the composite through the MCC matrix. The XRD features with 2θ at 23.1°, 25.8°, 26.7°, and 27.7°, corresponding to S8, were detected for both S-VO2 and MCC/S-VO2, suggesting that some sulfur molecules were adsorbed on the catalyst surface. Additionally, the average crystallite sizes of the products were estimated using the Debye–Scherrer Equation (3) [56].
D = 0.9 λ β cos θ B
where θ B , β , and λ are the Bragg diffraction angle, diffraction peak full width at half maximum (FWHM), and wavelength of the X-ray radiation (nm), respectively. The average crystallite size of the V2O5, S-VO2, and MCC/S-VO2 was estimated to be 51.38, 50.65, and 34.76 nm, respectively.
The FT-IR spectroscopy of the MCC, V2O5, S-VO2, and MCC/S-VO2 was carried out and is depicted in Figure 2. The MCC spectrum displayed a broad band at a region of 3300–3500 cm−1 and a weak band at 1640 cm−1, corresponding to the stretching and bending vibrations of OH groups, respectively [57]. The bands located at 2900 and 1431 cm−1 correspond to C-H stretching and bending vibrations, respectively. The band located at 1371 cm−1 is related to C-H asymmetrical deformations. In addition, the band observed at 1164 cm−1 is assigned to the C-O-C pyranose ring skeletal vibration, while the band located at 894 cm−1 is related to the β-glycosidic linkage vibration between the anhydroglucose units in cellulose [58]. The FT-IR spectrum of V2O5 exhibited three absorption bands at 1025, 832, and around 582–482 cm−1, which are in good agreement with the orthorhombic V2O5 [59]. The FT-IR spectra for S-VO2 and MCC/S-VO2 displayed a broad band in the region around 3200–3500 cm−1 and a sharp band in the region around 1500–1650 cm−1, due to the stretching and bending vibrations of OH groups, respectively, whereas the bands at 1124 cm−1 and 1113 cm−1 for S-VO2 and MCC/S-VO2, respectively, may be attributed to sulfur adsorbed to the VO2 surface [40]. The bands at 1030 and 1056 cm−1 for MCC/S-VO2 and S-VO2, respectively, are assigned to O=V=O stretching vibration [40]. The initial sharp vibrational band at 610 cm−1 for S-VO2 and 520 cm−1 for MCC/S-VO2 can be associated with the V–O–V octahedral bending modes of VO2 [60,61]. Additionally, the band at 710 cm−1 for MCC/S-VO2 is assigned to the coupled vibration of V=O [61]. The absence of V2O5 absorption bands indicated the formation of VO2 in the final product, whereas the bands at 2900, 1431, 1371, 1059, 1164, and 894 cm−1 indicated a homogenous distribution of S-VO2 between MCC microfibers.
Raman spectroscopy is a very robust tool distinguishing the different crystalline phases and the change in the surface structure. The Raman spectrum of MCC/S-VO2 is presented in Figure 3. The Raman scattering peaks appeared at 82, 153, 185, 217, 433, 471, 1419, and 1520 cm−1. The symmetry modes of the prepared sample belong to Ag and Bg, respectively. The peaks between 82 and 471 cm−1 are assigned to the sulfur S8 orthorhombic system [62]. The peaks at 1419 and 1520 cm−1 are assigned to the microcrystalline cellulose [63]. There are no peaks which can be observed for VO2. This observation can be attributed to the adsorption of some sulfur molecules on the surface of VO2.
Figure 4a displays the XPS survey for the MCC/S-VO2, which indicates the presence of C, O, S, and V elements. The C 1s peaks observed for MCC/S-VO2 are due to the existence of MCC in the structure. As shown in Figure 4b, the C 1s peak is split into three adjacent peaks for the MCC/S-VO2 product, corresponding to the chemical bonding in MCC. The first peak at 284.36 eV indicates a carbon linkage (C–C), the second peak at 286.1 eV corresponds to the carbon atom bonded to the hydroxyl group (C–OH), and the third peak at 287.6 eV relates to a carbon atom bound to an oxygen atom (C–O) of pyranose rings [64]. However, Figure 4c shows two different peaks at 529.9 and 532.4 eV corresponding to different oxygen atoms. The peak at 529.9 eV corresponds to the lattice oxygen of VO2 [65], and the peak at 532.4 eV is attributed to the oxygen of the hydroxyl group (C–OH) and (C–O–C) in MCC [66]. It can be observed that the S 2p XPS spectrum, Figure 4d, exhibits a singlet broad peak S 2p3/2 at 163.8 eV binding energy. This is slightly lower than the binding energy of the elemental sulfur (164 eV), which may be attributed to S doping in the form of a V–S bond, compared with vanadium sulfides, in which sulfur atoms are bonded to V and have their S 2p peak between 160.7 and 163.7 eV [67]. The XPS spectrum of V 2p is displayed in Figure 4e. The peaks at 517.08 and 515.53 eV could be ascribed to 2p3/2 binding energies of V5+ and V4+, respectively, while the peak at 524.15 eV is due to the binding energy of V4+ 2p1/2 [65,68]. Hence, the predominant oxidation state for VO2 was V4+, and the presence of V5+ might be a result of sample surface oxidation in air. These results, along with the XRD analysis (Figure 1), suggest V–S chemical bonding near the surface of S-VO2.
The morphology of the synthesized MCC, S-VO2, and MCC/S-VO2 products has been investigated utilizing an (FE-SEM), as shown in Figure 5a–c. The SEM micrograph of MCC, Figure 5a, reveals the nonuniform shape of micro-sized fibrils, which can be attributed to the degeneracy of fibrous strands to micro-sized crystallites during acid hydrolysis, which cleaved the amorphous part of the cellulose chain [58,69]. The FE-SEM image of the S-VO2, Figure 5b, displays the nanorod shape. Meanwhile, Figure 5c implies a homogenous combination of phases forming the MCC/S-VO2 composite. The elemental distribution in the MCC/S-VO2 nanostructure was clarified by EDX spectrum, Figure 5d. The spectrum confirms the purity of the prepared composite as well the presence of the vanadium and sulfur elements in the sample, whereas the other peaks are assigned to C and O, supporting the presence of MCC molecules in the as-prepared nanocomposite. Moreover, the microstructure of the MCC/S-VO2 nanocomposite was examined employing the HR-TEM technique, Figure 6. The HR-TEM image of the MCC/S-VO2 nanocomposite exhibited the irregular shapes of S-VO2 inorganic nanoparticles that were well-dispersed in the cellulose matrix. The sheet structure is due to the incorporation of MCC with the S-VO2 system under the applied experimental condition.
Thermogravimetric analysis (TG/DTG/DSC) was carried out to study the thermal stability of the synthesized MCC/S-VO2 nanocomposite, as displayed in Figure 7. The TG curve revealed three decomposition steps. The first weight loss of 30% in the temperature range of 120–260 °C corresponded to the loss of the adsorbed water molecules and semi-degradation of cellulosic components, which started at 120 °C and lasted up to 380 °C [70]. The second step was a sharp weight loss of 30% in the temperature range of 265 °C up to 324 °C due to the continuous loss of organic cellulose. The third step was at a temperature range of 325–500 °C, with a weight loss of 6.23% due to the loss of sulfur molecules [71]. Continuous rising temperature displayed a slow slope after 500 °C with no precise ending, and this could be attributed to the subsequent oxidation of V4+ into V5+. The DTG curve showed two peaks; the first one is due to the water loss, while the second peak is due to the decomposition of MCC. The DSC curve displayed two exothermic broad peaks from 200 to 280 °C and from 300 to 350 °C. These peaks can be attributed to the VO2 phase transition [72].
The UV-Vis DRS was carried out in the range of 200–800 nm to inspect the optical absorption properties of the as-prepared samples. The absorption spectra of MCC, V2O5, S-VO2, and MCC/S-VO2 products are depicted in Figure 8a. Pure MCC and V2O5 displayed maximum absorption bands at about 200 and 298 nm, respectively. S-VO2 showed a maximum absorption band at 437 nm, which is a marked red shift compared with that of pure V2O5. This red shift is probably due to the interaction of S 2p with O 2p and V 2p electronic states of VO2, which resulted in the band gap decreasing. The MCC/S-VO2 nanocomposite exhibited an absorption band at around 290 nm. The band gap energy (Eg) of the as-prepared products was derived according to Equation (4) [73].
α h ν = A h v E g n 2
where α is the absorption coefficient, h is the Planck constant, A is a constant, ν is the frequency, Eg is the absorption band gap energy, and n is one or four for a direct and indirect band gap, respectively [74,75]. Plots of (αhν)2 versus hν are shown in Figure 8b. The band gaps of V2O5, S-VO2, and MCC/S-VO2 were estimated to be 2.3, 2.1, and 2.29 eV, respectively. These are consistent with the results shown in Figure 8a, while the MCC product showed an indirect band gap Eg of 4.85 eV. The addition of sulfur plays a key role in charge transfer between the VB and CB band [76], which results in reducing the band gap of VO2, compared with 4.8 eV, which is given elsewhere [77].

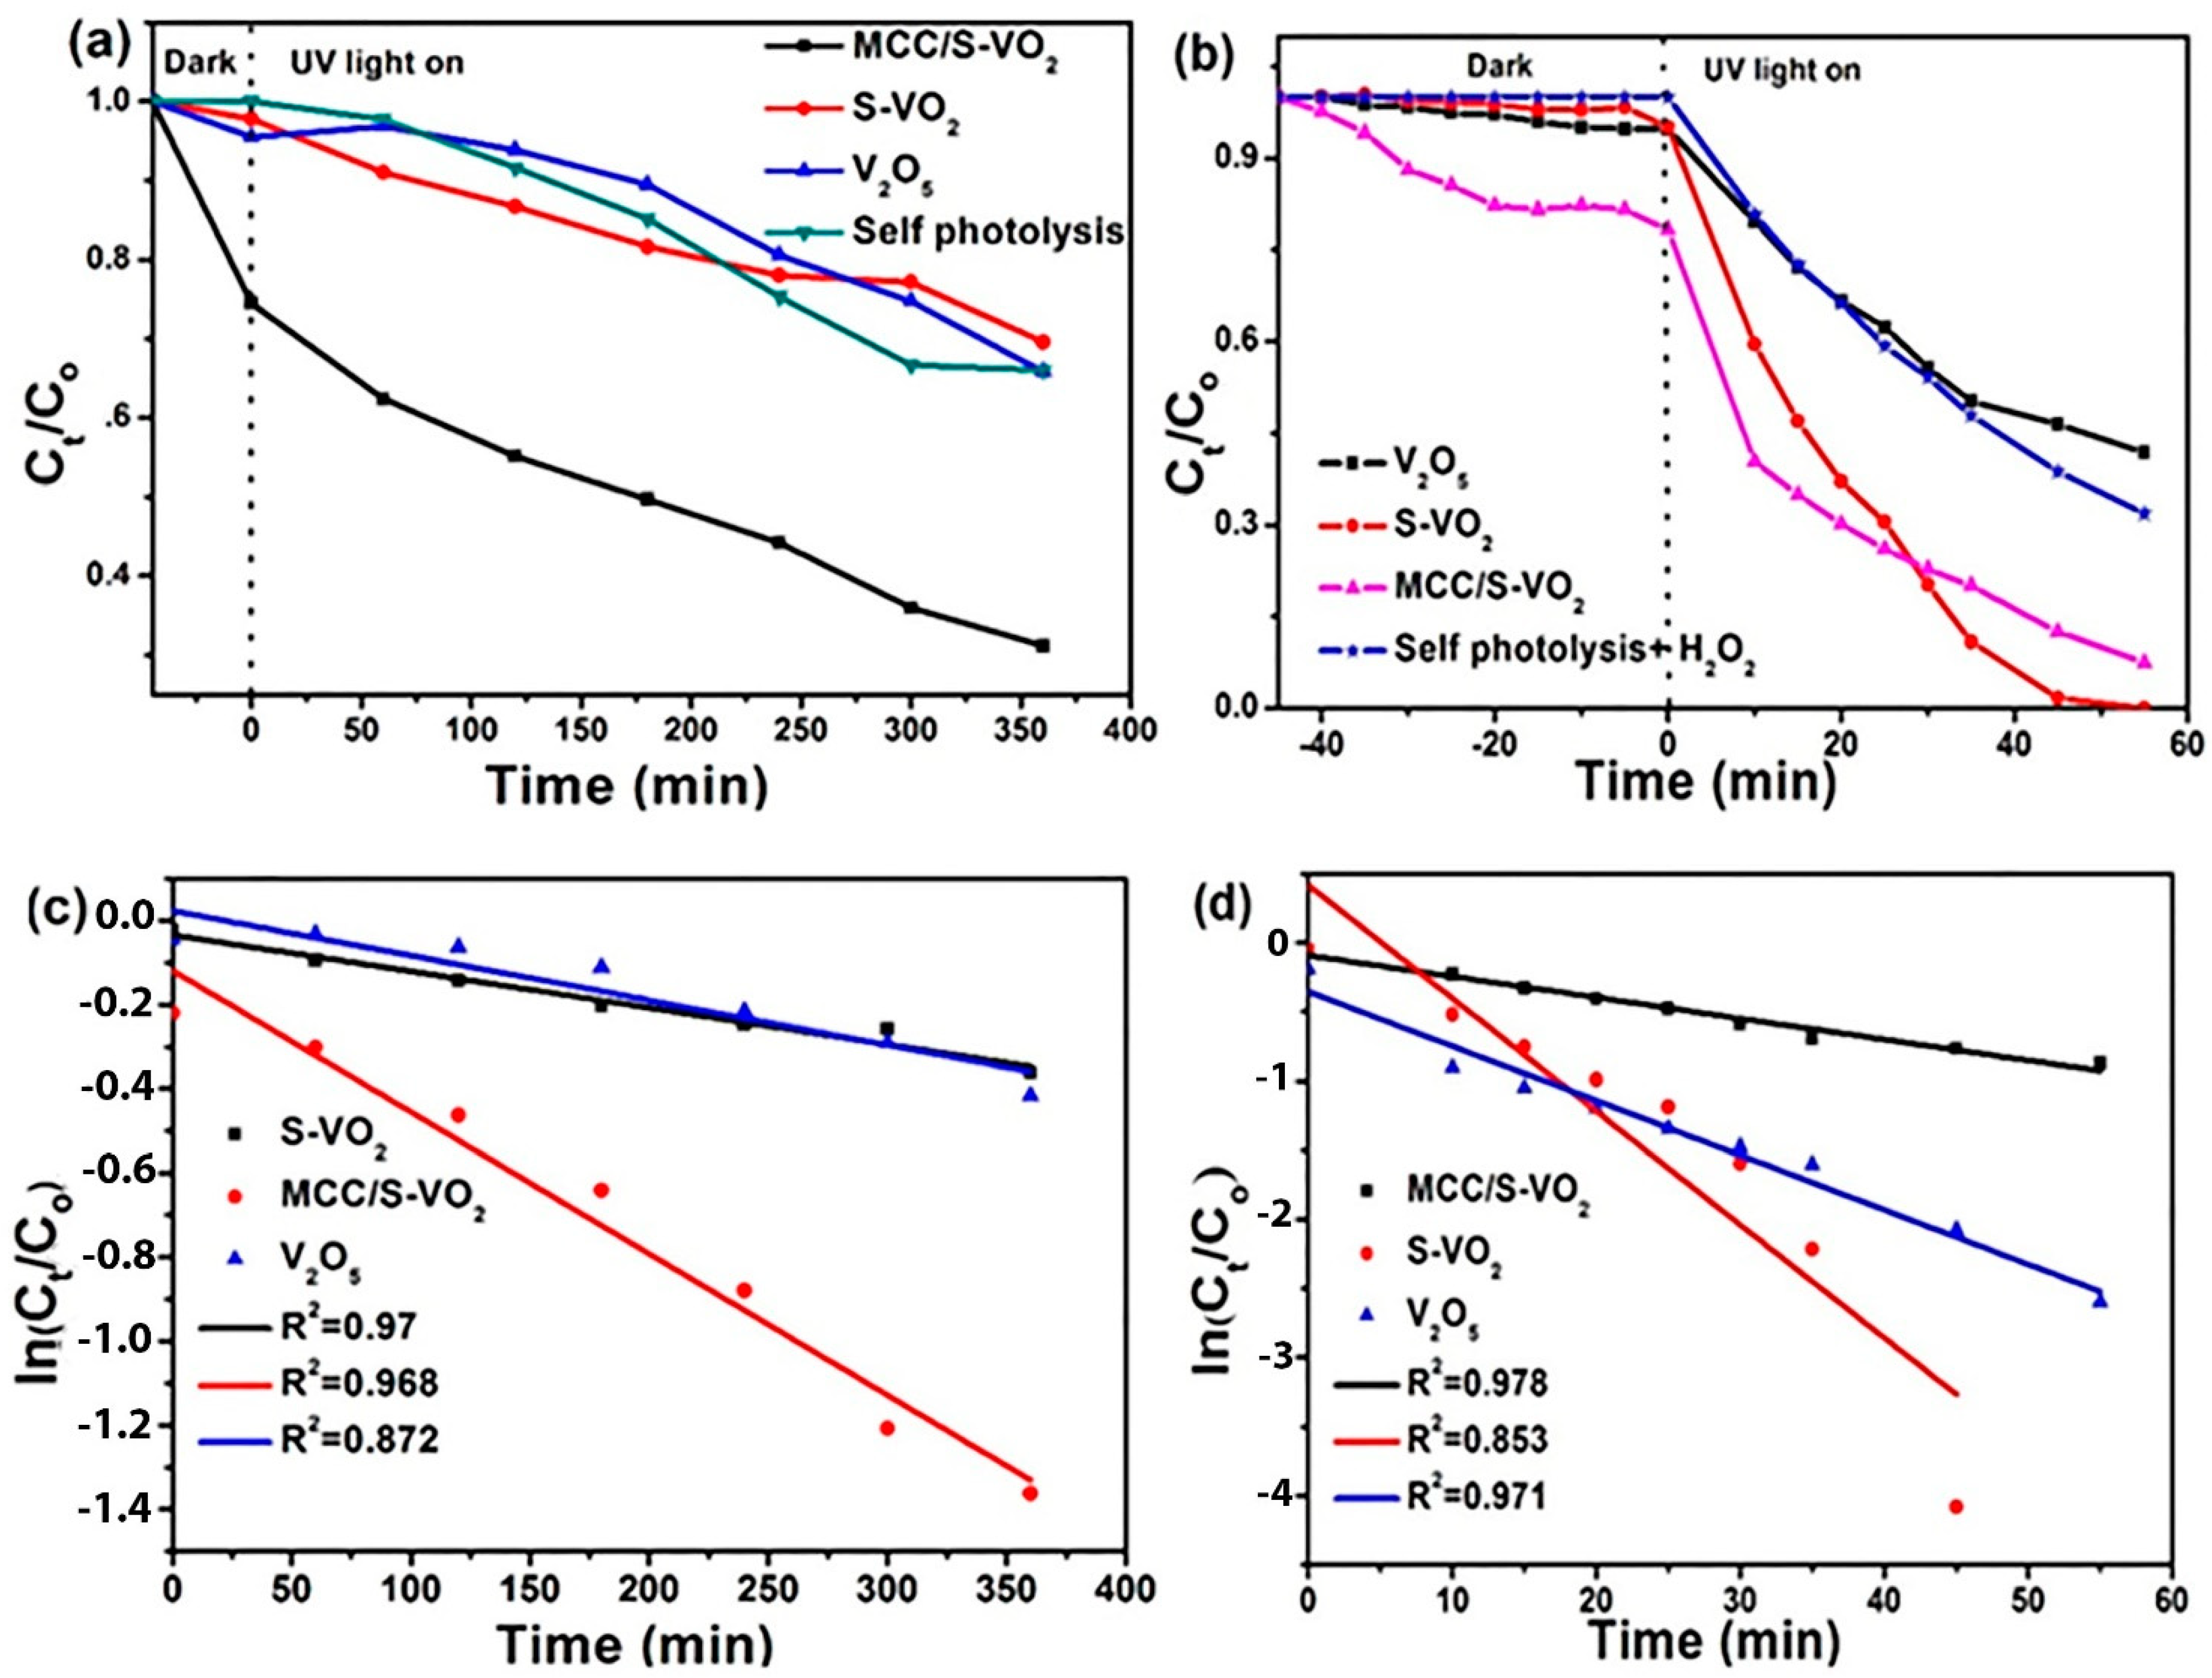
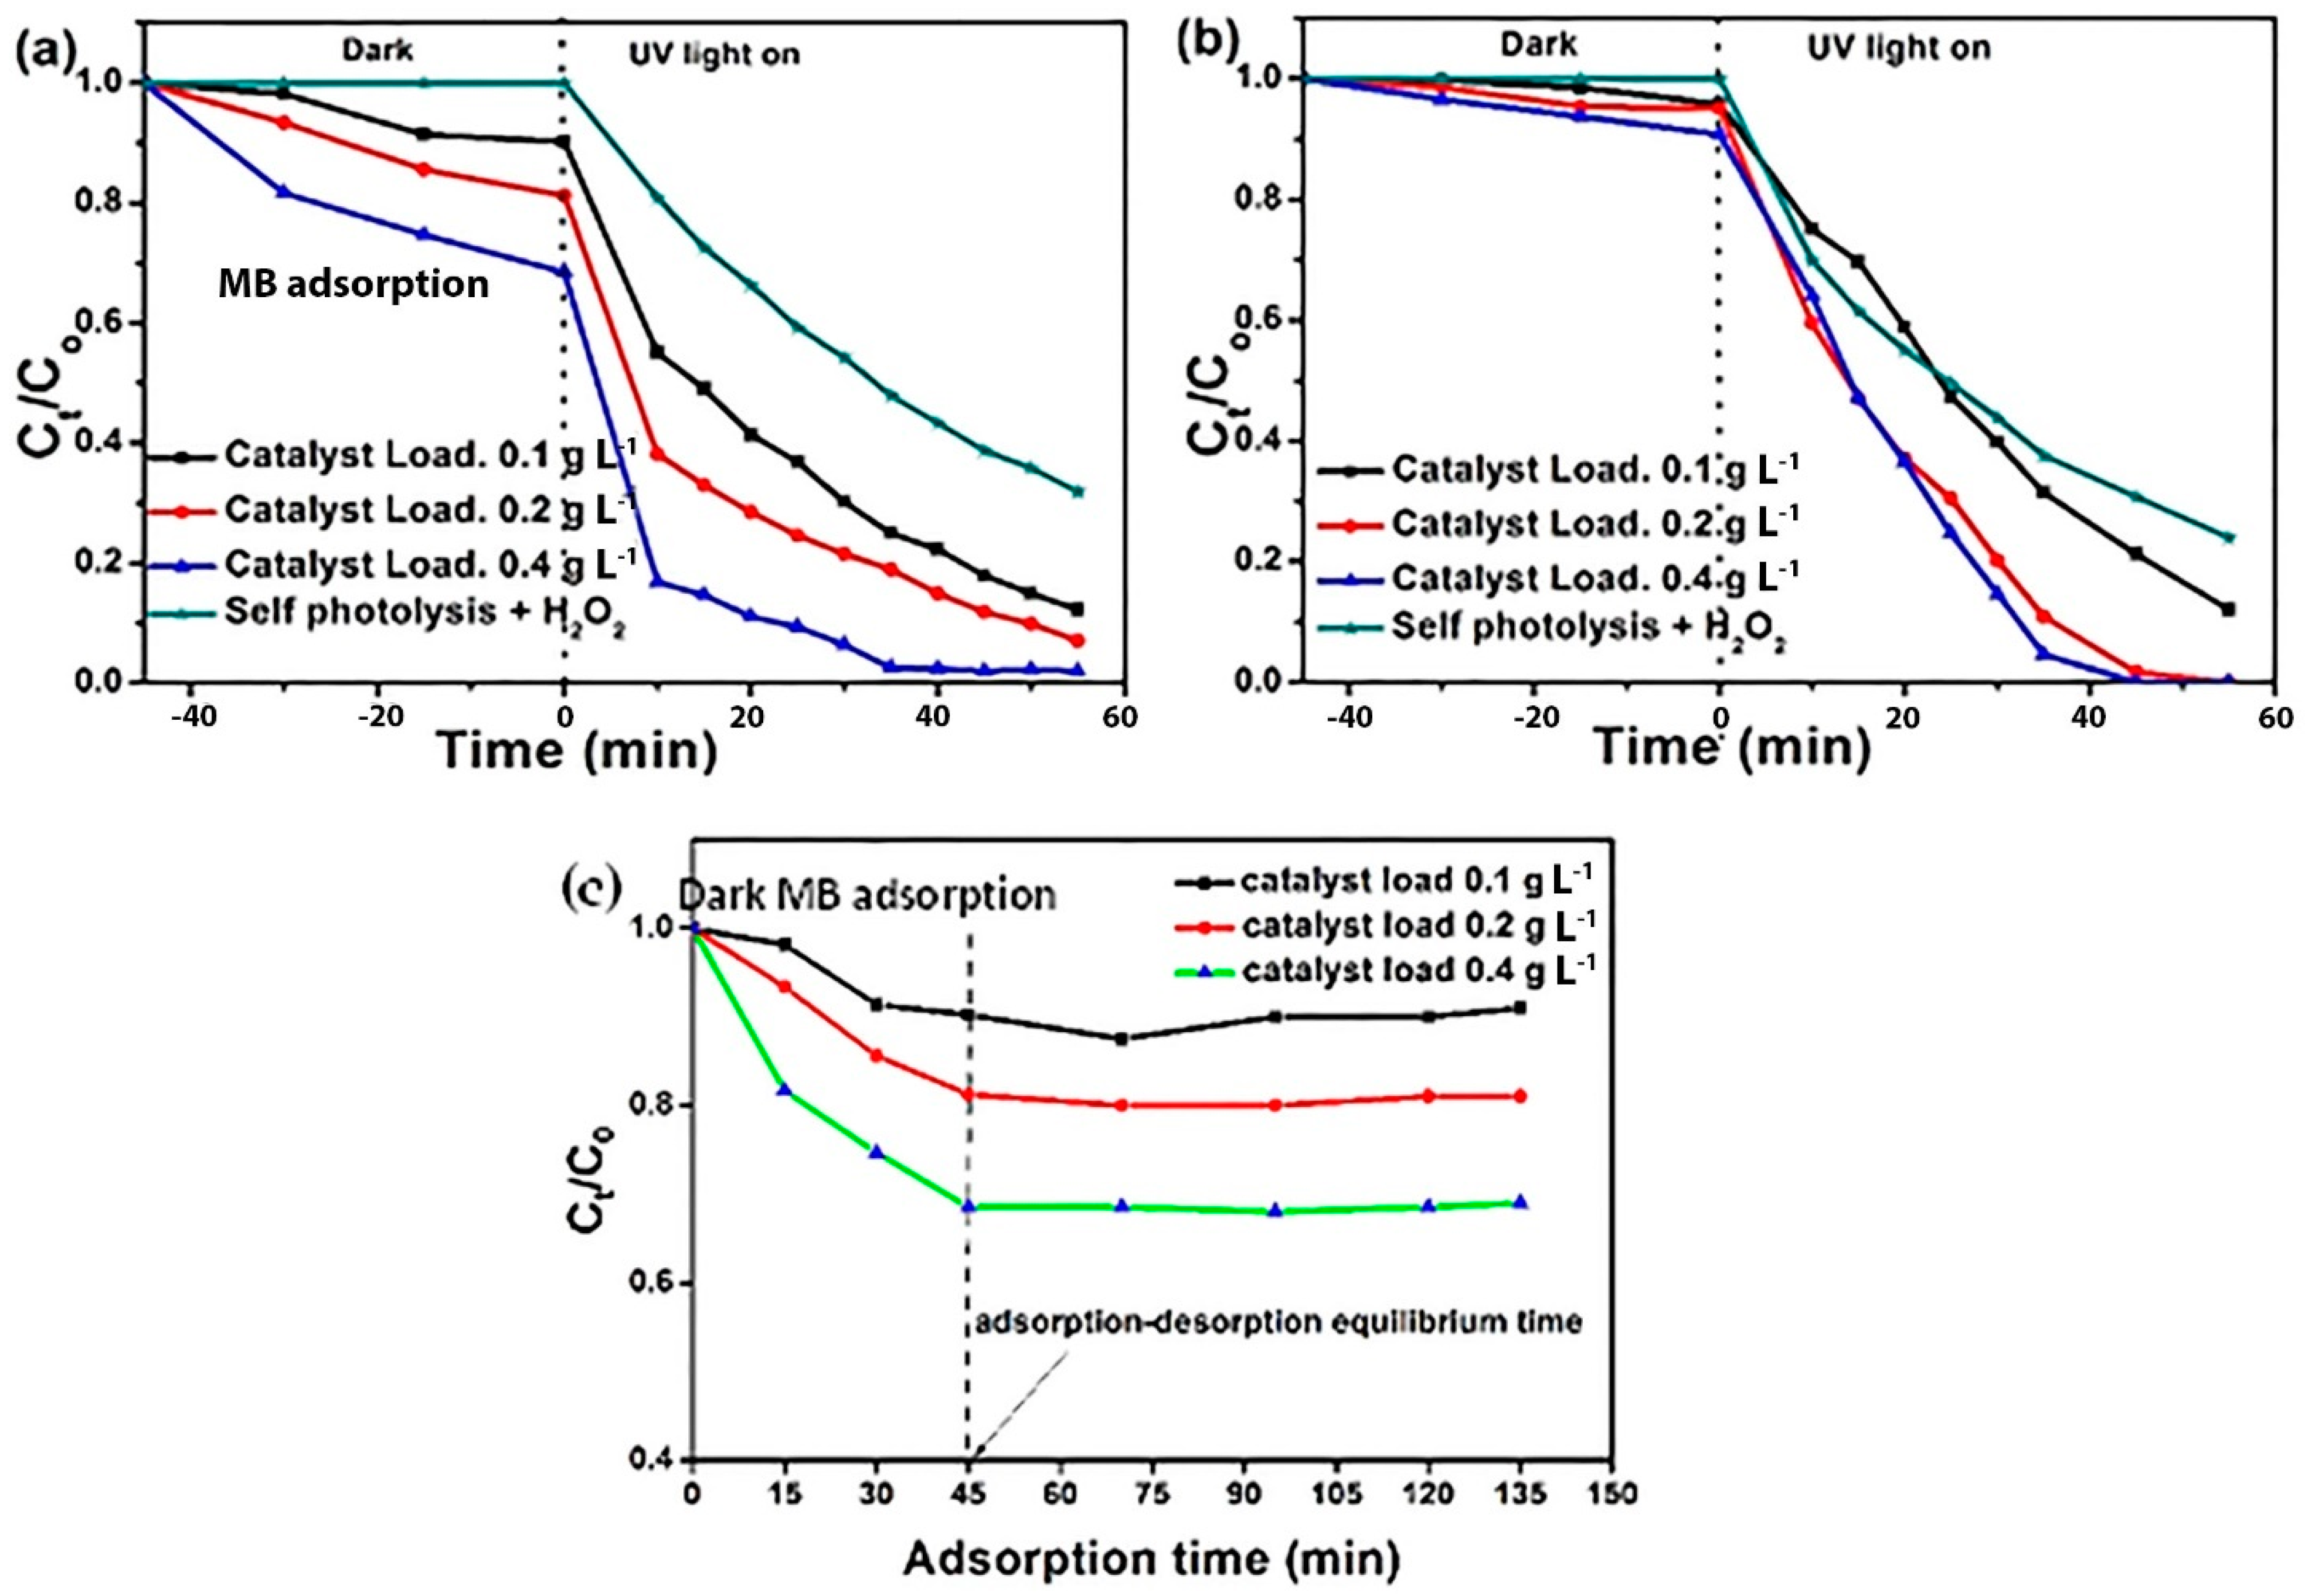
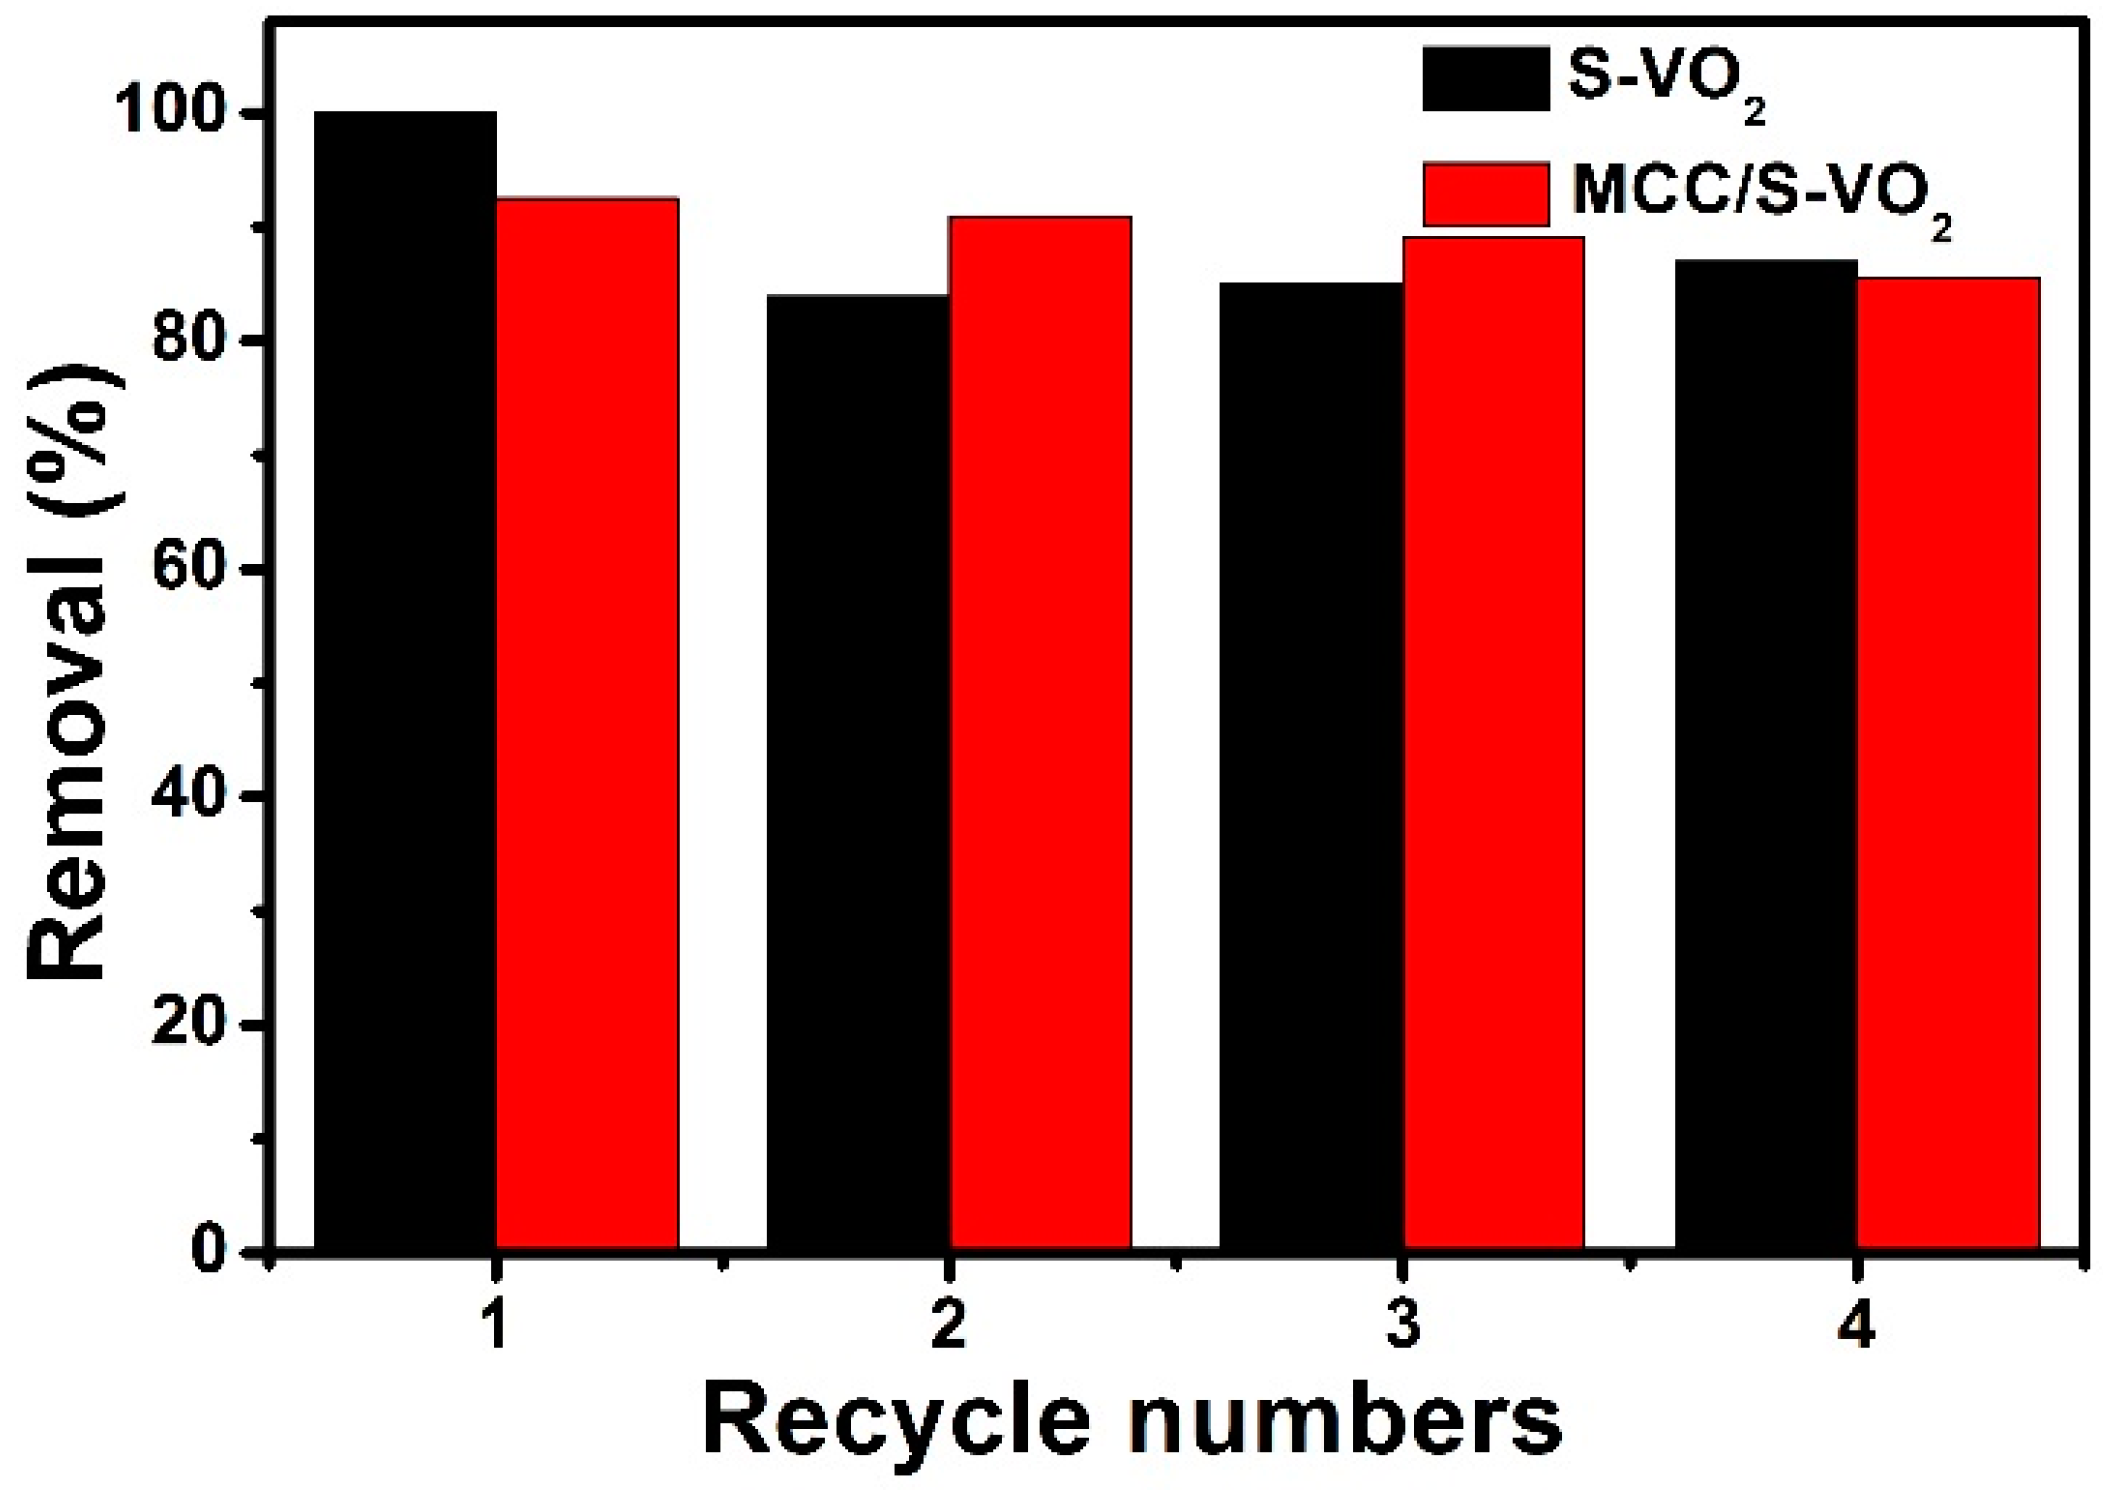
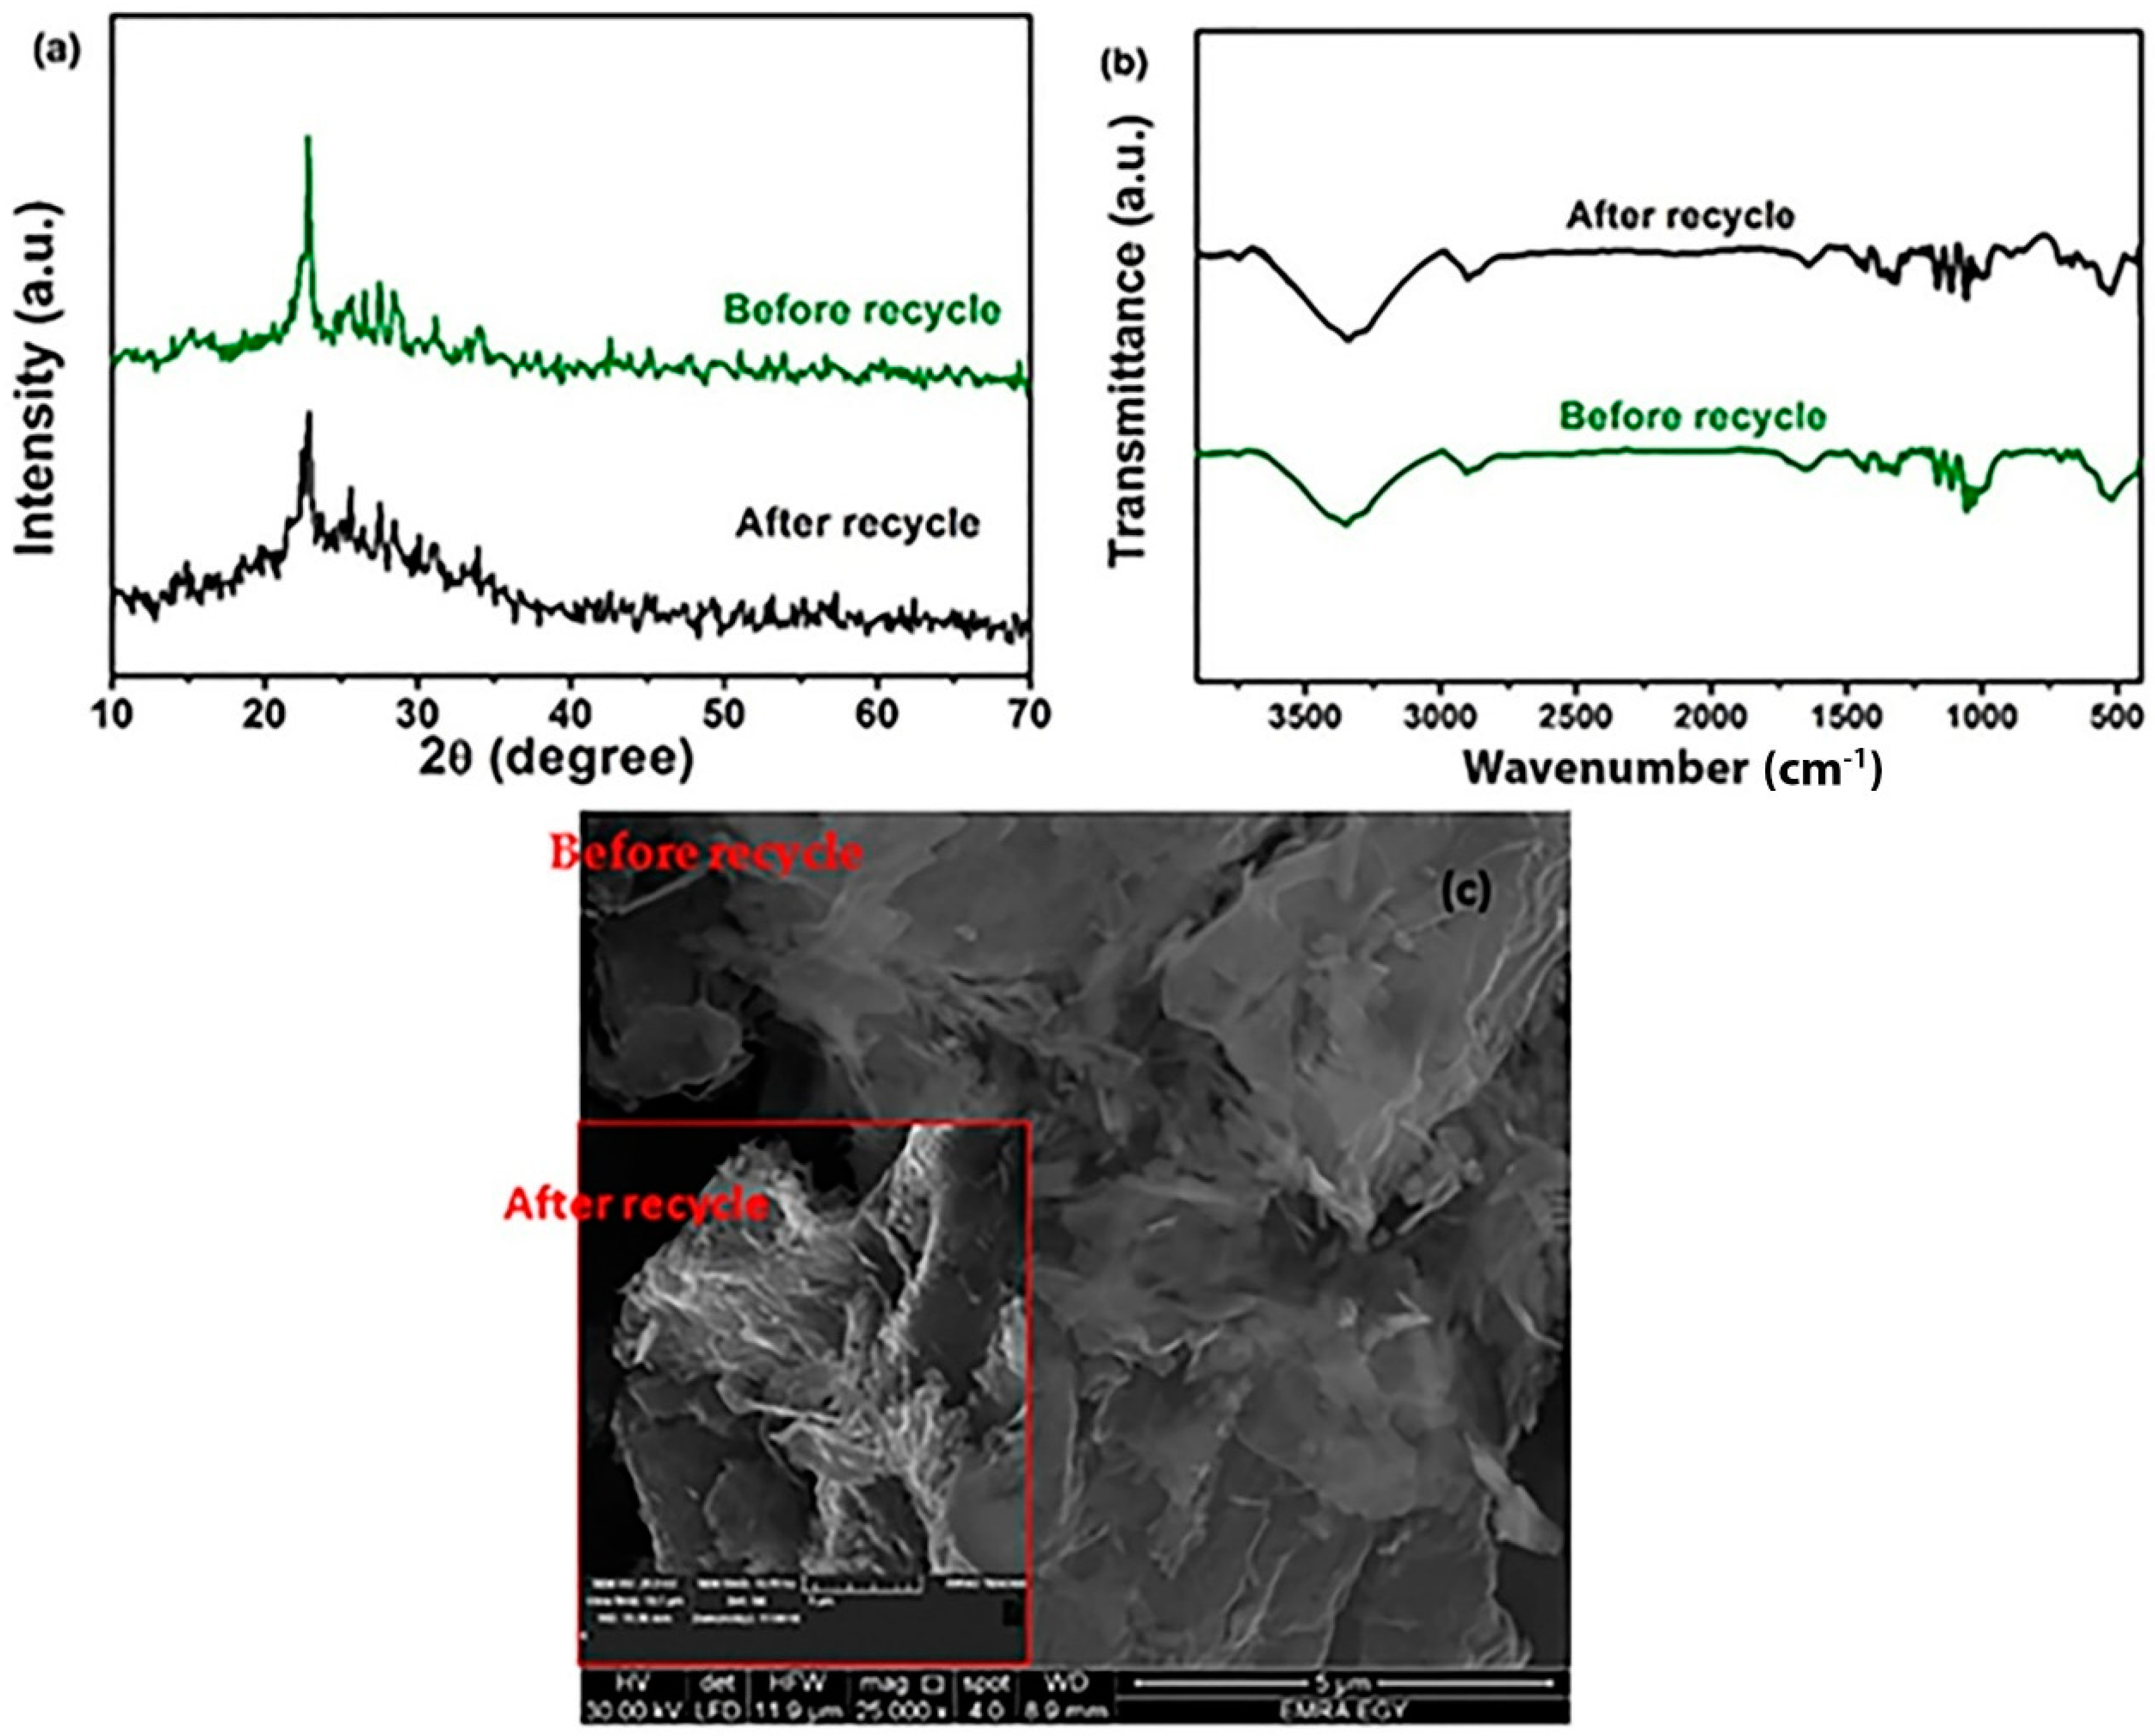
3.2. Photocatalytic Activity

The photocatalytic performance of the as-prepared catalysts (S-VO2 and MCC/S-VO2), as well as V2O5, was evaluated by photodegradation of the MB solution in the presence and absence of H2O2 under the experimental conditions: 20 mg of photocatalyst and 100 mL of MB solution of 20 mg L−1 concentration. The degradation ratio (Ct/Co) with and without H2O2 is given in Figure 9a,b. Both V2O5 and S-VO2 manifested poor adsorption capacity and photodegradation percentage compared with those of MCC/S-VO2. The photocatalytic performance of the MCC/S-VO2 nanocomposite in the absence of H2O2 showed a photocatalytic efficiency of ~ 72.3% within 360 min. The addition of 0.05 mL H2O2 (50% wt.) brought about a dramatic increase in the photodegradation of MB dye, which reached 92.5%, 100%, and 60.3% for MCC/S-VO2, S-VO2, and V2O5, respectively. In addition, the degradation time reduced from 360 min to 55 min, clarifying the significant role played by H2O2 in the photocatalytic process. The kinetic studies showed that the pseudo-first-order kinetic model was the best-fitting model that described the photocatalytic degradation of MB dye using S-VO2 or MCC/S-VO2 catalysts, regardless of the presence or absence of H2O2, as shown in Figure 9c,d. The kinetic parameters are given in Table 2. As seen in Table 2, the rate constant (kobs) values were greatly increased in a combined system (photocatalyst + H2O2).
In addition, the effect of the photocatalyst dose on the photocatalytic efficiency was studied. The results (Figure 10) revealed that the photocatalytic efficiency was significantly affected by the variation of catalyst loadings [4]. Accordingly, three different catalyst doses—0.1, 0.2, and 0.4 g L−1—of S-VO2 and MCC/S-VO2 were examined. The results exhibited that the degradation performance is directly proportional to the loading percentages of ca. 100% and 98% dye removal for S-VO2 and MCC/S-VO2, respectively, at 0.4 g L−1. This could be explained as follows: more active sites were found on the photocatalyst surface when the photocatalyst dosage was raised, and the efficiency of the photo generation of holes and electrons was higher. These factors were contributory in accelerating the photocatalytic degradation reactions [78]. A comparison of the degradation efficiency for different photocatalysts in terms of MB degradation under UV and visible light irradiation is clearly listed in Table 3. This comparison indicated the superiority of the photocatalytic efficiency and low cost of the as-prepared photocatalysts, S-VO2 and MCC/S-VO2, compared with the reported ones.
The recycling numbers of the as-prepared photocatalysts reuse were inspected under UV light and H2O2. After four cycles, the MB removal percentage decreased from 92.5 to 85.5% and from 100 to 87% for MCC/S-VO2 and S-VO2, respectively, as shown in Figure 11. The extrapolation of the linear relationship of the photocatalytic efficiency implies that the degradation will decrease to 50% after 20 cycles, indicating durability and good cycle performance of the solid phase. This result can also be confirmed by the XRD, FE-SEM, and FT-IR characterizations of MCC/S-VO2, before and after recycling, which are clarified in Figure 12. Figure 12 reveals no change in the crystal phase after reusing the photocatalyst in a posterior cycle for MB photodegradation under the same photocatalysis conditions, indicating the higher stability of the MCC/S-VO2 solid phase.

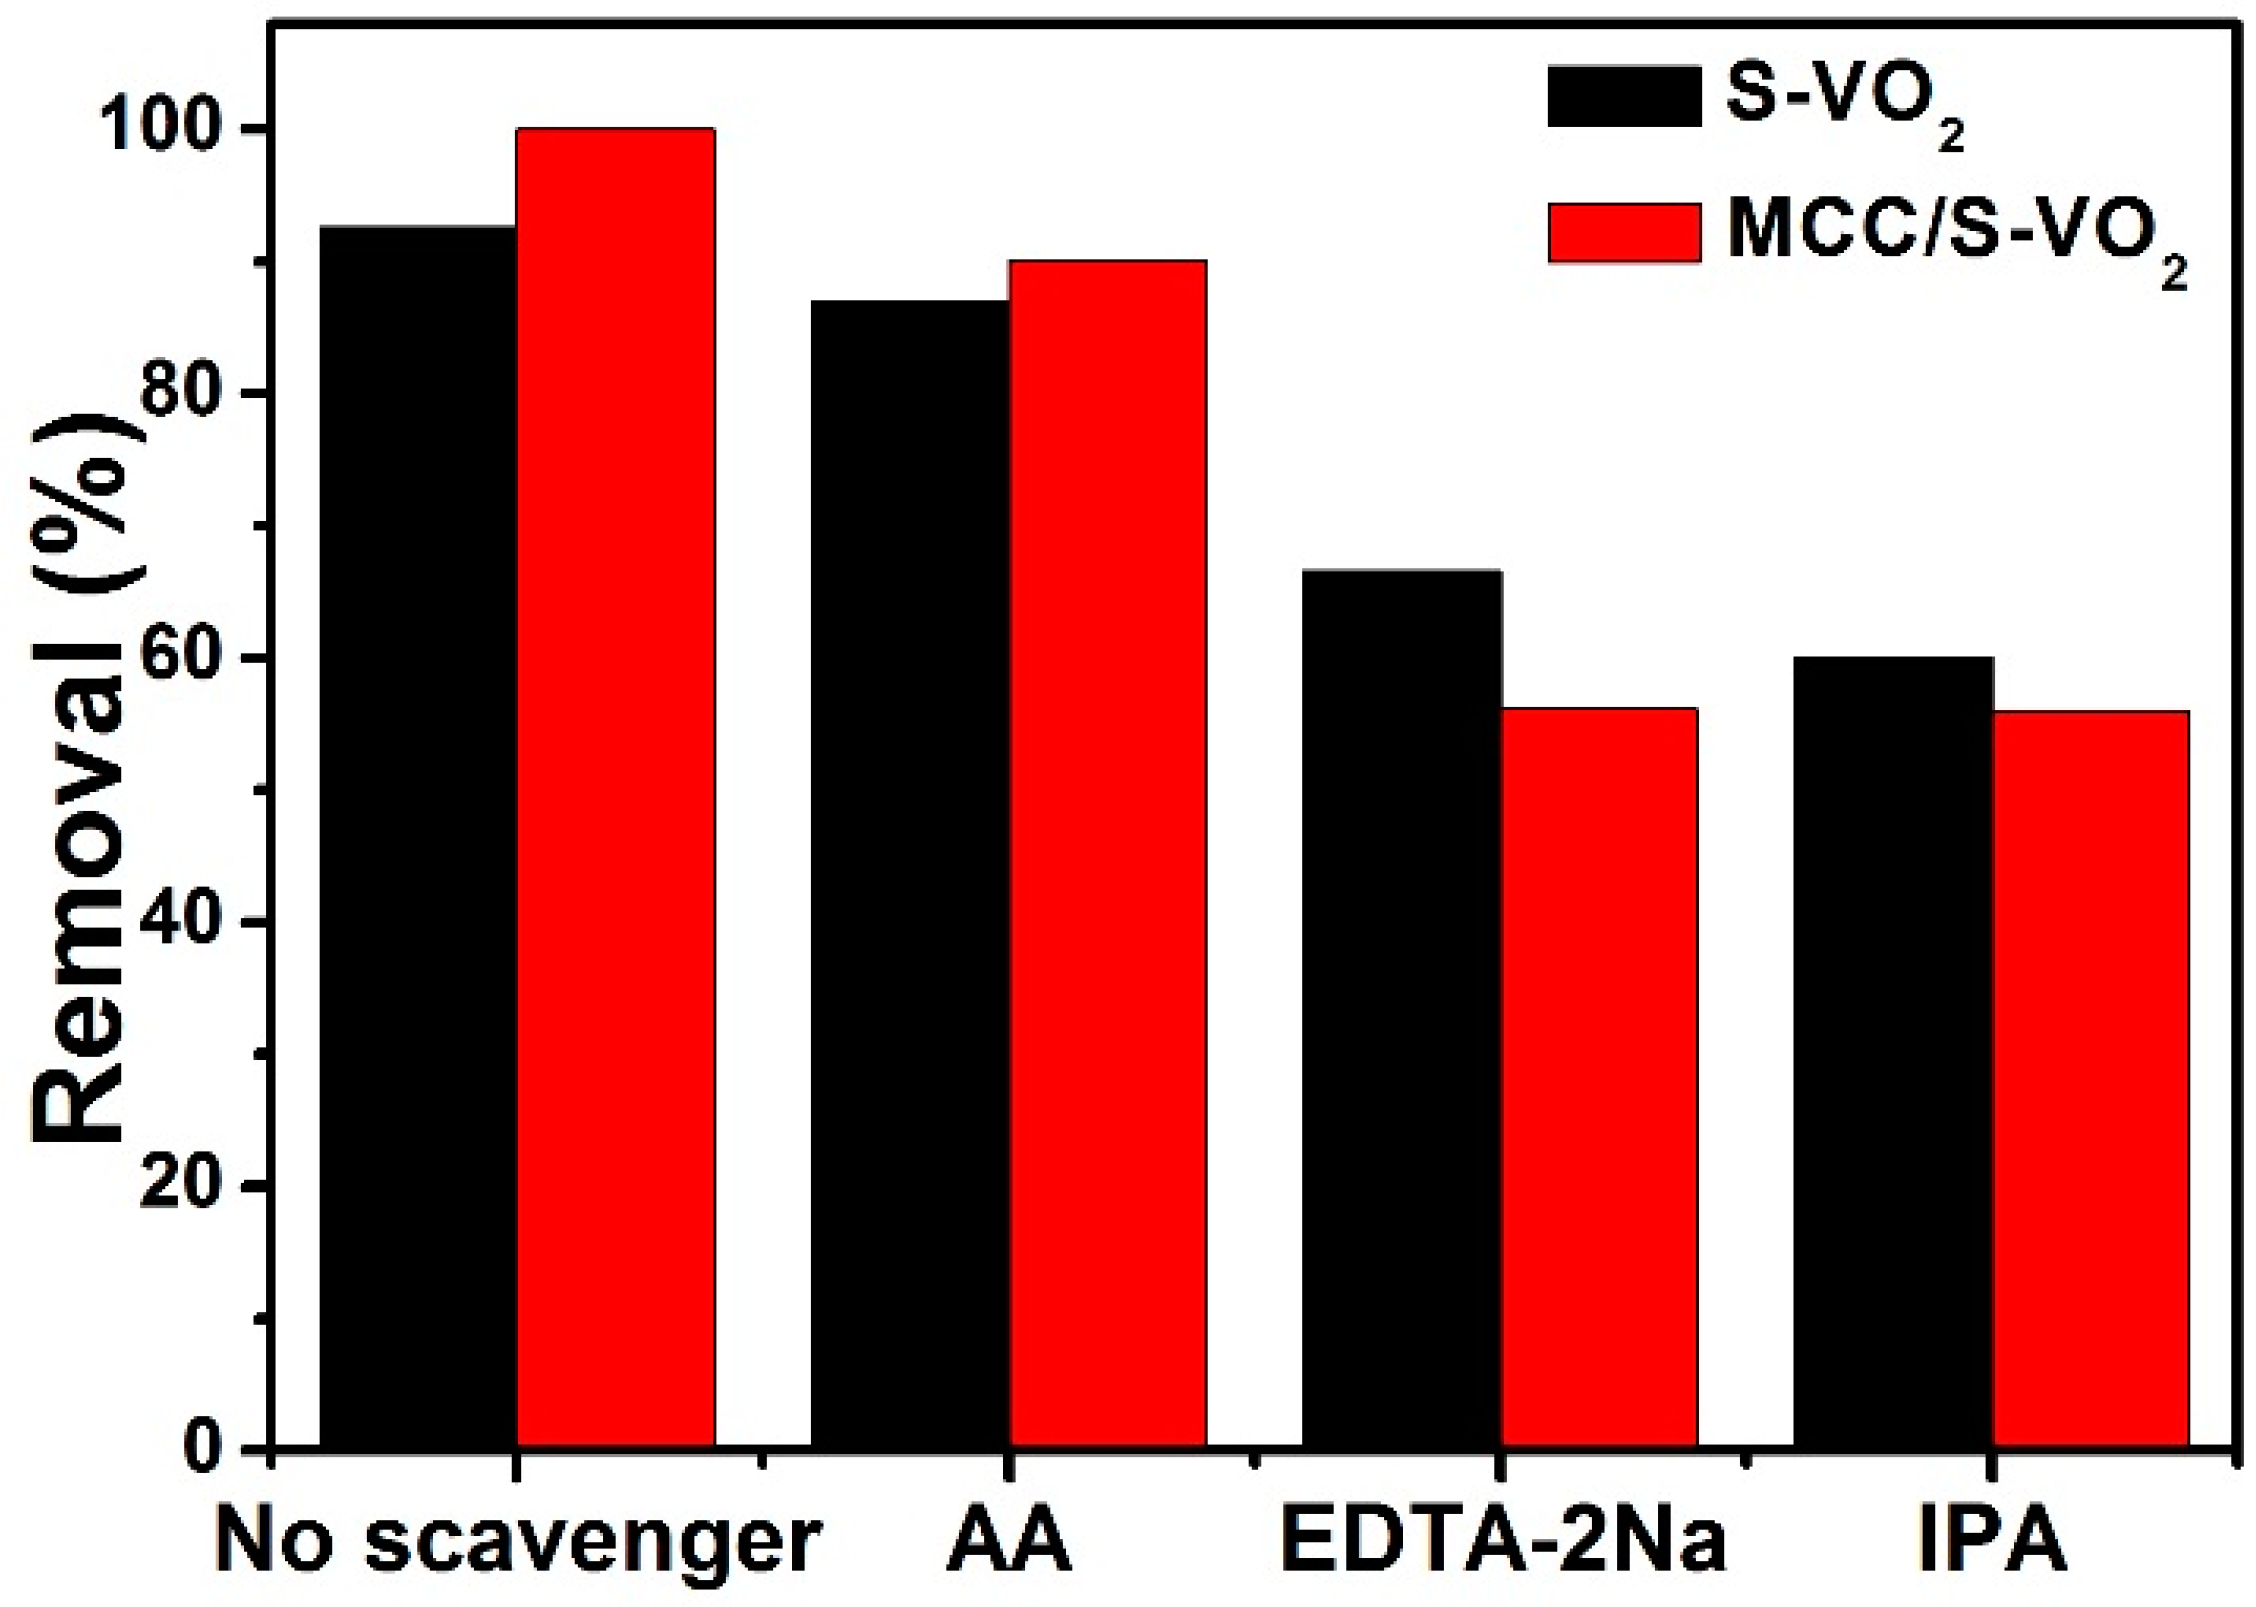
3.3. Active Species Scavenging

The role of the active species (superoxide radicals (O2), positive holes (h+), and hydroxyl radicals (OH)) was determined through the variation of catalytic removal of the MB after the scavengers were added into the photocatalytic system. Figure 13 shows the variance of MB removal before and after addition of the scavengers to the photocatalytic system. When AA was added into the system of MB with (MCC/S-VO2 + H2O2), the degradation efficiency was almost the same without AA addition; this indicates that superoxide radicals have no role in MB degradation. Degradation of MB drastically decreased from 92.5% to 60% and 66% with the addition of IPA and EDTA-2Na, respectively, within 55 min. From these results, we can suggest that hydroxyl radical (OH) and positive holes (h+) were the major active species through the photocatalytic process. Additionally, for the system of MB with (S-VO2 + H2O2), hydroxyl radical (OH) and positive holes (h+) were primarily responsible for MB degradation.

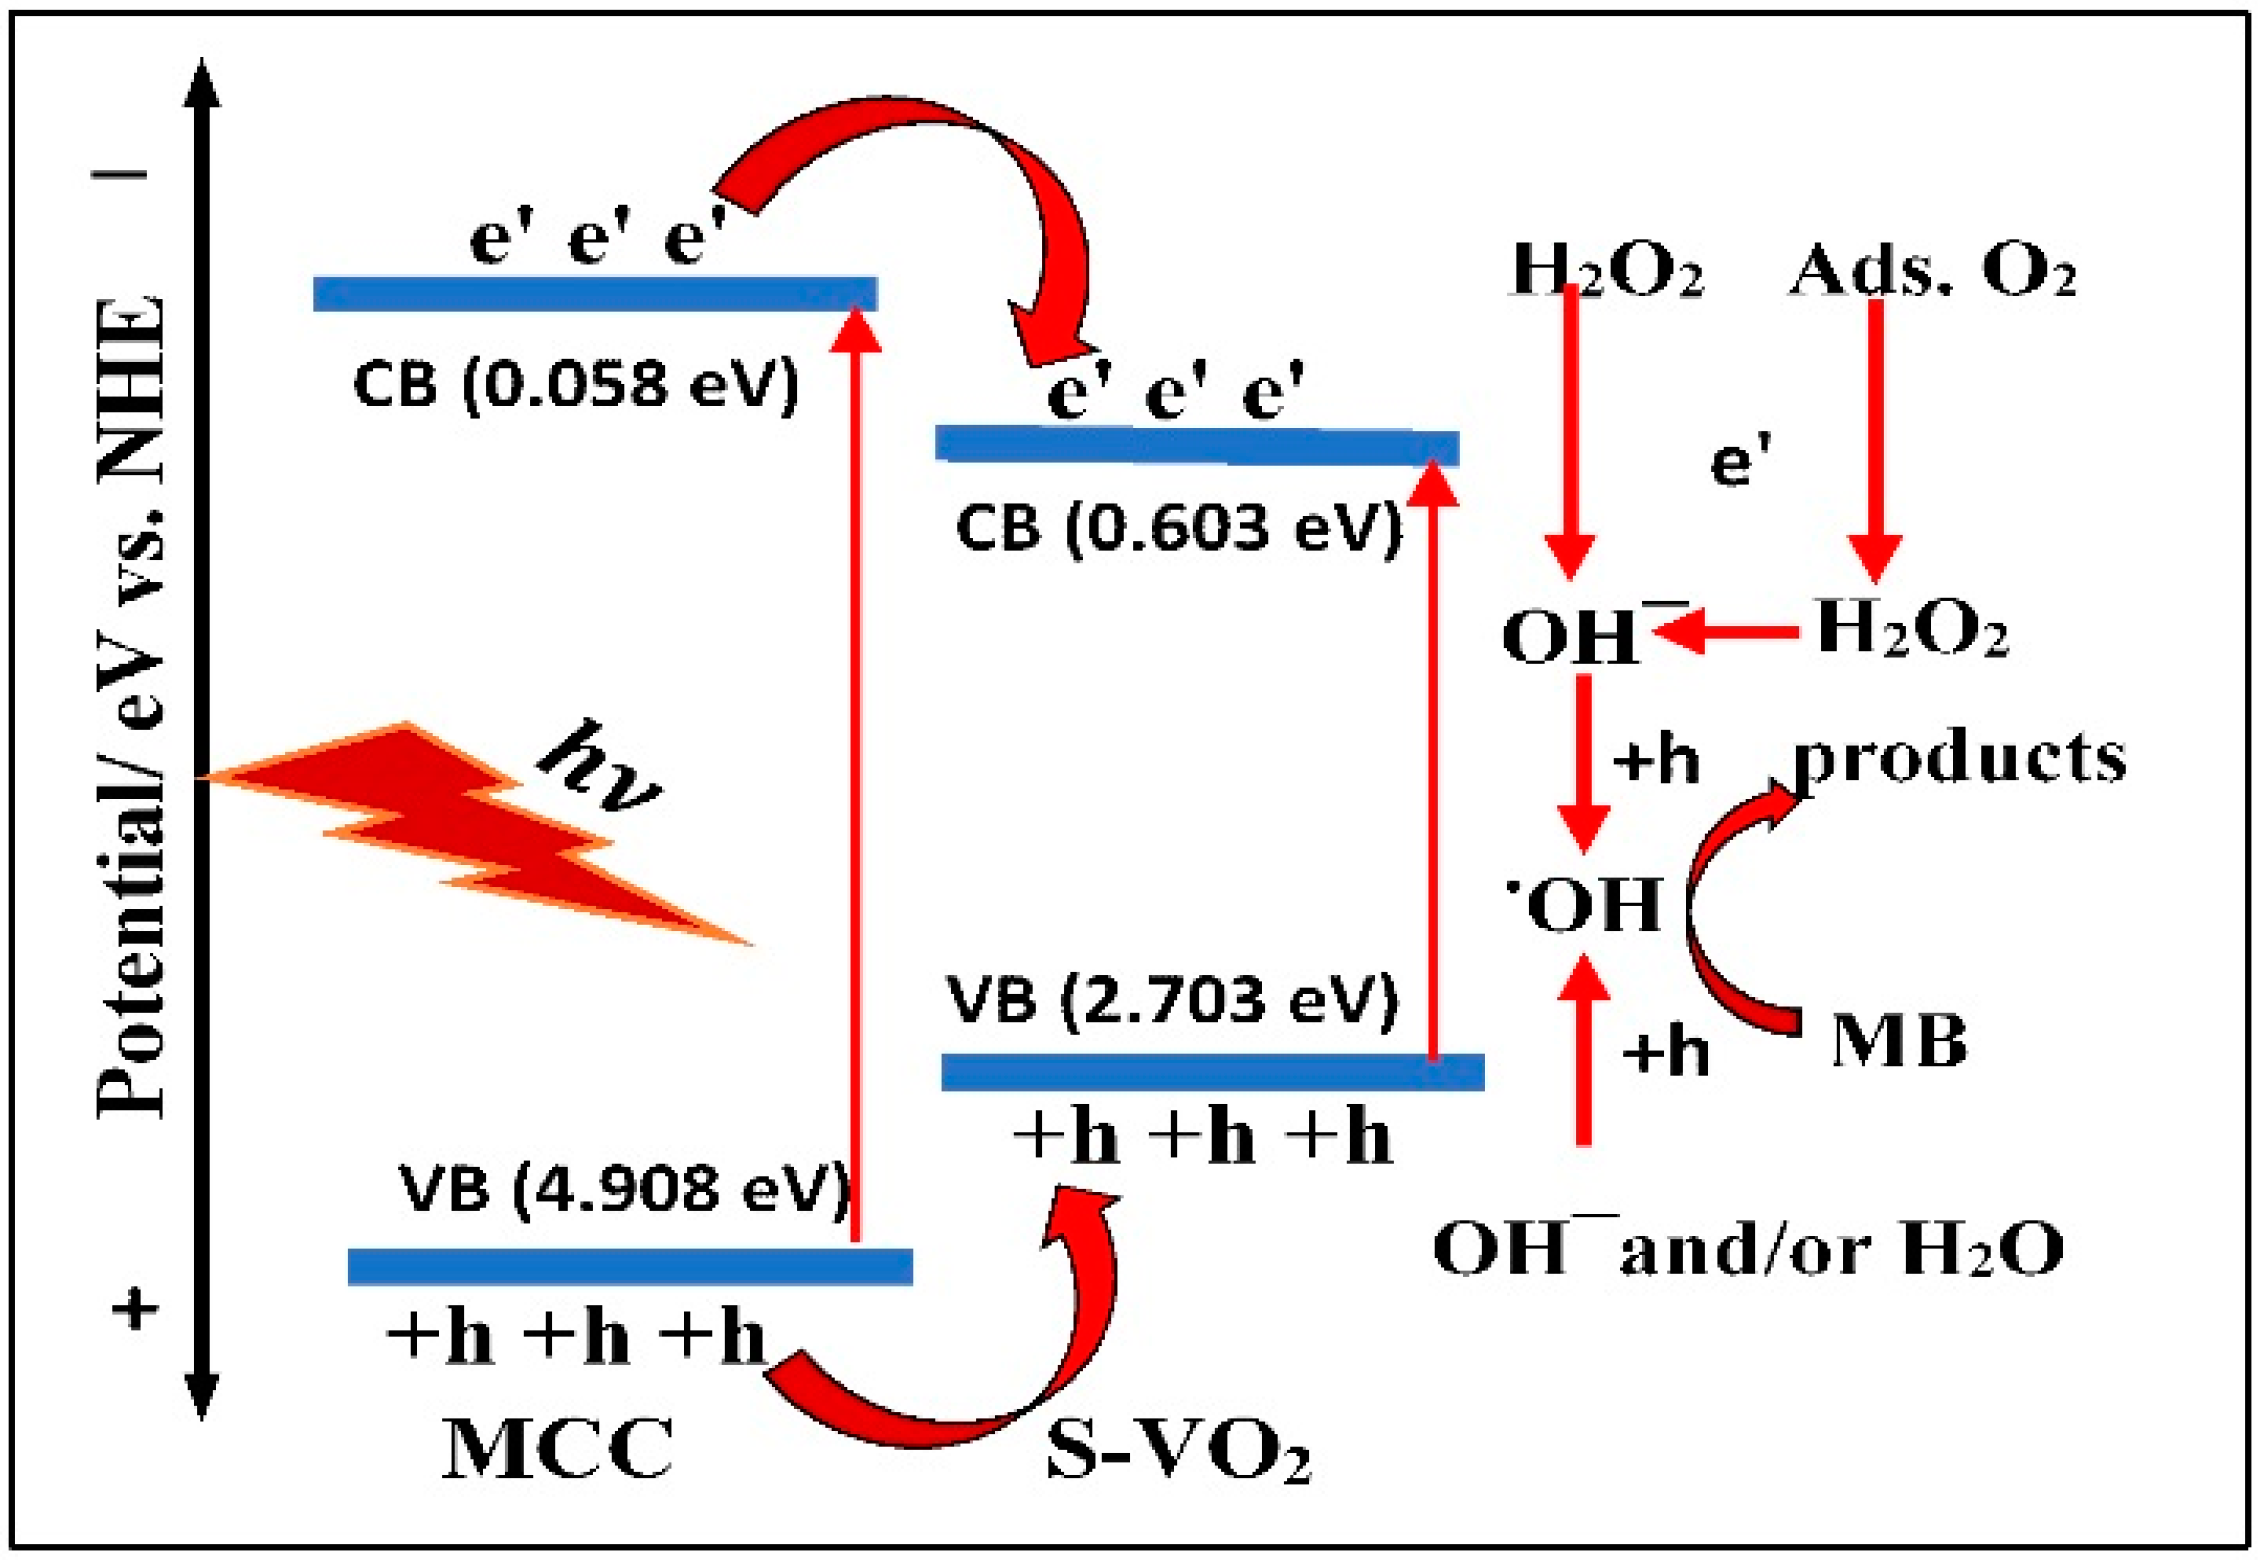
3.4. Proposed MB Photodegradation Mechanism

The degradation of MB utilizing S-VO2 or MCC/S-VO2 nanocomposites under UV light was enhanced in the presence of H2O2. The enhancement of photocatalytic activity is attributed to the hydroxyl radicals generated from the scavenging of electrons by H2O2 [83]. The conduction band (CB) and valence band (VB) positions were calculated employing Equation (5) [84,85] for MCC, S-VO2, and MCC/S-VO2, and are given in Table 4.
E C B = x E e 0.5   E g
E V B = E C B + E g
where x is the absolute electronegativity, E is the energy of free electrons on the hydrogen scale (4.5 eV), E g is the band gap energy, and E C B and E V B are the energies of the conduction band and valence band, respectively. The calculated values of E g based on the obtained data from the UV-Vis diffuse reflectance spectra (Figure 8) for MCC, S-VO2, and MCC/S-VO2, the absolute electronegativity, and estimated VB and CB energies for MCC, S-VO2, and MCC/S-VO2, are reported in Table 4.
Generally, in the photocatalytic mechanism, the valence band electrons convey to the conduction band under UV irradiation, creating holes in the valance band. These electrons may be scavenged by adjacent oxygen and/or H2O2 to form superoxide anion radicals (O2) or hydroxyl radicals (OH). Likewise, the created holes in the valence band may oxidize H2O and/or OH producing (OH) radicals. These radicals are responsible for the photocatalytic degradation under UV irradiation. Based on the calculated potentials of CBs and VBs for phases forming the MCC/S-VO2 composite (Table 4), a schematic mechanism of photocatalytic degradation of MB with MCC/S-VO2 was proposed (Figure 14). As shown in Figure 14, oxidation of OH to OH radicals takes place in the VBs of S-VO2 and MCC due to the greater positivity of their potentials than (E0 OH/•OH = 2.38 eV); however, oxidation of H2O to OH radicals only takes place in the VB of MCC owing to the greater positivity of its potential than (E0 H2O/•OH = 2.72 eV), Table 4. The CBs energies of S-VO2 and MCC are more positive than (E0 O2/•O2 = −0.33 eV), suggesting that a reduction reaction of O2 to O2 cannot occur. The reduction of H2O2 to OH takes place in the CBs of S-VO2 and MCC, producing OH radicals as a final product, because the potential of CBs of S-VO2 and MCC is more negative than (E0 H2O2/OH = 0.88 eV), Table 4. Additionally, the reduction of the adsorbed molecular oxygen takes place and forms H2O2 in the CBs of S-VO2 and MCC because the potential of CBs of S-VO2/MCC is more negative than (E0 adsO2/H2O2 = 0.695 eV). Due to the potential difference between VBs and CBs of phases forming the MCC/S-VO2 composite, electrons and holes are gathered on the CB and VB of S-VO2 and the electrons trapped by H2O2, resulting in the efficient separation of charge carriers. Finally, the OH radicals attack the MB molecules to form CO2 and H2O. This approach is consistent with the scavenging experiments’ results, elaborating that the hydroxyl radicals and positive holes were the key active species of MB photocatalytic degradation.

4. Conclusions

In this work, we successfully synthesized VO2 nanorods doped with sulfur and S-VO2 with MCC-supported matrix composites by a simple hydrothermal route. The prepared materials were characterized by XRD, FT-IR, Raman analysis, XPS, FE-SEM, EDX, TEM, DRS, and thermal analysis. The results indicated the formation of V4+ as VO2 with doped sulfur and the fine dispersion of S-VO2 through the MCC matrix. The kinetic analysis of the photocatalytic process showed efficient degradation of methylene blue by S-VO2 and MCC/S-VO2 within H2O2 and followed the pseudo-first-order kinetic model. The recycling experiments demonstrated that the photocatalytic efficiency exhibited a slight decline over four cycles, and the extrapolation calculation implied that degradation would decrease to 50% for 20 cycles. Positive holes and hydroxyl radicals were found to be the main active species during the photocatalytic process. The calculated band gap, along with the calculated potentials of CB and VB for MCC/S-VO2, supported the proposed photocatalytic degradation mechanism. This work indicated the ability to use the hydrothermal route to prepare nanocomposite particles.

Author Contributions

Ideas, M.Y.N. and H.M.A.; oversight and leadership responsibility for the research activity planning and execution, M.Y.N. and H.M.A.; verification, M.Y.N. and H.M.A.; visualization/data presentation, M.Y.N., I.M.I., M.S.N. and H.M.A.; computational, M.Y.N. and M.S.N.; provision of study materials, M.Y.N.; commentary and revision—including pre- and post-publication stages, M.Y.N.; conducting a research and investigation process, M.S.N.; development or design of methodology, M.S.N.; writing the initial draft, M.S.N.; formulation or evolution of overarching research goals and aims, H.M.A.; management and coordination responsibility for the research activity planning and execution, H.M.A.; critical review, H.M.A.; formal techniques to analyze study data, H.M.A. All authors have read and agreed to the published version of the manuscript.

Funding

This research received no external funding.

Conflicts of Interest

The authors declare no conflict of interest.

References

  1. El-Feky, H.H.; Behiry, M.S.; Amin, A.S.; Nassar, M.Y. Facile Fabrication of Nano-sized SiO2 by an Improved Sol–Gel Route: As an Adsorbent for Enhanced Removal of Cd(II) and Pb(II) Ions. J. Inorg. Organomet. Polym. Mater. 2022, 32, 1129–1141. [Google Scholar] [CrossRef]
  2. Jahin, H.S.; Kandil, M.I.; Nassar, M.Y. Facile auto-combustion synthesis of calcium aluminate nanoparticles for efficient removal of Ni(II) and As(III) ions from wastewater. Environ. Technol. 2022, 1–16. [Google Scholar] [CrossRef] [PubMed]
  3. Alizadeh, K.; Khaledyan, E.; Mansourpanah, Y. Novel modified magnetic mesopouros silica for rapid and efficient removal of methylene blue dye from aqueous media. J. Iran. Chem. Soc. 2020, 8, 159–170. [Google Scholar]
  4. Chen, C.-Y.; Hsu, L.-J. Kinetic study of self-assembly of Ni (II)-doped TiO2 nanocatalysts for the photodegradation of azo pollutants. RSC Adv. 2015, 5, 88266–88271. [Google Scholar] [CrossRef]
  5. Aljohani, M.M.; Masoud, E.M.; Mohamed, N.M.; Nassar, M.Y. Cobalt aluminate/carbon nanocomposite via an auto-combustion method: An efficient photocatalyst for photocatalytic degradation of organic dyes from aqueous media. Int. J. Environ. Anal. Chem. 2021, 1–21. [Google Scholar] [CrossRef]
  6. Fresno, F.; Portela, R.; Suárez, S.; Coronado, J.M. Photocatalytic materials: Recent achievements and near future trends. J. Mater. Chem. A 2014, 2, 2863–2884. [Google Scholar] [CrossRef]
  7. Huang, J.; Cao, Y.; Liu, Z.; Deng, Z.; Wang, W. Application of titanate nanoflowers for dye removal: A comparative study with titanate nanotubes and nanowires. Chem. Eng. J. 2012, 191, 38–44. [Google Scholar] [CrossRef]
  8. Mahmoud, H.R.; Ibrahim, S.M.; El-Molla, S.A. Textile dye removal from aqueous solutions using cheap MgO nanomaterials: Adsorption kinetics, isotherm studies and thermodynamics. Adv. Powder Technol. 2016, 27, 223–231. [Google Scholar] [CrossRef]
  9. Nassar, M.Y.; Ahmed, I.S. Template-free hydrothermal derived cobalt oxide nanopowders: Synthesis, characterization, and removal of organic dyes. Mater. Res. Bull. 2012, 47, 2638–2645. [Google Scholar] [CrossRef]
  10. Nassar, M.Y.; Ali, E.I.; Zakaria, E.S. Tunable auto-combustion preparation of TiO2 nanostructures as efficient adsorbents for the removal of an anionic textile dye. RSC Adv. 2017, 7, 8034–8050. [Google Scholar] [CrossRef]
  11. Nassar, M.Y.; Khatab, M. Cobalt ferrite nanoparticles via a template-free hydrothermal route as an efficient nano-adsorbent for potential textile dye removal. RSC Adv. 2016, 6, 79688–79705. [Google Scholar] [CrossRef]
  12. Raizada, P.; Singh, P.; Kumar, A.; Pare, B.; Jonnalagadda, S.B. Zero valent iron-brick grain nanocomposite for enhanced solar-Fenton removal of malachite green. Sep. Purif. Technol. 2014, 133, 429–437. [Google Scholar] [CrossRef]
  13. Parvizi, E.; Tayebee, R.; Koushki, E.; Abdizadeh, M.F.; Maleki, B.; Audebert, P.; Galmiche, L. Photocatalytic efficacy of supported tetrazine on MgZnO nanoparticles for the heterogeneous photodegradation of methylene blue and ciprofloxacin. RSC Adv. 2019, 9, 23818–23831. [Google Scholar] [CrossRef]
  14. Yu, J.; Trapalis, C.; Zhang, P.; Li, G.; Yu, H. Environmental Photocatalysis 2013. Int. J. Photoenergy 2013, 2013, 1–3. [Google Scholar] [CrossRef]
  15. Nassar, M.Y.; Aly, H.M.; Abdelrahman, E.A.; Moustafa, M.E. Synthesis, characterization, and biological activity of some novel Schiff bases and their Co(II) and Ni(II) complexes: A new route for Co3O4 and NiO nanoparticles for photocatalytic degradation of methylene blue dye. J. Mol. Struct. 2017, 1143, 462–471. [Google Scholar] [CrossRef]
  16. Zhu, H.; Jiang, R.; Fu, Y.; Guan, Y.; Yao, J.; Xiao, L.; Zeng, G. Effective photocatalytic decolorization of methyl orange utilizing TiO2/ZnO/chitosan nanocomposite films under simulated solar irradiation. Desalination 2012, 286, 41–48. [Google Scholar] [CrossRef]
  17. Pathania, D.; Kumari, M.; Gupta, V.K. Fabrication of ZnS–cellulose nanocomposite for drug delivery, antibacterial and photocatalytic activity. Mater. Des. 2015, 87, 1056–1064. [Google Scholar] [CrossRef]
  18. Zhang, G.; Wang, S.; Zhao, S.; Fu, L.; Chen, G.; Yang, F. Oxidative degradation of azo dye by hydrogen peroxide electrogenerated in situ on anthraquinonemonosulphonate/polypyrrole composite cathode with heterogeneous CuO/γ-Al2O3 catalyst. Appl. Catal. B Environ. 2011, 106, 370–378. [Google Scholar] [CrossRef]
  19. Saleh, K.A.; Sadiq, Y.K. Synthesis and characterization of chrome (VI) ion/iron oxide/chitosan composite for oxidation of methylene blue by photo-fenton reaction. Chem. Methodol. 2023, 7, 112–122. [Google Scholar]
  20. Kalam, A.; Al-Sehemi, A.G.; Assiri, M.; Du, G.; Ahmad, T.; Ahmad, I.; Pannipara, M. Modified solvothermal synthesis of cobalt ferrite (CoFe2O4) magnetic nanoparticles photocatalysts for degradation of methylene blue with H2O2/visible light. Results Phys. 2018, 8, 1046–1053. [Google Scholar] [CrossRef]
  21. Darder, M.; Aranda, P.; Ruiz-Hitzky, E. Bionanocomposites: A New Concept of Ecological, Bioinspired, and Functional Hybrid Materials. Adv. Mater. 2007, 19, 1309–1319. [Google Scholar] [CrossRef]
  22. Ghani, M.; Khodkavandi, S.; Jafari, Z.; Ghamari kargar, P.; Maleki, B.; Tabari, H.F. Synthesis of cellulose nanofibers-based ImSalophen@ Fe3O4 as a green sorbent for magnetic solid-phase extraction of chlorophenols followed by quantification via high-performance liquid chromatography-ultraviolet detection. Microchem. J. 2023, 187, 108368. [Google Scholar] [CrossRef]
  23. Maleki, B.; Sandaroos, R.; Naderi, S.; Peiman, S. A crowned manganese-based Schiff complex supported on nanocellulose as an efficient and sustainable heterogeneous catalyst for the oxidation of benzyl alcohols. J. Organomet. Chem. 2023, 990. [Google Scholar] [CrossRef]
  24. Sandaroos, R.; Maleki, B.; Naderi, S.; Peiman, S. Efficient synthesis of sulfones and sulfoxides from sulfides by cobalt-based Schiff complex supported on nanocellulose as catalyst and Oxone as the terminal oxidant. Inorg. Chem. Commun. 2023, 148, 110294. [Google Scholar] [CrossRef]
  25. Mohamad Haafiz, M.K.; Eichhorn, S.J.; Hassan, A.; Jawaid, M. Isolation and characterization of microcrystalline cellulose from oil palm biomass residue. Carbohydr. Polym. 2013, 93, 628–634. [Google Scholar] [CrossRef]
  26. Tang, A.M.; Hu, T.T.; Su, X. Fabrication of Microcrystalline Cellulose/CdS Nanocomposites and their Photocatalytic Properties. Adv. Mater. Res. 2013, 634, 2475–2480. [Google Scholar] [CrossRef]
  27. Manorama, S.; Basak, P.; Singh, S. Anti-Microbial Polymer Nanocomposites. In Nanocomposite Particles for Bio-Applications; Jenny Stanford Publishing: New York, NY, USA, 2011; pp. 249–264. [Google Scholar]
  28. Dong, Y.-Y.; Zhu, Y.-H.; Ma, M.-G.; Liu, Q.; He, W.-Q. Synthesis and characterization of Ag@ AgCl-reinforced cellulose composites with enhanced antibacterial and photocatalytic degradation properties. Sci. Rep. 2021, 11, 3366. [Google Scholar] [CrossRef]
  29. Saeed, R.M.Y.; Bano, Z.; Sun, J.; Wang, F.; Ullah, N.; Wang, Q. CuS-functionalized cellulose based aerogel as biocatalyst for removal of organic dye. J. Appl. Polym. Sci. 2018, 136, 47404. [Google Scholar] [CrossRef]
  30. Zeng, J.; Liu, S.; Cai, J.; Zhang, L. TiO2 Immobilized in Cellulose Matrix for Photocatalytic Degradation of Phenol under Weak UV Light Irradiation. J. Phys. Chem. C 2010, 114, 7806–7811. [Google Scholar] [CrossRef]
  31. Wang, Y.; Zhang, Z. Synthesis and field emission property of VO2 nanorods with a body-centered-cubic structure. Phys. E Low-Dimens. Syst. Nanostructures 2009, 41, 548–551. [Google Scholar] [CrossRef]
  32. Wang, Y.; Zhang, Z.; Zhu, Y.; Li, Z.; Vajtai, R.; Ci, L.; Ajayan, P.M. Nanostructured VO2 Photocatalysts for Hydrogen Production. ACS Nano 2008, 2, 1492–1496. [Google Scholar] [CrossRef]
  33. Salamati, M.; Kamyabjou, G.; Mohamadi, M.; Taghizade, K.; Kowsari, E. Preparation of TiO2@W-VO2 thermochromic thin film for the application of energy efficient smart windows and energy modeling studies of the produced glass. Constr. Build. Mater. 2019, 218, 477–482. [Google Scholar] [CrossRef]
  34. Lee, S.J.; Choi, D.S.; Kang, S.H.; Yang, W.S.; Nahm, S.; Han, S.H.; Kim, T. VO2/WO3-based hybrid smart windows with thermochromic and electrochromic properties. ACS Sustain. Chem. Eng. 2019, 7, 7111–7117. [Google Scholar] [CrossRef]
  35. Cen, Y.; Li, S.; Zhou, Y.; Cai, X.; Wang, X.; Xiang, Q.; Hu, B.; Yu, D.; Liu, Y.; Chen, C. Ultrathin VO2(B) Nanosheets as Cathode Material for High-Performance Hybrid Magnesium-Lithium Ion Batteries. J. Electrochem. Soc. 2019, 166, A1660–A1667. [Google Scholar] [CrossRef]
  36. Ajeya, K.V.; Sadhasivam, T.; Kurkuri, M.D.; Kang, U.-I.; Park, I.-S.; Park, W.-S.; Kim, S.-C.; Jung, H.-Y. Recovery of spent VOSO4 using an organic ligand for vanadium redox flow battery applications. J. Hazard. Mater. 2020, 399, 123047. [Google Scholar] [CrossRef]
  37. Zhang, Q.; Lu, Y. Change in crystallization mechanism of Sb film by doping VO2 for ultra-retention and high-speed phase change memory. Cryst. Growth Des. 2019, 19, 3477–3483. [Google Scholar] [CrossRef]
  38. Meenu, P.K.; Dehiya, B.S. One step hydrothermal synthesis of nanostructured VO2(B) for photocatalytic application. J. Nanosci. Technol. 2019, 5, 584–586. [Google Scholar]
  39. Solis-Casados, D.A.; Escobar-Alarcon, L.; Infantes-Molina, A.; Klimova, T.; Serrato-García, L.; Rodríguez-Castellón, E.; Hernandez-Lopez, S.; Dorazco-Gonzalez, A. Synthesis and characterization of Ag-modified V2O5 photocatalytic materials. J. Chem. 2017, 2017, 5849103. [Google Scholar] [CrossRef]
  40. Gurulakshmi, M.; Selvaraj, M.; Selvamani, A.; Vijayan, P.; Rekha, N.S.; Shanthi, K. Enhanced visible-light photocatalytic activity of V2O5/S-TiO2 nanocomposites. Appl. Catal. A Gen. 2012, 449, 31–46. [Google Scholar] [CrossRef]
  41. Bolokang, A.; Motaung, D.E.; Arendse, C.; Muller, T. Morphology and structural development of reduced anatase-TiO2 by pure Ti powder upon annealing and nitridation: Synthesis of TiOx and TiOxNy powders. Mater. Charact. 2015, 100, 41–49. [Google Scholar] [CrossRef]
  42. Zhang, J.; Fu, W.; Xi, J.; He, H.; Zhao, S.; Lu, H.; Ji, Z. N-doped rutile TiO2 nano-rods show tunable photocatalytic selectivity. J. Alloys Compd. 2013, 575, 40–47. [Google Scholar] [CrossRef]
  43. Wu, T.; Niu, P.; Yang, Y.; Yin, L.; Tan, J.; Zhu, H.; Irvine, J.T.S.; Wang, L.; Liu, G.; Cheng, H. Homogeneous Doping of Substitutional Nitrogen/Carbon in TiO2 Plates for Visible Light Photocatalytic Water Oxidation. Adv. Funct. Mater. 2019, 29, 1901943. [Google Scholar] [CrossRef]
  44. Kerli, S.; Alver, Ü.; Eskalen, H.; Uruş, S.; Soğuksu, A.K. Structural and Morphological Properties of Boron Doped V2O5 Thin Films: Highly Efficient Photocatalytic Degradation of Methyl Blue. Russ. J. Appl. Chem. 2019, 92, 304–309. [Google Scholar] [CrossRef]
  45. Vorontsov, A.V.; Valdés, H. Insights into the visible light photocatalytic activity of S-doped hydrated TiO2. Int. J. Hydrogen Energy 2019, 44, 17963–17973. [Google Scholar] [CrossRef]
  46. Huang, F.; Yan, A.; Zhao, H. Influences of Doping on Photocatalytic Properties of TiO2 Photocatalyst. In Semiconductor Photocatalysis: Materials, Mechanisms and Applications; InTech: Rijeka, Croatia, 2016; pp. 31–80. [Google Scholar] [CrossRef]
  47. Xu, Q.; Wang, X.; Dong, X.; Ma, C.; Zhang, X.; Ma, H. Improved Visible Light Photocatalytic Activity for TiO2Nanomaterials by Codoping with Zinc and Sulfur. J. Nanomater. 2015, 16, 7. [Google Scholar] [CrossRef]
  48. Wawrzkiewicz, M.; Hubicki, Z. Anion exchange resins as effective sorbents for removal of acid, reactive, and direct dyes from textile wastewaters. In Ion Exchange—Studies and Applications; IntechOpen: London, UK, 2015; pp. 37–72. [Google Scholar]
  49. Wawrzkiewicz, M.; Hubicki, Z. Remazol Black B removal from aqueous solutions and wastewater using weakly basic anion exchange resins. Open Chem. 2011, 9, 867–876. [Google Scholar] [CrossRef]
  50. Chuayjuljit, S.; Su-Uthai, S.; Charuchinda, S. Poly(vinyl chloride) film filled with microcrystalline cellulose prepared from cotton fabric waste: Properties and biodegradability study. Waste Manag. Res. 2010, 28, 109–117. [Google Scholar] [CrossRef]
  51. Naraginti, S.; Li, Y.; Wu, Y.; Zhang, C.; Upreti, A.R. Mechanistic study of visible light driven photocatalytic degradation of EDC 17α-ethinyl estradiol and azo dye Acid Black-52: Phytotoxicity assessment of intermediates. RSC Adv. 2016, 6, 87246–87257. [Google Scholar] [CrossRef]
  52. Fu, Y.; Chen, H.; Sun, X.; Wang, X. Combination of cobalt ferrite and graphene: High-performance and recyclable visible-light photocatalysis. Appl. Catal. B Environ. 2012, 111, 280–287. [Google Scholar] [CrossRef]
  53. Liu, T.; Wang, L.; Lu, X.; Fan, J.; Cai, X.; Gao, B.; Miao, R.; Wang, J.; Lv, Y. Comparative study of the photocatalytic performance for the degradation of different dyes by ZnIn2S4: Adsorption, active species, and pathways. RSC Adv. 2017, 7, 12292–12300. [Google Scholar] [CrossRef]
  54. Sèbe, G.; Ham-Pichavant, F.; Ibarboure, E.; Koffi, A.L.C.; Tingaut, P. Supramolecular Structure Characterization of Cellulose II Nanowhiskers Produced by Acid Hydrolysis of Cellulose I Substrates. Biomacromolecules 2012, 13, 570–578. [Google Scholar] [CrossRef]
  55. Liu, L.; Yao, T.; Tan, X.; Liu, Q.; Wang, Z.; Shen, D.; Sun, Z.; Wei, S.; Xie, Y. Room-Temperature Intercalation-Deintercalation Strategy Towards VO2 (B) Single Layers with Atomic Thickness. Small 2012, 8, 3752–3756. [Google Scholar] [CrossRef]
  56. Jenkins, R.; Snyder, R.L. Introduction to X-ray Powder Diffractometry; John Wiley & Sons, Inc.: New York, NY, USA, 1996. [Google Scholar]
  57. Refat, N.M.; Nassar, M.Y.; Sadeek, S.A. A controllable one-pot hydrothermal synthesis of spherical cobalt ferrite nanoparticles: Synthesis, characterization, and optical properties. RSC Adv. 2022, 12, 25081–25095. [Google Scholar] [CrossRef]
  58. Elanthikkal, S.; Gopalakrishnapanicker, U.; Varghese, S.; Guthrie, J.T. Cellulose microfibres produced from banana plant wastes: Isolation and characterization. Carbohydr. Polym. 2010, 80, 852–859. [Google Scholar] [CrossRef]
  59. Wei, Y.; Ryu, C.-W.; Kim, K.-B. Improvement in electrochemical performance of V2O5 by Cu doping. J. Power Sources 2007, 165, 386–392. [Google Scholar] [CrossRef]
  60. Wu, X.; Wu, Z.; Ji, C.; Feng, H.; Ma, X.; Su, Y.; Zhou, Y.; Wang, J.; Jiang, Y. Influence of infrared optical properties by transformation of the crystal structure in Al-doped vanadium dioxide films. Opt. Mater. Express 2016, 6, 3500–3506. [Google Scholar] [CrossRef]
  61. Ji, H.; Liu, D.; Cheng, H.; Zhang, C.; Yang, L.; Ren, D. Infrared thermochromic properties of monoclinic VO2 nanopowders using a malic acid-assisted hydrothermal method for adaptive camouflage. RSC Adv. 2017, 7, 5189–5194. [Google Scholar] [CrossRef]
  62. Liu, P.; Gardner, J.M.; Kloo, L. Solution processable, cross-linked sulfur polymers as solid electrolytes in dye-sensitized solar cells. Chem. Commun. 2015, 51, 14660–14662. [Google Scholar] [CrossRef]
  63. Adar, F. Characterizing modified celluloses using Raman spectroscopy. Spectroscopy 2016, 31, 22–27. [Google Scholar]
  64. Kim, H.; Youn, J.R.; Song, Y.S. Eco-friendly flame retardant nanocrystalline cellulose prepared via silylation. Nanotechnology 2018, 29, 455702. [Google Scholar] [CrossRef]
  65. Wang, J.; Zhang, X.; Zhang, Y.; Abas, A.; Zhao, X.; Yang, Z.; Su, Q.; Lan, W.; Xie, E. Lightweight, interconnected VO2 nanoflowers hydrothermally grown on 3D graphene networks for wide-voltage-window supercapacitors. RSC Adv. 2017, 7, 35558–35564. [Google Scholar] [CrossRef]
  66. Li, Y.; Shen, S.; Wang, C.; Peng, X.; Yuan, S. The effect of difference in chemical composition between cellulose and lignin on carbon based solid acids applied for cellulose hydrolysis. Cellulose 2018, 25, 1851–1863. [Google Scholar] [CrossRef]
  67. Zhou, Y.; Liu, P.; Jiang, F.; Tian, J.; Cui, H.; Yang, J. Vanadium sulfide sub-microspheres: A new near-infrared-driven photocatalyst. J. Colloid Interface Sci. 2017, 498, 442–448. [Google Scholar] [CrossRef] [PubMed]
  68. Silversmit, G.; Depla, D.; Poelman, H.; Marin, G.B.; De Gryse, R. Determination of the V2p XPS binding energies for different vanadium oxidation states (V5+ to V0+). J. Electron Spectrosc. Relat. Phenom. 2004, 135, 167–175. [Google Scholar] [CrossRef]
  69. Owolabi, A.F.; Haafiz, M.M.; Hossain, S.; Hussin, M.H.; Fazita, M.N. Influence of alkaline hydrogen peroxide pre-hydrolysis on the isolation of microcrystalline cellulose from oil palm fronds. Int. J. Biol. Macromol. 2017, 95, 1228–1234. [Google Scholar] [CrossRef]
  70. Kian, L.K.; Jawaid, M.; Ariffin, H.; Alothman, O.Y. Isolation and characterization of microcrystalline cellulose from roselle fibers. Int. J. Biol. Macromol. 2017, 103, 931–940. [Google Scholar] [CrossRef] [PubMed]
  71. Murugan, A.V.; Quintin, M.; Delville, M.H.; Campet, G.; Vijayamohanan, K. Entrapment of poly (3, 4-ethylenedioxythiophene) between VS2 layers to form a new organic–inorganic intercalative nanocomposite. J. Mater. Chem. 2005, 15, 902–909. [Google Scholar] [CrossRef]
  72. Liu, L.; Cao, F.; Yao, T.; Xu, Y.; Zhou, M.; Qu, B.; Pan, B.; Wu, C.; Wei, S.; Xie, Y. New-phase VO2 micro/nanostructures: Investigation of phase transformation and magnetic property. New J. Chem. 2012, 36, 619–625. [Google Scholar] [CrossRef]
  73. Štengl, V.; Grygar, T.M. The simplest way to iodine-doped anatase for photocatalysts activated by visible light. Int. J. Photoenergy 2011, 2011, 685935. [Google Scholar] [CrossRef]
  74. Li, S.; Lin, Y.-H.; Zhang, B.-P.; Wang, Y.; Nan, C.-W. Controlled Fabrication of BiFeO3 Uniform Microcrystals and Their Magnetic and Photocatalytic Behaviors. J. Phys. Chem. C 2010, 114, 2903–2908. [Google Scholar] [CrossRef]
  75. Sun, J.; Li, X.; Zhao, Q.; Ke, J.; Zhang, D. Novel V2O5/BiVO4/TiO2 nanocomposites with high visible-light-induced photocatalytic activity for the degradation of toluene. J. Phys. Chem. C 2014, 118, 10113–10121. [Google Scholar] [CrossRef]
  76. Sheha, E.; Kamar, E. Structural characteristic of vanadium(V) oxide/sulfur composite cathode for magnesium battery applications. Mater. Sci. 2019, 37, 570–576. [Google Scholar] [CrossRef]
  77. Basu, R.; Ghosh, S.; Bera, S.; Das, A.; Dhara, S. Phase-pure VO2 nanoporous structure for binder-free supercapacitor performances. Sci. Rep. 2019, 9, 4621. [Google Scholar] [CrossRef]
  78. Mohamed, M.M.; Bayoumy, W.A.; Goher, M.E.; Abdo, M.H.; El-Ashkar, T.Y. Optimization of α-Fe2O3@ Fe3O4 incorporated N-TiO2 as super effective photocatalysts under visible light irradiation. Appl. Surf. Sci. 2017, 412, 668–682. [Google Scholar] [CrossRef]
  79. Virkutyte, J.; Jegatheesan, V.; Varma, R.S. Visible light activated TiO2/microcrystalline cellulose nanocatalyst to destroy organic contaminants in water. Bioresour. Technol. 2012, 113, 288–293. [Google Scholar] [CrossRef]
  80. Wei, G.; Zuo, H.-F.; Guo, Y.-R.; Pan, Q.-J. Synthesis of ZnO with Enhanced Photocatalytic Activity: A Novel Approach Using Nanocellulose. Bioresources 2016, 11, 6244–6253. [Google Scholar] [CrossRef]
  81. Zhu, C.; Zhang, X.; Zhang, Y.; Li, Y.; Wang, P.; Jia, Y.; Liu, J. Ultrasonic-Assisted Synthesis of CdS/Microcrystalline Cellulose Nanocomposites with Enhanced Visible-Light-Driven Photocatalytic Degradation of MB and the Corresponding Mechanism Study. Front. Chem. 2022, 10. [Google Scholar] [CrossRef]
  82. de Campos, E.A.; de Campos, S.D.; Roos, A.A.; de Souza, B.V.C.; Schneider, J.M.; Uliana, M.B.; Oliveira, R.C. Titanium dioxide dispersed on cellulose acetate and its application in methylene blue photodegradation. Polym. Polym. Compos. 2013, 21, 423–430. [Google Scholar] [CrossRef]
  83. Zang, Y.; Farnood, R. Effect of Hydrogen Peroxide on the Photocatalytic Degradation of Methyl tert-butyl Ether. Top. Catal. 2006, 37, 91–96. [Google Scholar] [CrossRef]
  84. Butler, M.A.; Ginley, D.S. Prediction of Flatband Potentials at Semiconductor-Electrolyte Interfaces from Atomic Electronegativities. J. Electrochem. Soc. 1978, 125, 228–232. [Google Scholar] [CrossRef]
  85. Xu, Y.; Schoonen, M.A. The absolute energy positions of conduction and valence bands of selected semiconducting minerals. Am. Miner. 2000, 85, 543–556. [Google Scholar] [CrossRef]
Scheme 1. Experimental setup for MCC/S-VO2 preparation.
Processes 11 01322 sch001
Figure 1. XRD patterns of MCC, S, V2O5, S-VO2, and MCC/S-VO2.
Processes 11 01322 g001
Figure 2. FT-IR spectra of MCC, V2O5, S-VO2, and MCC/S-VO2 products.
Processes 11 01322 g002
Figure 3. Raman spectrum for MCC/S-VO2 nanocomposite.
Processes 11 01322 g003
Figure 4. XPS broad spectrum (a), XPS spectra of C 1s (b), O 1s (c), S 2p (d), and V 2p (e) of MCC/S-VO2 nanocomposite.
Processes 11 01322 g004
Figure 5. FE-SEM images of MCC (a), S-VO2 (b), and MCC/S-VO2 (c); corresponding EDX data (d) of MCC/S-VO2.
Processes 11 01322 g005
Figure 6. TEM images of MCC/S-VO2 nanocomposite.
Processes 11 01322 g006
Figure 7. Thermal analysis (TG, DSC, and DTG curves) for MCC/S-VO2 nanocomposite.
Processes 11 01322 g007
Figure 8. Optical absorption properties of the as-prepared products: UV-Vis spectra (a) and energy gap for V2O5, S-VO2, MCC/S-VO2, and MCC (b).
Processes 11 01322 g008
Figure 9. Photocatalytic degradation of MB in the absence and presence of H2O2 (a and b, respectively) and corresponding pseudo-first-order kinetic fits (c and d, respectively). Under experimental conditions: 20 mg catalyst dosage, 20 mg L−1 dye concentration.
Processes 11 01322 g009
Figure 10. Effect of catalyst loading on the photocatalytic degradation of MB using MCC/S-VO2 (a) S-VO2 (b), dark adsorption curves for MB over MCC/S-VO2 (c).
Processes 11 01322 g010
Figure 11. Recycling performance of S-VO2 and MCC/S-VO2 nanocomposites for MB degradation.
Processes 11 01322 g011
Figure 12. XRD (a), FT-IR (b), and FE-SEM (c) characterizations of MCC/S-VO2, before and after MB photocatalytic degradation recycling.
Processes 11 01322 g012
Figure 13. Photocatalytic degradation of MB with MCC/S-VO2 and S-VO2 under UV light irradiation in the presence of different scavengers.
Processes 11 01322 g013
Figure 14. Proposed degradation mechanism of MB dye by MCC/S-VO2 nanocomposite under UV light.
Processes 11 01322 g014
Table 2. Calculated kinetic parameters for the photocatalytic degradation of MB dye over S-VO2 and MCC/S-VO2 photocatalysts.
SamplesWith H2O2Without H2O2
Kobs (min−1)R2Kobs (min−1)R2
S-VO20.08190.8530.00080.97
MCC/S-VO20.0390.9710.00340.97
Table 3. Comparison of degradation efficiency of the present study with different photocatalysts in terms of MB degradation.
Photocatalyst
Name
Catalyst Amount (mg)MB Conc.
(mg L−1)
Degradation Rate
(%)
Irradiation Time
(min)
Irradiation LightReference
S-VO2202010055UV irradiationPresent study
Ag@AgCl-reinforced cellulose 152010060Visible light[28]
MCC/S-VO2202092.955UV irradiationPresent study
TiO2/MCC3010090240UV irradiation[79]
ZnO/MCC1001589.8120UV irradiation[80]
CdS/MCC501081.560Visible light[81]
CuS-functionalized CBA 252079.760Visible light[29]
Cellulose acetate/TiO2 1000.47090Visible light[82]
Table 4. Absolute electronegativity, estimated band gap, and calculated potentials of CBs and VBs for MCC, S-VO2, and MCC/S-VO2.
Samples x (eV)Eg (eV)ECB (eV)EVB (eV)
MCC6.9834.850.0584.908
S-VO26.1532.100.6032.703
MCC/S-VO26.5542.290.9101.380
Disclaimer/Publisher’s Note: The statements, opinions and data contained in all publications are solely those of the individual author(s) and contributor(s) and not of MDPI and/or the editor(s). MDPI and/or the editor(s) disclaim responsibility for any injury to people or property resulting from any ideas, methods, instructions or products referred to in the content.

