
Risk Assessment Model of Chemical Process Based on Interval Type-2 Fuzzy Petri Nets


Abstract
1. Introduction
2. The Principle Underlying Interval Type-2 Fuzzy Petri Nets
2.1. Fuzzy Petri Nets
- (1)
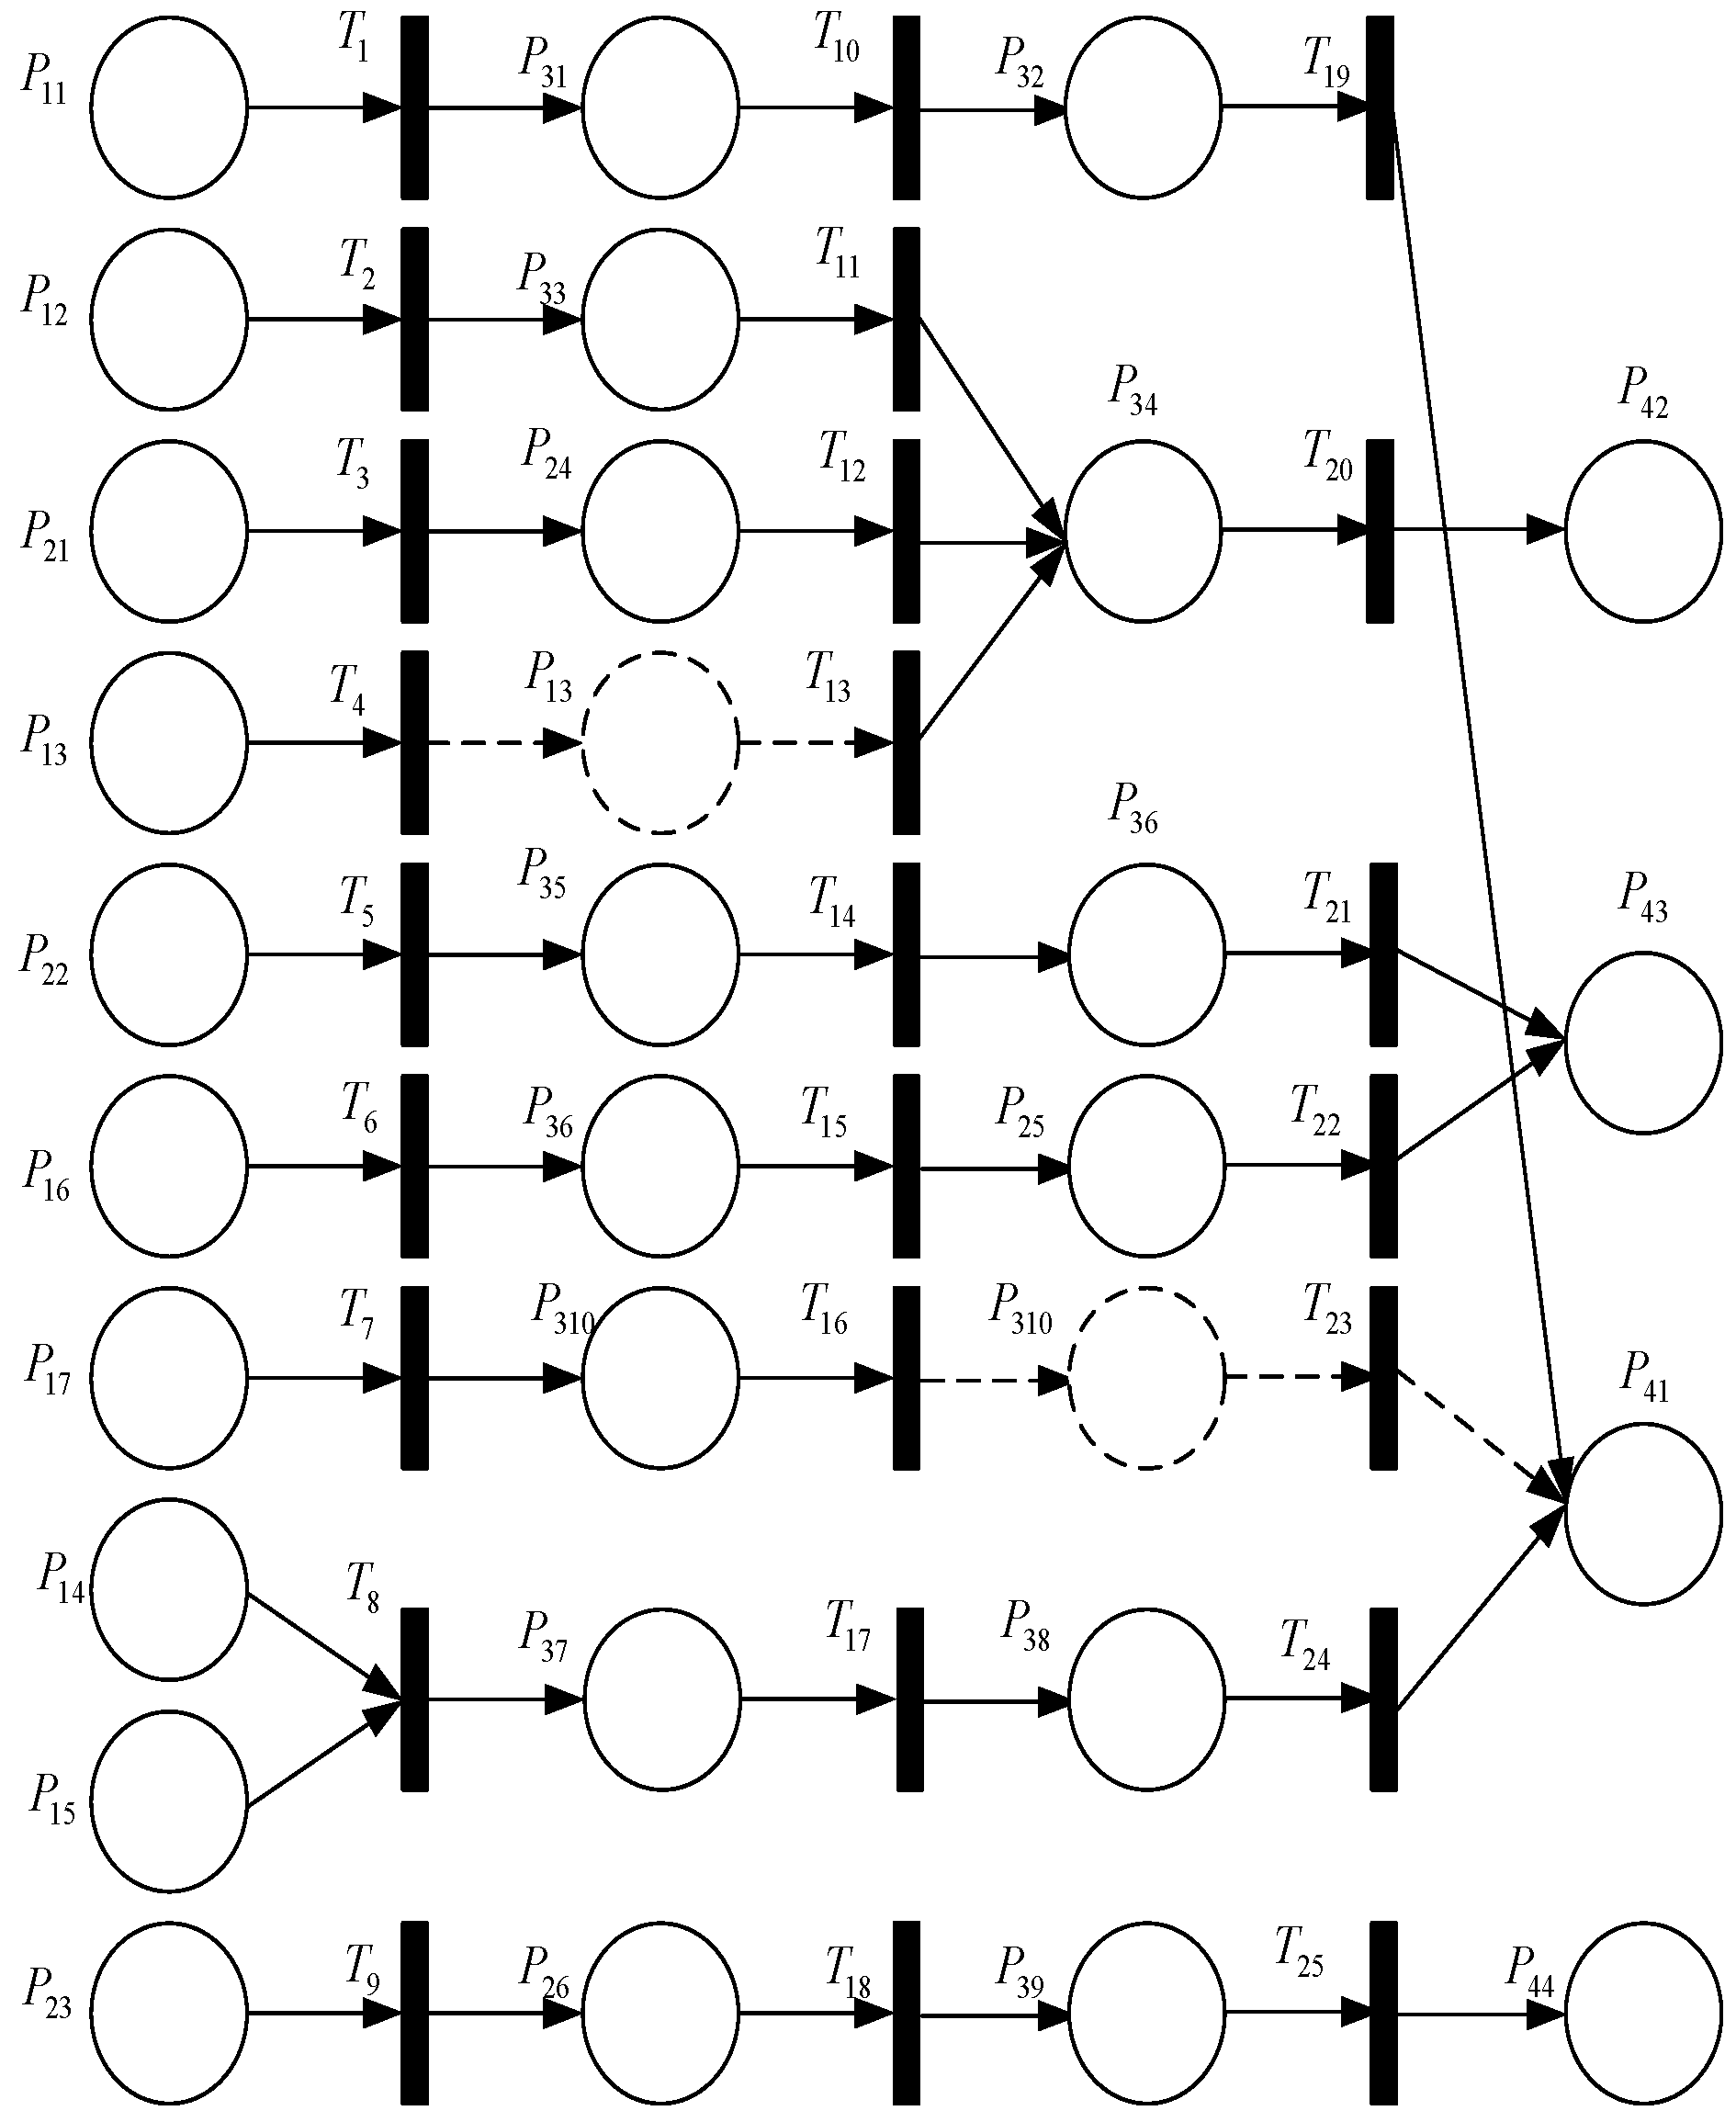
- , represents the limited set of places, namely the risk repositories present in chemical production. The risk places are roughly divided into four types: human factors , system factors , state changes , and accidents . The corner number only represents the four risk types.
- (2)
- , represents the finite set of transitions, namely the occurrence process of some fuzzy rules.
- (3)
- : P→T is an n × m transition input matrix.
- (4)
- : T→P is an n by m transition output matrix.
- (5)
- : Is a diagonal matrix, representing the confidence degree of transition.
- (6)
- : Is a diagonal matrix, representing the confidence of the place.
- (7)
- : In the state matrix of the risk database, M(0) is the initial state matrix, and k represents the number of layers of multi-level Petri nets, that is, the state matrix after k transitions.
2.2. Interval Type-2 Fuzzy Sets
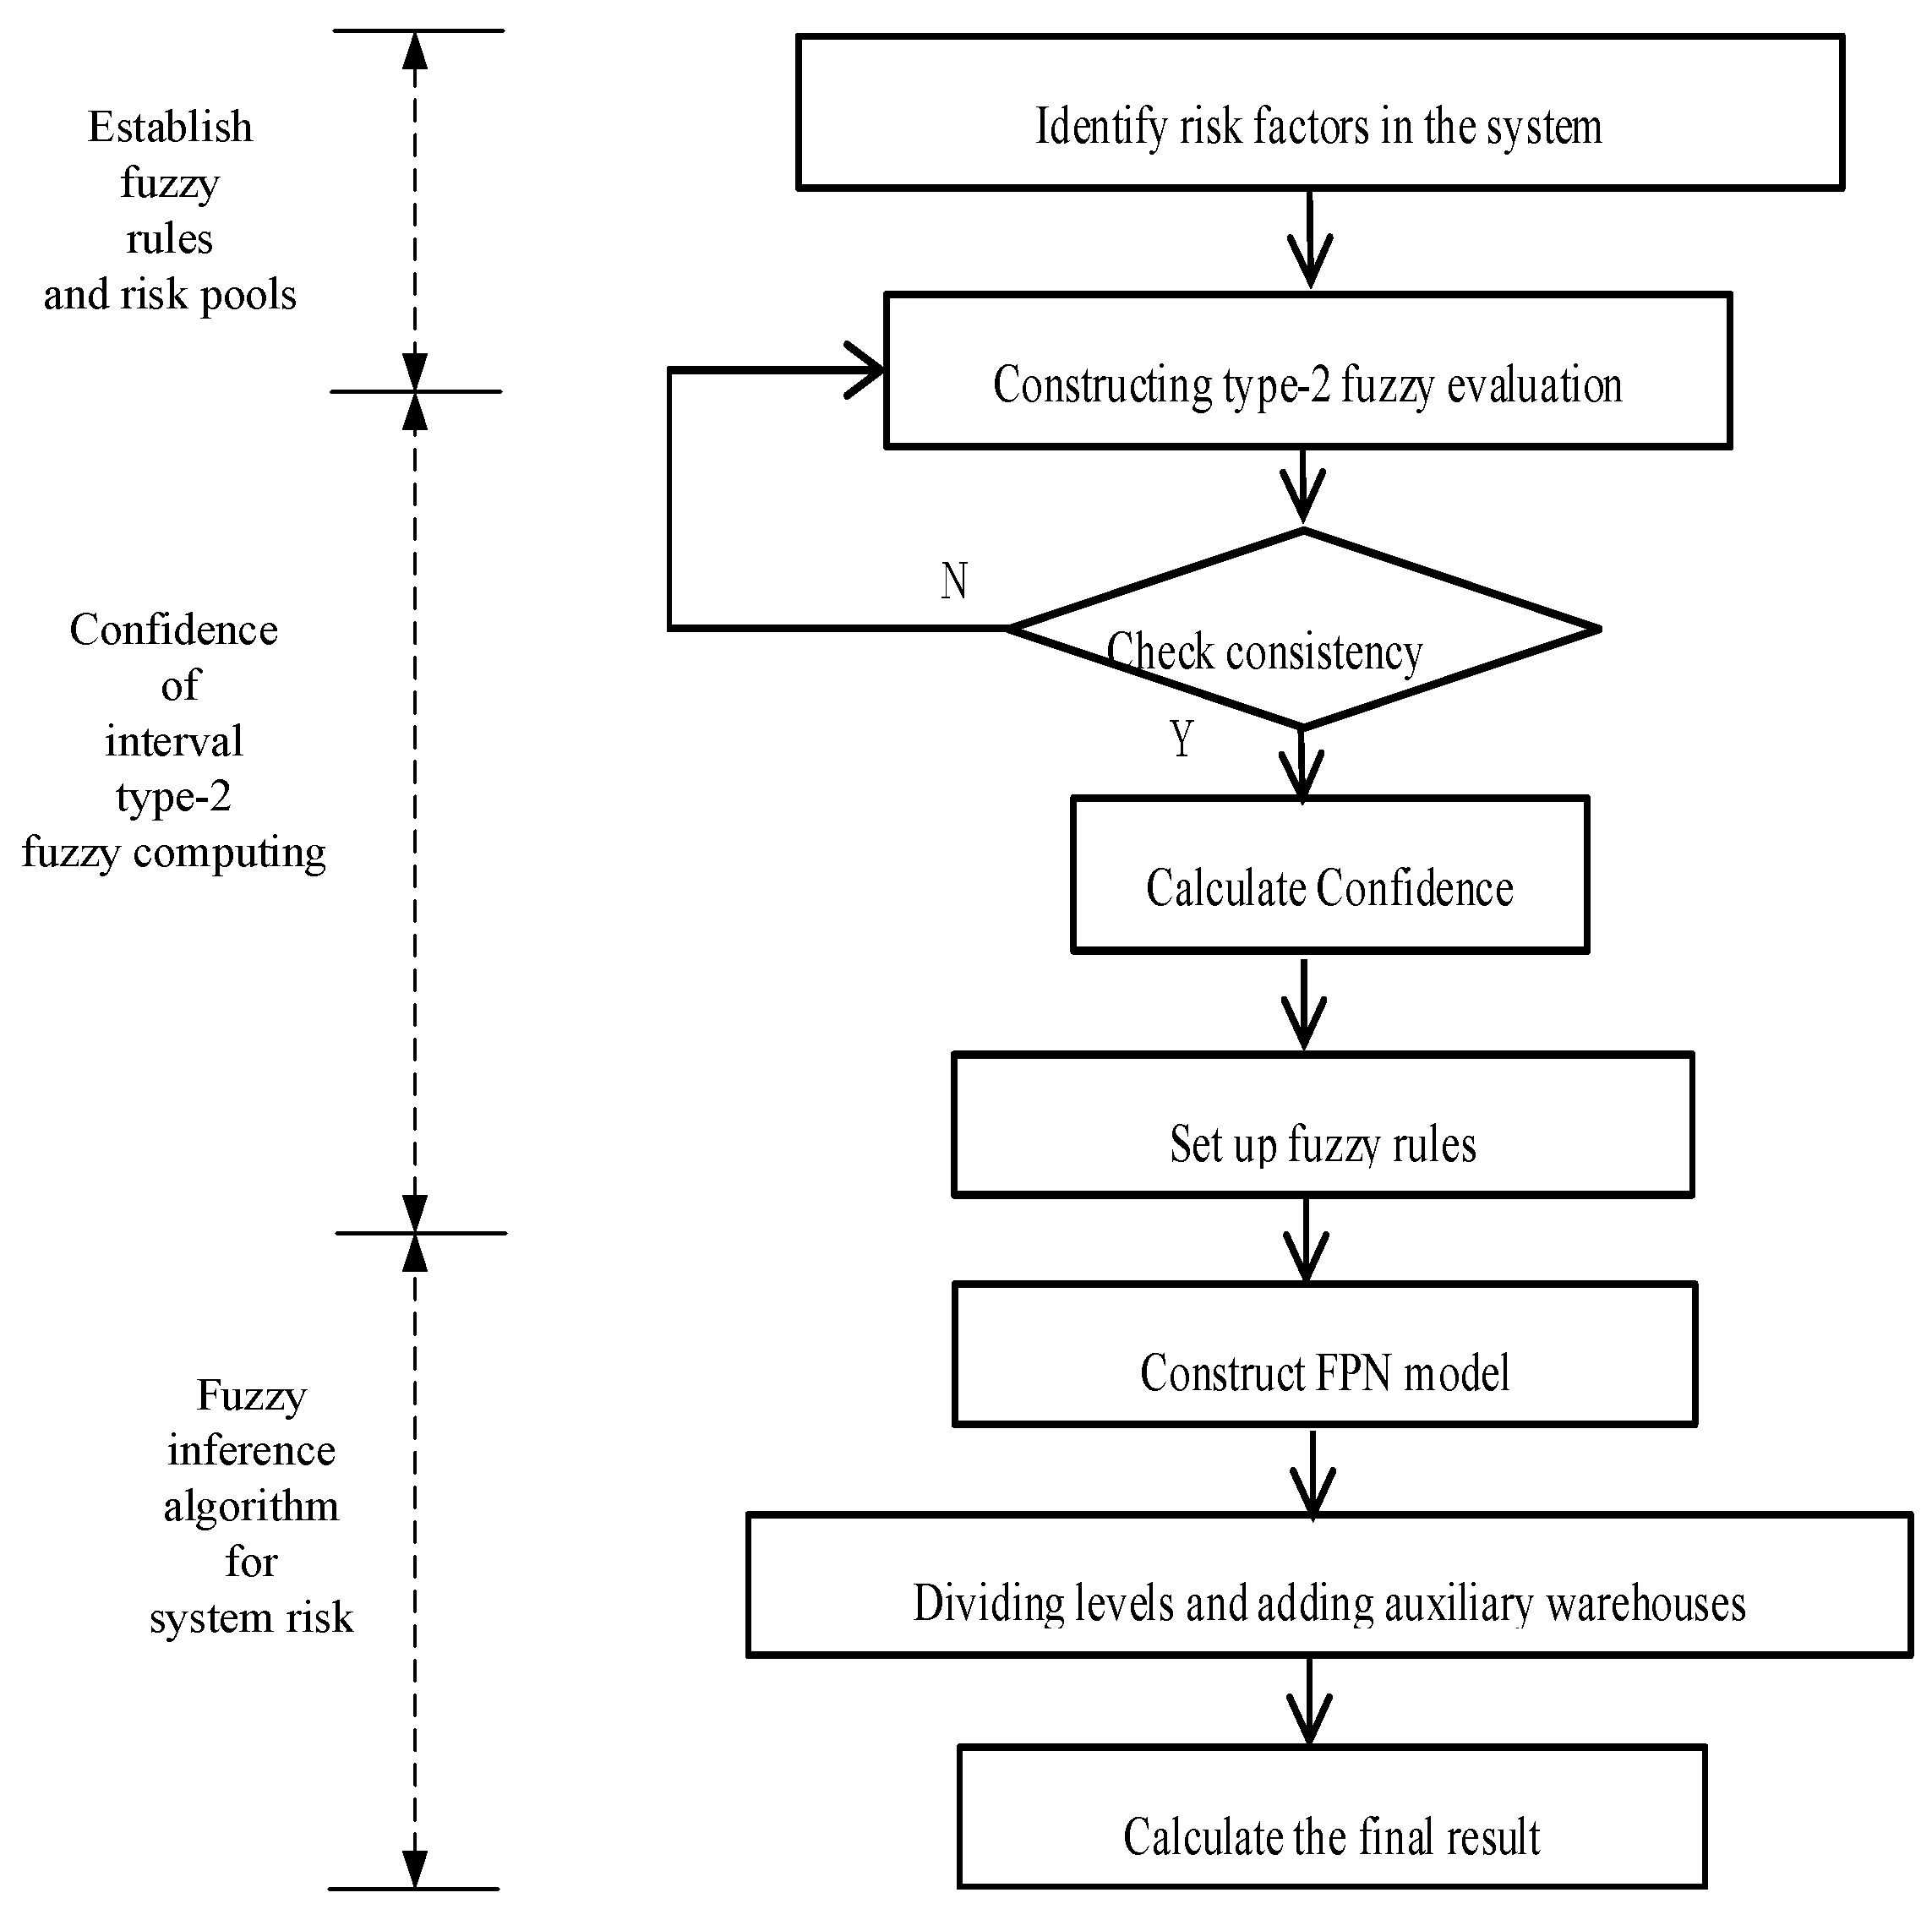
3. Interval Type-2 Fuzzy Petri Net Risk Assessment Model
3.1. Establish Fuzzy Rules and Risk Pools
3.2. Confidence of Interval Type-2 Fuzzy Computing
3.3. Fuzzy Inference Algorithm for System Risk
4. Illustrative Example
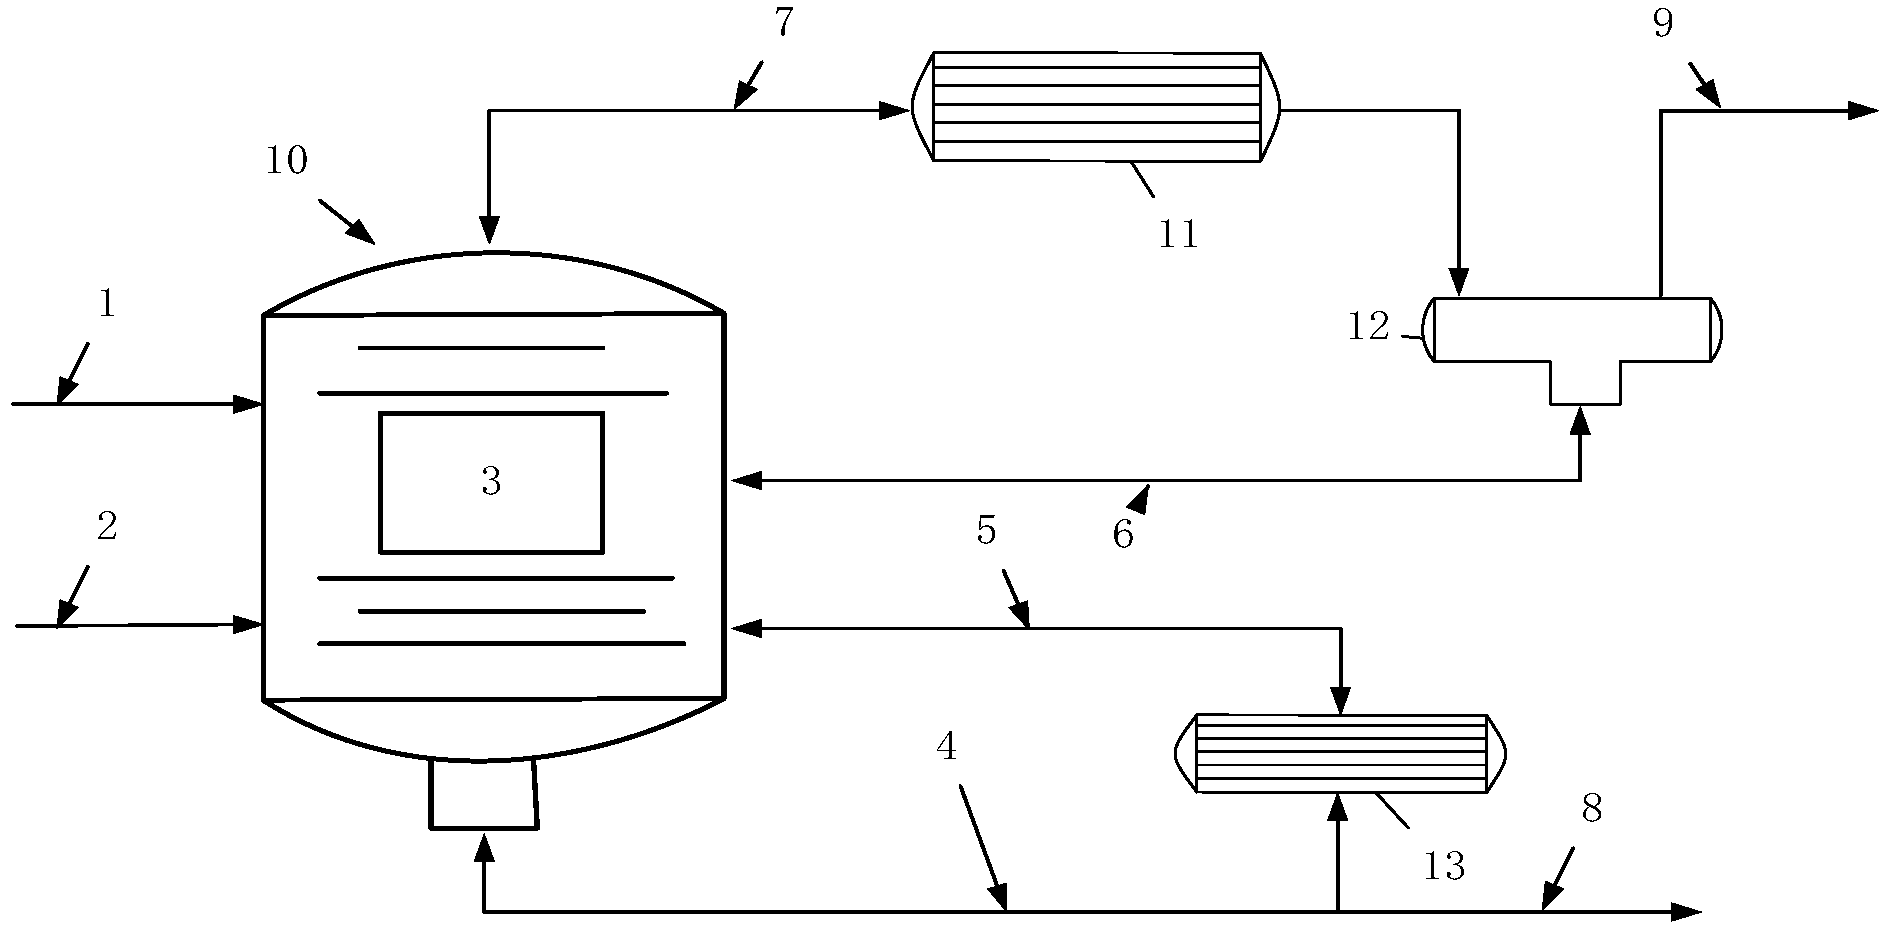
4.1. Cyclohexane Process
4.2. Case Calculation Process
- (1)
- The water in the jackets of two reactors is not drained → Water is increased → Catalyst is not activated → The product is unqualified;
- (2)
- Do not close the exhaust valve after exhaust → By-product accumulation → Pressure increase → Explosion;
- (3)
- Failure of front drum pressure display adjustment → Failure of front drum pressure alarm → Pressure increase → Explosion;
- (4)
- Do not open the system pressure regulating valve before and after the globe valve → Pressure increase → Explosion;
- (5)
- Contact dispatching does not introduce tail hydrogen into the system → Tail hydrogen flow is not up to standard → Temperature surge → Fire occurs;
- (6)
- Manual control pressure is not up to 0.6 MPa → Activation conditions are not met → Insufficient reaction → The product is unqualified;
- (7)
- The steam valve of the reactor jacket is not opened → Activation conditions are not met → Insufficient reaction → The product is unqualified;
- (8)
- The jacket steam valve is not closed → Temperature surge → The tail hydrogen is not cut off, the nitrogen is passed, and the heating steam is closed → Fire occurs;
- (9)
- The jacket is not filled with soft water → The temperature is too high → The product is unqualified;
- (10)
- Front drum liquid level display adjustment is not controlled within 50~80% → Front drum display alarm failure → High liquid level → Device damage;
- (1)
- After establishing the risk places for human factors, system factors, state changes, and accidents, of all the 23 risk factors that lead to accidents, six (approximately 26%) were human factors, seven (approximately 30%) belonged to system factors, and the risk factors that belonged to state changes accounted for approximately 43%. Notably, system factors had the greatest impact on accident occurrence. The second was the change in state, whereas human factors had the smallest probability of influencing accident occurrence;
- (2)
- When initially calculating the risk factors, for a single risk factor, the risk confidence of the tailing hydrogen flow not meeting standards, the front drum pressure alarm failure, by-product accumulation, and temperature inflation were the highest, indicating that these four risk factors are the most critical to the accident;
- (3)
- The confidence level for the four final accident risk factors was between 0.1 and 0.3, indicating that the accident likelihood is not high. The confidence level of the explosion risk was 0.096, indicating the smallest likelihood of accident occurrence. Second, the risk confidence level of unqualified products was 0.173, whereas that of device damage was 0.13. The probability of a fire occurring was the highest, and the risk confidence level was 0.266. Notably, accident occurrence is the result of a shift from a quantitative to a qualitative change under the combined action of various factors. Despite the low likelihood of accident occurrence, no risk factor should be ignored.
5. Conclusions
Author Contributions
Funding
Institutional Review Board Statement
Informed Consent Statement
Data Availability Statement
Conflicts of Interest
References
- Lu, M.; Han, X.Z. Statistics analysis and measures of 667 environmental pollution accidents. Ind. Saf. Environ. Prot. 2013, 39, 30–32. [Google Scholar]
- Li, F.G.; Zhang, B.K.; Gao, D. Construction method of HAZOP knowledge graph. Chem. Ind. Eng. Prog. 2021, 40, 4666–4677. [Google Scholar]
- Feng, X.Y.; Dai, Y.Y.; Ji, X.; Li, Z. HAZOP causal knowledge description model based on ontology. Chem. Ind. Eng. Prog. 2021, 40, 6044–6053. [Google Scholar]
- Zhao, Y.; Jiao, J.; Zhao, Y.D. Risk assessment method based on fuzzy logic. Syst. Eng. Electron. 2015, 37, 1825–1831. [Google Scholar]
- Song, Z.P.; Guo, D.S.; Xu, T.; Hua, W. Risk assessment model in TBM construction based on nonlinear fuzzy analytic hierarchy process. Rock Soil Mech. 2021, 42, 1424–1433. [Google Scholar]
- Cheng, H.; Xing, J.L.; Zhen, R.X.; Shen, J.; Hu, L.; Mao, L.; Xu, Y.; Zhou, Z.; Lu, J.; Zhao, S. Comprehensive evaluation of pesticide residue safety risk in agricultural products based on entropy weight fuzzy analysis method. J. Chin. Inst. Food Sci. Technol. 2021, 21, 331–339. [Google Scholar]
- Lin, X.H.; Jia, W.H. Scheme optimization decision based on interval type-2 fuzzy TOPSIS method. Bull. Sci. Technol. 2018, 34, 120–124. [Google Scholar]
- Zhang, G.D.; Xue, Y.G.; Bai, C.H.; Su, M.X.; Zhang, K.; Tao, Y.F. Risk assessment of floor water inrush in coal mines based on MFIM-TOPSIS variable weight model. J. Cent. South Univ. 2021, 28, 2360–2374. [Google Scholar] [CrossRef]
- Jiang, Z.A.; Zheng, D.F.; Zeng, F.B.; Fu, M.F.; Zhang, M.X. Study on safety management model of oil and gas pipeline based on hazard theory. J. Hunan Univ. 2021, 48, 56–65. [Google Scholar]
- Yao, L.; Xu, Z.; Lv, C.; Hashim, M. Incomplete interval type-2 fuzzy preference relations based on a multi-criteria group decision-making model for the evaluation of wastewater treatment technologies. Measurement 2019, 151, 107–137. [Google Scholar] [CrossRef]
- Li, H.; Wu, P.; Zhou, L.; Chen, H. A new approach for multicriteria group decision making under interval type-2 fuzzy environment. Measurement 2021, 172, 108818. [Google Scholar] [CrossRef]
- Wu, Y.; Xu, C.; Zhang, B.; Tao, Y.; Li, X.; Chu, H.; Liu, F. Sustainability performance assessment of wind power coupling hydrogen storage projects using a hybrid evaluation technique based on interval type-2 fuzzy set. Energy 2019, 179, 1176–1190. [Google Scholar] [CrossRef]
- Hong, Y.; Pasman, H.J.; Quddus, N.; Mannan, M.S. Supporting risk management decision making by converting linguistic graded qualitative risk matrices through interval type-2 fuzzy sets. Process Saf. Environ. Prot. 2019, 134, 308–322. [Google Scholar] [CrossRef]
- Zhou, J.F.; Genserik, R. Modeling and application of risk assessment considering veto factors using fuzzy Petri nets. J. Loss Prev. Process Ind. 2020, 67, 104216. [Google Scholar] [CrossRef]
- Guo, Y.B.; Meng, X.L.; Wang, D.G.; Meng, T.; Liu, S.H.; He, R.Y. Comprehensive risk evaluation of long-distance oil and gas transportation pipelines using a fuzzy Petri net model. J. Nat. Gas Sci. Eng. 2016, 33, 18–29. [Google Scholar] [CrossRef]
- Chen, Z.Y.; Gao, X.F. Security risk assessment based on dynamic fuzzy petri net in ad hoc network. Int. Core J. Eng. 2020, 45, 26–30. [Google Scholar]
- Dhanya, P.S. Vijayakumar B. Developing an information security risk taxonomy and an assessment model using fuzzy petri nets. J. Cases Inf. Technol. 2018, 20, 48–69. [Google Scholar]
- Zhou, K.Q.; Azlan, M.Z. Fuzzy petri nets and industrial applications: A review. Artif. Intell. Rev. 2016, 45, 405–446. [Google Scholar] [CrossRef]
- Huo, J.J.; Yuan, C.Y.; Qu, W.L. Study of petri net based workflow semantics. In Proceedings of the 10th National Youth Communication Academic Conference, Sichuan, China, 24 August 2005; 2005 New Progress in Communication Theory: Beijing, China, 2005; pp. 734–738. [Google Scholar]
- Looney Carl, G. Fuzzy petri nets for rule-based decision making. IEEE Trans. On systems Man Cybern. Syst. 1988, 18, 178–183. [Google Scholar] [CrossRef]
- Yin, X.W.; Wang, Y.; Dai, B.Q.; Wang, T. Application analysis of fuzzy Petri net in evaluation of urban safety development level. China Saf. Sci. Journa 2020, 30, 129–135. [Google Scholar]
- Wu, P.; Xia, H.B.; Wu, J.J.; Hu, S.P. Risk assessment of shipping liquefiable solid bulk cargoes based on fuzzy Petri nets. J. Shanghai Marit. Univ. 2019, 40, 63–68. [Google Scholar]
- Di Zhang, P.G.; Tian, S.; Cui, Y. Risk assessment of gasifier based on Improved Entropy Weight-Mutation Progression Method. J. Liaoning Petrochem. Univ. 2022, 42, 53–58. [Google Scholar]
- Zadeh, L.A. Fuzzy sets. Inf. Control 1965, 8, 338–353. [Google Scholar] [CrossRef]
- Zadeh, L.A. The concept of a linguistic variable and its application to approximate reasoning. Inf. Sci. 1975, 8, 199–249. [Google Scholar] [CrossRef]
- Wang, F.Y.; Mo, H. Some fundamental issues on type-2 fuzzy sets. Acta Autom. Sin. 2017, 43, 1114–1141. [Google Scholar]
- Türk, S.; Deveci, M.; Özcan, E.; Canıtez, F.; John, R. Interval type-2 fuzzy Sets improved by simulated annealing for locating the electric charging stations. Inf. Sci. 2020, 547, 641–666. [Google Scholar] [CrossRef]
- Wang, W. Multi-criteria decision making method of DEMATEL-ANP under type-2 fuzzy environment and its application in safety evaluation subway operation. Master’s Thesis, Southeast University, Nanjing, China, 2017. [Google Scholar]
- Buckley, J.J. Fuzzy hierarchical analysis. Fuzzy Sets Syst. 1985, 17, 233–247. [Google Scholar] [CrossRef]
- Yu, L.Q.; Liu, A.; Yang, Z.J.; Tian, H.L.; Chen, C.H.; Gao, J.W. Reliability analysis of numerical control machine tools based on analytic network process and date envelopment analysis. J. Jilin Univ. 2022, 52, 400–408. [Google Scholar]
- Li, W.J.; Liu, S.L.; Yi, Y.; Sun, Y.B. Based on multi-level fuzzy colored Petri nets risk assessment of gas transmission station sewage system. J. Saf. Environ. 2022, 22, 1736–1742. [Google Scholar]
- Wang, Y.; Shi, Y.; Dai, W.; Peng, H.; Wang, G.Q. Review of catalyst and process for benzene hydrogenation to cyclohexane. Mod. Chem. Ind. 2015, 35, 53–56, +58. [Google Scholar]
- Gao, X.; Zhu, Y.F.; Liu, S.L.; Fei, J.L.; Liu, L. Risk assessment model based on fuzzy Petri nets. J. Commun. 2013, 34 (Suppl. S1), 126–132. [Google Scholar]
- Liang, Y.X.; Zhao, T.Y.; Kan, Z.; Shang, Y. Application of interval type-2 VIKOR method in risk assessment of chemical industry. In Proceedings of the International Conference on Applied Mathematics, Modelling, and Intelligent Computing, Kunming, China, 25–27 March 2022; SPIE Proceedings: Bellingham, WA, USA, 2022; p. 122590. [Google Scholar]
- Wu, Y.N.; Sun, X.P.; Li, X.P.; Xu, C.B. Research on investment risk decision model of wind Power construction project based on interval type-2 fuzzy AHP-VIKOR. Sci. Technol. Manag. Res. 2019, 39, 236–245. [Google Scholar]


| Influence Degree Language Variables | Interval Type-2 Fuzzy Sets |
|---|---|
| Absolute strong influence (AS) | (7.00,8.00,9.00,9.00;1.00,1.00), (7.20,8.20,8.80,9.00;0.80,0.80) |
| 1/AS | (0.11,0.11,0.13,0.14;1.00,1.00), (0.11,0.11,0.12,0.14;0.80,0.80) |
| Very strong influence (VS) | (5.00,6.00,8.00,9.00;1.00,1.00), (5.20,6.20,7.80,8.80;0.80,0.80) |
| 1/VS | (0.11,0.13,0.17,0.20;1.00,1.00), (0.11,0.13,0.16,0.19;0.80,0.80) |
| Significant influence (FS) | (3.00,4.00,6.00,7.00;1.00,1.00), (3.20,4.20,5.80,6.80;0.80,0.80) |
| 1/FS | (0.14,0.17,0.25,0.33;1.00,1.00), (0.15,0.17,0.24,0.31;0.80,0.80) |
| Slight influence (SS) | (1.00,2.00,4.00,5.00;1.00,1.00), (1.20,2.20,3.80,4.80;0.80,0.80) |
| 1/SS | (0.25,0.25,0.50,1.00;1.00,1.00), (0.21,0.26,0.45,0.83;0.80,0.80) |
| Equal influence(E) | (1.00,1.00,1.00,1.00;1.00,1.00), (1.00,1.00,1.00,1.00;0.80,0.80) |
| Matrix Order | 1 | 2 | 3 | 4 | 5 | 6 | 7 | 8 | 9 | 10 |
|---|---|---|---|---|---|---|---|---|---|---|
| RI | 0.00 | 0.00 | 0.52 | 0.89 | 1.11 | 1.25 | 1.35 | 1.40 | 1.45 | 1.49 |
| E,E,E,E,E | SS,SS,E, 1/FS,1/FS | E,1/AS,1/VS, 1/FS,1/FS | E,SS,FS,FS,E | SS,FS,SS, VS,E | 1/FS,FS,FS, VS,VS | SS,E,FS, AS,VS | ||||
| E,1/SS,1/SS, E,1/SS | E,E,E,E,E | 1/VS,1/FS,1/VS,1/FS,1/FS | 1/FS,1/FS,1/FS,1/AS,SS | 1/VS,SS, 1/VS,SS/SS | 1/VS,1/FS,1/FS,1/FS,1/SS | 1/SS,1/SS,1/ FS,1/SS,E | ||||
| SS,SS,FS,FS,E | 1/SS,1/SS, FS,E,FS | E,E,E,E,E | FS,SS,FS, FS,VS | ES,FS,AS, FS,E | 1/SS,1/SS,FS, FS,E | SS,E,E, FS,SS | ||||
| 1/FS,1/SS,1/ AS,1/FS,1/AS | E,1/FS,1/FS,E,1/VS | 1/AS,1/VS,1/ AS,1/FS,FS | E,E,E,E,E | E,VS,VS, ES,SS | 1/FS,E,E, 1/SS,FS | 1/FS,1/SS,1/ SS,1/SS,SS | ||||
| AS,1/VS,VS, AS,1/FS | FS,SS,VS,FS,FS | 1/AS,1/FS,1/FS,1/FS,1/AS | VS,1/SS,E,E,1/FS | E,E,E,E,E | SS,SS,1/FS, 1/FS,1/VS | FS,SS,SS,SS, FS | ||||
| 1/FS,E,1/FS, 1/FS,1/VS | SS,SS,1/VS, 1/FS,1/VS | FS,FS,1/FS, ES,1/FS | SS,SS,1/AS, 1/VS,1/VS | E,FS,FS, E,VS | E,E,E,E,E | 1/SS,E,VS, 1/VS,AS | ||||
| 1/SS,1/SS, FS,E,E | 1/SS,1/SS,1/AS,1/VS,1/SS | 1/SS,1/AS,1/AS,1/FS,1/VS | FS,FS,1/SS,1/FS,1/SS | SS,E,1/SS, SS,1/FS | 1/FS,1/FS,E,1/VS,1/VS | E,E,E,E,E | ||||
| E,E,E,E,E | 1/SS,1/SS,E,1/FS,1/FS | E,E,VS, E,VS | ||||||||
| 1/FS,1/SS,E,1/VS,1/VS | E,E,E,E,E | SS,SS,1/FS, 1/FS,1/VS | ||||||||
| E,VS,FS, E,VS | SS,1/SS,1/SS, 1/VS,1/VS | E,E,E,E,E |
| Place | Confidence | Place | Confidence | Place | Confidence | Place | Confidence |
|---|---|---|---|---|---|---|---|
| 0.11 | 0.13 | 0.05 | 0.16 | ||||
| 0.26 | 0.11 | 0.23 | 0.16 | ||||
| 0.18 | 0.20 |
| Transition | Confidence | Transition | Confidence | Transition | Confidence |
|---|---|---|---|---|---|
| 0.32 | 0.63 | 0.81 | |||
| 0.26 | 0.82 | 0.25 | |||
| 0.42 | 0.34 | 0.37 | |||
| 0.18 | 0.82 | 0.92 | |||
| 0.64 | 0.59 | 0.62 | |||
| 0.72 | 0.75 | 0.73 | |||
| 0.39 | 0.38 | 0.55 | |||
| 0.47 | 0.25 | ||||
| 0.27 | 0.87 |
| Method | ||||
|---|---|---|---|---|
| Interval type-2 fuzzy Petri net | 0.173 | 0.096 | 0.266 | 0.130 |
| Interval type-2 fuzzy VIKOR | 0.462 | 0.403 | 0.505 | 0.416 |
Disclaimer/Publisher’s Note: The statements, opinions and data contained in all publications are solely those of the individual author(s) and contributor(s) and not of MDPI and/or the editor(s). MDPI and/or the editor(s) disclaim responsibility for any injury to people or property resulting from any ideas, methods, instructions or products referred to in the content. |
© 2023 by the authors. Licensee MDPI, Basel, Switzerland. This article is an open access article distributed under the terms and conditions of the Creative Commons Attribution (CC BY) license (https://creativecommons.org/licenses/by/4.0/).
Share and Cite
Kan, Z.; Liang, Y.; Zhao, T.; Wang, X. Risk Assessment Model of Chemical Process Based on Interval Type-2 Fuzzy Petri Nets. Processes 2023, 11, 1304. https://doi.org/10.3390/pr11051304
Kan Z, Liang Y, Zhao T, Wang X. Risk Assessment Model of Chemical Process Based on Interval Type-2 Fuzzy Petri Nets. Processes. 2023; 11(5):1304. https://doi.org/10.3390/pr11051304
Chicago/Turabian StyleKan, Zhe, Yaxuan Liang, Taoyan Zhao, and Xiaolei Wang. 2023. "Risk Assessment Model of Chemical Process Based on Interval Type-2 Fuzzy Petri Nets" Processes 11, no. 5: 1304. https://doi.org/10.3390/pr11051304
APA StyleKan, Z., Liang, Y., Zhao, T., & Wang, X. (2023). Risk Assessment Model of Chemical Process Based on Interval Type-2 Fuzzy Petri Nets. Processes, 11(5), 1304. https://doi.org/10.3390/pr11051304