Abstract
In order to explore the evolution of physical and mechanical properties and acoustic emission (AE) characteristics of aluminum foam under fatigue and quasi-static compression from a microscopic point of view, the AE monitoring technology was used to analyze the deformation, hardening, and energy absorption characteristics of open-cell aluminum foam under quasi-static compression at different rates (2, 10 and 50 mm/min) and fatigue loading tests with different peak stress ratios k (k = maximum stress/yield stress) by means of MTS fatigue testing machine and CCD camera. The results indicated that under different compression rates, the AE ring down count had the same trend as the engineering stress–strain response of the specimens, the AE ring down count rate at the plastic deformation stage showed the same performance as the work hardening rate, and the AE energy absorption efficiency corresponded well to the experimental results. The specimen entered the densification stage with the stability of AE count and the decrease in energy absorption efficiency. During the fatigue tests of different k values, the change trend of strain was consistent with the response of acoustic emission characteristic parameters, and the fatigue compression damage caused by the deformation process of the specimen can be monitored by the change in AE characteristics. The AE characteristics can dynamically monitor the compression process and provide a new research method and idea for the study of mechanical properties of aluminum foam.
1. Introduction
As a porous metallic material with dual function and structure, aluminum foam has excellent properties such as sound absorption, heat insulation, electromagnetic shielding, low density, and high impact energy absorption capacity because of the existence of a large number of internal pores. Thus, it has extensive engineering application prospects in the fields of automobile, marine engineering, construction, and aerospace [1,2,3]; therefore, the in-depth study of its mechanical properties is very necessary.
In recent years, based on the pore size, porosity, relative density, heat treatment, and other parameters of open-cell aluminum foam materials, many scholars have systematically analyzed the mechanical properties of aluminum foam metal under static compression, dynamic compression, and impact conditions, and investigated the damage caused by deformation, sound absorption, energy absorption, and other mechanical characteristics of aluminum foam [4,5,6,7,8,9,10]. The theoretical, experimental, and simulation research status of lightweight porous metals and their sandwich structures were analyzed and discussed under quasi-static and dynamic impact loads by Jing et al. [11]. The results demonstrated that the transition process of foam metal materials from the elastic deformation stage to the plastic deformation stage and from the plastic deformation stage to the densification stage is slow and has no obvious characteristics. Thus, it is difficult to accurately define the yield and densification strains. Some scholars [12,13,14] proposed that the densification strain can be defined by the theoretical empirical formula, the strain corresponding to the tangent intersection of the curve of the plastic platform stage and the densification stage, and the strain corresponding to the maximum point of the energy absorption efficiency-strain curve. Thus, the densification strain can be determined by using the aforementioned procedure. The impact energy generated by the foam material and absorbed by the object during the free fall process was calculated and deduced by Milts J et al. [15]. To evaluate the energy absorption performance of the aluminum foam, they also proposed the energy absorption efficiency and the ideal energy absorption efficiency. The energy absorption efficiency is broadly used in the study of the energy absorption performance of various aluminum foams [16,17,18,19].
As the demand for aluminum foam applications is increasing and working conditions are becoming more complex, the determination of mechanical properties under fatigue loading conditions is also drawing more attention. Researchers have now explored the fatigue damage mechanism of foam materials based on experimental and numerical simulations. Zhao, Fan, and Linul [20,21,22] showed that the fatigue damage of closed-cell aluminum foam has a large dispersion under tensile and compressive fatigue tests. They found that the inhomogeneous cell structure is the reason for the large dispersion of fatigue crack propagation in closed-cell aluminum foam, and the obtained S-N curve can efficiently describe the fatigue of foam materials. To study and predict the service life of open-cell aluminum foam, low-cycle fatigue experiments were conducted on the specimen using sinusoidal cyclic loading by Salimi and Jigh et al. [23,24]. The results indicated that the aluminum foam material has a good fatigue loading capacity. Salimi [23] also suggested that in the stress range below 90% of the corresponding yield stress (R = 0), low-cycle fatigue hardly occurs. On this basis, the compressive fatigue properties of open-cell aluminum foam with porosity of 50%, 60%, and 70% were examined by Yang et al. [25]. They found that the fatigue strength of the specimen decreases linearly with the increase in porosity, and the initiation and propagation of fatigue cracks are the main failure mechanism of aluminum foam under compressive fatigue loading. Zhou et al. [26] observed and discussed the fatigue test results of open-cell aluminum foam from macro and micro perspectives, analyzed the effects of different heat treatments on the fatigue behavior of foam, and finally, put forward a simple compression–compression fatigue mechanism. Yan et al. [27]. investigated the fatigue performance of an Aluminum Foam Sandwich (AFS) structure and found that the fatigue failure of the structure is caused by the fatigue failure of the aluminum foam core. They also found three types of fatigue damage mechanisms by scanning electron microscopy. Ingraham et al. [28]. confirmed that the fatigue failure mode of Alporas aluminum foam under multiple strain amplitudes is independent of the strain amplitude, but it is caused by dense auxiliary crack propagation according to Digital Image (DIC) results. The material follows the Coffin–Manson relationship.
Acoustic emission (AE) is a dynamic non-destructive testing technique with high sensitivity and wide applicability, which can reveal the deformation and damage state of a specimen by collecting the elastic waves generated by the release of strain energy during the deformation and damage process [29]. It is commonly employed in the inspection of metallic materials and rocks. Numerous scholars [30,31,32,33,34,35,36,37] have monitored and characterized the damage behavior of gears, steel structures, foam metals with different matrix materials and preparation methods, and composite metal materials. The damage evolution characteristics are sensitively captured by predicting and measuring the compressive behavior and deformation mechanism, fatigue crack propagation, and residual life of parts through the variation characteristics of acoustic emission signals. The technique is also extensively utilized in the study of damage caused by deformation mechanisms in rocks [38,39,40,41]. While aluminum foam has similar pore characteristics to rocks and has the properties of metallic materials at the same time, little research has been carried out on open-cell aluminum foam, and completed studies on the compression and fatigue properties of open-cell aluminum foam using AE techniques are considerably sparse in China and abroad [42,43].
At present, aluminum foam has a wide range of engineering applications, and AE technology can dynamically monitor the loading process of the specimens, while research on open-cell aluminum foam carried out by domestic and foreign scholars using AE technology is rather scarce. In this study, the AE technique was employed to carry out experimental studies of quasi-static compression of open-cell aluminum foam at different rates and fatigue compression tests with different peak stress ratios. The results indicate that the damage characteristics, energy changes, and hardening characteristics of the specimen under compression are correlated with the AE ring down count, energy cumulation, and AE count rate. This enables the AE technique to provide a new research method and idea for further research and analysis of aluminum foam applications in engineering, and the AE technique has good potential for application in dynamic monitoring of the microscopic properties and failure mechanisms of aluminum foam under complex working conditions.
2. Experimental Scheme
The experimental materials were open-cell aluminum foam provided by a manufacturer. The composition of ZL102 alloy is shown in Table 1, and the manufacturing process of the specimen is shown in Figure 1. The pore size was 3–5 mm, the density was 1.2 ± 10% g/cm3, the relative density was 0.44, and the specimen size was 20 mm × 20 mm × 20 mm. To ensure that the basic parameters of the material were consistent, all specimens were cut from the same aluminum foam plate material. Quasi-static compression test and fatigue test were conducted on the MTS809.25 testing machine. The quasi-static compression rates were 2 mm/min, 10 mm/min, and 50 mm/min, and the fatigue test was loaded with a sine wave load with a frequency of 10 Hz (Figure 2). A constant fatigue load cycle ratio of R = 0.1 (R = /) was adopted, and the peak stress ratio was defined as , where (6 MPa) is the yield stress and k was chosen as 1.0, 1.1, 1.2, and 1.3,. Each group of experiments was repeated three times, a total of 9 specimens were subjected to quasi-static compression test, and fatigue tests were conducted on a total of 12 specimens.

Table 1.
Composition of ZL102 alloy (%).
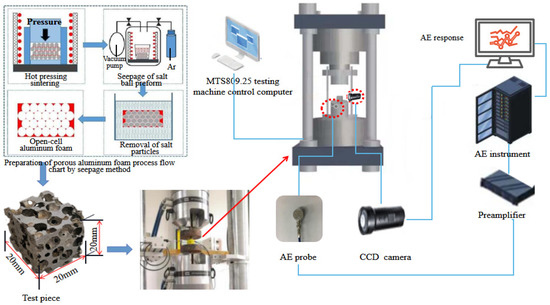
Figure 1.
Experimental process.
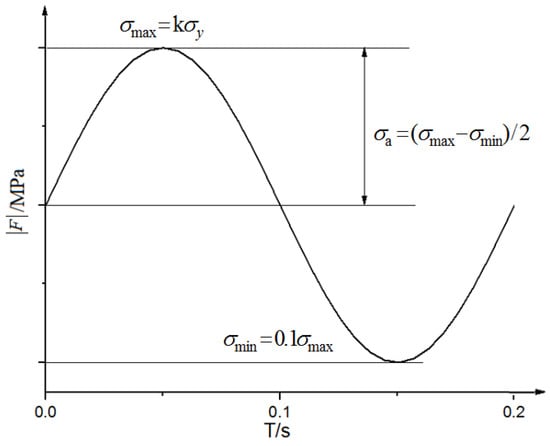
Figure 2.
Load curve of one fatigue cycle.
The AE instrument was the AMSY-6 type of Vallen, Germany. The sensor probe model was VS150-RIC. The specific parameters are shown in Table 2, and the resonant frequency response curve is shown in Figure 3, the threshold value was set to 40 dB, and the sampling rate was 1 MHz. The load and displacement data of the test machine were recorded simultaneously by using the external channel of the AE instrument. The metal material with the Kaiser effect was utilized in the base, and multiple loading and unloading cycles were carried out before the test to reduce the AE signal interference generated by the base during the experiment. The AE sensor was fixed on the base, and the sensor position is shown in Figure 1. The Vaseline coupling agent was applied on the surface of the specimen as a medium for transmitting acoustic signals. In this way, the elastic wave could effectively penetrate the measured object and effective detection could be achieved.
Table 2.
VS150-RIC transducer probe parameters.
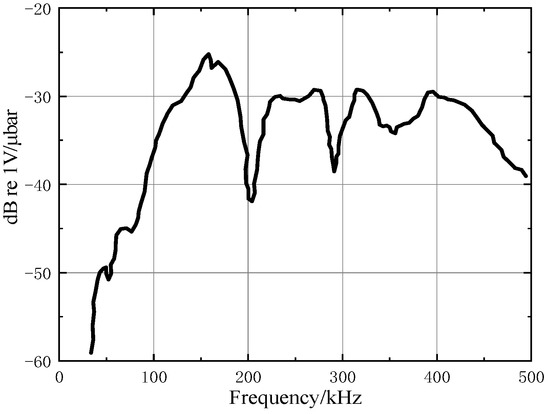
Figure 3.
Resonant frequency response curve of VS150-RIC sensor probe.
Note that the surface deformation of aluminum foam was observed and recorded by a CCD camera.
3. Experimental Results of Quasi-Static Compression
3.1. Engineering Stress–Strain Curve
The engineering stress–strain curve of open-cell aluminum foam obtained by quasi-static compression test is displayed in Figure 4. The results suggested that the engineering stress–strain curves obtained at different compression rates were the same, showing four stages of the elastic stage, the yield stage, the strengthened stage, and the densification stage [2,44]. There was no obvious distinction between the yield stage and the densification stage, and there was no evident yield point between the elastic stage and the yield stage [45]. The stress growth rate and stress value in the elastic deformation stage at the low compression rate were greater than those at the high compression rate. In the yield stage, the stress increased slowly with the strain, and the differences in the stress values at different compression rates were small. This indicated that the strain rate had little influence on the plastic deformation stage.
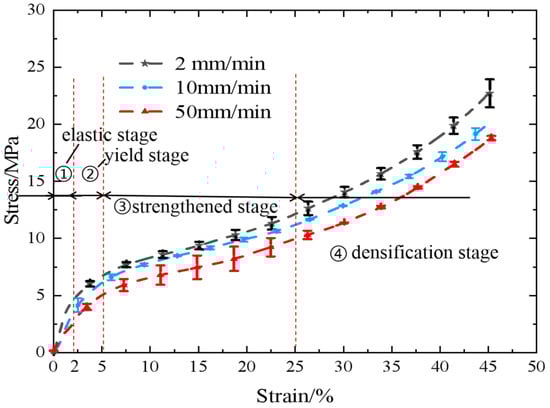
Figure 4.
The engineering stress–strain curve error bar diagram of open-cell aluminum foam in quasi-static compression test.
3.2. Deformation Characteristics of Surface Images
The surface images obtained by the CCD camera at different compression rates are exhibited in Figure 5. The results showed that obvious plastic deformation occurred in the thin wall of the cell pores and ribs of the specimen in the yield stage (Figure 5, ). At the beginning of densification, the cells started to collapse, and shear slip bands with an angle of 45° to the compression axis appeared on the surface, and multiple crushed bands appeared locally with the increase in strain (Figure 5, ). As the strain increases, the collapsed cells would be completely densified. Furthermore, the localization of deformation observed in this study was likely due to the inhomogeneous distribution of stresses within the specimen caused by its lower density [43], as the deformation curve of 50 mm/min compression suggested.
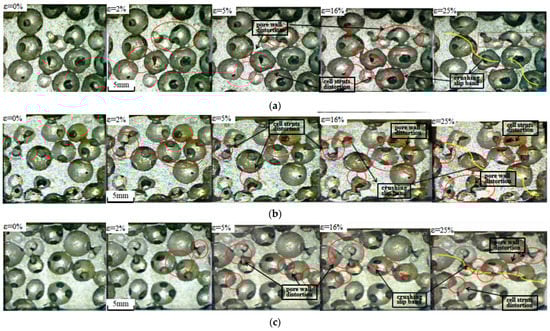
Figure 5.
CCD surface images of open-cell aluminum foam under quasi-static compression deformation at different rates: (a) 2 mm/min; (b) 10 mm/min; (c) 50 mm/min.
3.3. AE Response
The AE ring down count is the number of oscillations of the signal which crosses the threshold and can be calculated based on cumulative counts and count rates. This signal is easy to process and is widely employed for the evaluation of microscopic AE activity.
Figure 6 depicts a typical time-domain waveform of an AE event and its related parameters.
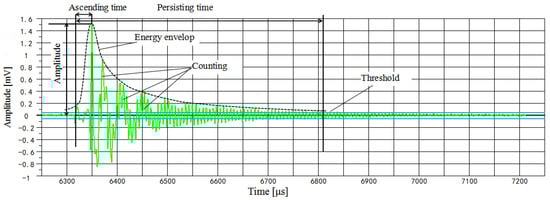
Figure 6.
A representative AE waveform.
Figure 7 displays the relationship between the engineering stress–strain curve and AE ring down counts obtained during quasi-static compression of open-cell aluminum foam. The results demonstrated that the ring down count values were larger in the elastic stage, due to the large signal generated at the moment of contact between the indenter and the specimen at the beginning of loading. Then the ring down count value exhibited a decreasing trend, indicating a decrease in the frequency of internal acoustic emission source events, such as the propagation of (micro) cracks within the specimen, and a reduction in the activity of the events, which was due to the entry of the specimen into the work hardening stage [46]. Finally, the ring down count values exhibited a gentle change trend after entering the compaction stage. The ring down count value was high and widely distributed at the smaller compression rate, suggesting that a smaller relative deformation rate of the specimen, more adequate deformation (the elastic wave released) and a larger cumulative value of the oscillation frequency of the AE signals [47]. At the larger compression rate, the ring down count value and distribution region were smaller at the smaller compression rate, indicating that because of the larger relative rate of deformation of the specimen, the region of elastic wave release was reduced during deformation. When the strain gradually increased, the ring down count gradually tended to level off, suggesting that the area of elastic deformation was less and that the specimen entered the compaction stage.
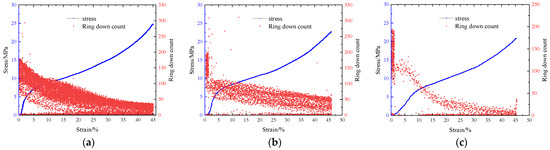
Figure 7.
Engineering stress–strain curves and AE ring down count relationships at various compression rates: (a) 2 mm/min; (b) 10 mm/min; (c) 50 mm/min.
3.4. AE Energy Count and Energy Absorption Efficiency
AE energy count [16,48,49] is considered to be proportional to the square of the amplitude value of the waveform in which the AE event is detected, which reflects the intensity of the AE event and is related to the strain rate or microscopic deformation mechanism of the material.
Figure 8 depicts the relationship between the engineering stress–strain curves and AE energy counts of open-cell aluminum foam during quasi-static compression tests. The results demonstrated that the energy counts in the elastic stage were generally high and the values fluctuated widely. This was attributed to the small deformation of the weak pore wall and prism in the structure, which resulted in the change in the cell shape (2% strain, see Figure 5). With the increase in strain, the energy count fluctuated less, and a number of high-energy burst-type AE signals were generated between the strain of 5–20%, indicating that the structure was fractured due to deformation of the specimen, with stress concentrations occurring in the weak areas of the prisms and pore walls (5% and 16% strain, see Figure 5). In the slip zone with a 45° angle to the compression direction of the specimen, the collapse deformation of the cell pores was obvious. Then, the specimen began to enter the densification stage. As the compression rate increased, the value of the energy count decreased, and the high energy burst-type signal also diminished, indicating that the deformation of the pore wall differed at different compression rates or there were some averaging effect, such as signal attenuation caused by experimental devices or other factors.
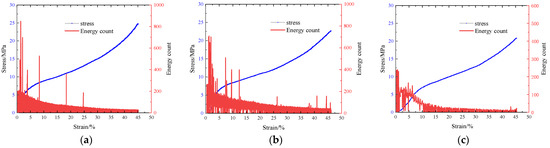
Figure 8.
Engineering stress–strain curves and AE energy count relationships at various compression rates: (a) 2 mm/min; (b) 10 mm/min; (c) 50 mm/min.
The AE energy (Es) is the area under the wave envelope of the AE signal. The cumulative energy counts of the AE signal in a certain period of time can be defined by the AE signal parameter () as follows [17,18]
where is the root mean square voltage value of AE, and is the mean square voltage value of AE. Through the AE energy count value, the AE energy absorption efficiency () can be calculated as follows:
where σm is t the corresponding engineering stress value. The energy absorption performance of aluminum foam can be evaluated by energy absorption efficiency. The integral area under the engineering stress–strain curve represents the energy absorbed per unit volume. That is:
where εm is an arbitrary strain. The energy absorption efficiency () [15,16] is defined as the ratio of the energy absorbed by the unit volume of aluminum foam to the corresponding stress, which is usually employed to determine the optimal energy absorption state of aluminum foam. That is:
Figure 9 exhibits the energy absorption efficiency curves of the open-cell aluminum foam specimens at different compression rates. The results indicated that the energy absorption efficiency remained stable during complete elastic deformation, and began to increase slowly in the yield stage. When the stress exceeded yield strength, the deformation of the specimen entered the hardening stage, and the energy absorption efficiency began to increase substantially. The energy absorption efficiency reached the maximum at a stress of about 12 MPa, which was about the strain when the cell pores of the corresponding specimen began to collapse (i.e., the strain was about 25%), where and , within the experimentally allowed error range. The decrease in energy absorption efficiency indicated that the plastic deformation region of the specimen lessened and the material entered the densification stage. Subsequently, the energy absorption efficiency diminished with the increase in strain during the densification stage. The energy absorption efficiency at low compression rates was greater than that at high compression rates, suggesting that the compression rate had a greater influence on the absorption efficiency.
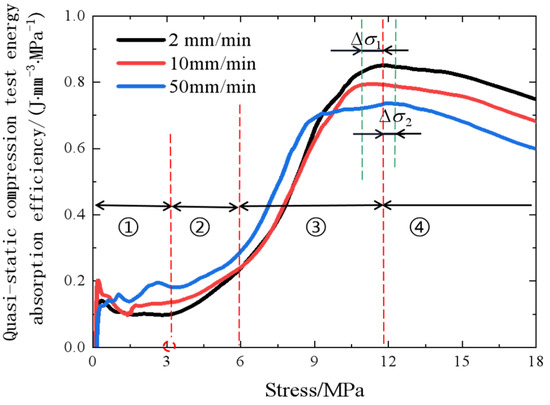
Figure 9.
Energy absorption efficiency curve of open-cell aluminum foam.
The AE energy absorption efficiency curve [18,50] obtained by Equation (2) is shown in Figure 10. The energy change curve of the AE signal had the same trend as the energy absorption efficiency curve of aluminum foam. At lower compression rates, fewer regions of plastic deformation occurred per unit of time, and the energy release process was slow but sufficient, which thus released more AE energy from acoustic emission.
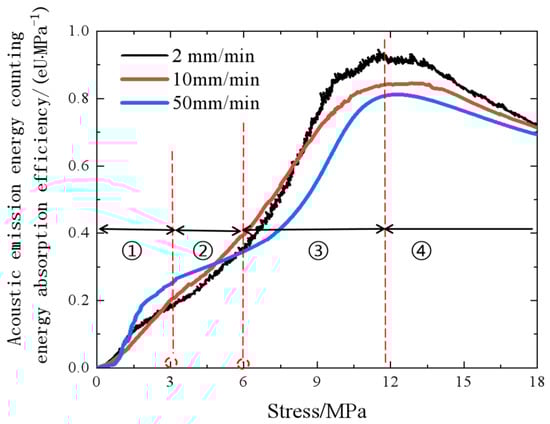
Figure 10.
AE energy absorption efficiency curve of open-cell aluminum foam.
3.5. Work Hardening Rate
The relationships between the work hardening rate, AE ring down count rate, and engineering strain of the specimen during quasi-static compression are displayed in Figure 11.
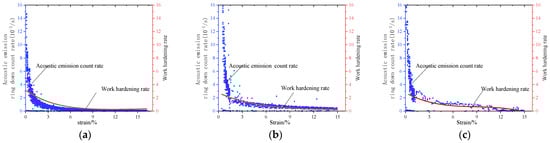
Figure 11.
Acoustic emission count rate versus work hardening rate at various compression rates. (a) 2 mm/min. (b) 10 mm/min. (c) 50 mm/min.
The AE ring down count rate is the ratio of ring down counts to signal acquisition time, also known as the AE count rate, and is the number of ringing that occurs per unit of time (”Seconds”) [29]. The work hardening rate reflects the relationship between stress and strain as plastic deformation increases, and most stress–strain curves follow the Holloman equation [51], which can be deduced from the following equation [50]:
where and are the stress and strain increments.
The results showed that the AE ring down count rate and the work hardening rate both had a slow decreasing trend during the plastic deformation stage. This was due to the grain boundary sliding [52] during the deformation of the specimen in the strengthened stage, the entanglement of dislocations, the elongation, fragmentation, and fibrosis of the grains, and the residual stress in the metal, so that less elastic waves were released during deformation and the ring down count rate decreased.
4. Analysis of Fatigue Test Results
4.1. AE Response
From the results of quasi-static compression tests, when the nominal strain was at 10%, the material deformation gradually began to make a transition from the hardening stage to the dense stage. Considering the results of Shunmugasamy [7], when the nominal strain reaches 10%, the number of cycles at this time is considered as the fatigue life.
Figure 12a–d shows the relationship between the AE ring down count, nominal strain, and the number of cycles of loading for the fatigue test of open-cell aluminum foam at peak stress ratios (k) of 1.0, 1.1, 1.2, and 1.3, respectively. The results revealed that the ring down counts at different k values all followed the same trend as the strain variation. At k = 1.0, the AE ring down count consisted of three stages before the specimen reached the fatigue life score. The first stage (0–3000 cycles) exhibited a rapid increase in strain and a rise in the ring down count; the second stage (3000–73,000 cycles) displayed a stable strain of about 7% with a continuous and stable change in the ring down count; the third stage (73,000–80,000 cycles) exhibited another rapid increase in strain to 10% with a simultaneous increase in the ring down count. At k = 1.1, k = 1.2, and k = 1.3, the changes in AE ring down counts were divided into two stages before the specimens reached fatigue life. The ring down count also raised rapidly at the beginning of loading, and the strain increased quickly to 9%, 10%, and 11%, respectively. Subsequently, the strain grew slowly and the ring down count did not fluctuate considerably, and the specimens reached the fatigue life at about 2000, 500, and 300 cycles, respectively.
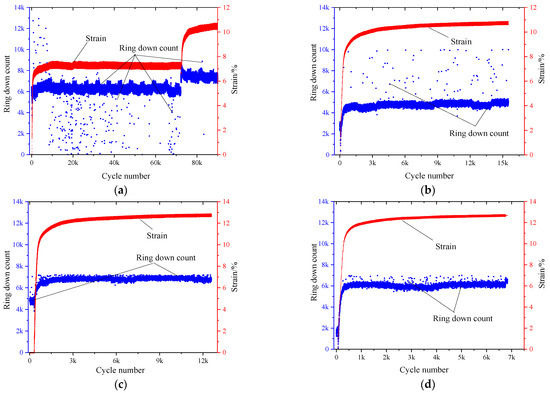
Figure 12.
AE ring down count versus the number of cycles and strain at different k values: (a) k = 1.0; (b) k = 1.1; (c) k = 1.2; (d) k = 1.3.
4.2. CCD Surface Images of Fatigue Test
Figure 13, Figure 14, Figure 15 and Figure 16 display the surface images acquired by the CCD camera during fatigue testing of open-cell aluminum foam specimens at different peak stress ratios k.
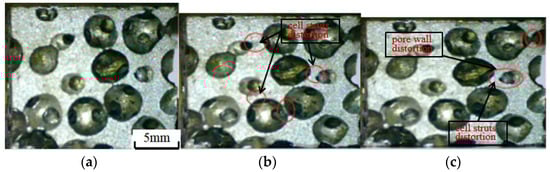
Figure 13.
Surface images of the specimen during fatigue test (k = 1.0): (a) 0 strain; (b) 5% strain; (c) 10% strain.
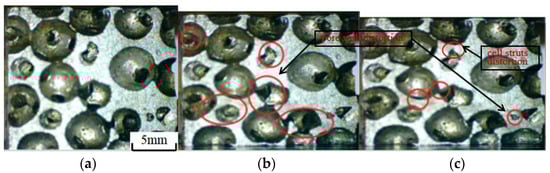
Figure 14.
Surface images of the specimen during fatigue test (k = 1.1): (a) 0 strain; (b) 5% strain; (c) 10% strain.
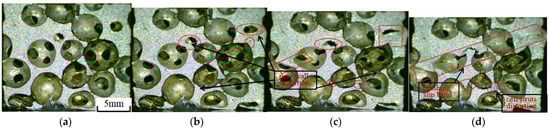
Figure 15.
Surface images of the specimen during fatigue test (k = 1.2): (a) 0 strain; (b) 5% strain; (c) 10% strain;(d) 12% strain.
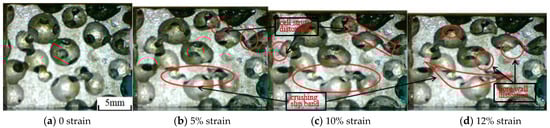
Figure 16.
Surface images of the specimen during fatigue test (k = 1.3): (a) 0 strain; (b) 5% strain; (c) 10% strain;(d) 12% strain.
The results manifested that the specimen was substantially deformed due to the compression of the pore wall and bars when the strain reached about 5%, and the strain cumulated with the increase in the number of cycles, and when the strain reached 10%, the specimen began to become dense. At k = 1.0, the shear deformation of the pore wall and fascia was small. At k = 1.1, the shear deformation of the pore walls and bars was uniform and no obvious collapse zone or deformation zone appeared. At k = 1.2, some of the cell pores were closed due to compression (Figure 15c). At k = 1.3, the specimen already exhibited obvious collapse deformation zones at 5% strain due to a larger load, the collapse of the pore walls, and severe shear deformation of the pore edges (Figure 16b).
The comparison of the macroscopic mechanisms of surface deformation of fatigue specimens at different peak stress ratios revealed that at larger peak stress ratios (k = 1.3, and k = 1.2), significant plastic deformation and collapsed deformation bands occurred in the cell struts and walls of the specimen at the beginning of loading. At smaller peak stress ratios (k = 1.1, and k = 1.0), the strain cumulated rapidly at the beginning of loading, the shape of the specimen cell pore changed significantly, and the pore wall shear deformation was small. As the loading continued, the rate of strain change slowed down, no collapse area or deformation band appeared, and the specimen deformation was manifested by compression deformation of the pore walls and part of the cell struts.
4.3. AE Cumulative Energy of Fatigue Test
Figure 17 shows the relationship between the logarithm of AE cumulative energy count and the strain during fatigue loading. The results showed that the AE cumulative energy counts under different peak stresses followed the same growth trend in the rapid growth stage of strain rate, and gradually converged to the same value until the strain rate slowed down. Subsequently, as the strain slowly increased, the AE cumulative energy counts at different k values began to increase to a maximum value with a similar growth curvature. When fatigue failure was reached (10% strain), the smaller the k value, the greater the AE cumulative energy count.
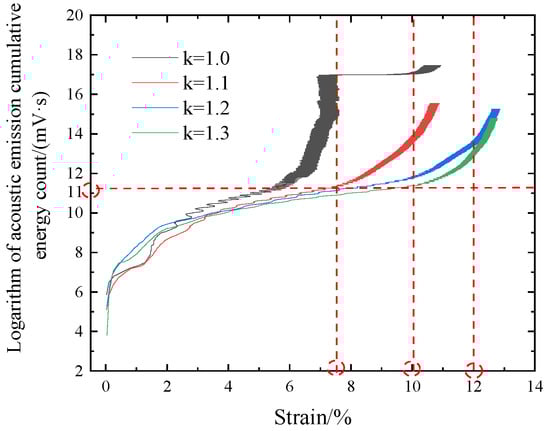
Figure 17.
The AE cumulative energy count versus strain for different peak stress ratios.
5. Conclusions
Through macroscopic analysis of CCD images and monitoring of AE microscopic response of open-cell aluminum foam specimens during quasi-static and fatigue compressions, the relationships between AE characteristic parameters and stress–strain, microscopic deformation mechanism, fatigue failure, and compression energy were investigated and the following conclusions were drawn:
- (1)
- The AE response during quasi-static compression at different compression rates were consistent with the trend of stress–strain variation. At low compression rates, the AE ring down counts were continuous and serried, and more high energy burst-type AE signals appeared when the cytosol collapsed and fractured in the structure. At high compression rates, the AE ring down counts were continuous and sparse, with larger relative rate of deformation and fewer high energy burst-type AE signals during the collapse of the cytosol.
- (2)
- The work hardening rate curve in the plastic deformation stage of the specimen had the same trend as the AE count rate, and the energy absorption efficiency had the same trend as the AE energy absorption efficiency during quasi-static compression. The engineering strain was around 25%, the energy absorption efficiency reached the maximum, and the energy absorption efficiency of the dense stage decreased.
- (3)
- The responses of AE characteristic parameters were consistent with the fatigue variation pattern of open-cell aluminum foam during fatigue loading with different peak stress ratios. The fatigue failure under high peak stress originated from local collapse due to plastic strain cumulation, and the fatigue failure under low peak stress stemmed from shear deformation of the overall pore wall of the specimen.
- (4)
- During fatigue loading, the deformation of open-cell aluminum foam entered the densification stage after reaching the fatigue life, the AE cumulative count reached its maximum value, the energy cumulative count was large at the low peak stress ratio, and the relative energy was large.
It was found that the response of AE ring down counts can be matched to the stress–strain response in each stage of fatigue loading of aluminum foams, and that the response of AE energy count could well-characterize the fatigue energy absorption characteristics of aluminum foams. Therefore, the AE technique can be considered to be more widely applied to the dynamic monitoring of fatigue damage characteristics of complex aluminum foam structures, which provides a new research idea for the subsequent study of multi-scale mechanical analysis of complex aluminum foam sandwich structures.
Author Contributions
Q.S.: Experiment, Calculation and data analysis, draft, Writing-review & editing. J.S.: Conceptualization, Methodology, Experiment, Review & editing. X.C.: Experiment, Calculation and data analysis, Writing-review. All authors have read and agreed to the published version of the manuscript.
Funding
This research received no external funding.
Data Availability Statement
Data available on request from the authors.
Conflicts of Interest
The authors declare no conflict of interest.
References
- Karuppasamy, R.; Barik, D. Production methods of aluminium foam: A brief review. Mater. Today Proc. 2020, 37, 1584–1587. [Google Scholar] [CrossRef]
- Wan, T.; Liu, Y.; Zhou, C.; Chen, X.; Li, Y. Fabrication, properties, and applications of open-cell aluminum foams: A review. J. Mater. Sci. Technol. 2021, 62, 11–24. [Google Scholar] [CrossRef]
- Kim, J.H.; Kim, D.; Lee, M.-G.; Lee, J.K. Multiscale Analysis of Open-Cell Aluminum Foam for Impact Energy Absorption. J. Mater. Eng. Perform. 2016, 25, 3977–3984. [Google Scholar] [CrossRef]
- Hajizadeh, M.; Yazdani, M.; Vesali, S.; Khodarahmi, H.; Mostofi, T.M. An experimental investigation into the quasi-static compression behavior of open-cell aluminum foams focusing on controlling the space holder particle size. J. Manuf. Process. 2021, 70, 193–204. [Google Scholar] [CrossRef]
- Jigh, B.H.G.; Toudeshky, H.H.; Farsi, M.A. Experimental and multi-scale analyses of open-celled aluminum foam with hole under compressive quasi-static loading. J. Alloys Compd. 2017, 695, 133–141. [Google Scholar] [CrossRef]
- Hangai, Y.; Ando, M.; Ohashi, M.; Amagai, K.; Suzuki, R.; Matsubara, M.; Yoshikawa, N. Compressive properties of two-layered aluminum foams with closed-cell and open-cell structures. Mater. Today Commun. 2020, 24, 101249. [Google Scholar] [CrossRef]
- Shunmugasamy, V.C.; Mansoor, B. Compressive behavior of a rolled open-cell aluminum foam. Mater. Sci. Eng. A 2018, 715, 281–294. [Google Scholar] [CrossRef]
- Zhang, X.; Wang, R.; Li, X.; Lu, C.; Wang, Z.; Wang, W. Energy Absorption Performance of Open-Cell Aluminum Foam and Its Application in Landing Buffer System. J. Mater. Eng. Perform. 2021, 30, 6132–6145. [Google Scholar] [CrossRef]
- Sharma, V.; Grujovic, N.; Zivic, F.; Slavkovic, V. Influence of Porosity on the Mechanical Behavior during Uniaxial Compressive Testing on Voronoi-Based Open-Cell Aluminium Foam. Materials 2019, 12, 1041. [Google Scholar] [CrossRef]
- Cao, X.-Q.; Wang, Z.-H.; Ma, H.-W.; Zhao, L.-M.; Yang, G.-T. Effects of heat treatment on dynamic compressive properties and energy absorption characteristics of open-cell aluminum alloy foams. Trans. Nonferrous Met. Soc. China 2006, 16, 159–163. [Google Scholar] [CrossRef]
- Lin, J.; Wang, Z.; Zhao, L.M. Advances in studies of the mechanical performance of cellular metals and related sandwich structures. Mech. Eng. 2015, 37, 1–24. (In Chinese) [Google Scholar]
- Lu, T.J.; Song, J.M. Characterization of close-celled cellular aluminum alloys. J. Mater. Sci. 2001, 36, 2773–2786. [Google Scholar] [CrossRef]
- Olurin, O.B.; Fleck, N.A.; Ashby, M.F. Deformation and fracture of aluminium foams. Mater. Sci. Eng. A 2000, 291, 136–146. [Google Scholar] [CrossRef]
- Tan, P.J.; Harrigan, J.J.; Reid, S.R. Inertia effects in uniaxial dynamic compression of a closed cell aluminium alloy foam. Mater. Sci. Technol. MST A Publ. Inst. Met. 2002, 18, 480–488. [Google Scholar] [CrossRef]
- Miltz, J.; Gruenbaum, G. Evaluation of cushioning properties of plastic foams from compressive measurements. Polym. Eng. Sci. 1981, 21, 1010–1014. [Google Scholar] [CrossRef]
- Li, J.; Wu, C.; Hao, H.; Liu, Z.; Yang, Y. Basalt scale-reinforced aluminum foam under static and dynamic loads. Compos. Struct. 2018, 203, 599–613. [Google Scholar] [CrossRef]
- Zhang, L.; Shi, J.; Li, C.B.; Tang, T.; Ouyang, H. Study on acoustic emission characteristics of quasi-static compression for aluminum foam. Suxing Gongcheng Xuebao/J. Plast. Eng. 2018, 25, 189–194. (In Chinese) [Google Scholar]
- Liu, D.Z.; Cheng, X.; Liu, H.; Shen, H.T.; Hua, Z.S.; He, S.W. Improved energy absorption capacity of closed-cell aluminum foams by electroplating. Surf. Eng. 2022, 38, 166–173. [Google Scholar]
- Wang, B.; Wu, B.Y.; Zhou, X.W.; Zhang, W.C. Quasi-static compression test and energy absorption characteristics of closed-cell aluminum foam. J. Foshan Univ. (Nat. Sci. Ed.) 2022, 2, 40. (In Chinese) [Google Scholar]
- Zhao, M.; Fan, X.; Wang, T. Fatigue damage of closed-cell aluminum alloy foam: Modeling and mechanisms. Int. J. Fatigue 2016, 87, 257–265. [Google Scholar] [CrossRef]
- Fan, X.; Zhao, M.; Wang, T. Experimental investigation of the fatigue crack propagation in a closed-cell aluminum alloy foam. Mater. Sci. Eng. A 2017, 708, 424–431. [Google Scholar] [CrossRef]
- Linul, E.; Şerban, D.A.; Marsavina, L.; Kovacik, J. Low-cycle fatigue behaviour of ductile closed-cell aluminum alloy foams. Fatigue Fract. Eng. Mater. Struct. 2016, 40, 597–604. [Google Scholar] [CrossRef]
- Salimi, H.; Hajizadeh, M.; Kalhori, M.R.; Jalili, S.; Yazdani, M. Low-cycle fatigue assessment of open-cell A332 aluminum alloy foams. Int. J. Fatigue 2022, 159, 106797. [Google Scholar] [CrossRef]
- Jigh, B.H.G.; Hosseini-Toudeshky, H.; Farsi, M.A. Low cycle fatigue analyses of open-celled aluminum foam under compression–compression loading using experimental and microstructure finite element analysis. J. Alloys Compd. 2019, 797, 231–236. [Google Scholar] [CrossRef]
- Yang, X.; Hu, Q.; Du, J.; Song, H.; Zou, T.; Sha, J.; He, C.; Zhao, N. Compression fatigue properties of open-cell aluminum foams fabricated by space-holder method. Int. J. Fatigue 2019, 121, 272–280. [Google Scholar] [CrossRef]
- Zhou, J.; Soboyejo, W.O. Compression–compression fatigue of open cell aluminum foams: Macro-/micro- mechanisms and the effects of heat treatment. Mater. Sci. Eng. A 2004, 369, 23–35. [Google Scholar] [CrossRef]
- Yan, C.; Wang, J.; Song, X. Fatigue behavior and damage mechanism of aluminum foam sandwich with carbon-fiber face-sheets. J. Mech. Sci. Technol. 2020, 34, 1119–1127. [Google Scholar] [CrossRef]
- Ingraham, M.; DeMaria, C.; Issen, K.; Morrison, D. Low cycle fatigue of aluminum foam. Mater. Sci. Eng. A 2009, 504, 150–156. [Google Scholar] [CrossRef]
- Shen, G.T.; Geng, R.S.; Liu, S.F. Parameter analysis of acoustic emission signals. Nondestruct. Test. 2002, 24, 72–77. [Google Scholar]
- Loanapakul, T.; Otsuka, Y.; Mutoh, Y. Fatigue and Acoustic Emission Behavior of Plasma Sprayed HAp Top Coat and HAp/Ti Bond Coat with HAp Top Coat on Commercially Pure Titanium. Key Eng. Mater. 2010, 452–453, 857–860. [Google Scholar] [CrossRef]
- Price, E.D.; Lees, A.W.; Friswell, M.I. Detection of severe sliding and pitting fatigue wear regimes through the use of broadband acoustic emission. Arch. Proc. Inst. Mech. Eng. Part J J. Eng. Tribol. 2005, 219, 85–98. [Google Scholar] [CrossRef]
- Fang, D.; Berkovits, A. Evaluation of fatigue damage accumulation by acoustic emission. Fatigue Fract. Eng. Mater. Struct. 2010, 17, 1057–1067. [Google Scholar] [CrossRef]
- Tanvir, F.; Sattar, T.; Mba, D.; Edwards, G. Identification of fatigue damage evaluation using entropy of acoustic emission waveform. SN Appl. Sci. 2019, 2, 138. [Google Scholar] [CrossRef]
- Marfo, A.; Chen, Z.; Li, J. Acoustic emission analysis of fatigue crack growth in steel structure. Acad. J. 2013, 4, 239–249. [Google Scholar]
- Park, H.; Hong, K.; Kang, J.S.; Um, T.; Knapek, M.; Minárik, P.; Sung, P.; Mathis, Y.E.; Yama-moto, K.; Kim, A.; et al. Acoustic emission analysis of the compressive deformation of iron foams and their biocompatibility study. Mater. Sci. Eng. C. Mater. Biogical Appl. 2019, 97, 367–376. [Google Scholar] [CrossRef]
- Brown, J.; Vendra, L.J.; Rabiei, A. Bending properties of Al-steel and steel-steel composite metal foams. Metall. Mater. Trans. A Phys. Metall. Mater. Sci. 2010, 41, 2784–2793. [Google Scholar] [CrossRef]
- Jenei, P.; Kádár, C.; Szabó, Á.; Hung, S.M.; Kuo, C.J.; Choe, H.; Gubicza, J. Mechanical behavior of freeze-cast Ti foams with varied porosity. Mater. Sci. Eng. A 2022, 855, 143911. [Google Scholar] [CrossRef]
- Yuan, A.; Hou, J.; Yin, Z. The Force Chain and Acoustic Emission Response Law for the Uniaxial Compression of Rock. Geotech. Geol. Eng. 2020, 38, 4479–4499. [Google Scholar] [CrossRef]
- Guo, J.; Shang, W.; Yuan, J.; Liu, Z. Mechanical Behaviors and Damage Evolution Characteristics of Predamaged Rock under Triaxial Compression Experiment. Adv. Mater. Sci. Eng. 2022, 2022, 1–13. [Google Scholar] [CrossRef]
- Kourkoulis, S.K.; Pasiou, E.D.; Dakanali, I.; Stavrakas, I.; Triantis, D. Notched marble plates under tension: Detecting prefailure indicators and pre-dicting entrance to the “critical stage”. Fatigue Fract. Eng. Mater. Struct. 2017, 41, 776–786. [Google Scholar] [CrossRef]
- Du, K.; Liu, M.; Yang, C.; Tao, M.; Feng, F.; Wang, S. Mechanical and Acoustic Emission (AE) Char-acteristics of Rocks under Biaxial Confinements. Appl. Sci. 2021, 11, 769. [Google Scholar] [CrossRef]
- Brothers, A.; Prine, D.; Dunand, D. Acoustic emissions analysis of damage in amorphous and crystalline metal foams. Intermetallics 2007, 14, 857–865. [Google Scholar] [CrossRef]
- Kádár, C.; Chmelĺk, F.; Cieslar, M.; Lendvai, J. Acoustic emission of salt-replicated foams during compres-sion. Scr. Mater. 2008, 59, 987–990. [Google Scholar] [CrossRef]
- BS 10/30203543 DC.BS ISO 13314; Mechanical Testing of Metals. Ductility Testing. Compression Test for Porous and Cellular Metals.2010.11.18. International Organization for Standardization: Geneva, Switzerland, 2011.
- Cluff, D.R.A.; Esmaeili, S. Prediction of the effect of artificial aging heat treatment on the yield strength of an open-cell alu-minum foam. J. Mater. Sci. 2008, 43, 1121–1127. [Google Scholar] [CrossRef]
- Oh, K.H.; Jung, C.; Yang, Y.; Han, K.S. Acoustic Emission Behavior during Fatigue Crack Propagation in 304 Stainless Steel. Key Eng. Mater. 2004, 261–263, 1325–1330. [Google Scholar] [CrossRef]
- Wang, W.; Du, G.; Zeng, Z.; Deng, W.; Song, S. Acoustic emission characteristics of corrosion process of 304 nitrogen controlled stainless steel in acidic NaCl solution. Huagong Xuebao/CIESC J. 2010, 61, 916–922. [Google Scholar]
- Miller, R.K.; Mcintier, P. (Eds.) Nondestructive Testing Hand-Book: 5—Acoustic Emission Testing; ASNT: Columbus, OH, USA, 1987. [Google Scholar]
- Wang, Z.; He, A.; Shi, G.; Mei, G. Temperature Effect on AE Energy Characteristics and Damage Mechanical Behaviors of Granite. Int. J. Géoméch. 2018, 18. [Google Scholar] [CrossRef]
- Sun, J.; Huang, Z.Y.; Li, J.H.; Wang, P.; Wu, X.M. Study on the critical condition and deformation mechanism of dynamic recrystallization of novel lightweight steel based on the work hardening rate. Mater. Guide 2022, 19, 36. (In Chinese) [Google Scholar]
- Chen, B.D.; Guo, F.; Wen, J.; Ma, W.; Cai, H.S.; Liu, L. High temperature plastic deformation constitutive model and rheological behavior prediction of Mg-Zn-Zr-Y alloy. Rare Met. Mater. Eng. 2017, 46, 6. (In Chinese) [Google Scholar]
- Van Der Giessen, E.; Tvergaard, V. Micromechanics of intergranular creep failure under cyclic loading. Acta Mater. 1996, 44, 2697–2710. [Google Scholar] [CrossRef]


Disclaimer/Publisher’s Note: The statements, opinions and data contained in all publications are solely those of the individual author(s) and contributor(s) and not of MDPI and/or the editor(s). MDPI and/or the editor(s) disclaim responsibility for any injury to people or property resulting from any ideas, methods, instructions or products referred to in the content. |
© 2023 by the authors. Licensee MDPI, Basel, Switzerland. This article is an open access article distributed under the terms and conditions of the Creative Commons Attribution (CC BY) license (https://creativecommons.org/licenses/by/4.0/).