Article

The Beneficial Effect of Salicornia herbacea Extract and Isorhamnetin-3-O-glucoside on Obesity

1
College of Korean Medicine, Gachon University, Seongnam 13120, Republic of Korea
2
Department of Plant Science and Technology, Chung-Ang University, Anseong 17546, Republic of Korea
3
Department of Food Science and Biotechnology, Kyonggi University, Suwon 16227, Republic of Korea
4
College of Pharmacy, Sahmyook University, Seoul 01795, Republic of Korea
*
Authors to whom correspondence should be addressed.
Processes 2023, 11(4), 977; https://doi.org/10.3390/pr11040977
Submission received: 22 January 2023 / Revised: 10 March 2023 / Accepted: 21 March 2023 / Published: 23 March 2023

Abstract

:
Salicornia herbacea is a halophyte indigenous to marine coastal areas and salt fields and has been used as a traditional remedy for diarrhea, abdominal pain, constipation, and indigestion. Its component isorhamnetin-3-O-glucoside (IR3G) may have antioxidant, anti-inflammatory, and anti-adipogenic properties. In the present study, we aimed to investigate the anti-obesity effect of S. herbacea extract and IR3G on mouse 3T3-L1 adipocytes and db/db obesity mice. S. herbacea extract and IR3G inhibited lipase in a concentration-dependent manner. Oil Red O staining disclosed that S. herbacea extract and IR3G significantly suppressed lipid accumulation and adipogenesis and also inhibited the expression of the C/EBPα in the 3T3-L1 adipocytes. In experiments using db/db mice, administering of S. herbacea extract limited body weight gain and significantly reduced feed efficiency and adipose tissue weight. Moreover, analyzing blood triglycerides, total cholesterol, high-density lipoprotein, and low-density lipoprotein, it was confirmed that LDL was significantly decreased and total cholesterol slightly reduced by S. herbacea extract. However, there was no significant change by S. herbacea extract in the changes in blood levels of leptin and adiponectin. Taken together, these results suggest that S. herbacea extract and IR3G inhibit adipogenesis by suppressing the pro-adipogenic transcription factors in 3T3-L1 preadipocytes and prevent obesity by regulating the blood lipid profile as well as the weight of adipose tissue.

1. Introduction

Obesity is a medical condition in which body fat accumulates due to imbalanced energy metabolism [1,2,3]. It mainly results from calorie intake exceeding expenditure. However, it is also caused by genetic, psychological, and endocrine factors and drug side effects [4,5]. Obesity is an early manifestation of metabolic diseases, such as type 2 diabetes mellitus and cardiovascular diseases. Moreover, it may increase the risks of breast and colorectal cancer [6,7]. Obese children are negatively perceived by their peers and may withdraw socially or exhibit aggressive behavior [8]. Obesity may be ameliorated through lifestyle modification, including diet control, exercise, and medical procedures such as bariatric/gastric sleeve surgery [3,9,10]. Lorcaserin, liraglutide, phentermine/topiramate, naltrexone/bupropion, ibutramine, and orlistat—approved by the USA Food and Drug Administration (FDA)—have been used for obesity. However, in 2010, the non-psychotropic obesity treatment—Sibutramine—inhibited the reuptake of norepinephrine, serotonin, and dopamine. It also reduced appetite and increased energy consumption via the central nervous system. The FDA withdrew it from circulation due to side effects, such as insomnia, asthenia, dry mouth, and cardiac side effects, discovered on administering it to patients [11]. In addition, other central-nervous-system-stimulating drugs also cause many side effects, such as depression, anxiety, headaches, dizziness, nausea, and fatigue [11,12,13]. Orlistat is the only drug that can be used long term and is still being used. Orlistat acts on lipase—a lipolytic stomach and pancreas enzyme—and reduces fat absorption during food intake. However, digestive system side effects, steatorrhea, and fecal incontinence have been observed [11].
A cascade of transcription factors that interact in a complex fashion to control the expression of several hundred adipogenic genes regulates the differentiation of preadipocytes into mature fat cells [14,15]. Among them, CCAAT-enhancer-binding proteins (C/EBPs) and the peroxisome-proliferator-activated receptors (PPAR) family of nuclear hormone receptors are key adipogenesis activators. The C/EBPs are one of the basic leucine zipper (bZIP) transcription factors, with a C-terminal leucine zipper domain for dimerization and a basic domain for binding to DNA [16]. C/EBPs comprise α, β, δ, γ, ε, and ζ, which can homo- and heterodimerize. α, β, and δ are crucial to regulating adipose tissue development in mice [17]. In contrast, only the γ form of the PPAR family regulates adipogenesis in vitro and in vivo [18]. PPARγ exists as two isoforms—γ1 and γ2—which share almost all the same exon sequences. PPARγ and CCAAT/enhancer-binding protein (C/EBPα) induce each other to accelerate adipogenesis [19,20]. Chromatin immunoprecipitation combined with microarray analysis or deep sequencing studies revealed that binding sites of PPARγ and C/EBPα are associated with their binding. Some target genes are activated by both transcription factors [21,22]. These indicated that PPARγ and C/EBPα regulate many unrecognized genes.
Salicornia herbacea is known as “glasswort” or “Tungtungmadi”. This salt-tolerant terrestrial plant occurs along marine coastlines and the shores of salt lakes [23]. S. herbacea is a folk medicine for vision loss, indigestion, constipation, hepatitis, and kidney disease [24,25]. It has recently been used as an ingredient in certain culinary recipes [26,27]. Recent studies on S. herbacea have demonstrated its antioxidant [28,29], anti-inflammatory [30], and antihyperglycemic efficacy [31]. Its physiological activity and use in cosmetic materials have also been investigated [32]. Isorhamnetin-3-O-glucoside (IR3G) was isolated from glasswort, and Park and Kim [33] reported its antioxidant ability. In IR3G, a glucose molecule is bound to isorhamnetin, and its antioxidant [34] and anti-inflammatory activities [35] have been reported. This study investigated the anti-adipogenesis of S. herbacea extract and IR3G on mouse 3T3-L1 preadipocytes. We evaluated the anti-obesity efficacy of S. herbacea extract and IR3G in obese db/db mice.

2. Materials and Methods

2.1. Salicornia herbacea Extraction and IR3G Isolation

S. herbacea was obtained from Suncheonman Byeolryang Yeomjeon (Suncheon, Republic of Korea) and identified by Prof. J. S. Choi, Pukyong National University, Korea. A voucher specimen (No. LEE2016-01) was deposited in the Department of Plant Science and Technology herbarium, Chung-Ang University, Korea. The extraction and isolation of IR3G from S. herbacea were described in previous studies [36,37]. Briefly, finely crushed S. herbacea was extracted with 50% ethanol for 3 h. The extract was suspended in water, and a fraction was obtained after shaking with ethyl acetate. A portion of the ethyl acetate fraction was chromatographed on silica gel and eluted with a gradient of CH2Cl2 and MeOH to extract IR3G.

2.2. Cells and Reagents

The 3T3-L1 cells used in this study were purchased from the Korea Cell Line Bank (KCLB, Seoul, Republic of Korea). Dulbecco’s modified Eagle’s medium, penicillin–streptomycin, and phosphate-buffered saline were purchased from WELGENE Inc. (Daegu, Republic of Korea). Fetal bovine serum was supplied by Gibco BRL (Carlsbad, CA, USA). Lipase activity assay kit (MAK046), orlistat (≥98%, O4139), Oil Red O (ORO), 3-isobutyl-1-methylxanthine (IBMX), dexamethasone (DEX), insulin, and chloroform were purchased from Sigma-Aldrich Co. (St. Louis, MO, USA). Formaldehyde and isopropanol were obtained from Bio Basic Inc. (Markham, ON, Canada), and TRIzol® was purchased from Life Technologies (Carlsbad, CA, USA).

2.3. High-Performance Liquid Chromatography (HPLC)

An Agilent 1260 HPLC system and an INNO C18 column (25 cm × 4.6 mm, 5 µm; Young Jin Biochrom Co., Ltd., Seongnam, Republic of Korea) were used for HPLC. The column temperature was set to 25 °C, the flow rate was 1.0 mL/min, 10 μL was injected, and the mobile phase is presented in Table 1. The absorption was measured at 270 nm and compared with the standard solution.

2.4. Lipase Inhibitory Activity

The lipase inhibitory activity was analyzed using the lipase activity assay kit according to the manufacturer’s instructions. Briefly, S. herbacea extract (10, 100, and 500 µg/mL), IR3G (10, 100, and 500 µM), and orlistat (10 µM) were prepared. Then, we dispensed 50 μL of each solution into the 96-well plate. Following this, 100 μL of the lipase activity assay kit’s reaction solution was added to a 96-well plate and allowed to proceed at 37 °C for 90 min. In another study [28], orlistat was a positive control. The absorbance was measured at 570 nm using a microplate reader (Molecular Devices, Sunnyvale, CA, USA).

2.5. Cytotoxicity of S. herbacea Extract and IR3G in 3T3-L1 Preadipocytes

The cytotoxicity of the S. herbacea extract and IR3G on 3T3-L1 cells were evaluated using the EZ-Cytox assay. The S. herbacea extract and IR3G at the indicated concentrations were used to treat 3T3-L1 preadipocytes grown to confluence, with each treatment lasting for 24 h. After 24 h, the cells were centrifuged, and the supernatants containing the S. herbacea extract and IR3G were completely removed. Then, they were added to the EZ-Cytox solution, and the mixture was incubated at 37 °C in a CO2 incubator for 1 h. The absorbance of each sample was measured at 550 nm using a microplate reader (Molecular Devices, Sunnyvale, CA, USA).

2.6. Adipocyte Differentiation

Adipocyte differentiation was induced as previously described [38]. Briefly, to induce the differentiation of 3T3-L1 preadipocytes into mature adipocytes, the cells were seeded into a 6-well plate. The next day, the medium containing MDI solution (0.5 mM IBMX, 0.25 μM DEX, 167 nM insulin, and 100 µM indomethacin) was changed. After two days, the medium containing insulin (167 nM) was replaced. A medium containing new insulin replaced the old medium every two days. S. herbacea extract (100, 250, and 500 µg/mL) and IR3G (10, 100, and 250 µM) were added during differentiation (8 days in total) to observe the inhibitory effect on adipogenesis. The degree of adipocyte differentiation was evaluated using Oil Red O staining.

2.7. Intracellular Lipid Accumulation Staining (Oil Red O Staining)

The ORO staining technique investigated intracellular lipid droplets in mature 3T3-L1 cells. Differentiated 3T3-L1 cells were fixed with 0.6% glutaraldehyde at room temperature for 1 h, washed with 60% isopropyl alcohol, and stained with 0.4% ORO solution at room temperature for 20 min. The stained cells were photographed and quantified by measuring the absorbance at 570 nm after dissolving the ORO solution with 100% isopropyl alcohol. Intracellular lipid accumulation was observed under a microscope (IX51, Olympus, Tokyo, Japan).

2.8. Immunoblotting

The 3T3-L1 cells were lysed on ice using a lysis buffer (Biosesang, Daejeon, Republic of Korea). The lysed cells were centrifuged at 12,000 rpm for 15 min. The supernatant was collected, and the protein was quantified. Then, 10% SDS polyacrylamide gel electrophoresis was performed to separate the proteins. Next, proteins in the gel were transferred to PVDF Membrane (Amersham Protran Premium 0.2 μm NC, GE Healthcare Life Sciences, Germany) and blocked with 5% skimmed milk for 1 h. Thereafter, the membrane was incubated with primary antibodies overnight at 4 °C. Then, secondary antibodies were added, and the reaction was allowed to proceed at room temperature for 2 h. After the reaction, an enhanced chemiluminescence reagent (GE Healthcare, UK) was applied to the membrane, and the products were detected using a FUSION Solo apparatus (Vilber Lourmat, Marne, France).

2.9. Experimental Animals and Their Care

All the experimental animals were male C57BL/KsJ-leprdb/leprdb (db/db) mice and lean heterozygote littermate (db/-) mice, which constituted the normal group (5-week-old; Doo Yeol Biotech, Seoul, Republic of Korea). The mice were allowed to acclimate to the laboratory conditions for a week before the experiments. During the acclimation, the animals were divided into groups of three mice each. Each group was housed in a separate cage. The cages were maintained at constant temperature (20–25 °C) and humidity (30–35%), with a 12 h light/dark cycle. The mice had ad libitum access to their standard diet (RodFeed, DBL, Eumseong, Republic of Korea) and water. Body weight and food intake were measured weekly. The degree of obesity was measured on the basis of body weight gain and feed efficiency. The body weight gain was calculated by subtracting the initial weight from the last weight measured during the experimental period. The feed efficiency was calculated using the following formula: feed efficiency (%) = body weight gain (g)/food intake (g) × 100. The Animal Research Ethics Committee of Gachon University approved the animal testing protocols (GAICUC-GIACUC-R2019033).

2.10. Animal Experimental Design

The experiment was conducted for five weeks. Experimental animals were divided into five groups, comprising six mice each: (1) a normal group with wild-type mice that received the CMC solution, (2) the experimental control group with mice containing the db/db gene mutation that received CMC, (3) low-dose S. herbacea groups with mice containing the db/db gene mutation that received S. herbacea extract (50 mg/kg), (4) high-dose S. herbacea groups containing mice with the db/db gene mutation that received S. herbacea extract (200 mg/kg), and (5) IR3G groups with mice containing the db/db gene mutation that received IR3G extract (50 mg/kg). All samples were dissolved in CMC and orally administered daily for 20 days. Epididymal tissue weight was measured after the animals were sacrificed.

2.11. Blood Biochemical Analysis

For blood collection, the animals were fasted for 18 h before sacrifice. Then, they were anesthetized with ethyl ether, and blood was collected from the abdominal vena cava. After incubation at room temperature for 30 min, the blood samples were centrifuged at 2500 RPM. Then, the serum was collected and used for blood analysis. Blood leptin and adiponectin levels were measured using the Mouse/Rat Leptin ELISA kit (R&D Systems, MOB00B) and the Mouse Adiponectin ELISA kit (Abcam, ab108785). Blood leptin and adiponectin were analyzed following the ELISA kits’ instructions. The serum triglyceride (TG), total cholesterol (TC), high-density lipoprotein (HDL), and low-density lipoprotein (LDL) in 100 µL blood serum samples were examined using a Hitachi 7020 Automatic Analyzer (Hitachi, Tokyo, Japan).

2.12. Statistical Analysis

All numerical values were expressed as mean ± standard deviation (SD) of triplicate experiments. Statistical analysis was performed using the one-way ANOVA followed by Tukey’s post hoc test. Statistical analysis was performed using the SPSS software package for Windows (version 19, SPSS Inc., Armonk, NY, USA).

3. Results

3.1. High-Performance Liquid Chromatography

S. herbacea extracts were analyzed using HPLC. IR3G was analyzed within 60 min and detected at 270 nm (UV) after 12.192 min. Its concentration was 2.327 mg/g S. herbacea extract (Figure 1).

3.2. Effects of S. herbacea and IR3G on Lipase Inhibition

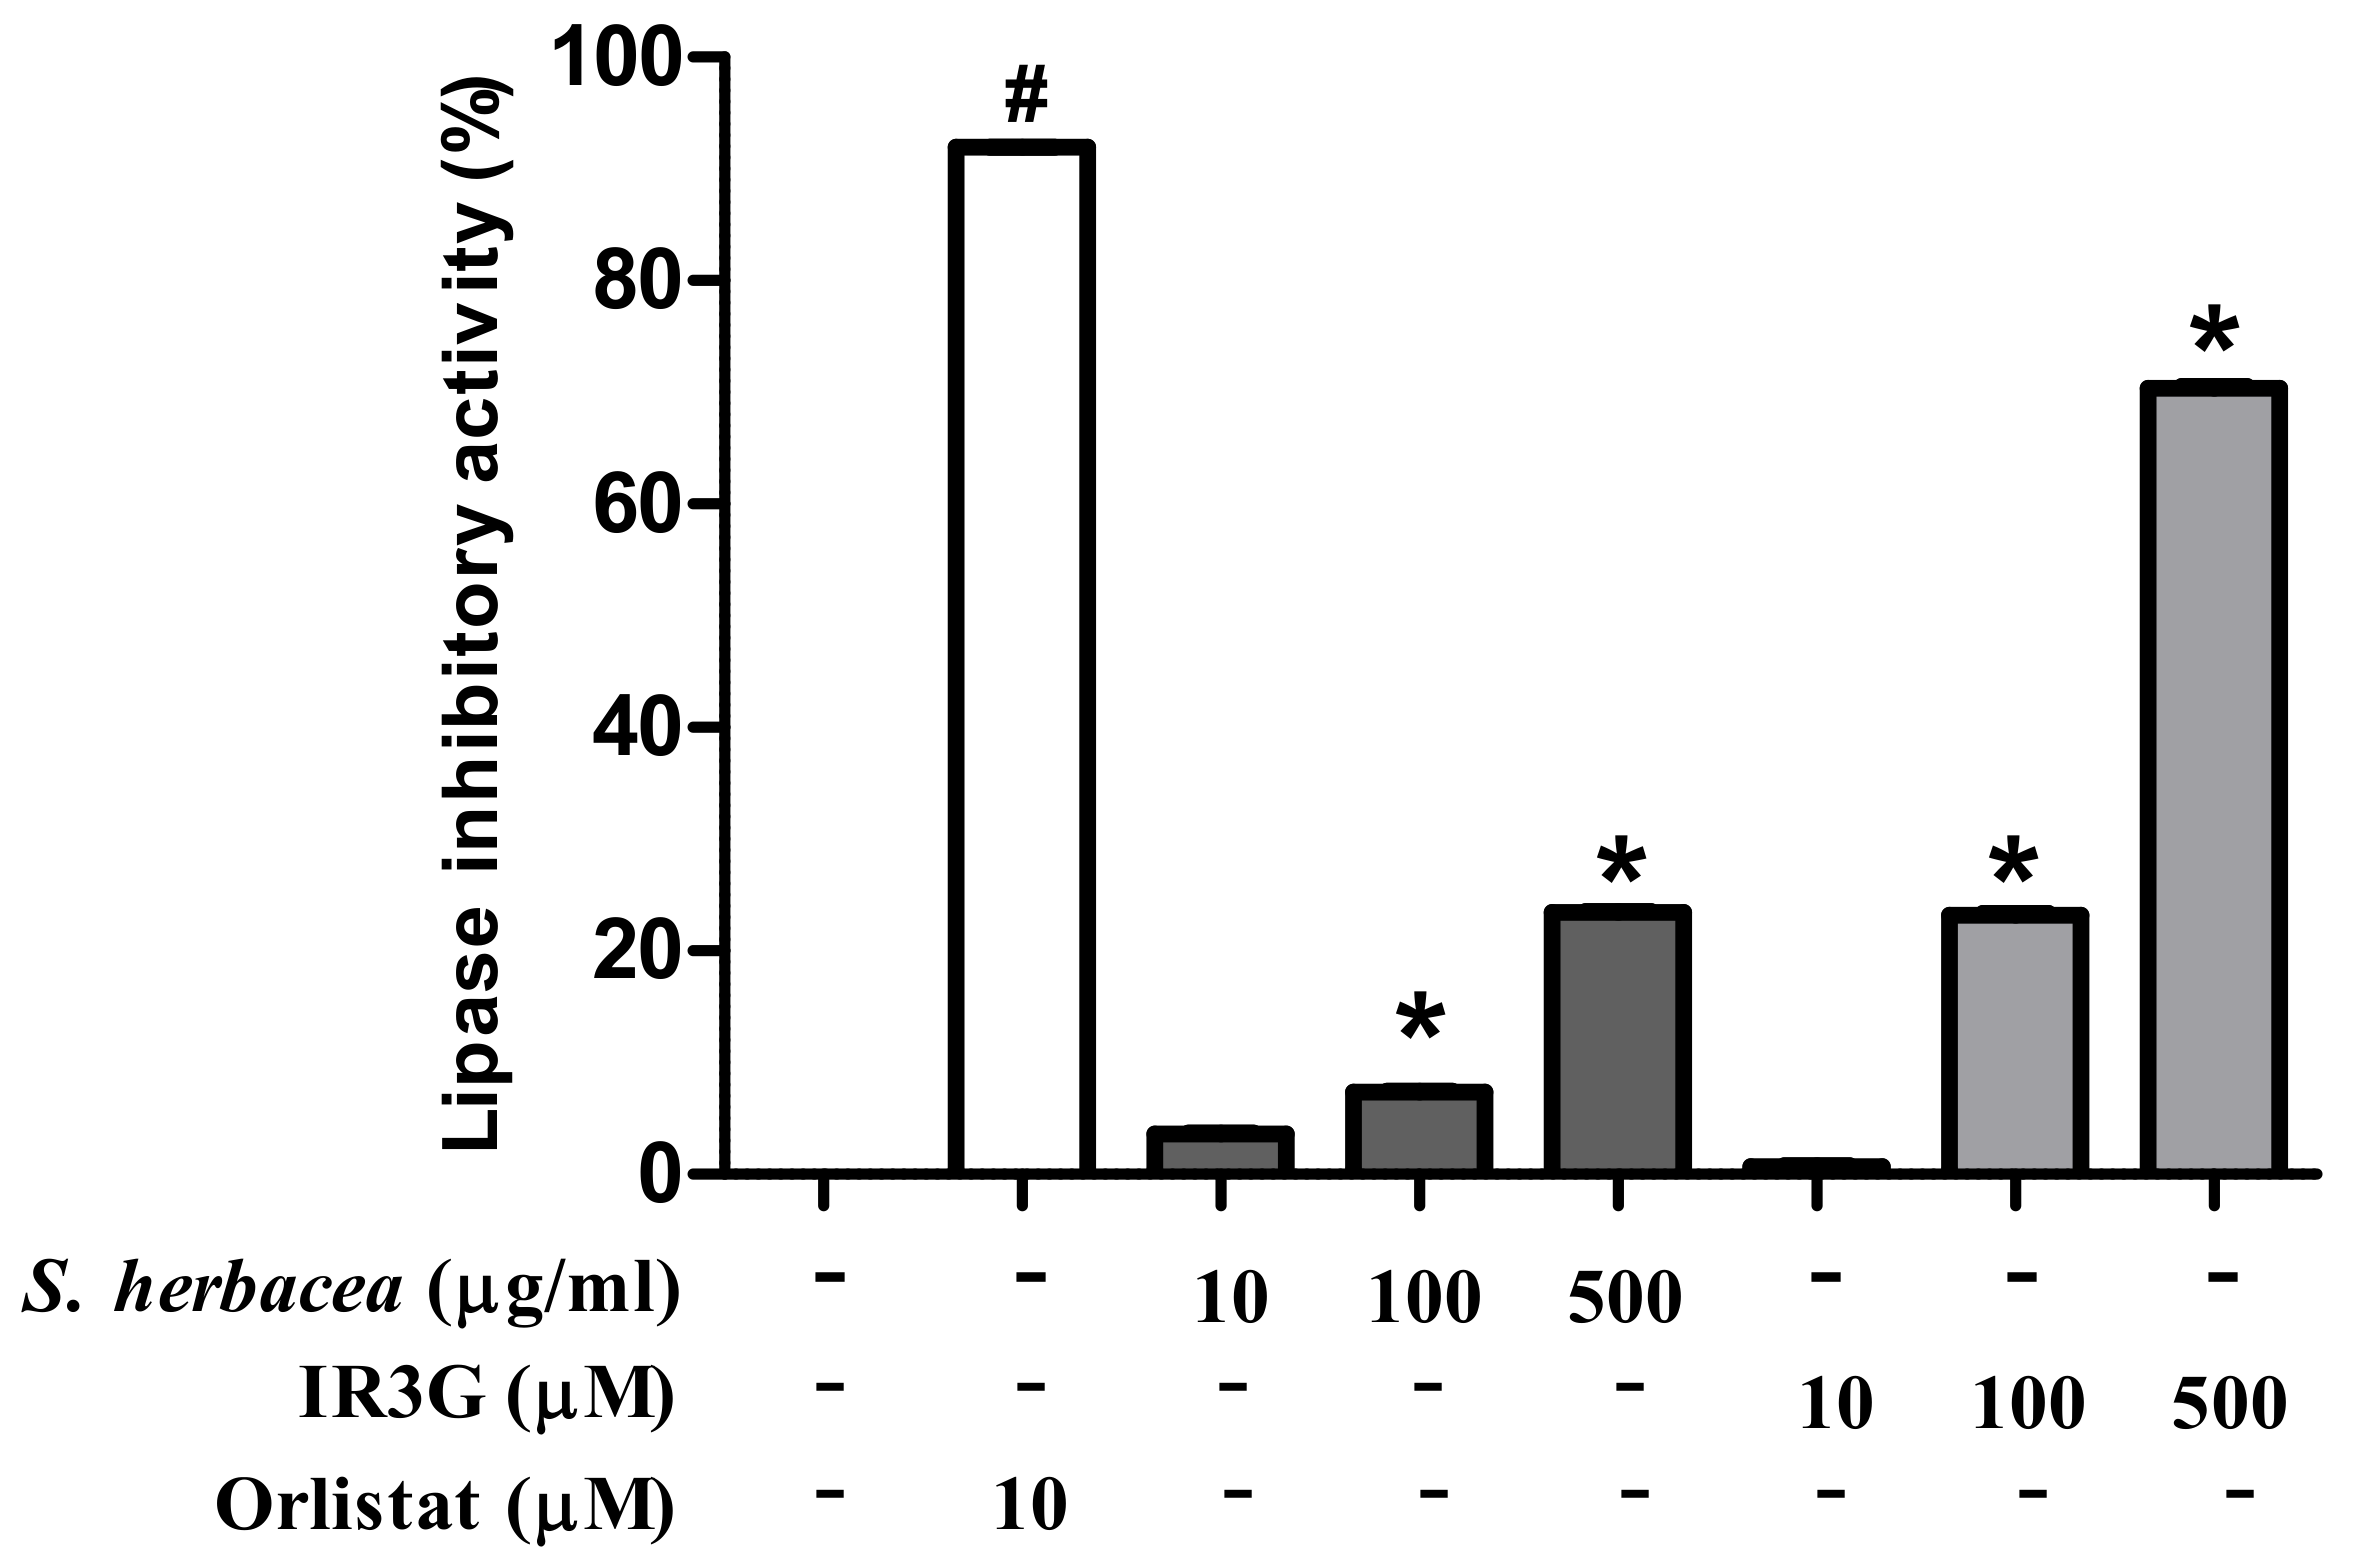
For the 10 μg/mL, 100 μg/mL, and 500 μg/mL S. herbacea extracts, the lipase inhibition activities were 3.6 ± 0.09%, 7.4 ± 0.09%, and 23.5 ± 0.05%, respectively. For 10 μM, 100 μM, and 500 μM of IR3G solutions, the lipase inhibition activity levels were 0.7 ± 0.09%, 23.2 ± 0.09%, and 70.4 ± 0.19%, respectively. At 10 μM, the positive control—orlistat—inhibited lipase activity by 91.9 ± 0.05%. The lipase inhibitory activities of S. herbacea extract and IR3G were lower than that of orlistat; nonetheless, they increased in a concentration-dependent manner. Moreover, IR3G more effectively inhibited lipase than S. herbacea extract (Figure 2).

3.3. Inhibitory Effects of S. herbacea and IR3G on Adipogenesis in Differentiated 3T3-L1 Preadipocytes

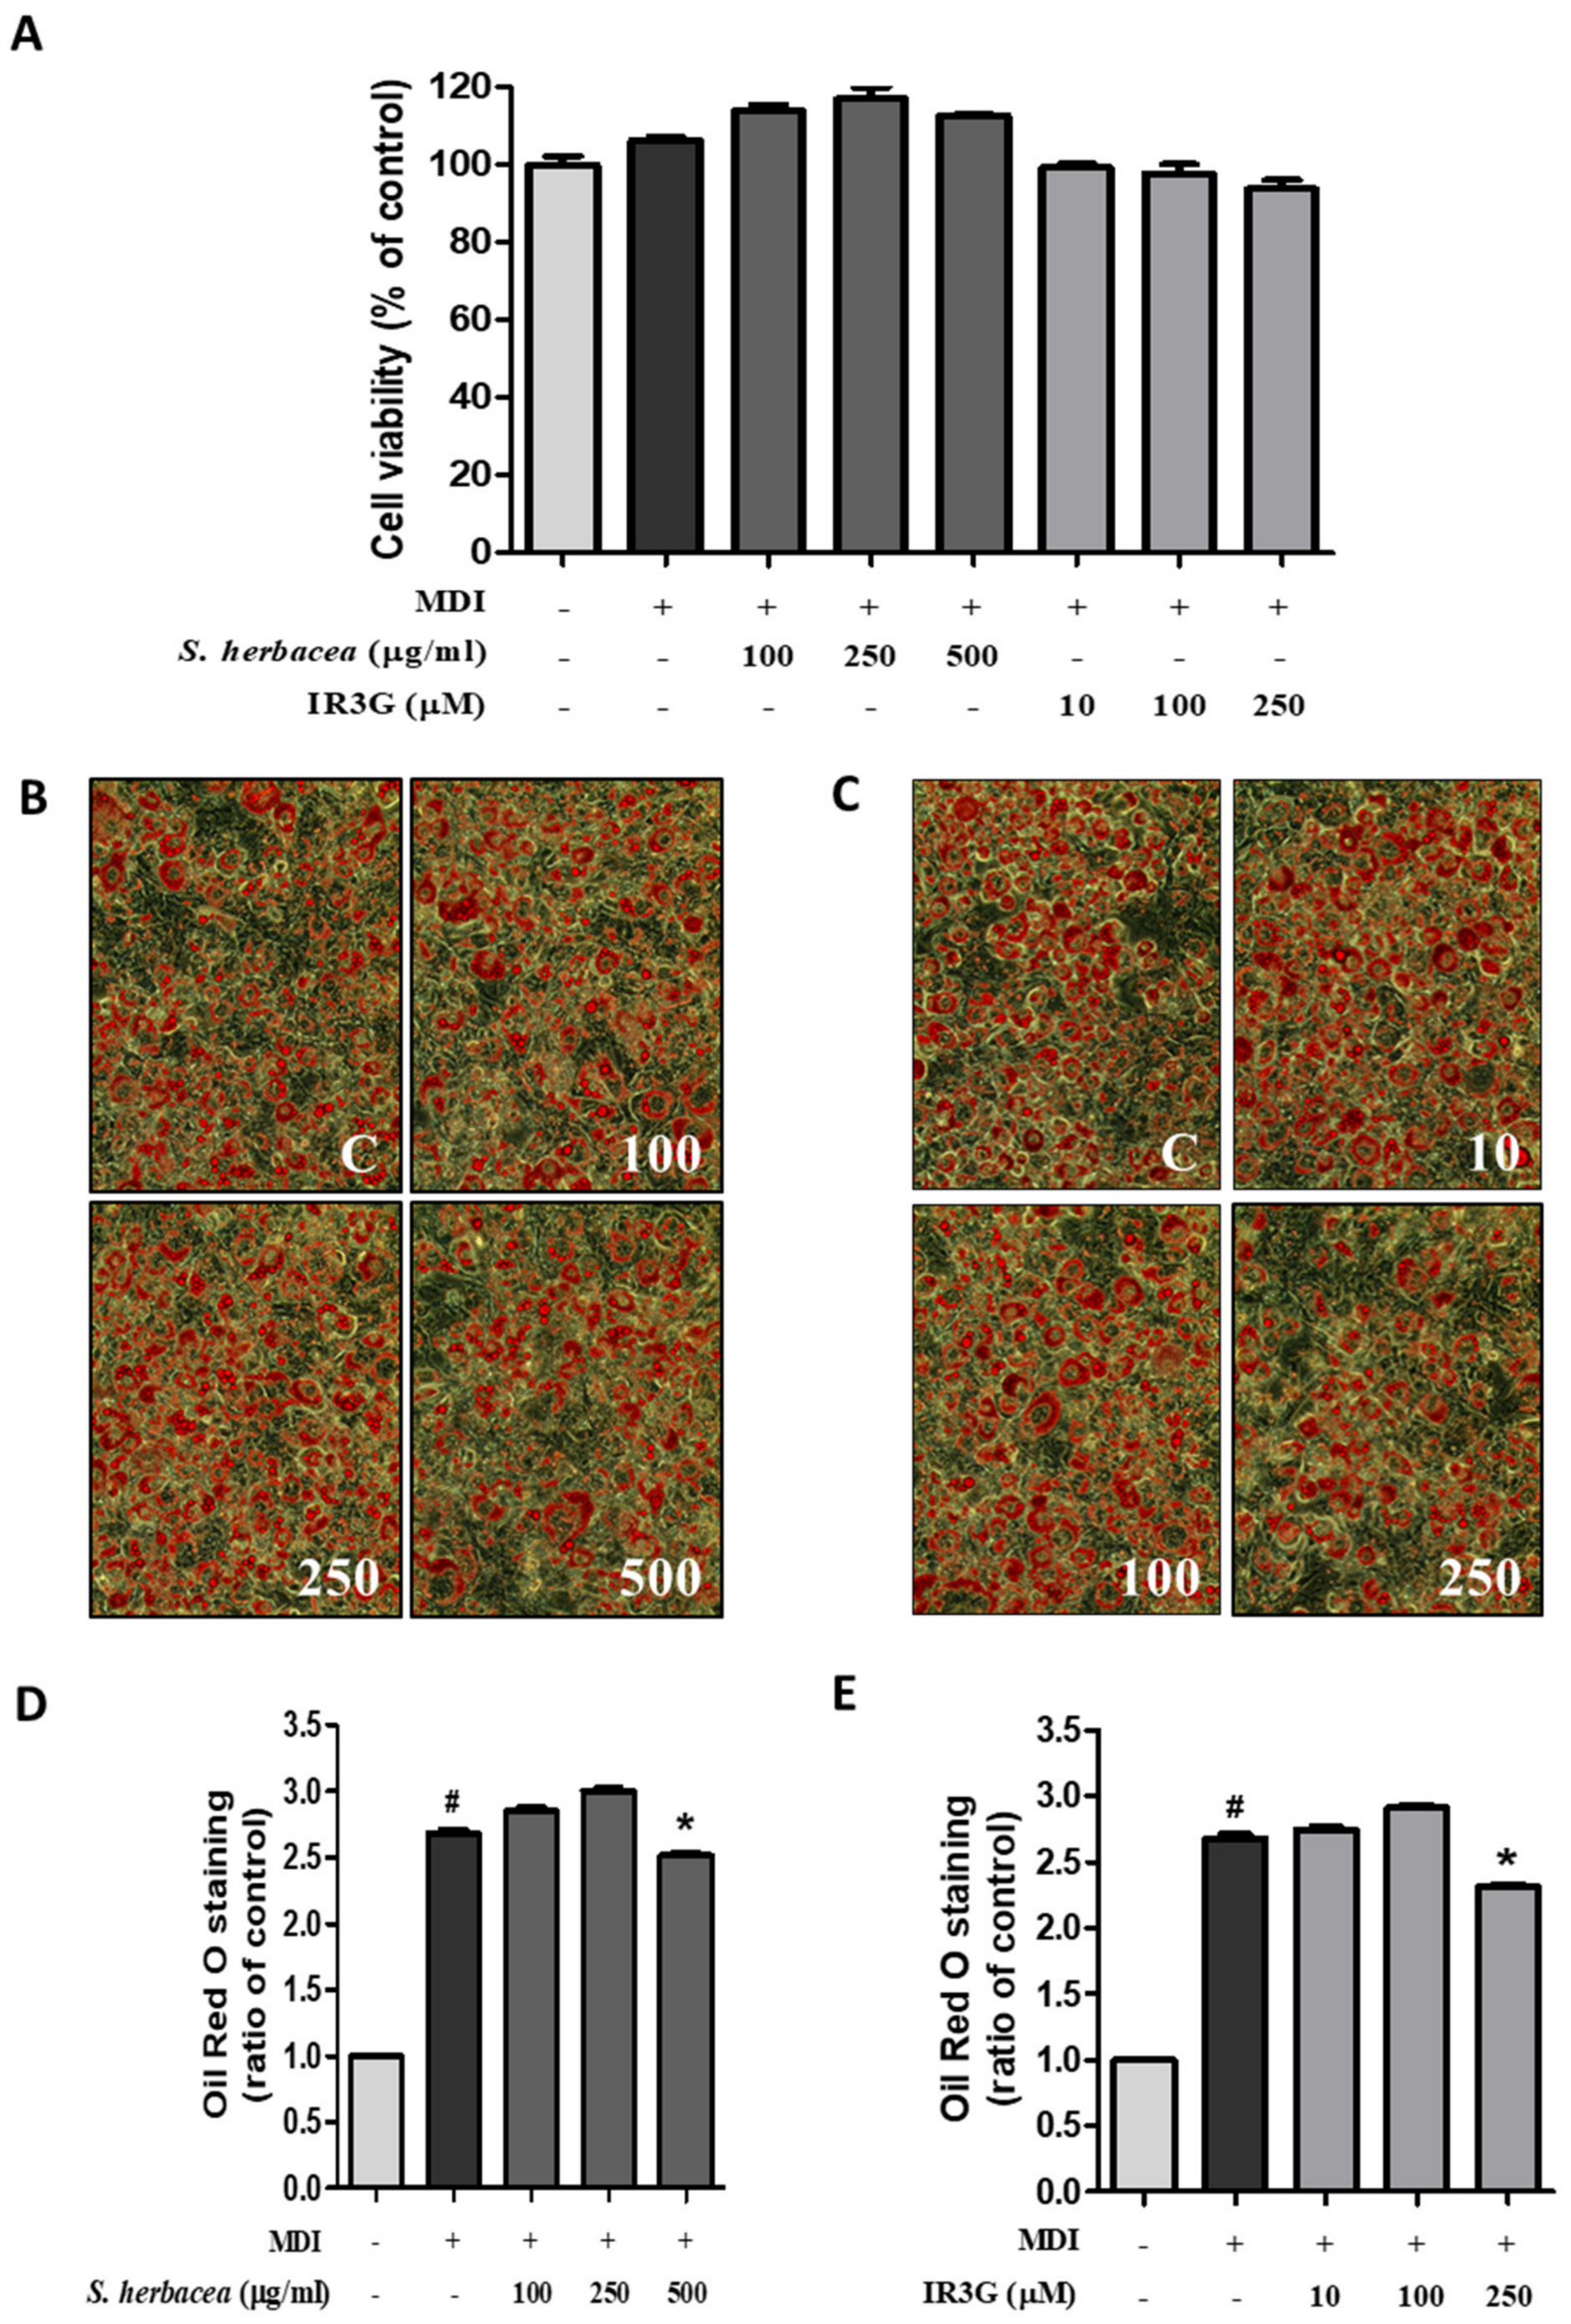
A viability assay was conducted on 3T3-L1 preadipocytes to screen the non-cytotoxic S. herbacea extract and IR3G concentrations. The 3T3-L1 cells were subjected to 100 μg/mL, 250 μg/mL, and 500 μg/mL of S. herbacea extract and 10 μM, 100 μM, and 250 μM of IR3G. Both treatments did not reveal cytotoxicity (Figure 3A). Next, to evaluate the inhibitory activities of S. herbacea extract and IR3G on lipid accumulation, we treated MDI (preadipocyte inducer reagents only) in 3T3-L1 preadipocytes. Then, the cells were subjected to indicated concentrations of S. herbacea extract and IR3G from day 2 to day 8, and adipogenesis was measured using ORO staining on day 8. As illustrated in Figure 3, the 100 μg/mL and 250 μg/mL of S. herbacea extract did not affect lipid accumulation. In contrast, 500 μg/mL of S. herbacea extract significantly inhibited lipid accumulation in the 3T3-L1 preadipocytes (Figure 3B,D). Furthermore, 10 μM and 100 μM of IR3G did not affect lipid accumulation. However, 250 μM of IR3G significantly inhibited lipid accumulation in the 3T3-L1 preadipocytes (Figure 3C,E). These results suggest that S. herbacea extract and IR3G might inhibit adipogenesis in 3T3-L1 mouse preadipocytes.

3.4. Effects of S. herbacea and IR3G on C/EBPα Expression in Differentiated 3T3-L1 Adipocytes

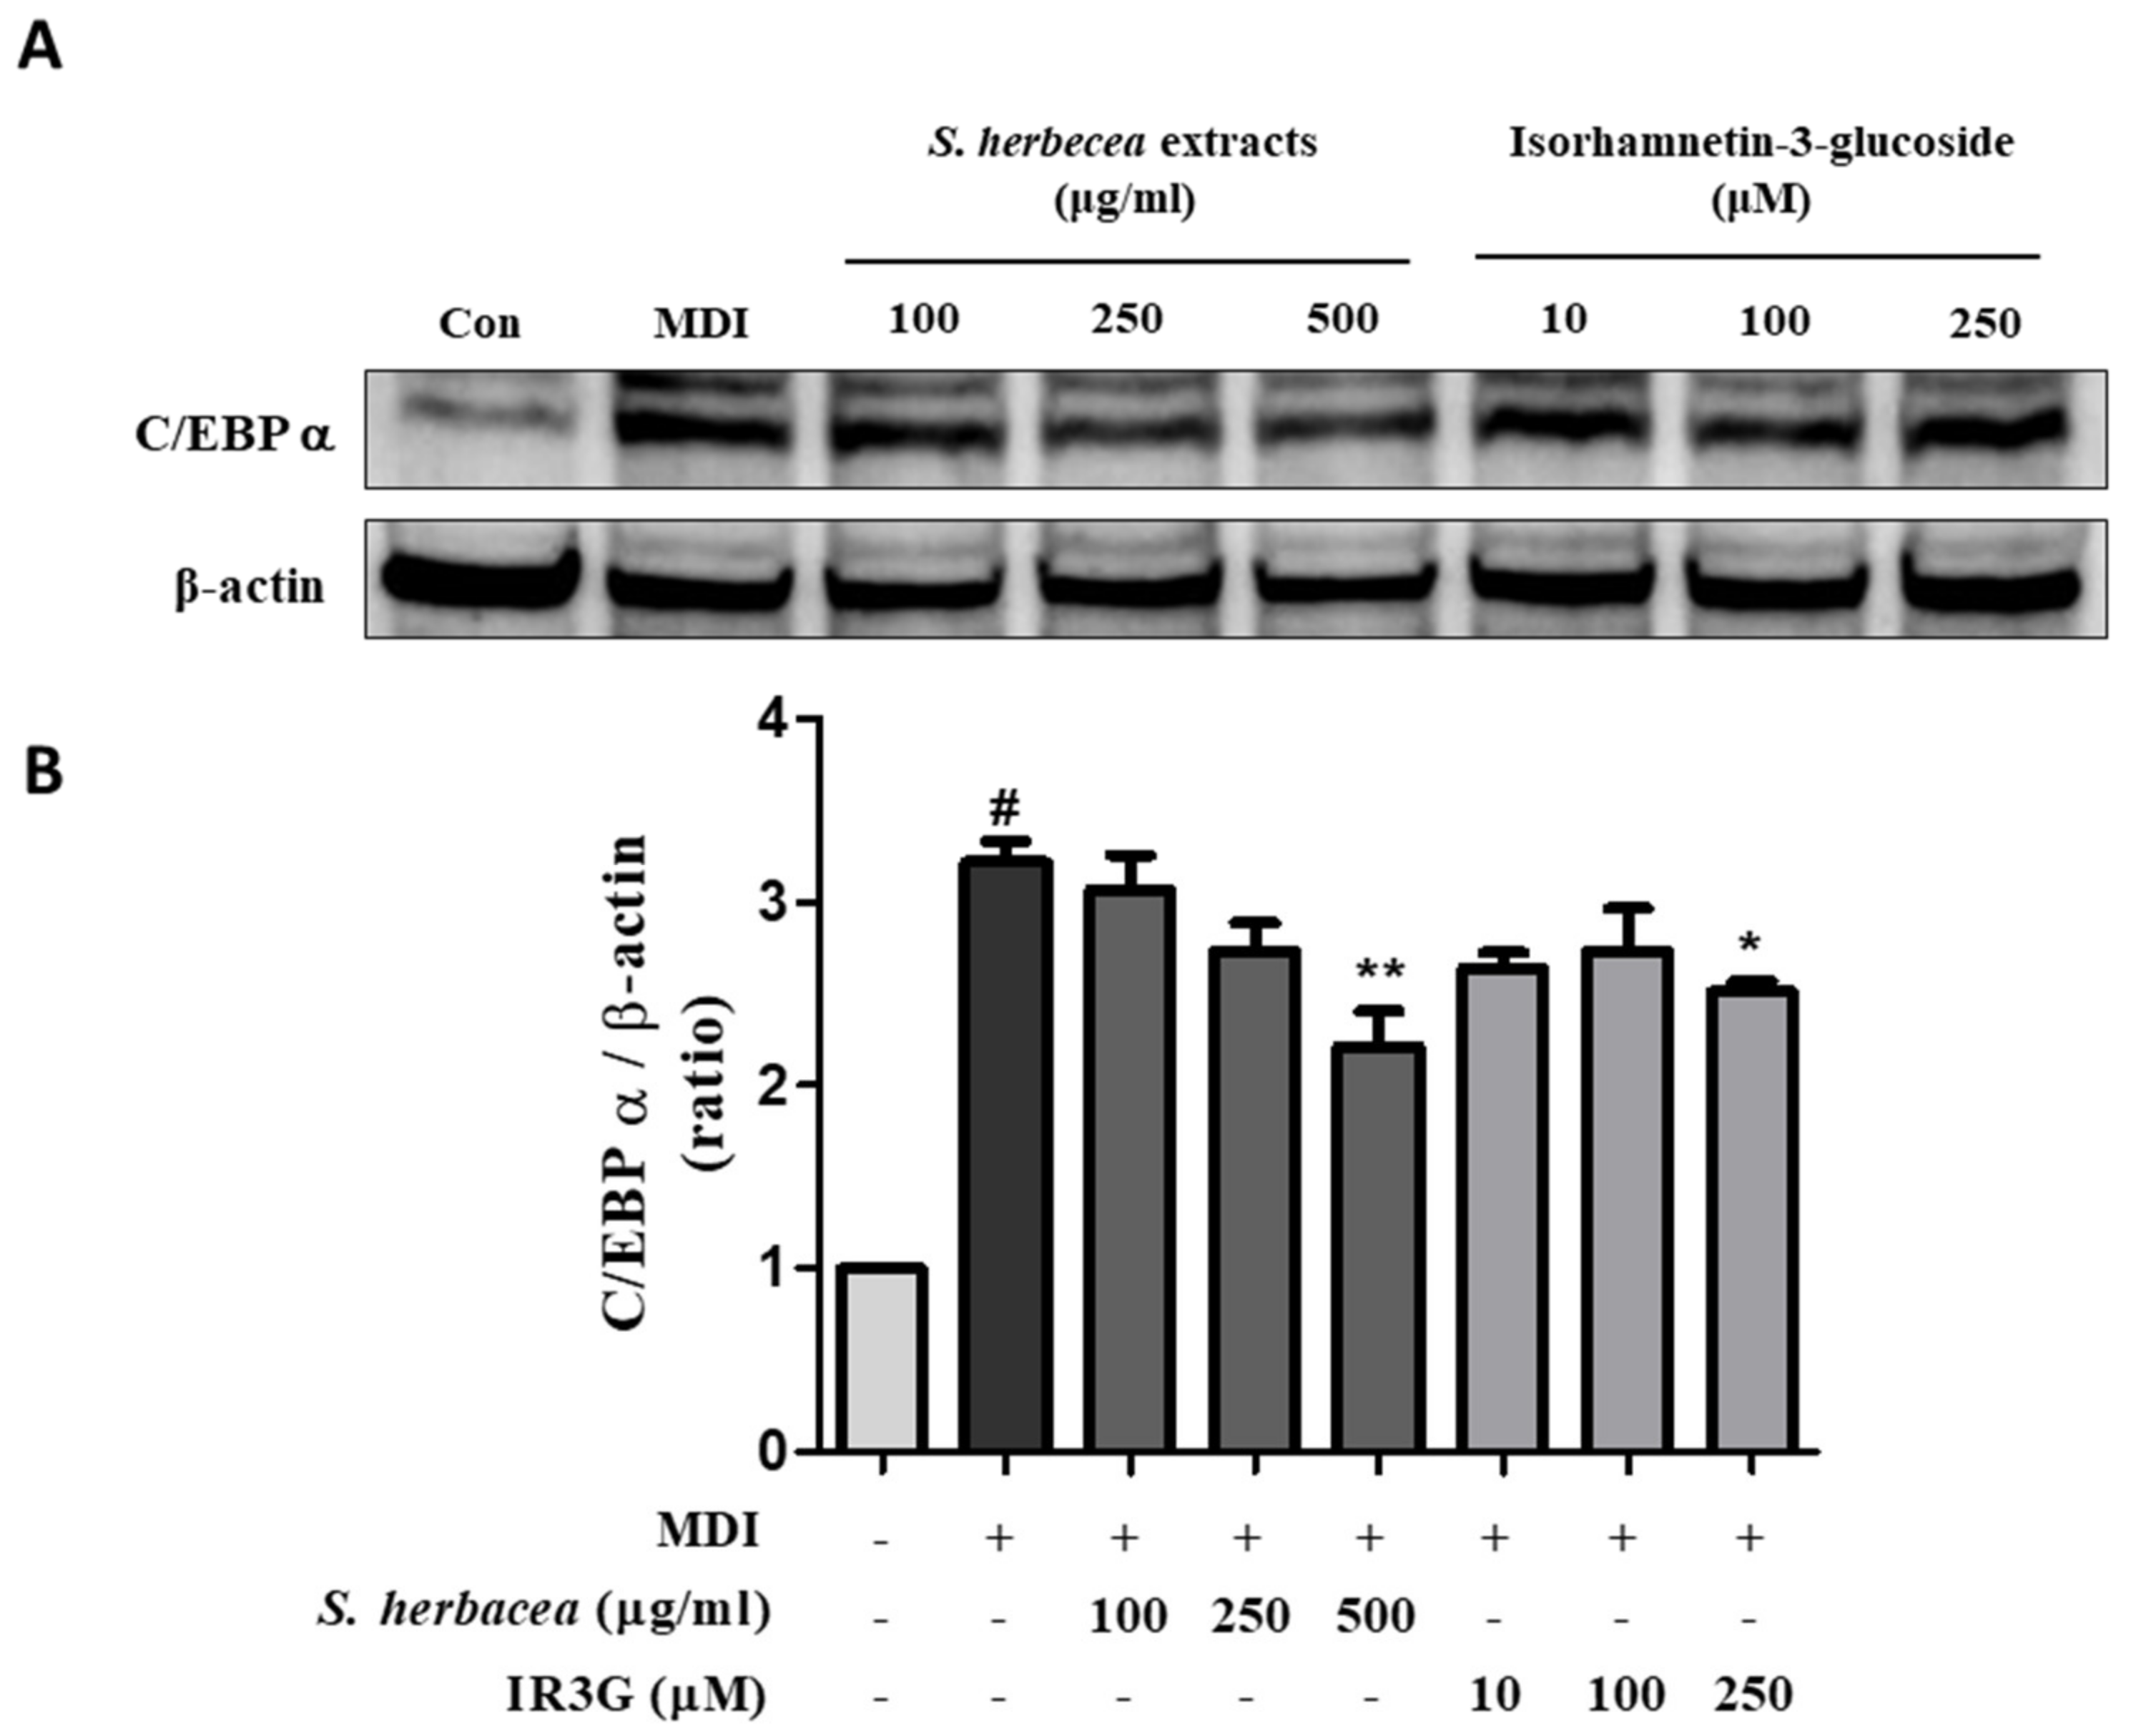
We subjected 3T3-L1 adipocytes to S. herbacea extract and IR3G. We used Western blot to measure the expression of the adipocyte differentiation regulator—C/EBPα—in the cells. In the MDI (preadipocyte inducer only) treatment group, C/EBPα protein was highly upregulated compared to the control (Figure 4A). However, 100 μg/mL and 250 μg/mL of S. herbacea extract decreased C/EBPα expression in comparison with the MDI treatment. However, 500 μg/mL of S. herbacea extract significantly downregulated C/EBPα protein compared to the MDI group. In contrast, 10 μM, 100 μM, and 250 μM IR3G slightly lowered C/EBPα protein expression compared to the MDI group. Furthermore, 100 μM IR3G significantly downregulated C/EBPα. These results were consistent with those of the ORO in Figure 3B–E, suggesting that S. herbacea extract and IR3G have anti-adipogenic activity on 3T3-L1 cells.

3.5. Effects of S. herbacea Extract and IR3G on Mouse Body Weight Gain, Feed Efficiency, and Epididymal Tissue Mass

The mean body weight gain was significantly higher for the control (db/db) (13.5 ± 1.01 g) in comparison with the wild-type mice (5 ± 0.17 g). The mean body weight gains in the mice treated with 50 mg/kg and 200 mg/kg S. herbacea extract were 10.0 ± 1.53 g and 9.4 ± 1.53 g, respectively. The mean body weight gain in the mice subjected to 50 mg/kg IR3G was 8.5 ± 0.94 g. All the treated groups had lower body weight than the db/db control group. The mice exposed to 50 mg/kg IR3G had significantly lower body weight than the db/db control (Figure 5A). The feed efficiency was approximately 29% higher in the controls than in normal mice. Nevertheless, the difference was not significant. The feed efficiencies of the untreated and S. herbacea-extract- and IR3G-treated mice were approximately 36%, 40%, and 37% lower than that of the control mice, respectively (Figure 5B). The mean epididymal tissue weight of the control mice was 3.1 ± 0.06 g, significantly higher than that of the treated mice (0.3 ± 0.06 g). The mean epididymal tissue weights of the mice treated with 50 mg/kg S. herbacea extract, 200 mg/kg S. herbacea extract, and 50 mg/kg IR3G were 2.7 ± 0.07 g, 2.5 ± 0.13 g, and 2.7 ± 0.11 g, respectively. Overall, the mean epididymal weights were lower in the treated mice than in the control mice and significantly lower in those subjected to 200 mg/kg S. herbacea extract and 50 mg/kg IR3G than in the control mice (Figure 5).

3.6. Effects of S. herbacea Extract and IR3G on Leptin and Adiponectin

The mean blood leptin level of the control mice (3.7 ± 0.17 μg/mL) was approximately 95% higher than that of the normal mice (0.2 ± 0.09 μg/mL), and the difference was significant. The mean blood leptin levels of the mice treated with 50 mg/kg S. herbacea extract, 200 mg/kg S. herbacea extract, and 50 mg/kg IR3G were 3.5 ± 0.15 μg/mL, 3.3 ± 0.45 μg/mL, and 3.5 ± 0.23 μg/mL, respectively. The mean blood leptin levels were generally lower in all treated mice than in the controls. Furthermore, the 200 mg/kg S. herbacea extract treatment significantly reduced the mean blood leptin than in the controls. The mean blood adiponectin level for the control was 16.7 ± 4.51 ng/mL, which was approximately 41% lower than that of the normal mice (23.6 ± 6.93 ng/mL), and the difference was significant. The mean blood adiponectin levels of the mice treated with 50 mg/kg S. herbacea extract, 200 mg/kg S. herbacea extract, and 50 mg/kg IR3G were 15.4 ± 2.90 ng/mL, 18.1 ± 5.25 ng/mL, and 15.4 ± 4.75 ng/mL, respectively. The 50 mg/kg S. herbacea extract and IR3G treatments did not affect the mean blood adiponectin level. However, the 200 mg/kg S. herbacea extract raised the mean blood adiponectin to approximately 8% higher than the control’s (Table 2).

3.7. Effects of S. herbacea Extract and IR3G on Lipid Profiles

The TC of the control mice was 119.7 ± 11.61 mg/dL, approximately 37% higher than that of the normal mice (75.3 ± 4.85 mg/dL), and the difference was significant. The TC of the mice treated with 50 mg/kg S. herbacea extract, 200 mg/kg S. herbacea extract, and 50 mg/kg IR3G were 99.8 ± 10.57 mg/dL, 100.8 ± 4.41 mg/dL, and 108.6 ± 3.06 mg/dL, respectively. The TC levels of the IR3G- and S. herbacea-extract-treated mice were approximately 9.2% and 16% lower than that of the control mice, respectively (Figure 6A). The TG level was approximately 80% higher in the control (111.6 ± 19.75 mg/dL) than the normal mice (22.7 ± 1.28 mg/dL), with a significant difference. The TG levels of the mice treated with 50 mg/kg S. herbacea extract, 200 mg/kg S. herbacea extract, and 50 mg/kg IR3G were 86.4 ± 18.77 mg/dL, 55.4 ± 9.14 mg/dL, and 72.0 ± 10.2 mg/dL, respectively. The TG levels were lower in all treated mice than in the controls. The S. herbacea extract lowered the TG levels in a dose-dependent manner. The mice subjected to 200 mg/kg S. herbacea extract had significantly lower TG levels than the other groups (Figure 6B). The HDL of the control mice was 59.5 ± 4.63 mg/dL, which was approximately 28% higher than that of the normal mice (42.8 ± 3.34 mg/dL), with a significant difference. The HDL of the mice treated with 50 mg/kg S. herbacea extract, 200 mg/kg S. herbacea extract, and 50 mg/kg IR3G were 48.4 ± 4.74 mg/dL, 58.8 ± 3.00 mg/dL, and 60.3 ± 3.92 mg/dL, respectively. The HDL of the mice treated with 50 mg/kg S. herbacea extract was approximately 18% lower than that of the control group. In contrast, the HDL levels did not significantly differ among the control mice and those treated with 200 mg/kg S. herbacea extract or 50 mg/kg IR3G (Figure 6C). The average LDL of the control (7.9 ± 0.57 mg/dL) was higher than that of the normal mice (5.9 ± 0.19 mg/dL). The LDL of the mice treated with 50 mg/kg S. herbacea extract, 200 mg/kg S. herbacea extract, and 50 mg/kg IR3G were 5.1 ± 0.85 mg/dL, 4.2 ± 0.36 mg/dL, and 6.1 ± 0.69 mg/dL, respectively. The S. herbacea extract lowered the LDL in a dose-dependent manner. The LDL in the mice subjected to 50 mg/kg IR3G was approximately 22% lower than that of the control group (Figure 6D).

4. Discussion

S. herbacea is a salt plant rich in fiber and minerals that grows wild in salt pans on the west coast of Jeju Island and coastal areas in Korea [26,27]. IR3G is a marker component in S. herbacea extract, which has antioxidant and anti-inflammatory activities and inhibits adipocyte differentiation [39,40].
Therefore, we verified the improvement of obesity by S. herbacea extract and IR3G in vitro and in vivo. S. herbacea extract and IR3G displayed concentration-dependent lipase activity inhibition. Reducing the ability of lipase to break down fat prevents fatty acids from being sufficiently absorbed in the small intestine; thus, obesity is improved [39,41,42]. In adipogenesis, preadipocytes differentiate into adipocytes. Therefore, this process is crucial in adipocyte formation and lipid accumulation [43]. Recent studies have attempted to prevent obesity by regulating transcription factors and genes that regulate lipogenesis [41]. This study confirmed that S. herbacea extract (500 ug/mL) and IR3G (250 µM) effectively inhibited adipocyte differentiation and significantly inhibited the expression of the transcription factor—C/EBPα.
This study’s db/db mouse model was used for anti-obesity research. Furthermore, db/db mice are transgenic mice generated by the leptin receptor mutation in wild-type mice. In addition, db/db mice can become bulimic and obese due to impaired energy balance mediated by aberrant leptin signaling [42]. Thus, db/db mice consume excess feed without feeling full.
Mice administered S. herbacea extract and IR3G had significantly lower average weight gain than the control group. In addition, mice administered S. herbacea extract and IR3G had relatively low feed intake efficiency. Kong et al. reported that a 5–10% weight loss significantly reduced the risk of obesity-related diseases, symptoms, and complications [43]. Body fat accumulation is associated with weight gain in obesity [44]. Therefore, reducing S. herbacea extract and IR3G intake, weight gain, and body fat reduction help to control obesity.
We also measured blood leptin and adiponectin in samples from rats exposed to S. herbacea extract and IR3G. Leptin is an obesity-related protein produced in adipose tissues and secreted in response to body fat. Furthermore, leptin can control body fat by reducing food intake and increasing metabolic energy expenditure by acting on the CNS [45]. The db/db mice had significantly increased blood leptin levels compared to the control group. However, the blood leptin levels of mice administered S. herbacea extract and IR3G decreased slightly, and no significant changes were identified. Next, the effects of S. herbacea extract and IR3G on TC, blood TG, LDL, and HDL were evaluated.
Furthermore, excessive adipose tissue increases blood lipid content, greatly increasing the incidence of hypertension, atherosclerosis, coronary artery disease, and CVD [46]. Compared to the db/db group, the group administered S. herbacea extract had effectively reduced LDL and decreased TG levels. Nevertheless, IR3G had a slight tendency to lower TC. However, S. herbacea extract and IR3G reduced TG, and 200 mg/kg of the extract reduced TG levels in a concentration-dependent manner compared to the db/db group. The extract also effectively reduced LDL levels. However, no significant change was observed in TC and HDL levels. Nonetheless, they were suppressed compared to those of the db/db group. No significant change existed in blood TC, TG, HDL, and LDL due to IR3G administration. However, it tended to be suppressed compared to the db/db control group.
Therefore, these results suggest that S. herbacea extract and IR3G can improve metabolic diseases, including obesity and hyperlipidemia.

Author Contributions

Conceptualization, K.S.K.; methodology, J.H.L.; validation, J.H.L.; investigation, J.H.L. and S.L.; resources, S.L. and K.S.K.; data curation, J.Y.P.; formal analysis; J.Y.P. and I.-H.P.; writing—original draft preparation, J.H.L.; writing—review and editing, J.H.L. and M.-S.S.; funding acquisition, M.-S.S. All authors have read and agreed to the published version of the manuscript.

Funding

This study was also funded by KIST Open Research Program (BlueBell Innovation Program, 2E31300). This research was supported by the Bio & Medical Technology Development Program of the National Research Foundation (NRF) funded by Ministry of Science & ICT (2020M3A9E4104380).

Data Availability Statement

The datasets used and/or analyzed during the current study are available from the corresponding author on reasonable request.

Conflicts of Interest

The authors declare no conflict of interest.

References

  1. Chua, J.; Leibel, R. Obesity genes: Molecular and metabolic mechanisms. Diabetes Rev. 1997, 5, 2–7. [Google Scholar]
  2. Bray, M.S. Genomics, genes, and environmental interaction: The role of exercise. J. Appl. Physiol. 2000, 88, 788–792. [Google Scholar] [CrossRef] [PubMed]
  3. Kopelman, P.G. Obesity as a medical problem. Nature 2000, 404, 635–643. [Google Scholar] [CrossRef] [PubMed]
  4. Grundy, S.M. Multifactorial causation of obesity: Implications for prevention. Am. J. Clin. Nutr. 1998, 67, 563S–572S. [Google Scholar] [CrossRef] [Green Version]
  5. Wright, S.M.; Aronne, L.J. Causes of obesity. Abdom. Radiol. 2012, 37, 730–732. [Google Scholar] [CrossRef]
  6. Sui, Y.; Zhao, H.; Wong, V.; Brown, N.; Li, X.; Kwan, A.; Hui, H.; Ziea, E.; Chan, J. A systematic review on use of Chinese medicine and acupuncture for treatment of obesity. Obes. Rev. 2012, 13, 409–430. [Google Scholar] [CrossRef] [PubMed]
  7. Dandona, P.; Aljada, A.; Chaudhuri, A.; Mohanty, P.; Garg, R. Metabolic syndrome: A comprehensive perspective based on interactions between obesity, diabetes, and inflammation. Circulation 2005, 111, 1448–1454. [Google Scholar] [CrossRef] [Green Version]
  8. Zeller, M.H.; Reiter-Purtill, J.; Ramey, C. Negative peer perceptions of obese children in the classroom environment. Obesity 2008, 16, 755–762. [Google Scholar] [CrossRef]
  9. Lang, A.; Froelicher, E.S. Management of overweight and obesity in adults: Behavioral intervention for long-term weight loss and maintenance. Eur. J. Cardiovasc. Nurs. 2006, 5, 102–114. [Google Scholar] [CrossRef]
  10. Powell, A.; Apovian, C.; Aronne, L. New drug targets for the treatment of obesity. Clin. Pharmacol. Ther. 2011, 90, 40–51. [Google Scholar] [CrossRef]
  11. Padwal, R.S.; Majumdar, S.R. Drug treatments for obesity: Orlistat, sibutramine, and rimonabant. Lancet 2007, 369, 71–77. [Google Scholar] [CrossRef]
  12. Kang, J.G.; Park, C.Y. Anti-obesity drugs: A review about their effects and safety. Diabetes Metab. J. 2012, 36, 13–25. [Google Scholar] [CrossRef] [Green Version]
  13. Solas, M.; Milagro, F.I.; Martínez-Urbistondo, D.; Ramirez, M.J.; Martínez, J.A. Precision obesity treatments including pharmacogenetic and nutrigenetic approaches. Trends Pharmacol. Sci. 2016, 37, 575–593. [Google Scholar] [CrossRef] [PubMed]
  14. Gregoire, F.M.; Smas, C.M.; Sul, H.S. Understanding adipocyte differentiation. Physiol. Rev. 1998, 78, 783–809. [Google Scholar] [CrossRef] [PubMed] [Green Version]
  15. Rosen, E.D.; MacDougald, O.A. Adipocyte differentiation from the inside out. Nat. Rev. Mol. Cell Biol. 2006, 7, 885–896. [Google Scholar] [CrossRef] [PubMed]
  16. Darlington, G.J.; Ross, S.E.; MacDougald, O.A. The role of C/EBP genes in adipocyte differentiation. J. Biol. Chem. 1998, 273, 30057–30060. [Google Scholar] [CrossRef] [Green Version]
  17. Linhart, H.G.; Ishimura-Oka, K.; DeMayo, F.; Kibe, T.; Repka, D.; Poindexter, B.; Bick, R.J.; Darlington, G.J. C/EBPα is required for differentiation of white, but not brown, adipose tissue. Proc. Natl. Acad. Sci. USA 2001, 98, 12532–12537. [Google Scholar] [CrossRef] [Green Version]
  18. Rosen, E.D.; Sarraf, P.; Troy, A.E.; Bradwin, G.; Moore, K.; Milstone, D.S.; Spiegelman, B.M.; Mortensen, R.M. PPARγ is required for the differentiation of adipose tissue in vivo and in vitro. Mol. Cell 1999, 4, 611–617. [Google Scholar] [CrossRef]
  19. Wu, Z.; Rosen, E.D.; Brun, R.; Hauser, S.; Adelmant, G.; Troy, A.E.; McKeon, C.; Darlington, G.J.; Spiegelman, B.M. Cross-regulation of C/EBPα and PPARγ controls the transcriptional pathway of adipogenesis and insulin sensitivity. Mol. Cell 1999, 3, 151–158. [Google Scholar] [CrossRef]
  20. Rosen, E.D.; Hsu, C.H.; Wang, X.; Sakai, S.; Freeman, M.W.; Gonzalez, F.J.; Spiegelman, B.M. C/EBPα induces adipogenesis through PPARγ: A unified pathway. Genes Dev. 2002, 16, 22–26. [Google Scholar] [CrossRef] [Green Version]
  21. Lefterova, M.I.; Zhang, Y.; Steger, D.J.; Schupp, M.; Schug, J.; Cristancho, A.; Feng, D.; Zhuo, D.; Stoeckert, C.J.; Liu, X.S. PPARγ and C/EBP factors orchestrate adipocyte biology via adjacent binding on a genome-wide scale. Genes Dev. 2008, 22, 2941–2952. [Google Scholar] [CrossRef] [PubMed] [Green Version]
  22. Madsen, M.S.; Siersbæk, R.; Boergesen, M.; Nielsen, R.; Mandrup, S. Peroxisome proliferator-activated receptor γ and C/EBPα synergistically activate key metabolic adipocyte genes by assisted loading. Mol. Cell. Biol. 2014, 34, 939–954. [Google Scholar] [CrossRef] [PubMed] [Green Version]
  23. Camp, H.S.; Ren, D.; Leff, T. Adipogenesis and fat-cell function in obesity and diabetes. Trends Mol. Med. 2002, 8, 442–447. [Google Scholar] [CrossRef]
  24. Ahn, B.K.; Kim, R.; Choi, D.; Kim, Y.S. Effect of Salicornia bigelovii extract on the activities of whitening and anti-wrinkle. Appl. Chem. Eng. 2011, 22, 56–60. [Google Scholar]
  25. Choi, J. Korean herbs, flowers, and trees as traditional medicine. Hanmunhwa 2001, 1, 63–74. [Google Scholar]
  26. Rhee, M.H.; Park, H.J.; Cho, J.Y. Salicornia herbacea: Botanical, chemical and pharmacological review of halophyte marsh plant. J. Med. Plants Res 2009, 3, 548–555. [Google Scholar]
  27. SHIMIZU, K. Effects of salt treatments on the production and chemical composition of salt wort (Salicornia herbacea L.), rhodesgrass and alfalfa. Jpn. J. Trop. Agric. 2000, 44, 61–67. [Google Scholar]
  28. Jo, Y.C.; Ahn, J.H.; Chon, S.M.; Lee, K.S.; Bae, T.J.; Kang, D.S. Studies on pharmacological effects of glasswort (Salicornia herbacea L.). Korean J. Med. Crop Sci. 2002, 10, 93–99. [Google Scholar]
  29. Han, S.K. Antioxidant effect of fermented Salicornia herbacea L. liquid with EM (effective microorganism) on pork. Food Sci. Anim. Resour. 2004, 24, 298–302. [Google Scholar]
  30. Im, S.A.; Kim, G.W.; Lee, C.K. Immunomodulatory activity of Salicornia herbacea L. components. Nat. Prod. Sci. 2003, 9, 273–277. [Google Scholar]
  31. Lee, K.Y.; Lee, M.H.; Chang, I.Y.; Yoon, S.P.; Lim, D.Y.; Jeon, Y.J. Macrophage activation by polysaccharide fraction isolated from Salicornia herbacea. J. Ethnopharmacol. 2006, 103, 372–378. [Google Scholar] [CrossRef] [PubMed]
  32. Lee, J.T.; Jeong, Y.S.; An, B.J. Physiological activity of Salicornia herbacea and its application for cosmetic materials. Korea J. Herbol. 2002, 17, 51. [Google Scholar]
  33. Kim, K.S.; Park, S.H. Isolation and Identification of Antioxidant Flavonoids from Salicornia herbacea L. Appl. Biol. Chem. 2004, 47, 120–123. [Google Scholar]
  34. Kong, C.S.; Kim, J.A.; Qian, Z.J.; Kim, Y.A.; Im Lee, J.; Kim, S.K.; Nam, T.J.; Seo, Y. Protective effect of isorhamnetin 3-O-β-d-glucopyranoside from Salicornia herbacea against oxidation-induced cell damage. Food Chem. Toxicol. 2009, 47, 1914–1920. [Google Scholar] [CrossRef]
  35. Kim, Y.A.; Kong, C.S.; Um, Y.R.; Lim, S.Y.; Yea, S.S.; Seo, Y. Evaluation of Salicornia herbacea as a potential antioxidant and anti-inflammatory agent. J. Med. Food 2009, 12, 661–668. [Google Scholar] [CrossRef]
  36. Lee, Y.S.; Lee, S.; Lee, H.S.; Kim, B.K.; Ohuchi, K.; Shin, K.H. Inhibitory effects of isorhamnetin-3-O-β-D-glucoside from Salicornia herbacea on rat lens aldose reductase and sorbitol accumulation in streptozotocin-induced diabetic rat tissues. Biol. Pharm. Bull. 2005, 28, 916–918. [Google Scholar] [CrossRef] [Green Version]
  37. Park, J.Y.; Paje, L.A.; Kang, K.S.; Lee, S. Validation of an HPLC/UV-based method for Salicornia herbacea-derived isorhamnetin-3-O-glucoside and quercetin-3-O-glucoside quantification. J. Appl. Biol. Chem. 2021, 64, 285–290. [Google Scholar] [CrossRef]
  38. Lee, D.; Lee, J.H.; Kim, B.H.; Lee, S.; Kim, D.W.; Kang, K.S. Phytochemical combination (p-Synephrine, p-octopamine hydrochloride, and hispidulin) for improving obesity in obese mice induced by high-fat diet. Nutrients 2022, 14, 2164. [Google Scholar] [CrossRef] [PubMed]
  39. Moreno, D.A.; Ilic, N.; Poulev, A.; Brasaemle, D.L.; Fried, S.K.; Raskin, I. Inhibitory effects of grape seed extract on lipases. Nutrition 2003, 19, 876–879. [Google Scholar] [CrossRef]
  40. Kong, C.S.; Seo, Y. Antiadipogenic activity of isohamnetin 3-O-β-D-glucopyranoside from Salicornia herbacea. Immunopharmacol. Immunotoxicol. 2012, 34, 907–911. [Google Scholar] [CrossRef]
  41. MacDougald, O.A.; Hwang, C.S.; Fan, H.; Lane, M.D. Regulated expression of the obese gene product (leptin) in white adipose tissue and 3T3-L1 adipocytes. Proc. Natl. Acad. Sci. USA 1995, 92, 9034–9037. [Google Scholar] [CrossRef] [PubMed] [Green Version]
  42. Frederich, R.C.; Hamann, A.; Anderson, S.; Löllmann, B.; Lowell, B.B.; Flier, J.S. Leptin levels reflect body lipid content in mice: Evidence for diet-induced resistance to leptin action. Nat. Med. 1995, 1, 1311–1314. [Google Scholar] [CrossRef] [PubMed]
  43. Seo, M.; Lee, W.; Kim, S.; Kang, J.; Kang, J.; Kim, K.; Kim, B.; Kim, Y.; Kim, W.; Kim, E. Korean Society for the Study of obesity guideline for the Management of Obesity in Korea. J. Obes. Metab. Syndr. 2019, 28, 40–45. [Google Scholar] [CrossRef] [PubMed] [Green Version]
  44. Lee, S.H.; Lee, J.S. The reductive effects of oriental medicine on the body fat and abdominal obesity. J. Korean Med. Obes. Res. 2001, 1, 33–42. [Google Scholar]
  45. Mitchell, M.; Armstrong, D.; Robker, R.; Norman, R. Adipokines: Implications for female fertility and obesity. Reproduction 2005, 130, 583–597. [Google Scholar] [CrossRef] [Green Version]
  46. Maffei, Á.; Halaas, J.; Ravussin, E.; Pratley, R.; Lee, G.; Zhang, Y.; Fei, H.; Kim, S.; Lallone, R.; Ranganathan, S. Leptin levels in human and rodent: Measurement of plasma leptin and ob RNA in obese and weight-reduced subjects. Nat. Med. 1995, 1, 1155–1161. [Google Scholar] [CrossRef]
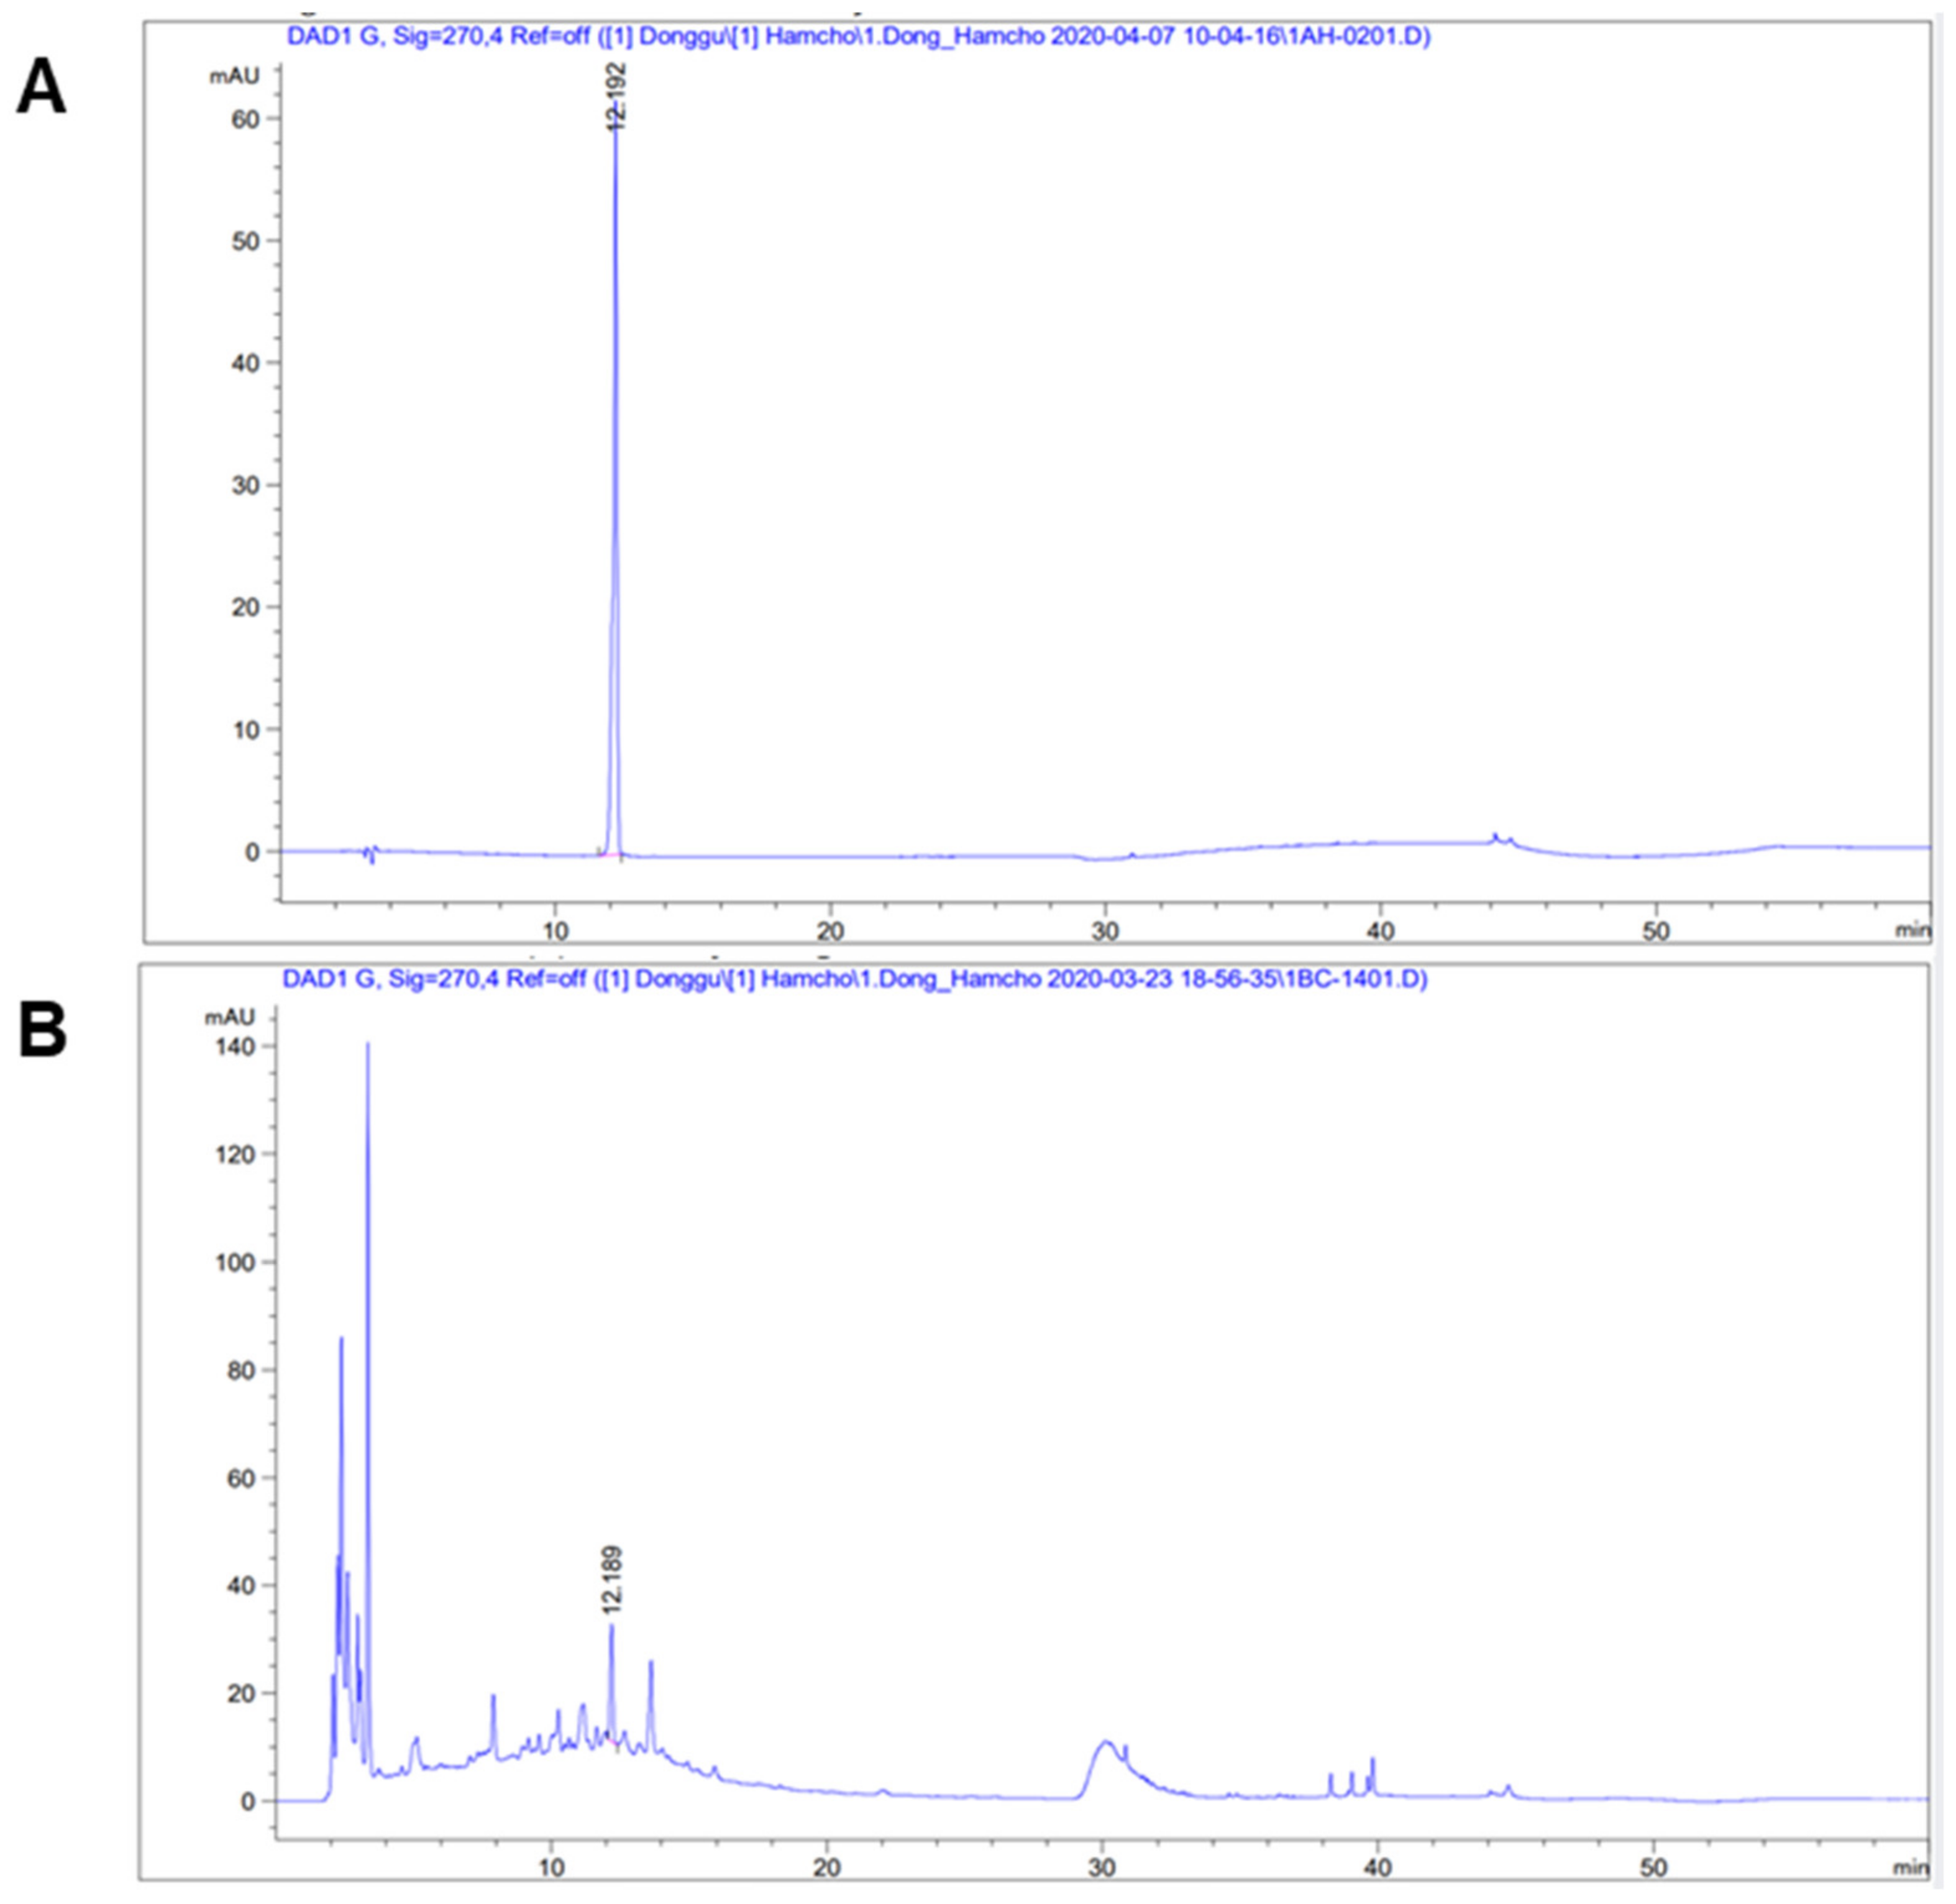
Figure 1. HPLC chromatograms of 50% ethanol extracts of S. herbacea. HPLC peak of a standard IR3G compound (A) and 50% ethanol extracts of S. herbacea (B).
Processes 11 00977 g001
Figure 2. Lipase inhibitory activity of S. herbacea extracts and IR3G. Orlistat is a positive control. Data are presented as the mean ± standard deviation (SD) of three independent experiments. # p < 0.001 compared to control (non-treated group) and * p < 0.001 compared to the Orlistat group.
Processes 11 00977 g002
Figure 3. Effect of S. herbacea extract and IR3G on lipid accumulation of 3T3-L1 adipocytes. (A) Cytotoxicity of S. herbacea extract and IR3G to 3T3-L1 murine adipocyte cell line. (B,C) ORO staining images of S. herbacea extract and IR3G (×200 magnification). (D,E) Intracellular lipid accumulation was quantified using ORO staining and observed under a microscope (IX51, Olympus, Tokyo, Japan). Data are presented as the mean ± standard deviation (SD) of three independent experiments. # p < 0.001 compared to control (non-treated) and * p < 0.01 compared to MDI group.
Processes 11 00977 g003
Figure 4. Effect of S. herbacea extract and IR3G on C/EBPα expression in 3T3-L1 adipocytes. MDI initiated differentiation of confluent 3T3-L1 mouse preadipocytes. Cells were then cultured with or without S. herbacea extract (100 μg/mL, 250 μg/mL, and 500 μg/mL) or IR3G (10 μM, 100 μM, and 250 μM) for 8 days. (A) Whole-cell lysates were immunoblotted with the specific antibodies indicated on the left side of each panel. The β-actin level was measured as an internal loading control. (B) C/EBPα levels were quantified via β-actin using the ImageJ software. Data are presented as the mean ± standard deviation (SD) of three independent experiments. # p < 0.001 indicates a significant difference compared to the control (non-treated). ** p < 0.01 and * p < 0.01 compared to the MDI group.
Processes 11 00977 g004
Figure 5. Effect of S. herbacea extract and IR3G on the body weight change, food efficiency, and tissue weight in db/db mice. (A) Body weight gain: body weight gain (g) = final body weight (g) − initial body weight (g). (B) Feed efficiency: feed efficiency (ratio) = weight gain (g)/food intake (g) × 100. (C) Epididymal fat weight. Data are presented as the mean ± standard deviation (SD) of three independent experiments. # p < 0.001 indicates a significant difference compared to db/db control. ** p < 0.01 and * p < 0.05 compared to the MDI group.
Processes 11 00977 g005
Figure 6. Effect of S. herbacea extract and IR3G on blood lipid profile in db/db mice. Total cholesterol (TC) (A). Triglyceride (B). High-density lipoprotein (HDL) (C). Low-density lipoprotein (LDL) (D). Data are presented as the mean ± standard deviation (SD) of three independent experiments. # p < 0.001 indicates a significant difference compared to the db/db control group. ** p < 0.01 and * p < 0.05 compared to the MDI group.
Processes 11 00977 g006
Table 1. HPLC mobile phase gradient.
Time (min)Mobile Phase A (%)Mobile Phase B (%)
08317
107030
257030
302080
350100
400100
508317
558317
Mobile phase A: 99.5% H2O and 0.5% acetic acid; mobile phase B: 100% acetonitrile.
Table 2. Effects of S. herbacea extract and IR3G on adipocytes in db/db mice.
Gene TypeContentsLeptin (µg/mL)Adiponectin (ng/mL)
db/-Saline0.2 ± 0.0923.6 ± 6.93
db/dbSaline3.7 ± 0.17 #16.7 ± 4.51 #
db/dbS. herbacea 50 mg/kg3.5 ± 0.1515.4 ± 2.90
db/dbS. herbacea 200 mg/kg3.3 ± 0.45 *18.1 ± 5.25
db/dbIR3G 50 mg/kg3.5 ± 0.2315.4 ± 4.75
Data are presented as the mean ± standard deviation (SD) of three independent experiments. # p < 0.01 indicates a significant difference compared to the control (db/-) group. * p < 0.05 indicates a significant difference compared to the db/db control group.
Disclaimer/Publisher’s Note: The statements, opinions and data contained in all publications are solely those of the individual author(s) and contributor(s) and not of MDPI and/or the editor(s). MDPI and/or the editor(s) disclaim responsibility for any injury to people or property resulting from any ideas, methods, instructions or products referred to in the content.