Article

Disturbing Effect of Intra-Tissue Temperature Sensors in Pre-Clinical Experimental Studies of Radiofrequency Cardiac Ablation: A Computer-Based Modeling Study

by
Luis Cuenca-Dacal
1,
Enrique Berjano
1,
Ana González-Suárez
2,3 and
Juan J. Pérez
1,*
1
BioMIT, Department of Electronic Engineering, Universitat Politècnica de València, 46022 Valencia, Spain
2
Translational Medical Device Lab, School of Engineering, National University of Ireland, H91 TK33 Galway, Ireland
3
Escuela Superior de Ingeniería, Ciencia y Tecnología, Universidad Internacional de Valencia—VIU, 46002 Valencia, Spain
*
Author to whom correspondence should be addressed.
Processes 2023, 11(4), 1168; https://doi.org/10.3390/pr11041168
Submission received: 3 March 2023 / Revised: 27 March 2023 / Accepted: 6 April 2023 / Published: 11 April 2023
(This article belongs to the Section Advanced Digital and Other Processes)

Abstract

:
Background: Preclinical studies on radiofrequency (RF) cardiac ablation (RFCA) use very small temperature sensors in specific positions in the tissue subjected to RF heating. Despite the sensors’ small size, the proximity to the ablation electrode and the extremely high thermal gradient around the electrode means that the presence of the temperature sensors could distort the temperatures recorded. Our objective was to assess the thermal impact of intra-tissue temperature sensors during RFCA. Methods: 3D RFCA models were built including different temperature sensors based on fiber optics and T-type thermocouples. Constant power ablation was simulated for 10 s. Results: The results showed that the disturbance caused by the presence of the T-type thermocouples was considerably greater (one order of magnitude) than that caused by the optical fibers. The closer the sensor was to the ablation electrode, the greater the greater the disturbance was and the more it increased with time in sensors more than 3 mm deep. The fiber optic measurements always slightly underestimated (<0.2 °C) the tissue temperature that would exist without the sensors, while the disturbance caused by the T-type thermocouples did not always result in underestimation but depended on the depth of the sensors parallel to the catheter. Conclusions: The presence of thermocouples inserted into the tissue close to the RF ablation electrode involves a disturbance that could affect the measured temperature value, although it does not substantially alter the shape and size of the thermal lesion. Optical fibers cause much less disturbance, possibly due to the absence of internal metal parts that favor heat conduction.

1. Introduction

Different sources of energy are currently used to ablate biological tissues in order to cure different diseases. Radiofrequency (RF), microwave, ultrasound, and laser are used to cause an increase in temperature that allows the irreversible destruction of biological tissue. In the opposite direction, the cryoablation technique also causes irreversible damage when freezing biological tissue. In essence, these techniques work by applying an external source of energy, which is deposited in the target tissue, causing an increase or decrease in temperature. The resultant temperature map in the tissue depends not only on the characteristics of the energy source (power and duration) but also on heat evacuation mechanisms such as thermal conduction towards contiguous tissues and the heat sink effect due to capillary blood perfusion. It is a complex thermal process due to the high selectivity required both in space and in the temperature ranges to be reached.
One of the most important ablative techniques is the ablation of cardiac arrhythmias. In particular, RF catheter ablation (RFCA) is a minimally invasive procedure aimed at curing cardiac arrhythmias using RF electrical energy to cause irreversible thermal destruction of the arrhythmia focus. It is based on introducing an intravascular catheter until it reaches the target site in the heart, then applying RF power through a metal electrode at the catheter tip. This electrode is called an active electrode or ablation electrode. RF current circulates between the active electrode and a large dispersive electrode on the patient’s skin (usually back or thigh) [1]. Innovation in RF ablation catheters is usually based on the design and development of new prototypes, as well as the execution of preclinical studies (bench tests) aimed at obtaining relevant data on the performance and safety of RFCA devices prior to conducting clinical trials [2].
Preclinical studies are also required to experimentally validate the computational models [1]. Preclinical studies try to replicate in a laboratory bench the same conditions that occur in actual clinical situations. They are usually based on a tissue-equivalent material phantom [3] or ex vivo tissue [4]. The outcomes are usually the lesion sizes and the evolution of the temperature at different points of the tissue. The latter is always a challenge since the sensors must be positioned very accurately in relation to the position of the ablation electrode. In addition, it is technically impossible to completely map the tissue, so a limited number of sensors must be chosen. It is usual to choose sensors that are separated by a few millimeters from the ablation electrode. Note that although there are other alternatives to map temperature, such as the use of infrared thermal imaging, these images are usually limited to the surface of the tissue and not to what happens in depth.
In conclusion and in practical terms, RFCA preclinical studies generally require very small temperature sensors to be placed at specific positions in the material subjected to RF heating. To date, both optical fibers [5,6] and thermocouples [4] have been used for this purpose, and thermistors more rarely [7]. In spite of their very small size (0.3–0.4 mm outer diameter), the proximity to the ablation electrode (up to 3 mm distant) and the extremely high thermal gradient around the electrode means that the presence of the temperature sensors could alter the temperatures recorded. The objective of our study was to use computer modeling to assess the impact of intra-tissue temperature sensors during RFCA, specifically to compare the thermal distortion caused by the presence of thermocouples and optical fibers in the tissue subjected to RF heating.

2. Methods

2.1. Model Geometry

Three-dimensional computational models were built, including a 7.5 Fr—4 mm rounded-tip electrode perpendicular to the tissue and surrounded by blood. This is a typical active electrode used to ablate cardiac arrhythmias. The electrode was assumed to be inserted in the tissue 0.5 mm, which would mimic a low contact force between the electrode and tissue [8]. Due to there being only one symmetry plane, the model only considered half the real volume. Figure 1 shows the model geometry of the model considered. This model was a limited domain, i.e., with only a representative volume of tissue around the RF catheter, so the position of the dispersive patch was assumed to be an electrical boundary condition (0 V) set on some of the outer limits [9].

2.2. Modeling of Temperature Sensors

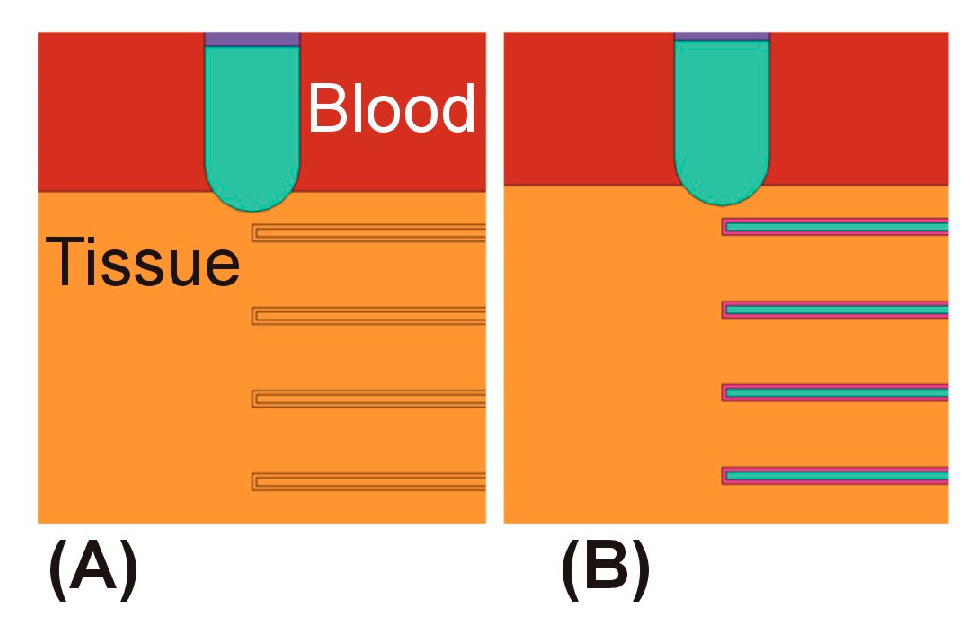
We considered two typical temperature sensors in pre-clinical RFCA studies: thermocouples and optical fibers. In both cases, the sensor was simplified by assuming two constituent parts: an inner (the sensor itself) and an outer (coating) (see Figure 1B). The thermocouple mimicked a Physitemp Instruments model IT-21 T-type thermocouple (Clifton, NJ, USA) and was assumed to comprise an 0.2 mm diameter inner cylinder with similar properties to those of copper and constantan wires (see Table 1), coated by a cylindrical 0.4 mm outer diameter Teflon shell (i.e., 0.1 mm thick). The optical fiber mimicked a Luna model ODiSI 6000 sensor (Roanoke, VA, USA) and was assumed to comprise a 0.15 mm diameter inner cylinder with glass fiber properties (see Table 1 [10,11,12]), coated by a 0.3 mm outer diameter polyimide cylindrical shell (i.e., 0.75 mm thick). These materials and dimensions were taken from the manufacturer’s specifications datasheet. The tip of the sensors was assumed to be equally coated with the same thickness as the rest of the sensor (see Figure 1B), representing the best case in terms of avoiding direct RF interference conducted through the interior of the sensor, which would cause RF-induced self-heating.

2.3. Spatial Arrangement of the Temperature Sensors

Based on the different pre-clinical studies in which intra-tissue temperature sensors were used, we considered three spatial arrangements. In the first case, different sensors were placed at different depths (1, 3, 5, and 7 mm) below the tissue surface at distances of 1, 2, 3, and 4 mm from the lateral edge of the tip of the ablation electrode (see Figure 2), as in [5]. In the second case, as in [4], different sensors were aligned with their axes perpendicular to the catheter axis and their tips just below the catheter axis at depths of 1, 3, 5, and 7 mm (Figure 3). In the third case, a multipoint temperature probe was only attached to the catheter surface, leaving the different “sensing zone” at different depths from the tissue surface, i.e., at 3, 5, and 7 mm, as in [6] (Figure 4).

2.4. Properties of Materials and Tissues

Tissue properties were taken from the IT’IS Foundation database at 500 kHz [10], while the ablation catheter properties were taken from Pérez et al. [11] (see Table 1). Blood thermal properties were not included, since the thermal problem was not solved in that sub-domain. The electrical conductivity of the tissues increased by 1.5%/°C. The properties of the T-type thermocouple (inner cylinder shown in Figure 1B) were considered to be the average value of its copper and constantan constituent materials (both taken from [12]). The properties of the optical fiber were assumed to be the average of the materials resulting from filtering the database [12] with the terms “optic,” “quartz,” and “fiber.” The properties of the coatings (Teflon in T-type thermocouple and polyimide in optical fiber) were also taken from [12].

2.5. Model Verification

We used specific points to conduct the model verification (see Figure 5) in the symmetry plane, forming a grid, where the axes of the sensors, as well as the axis and lateral edge of the catheter, coincided with the lines of the different depths at the temperature sensors were placed.
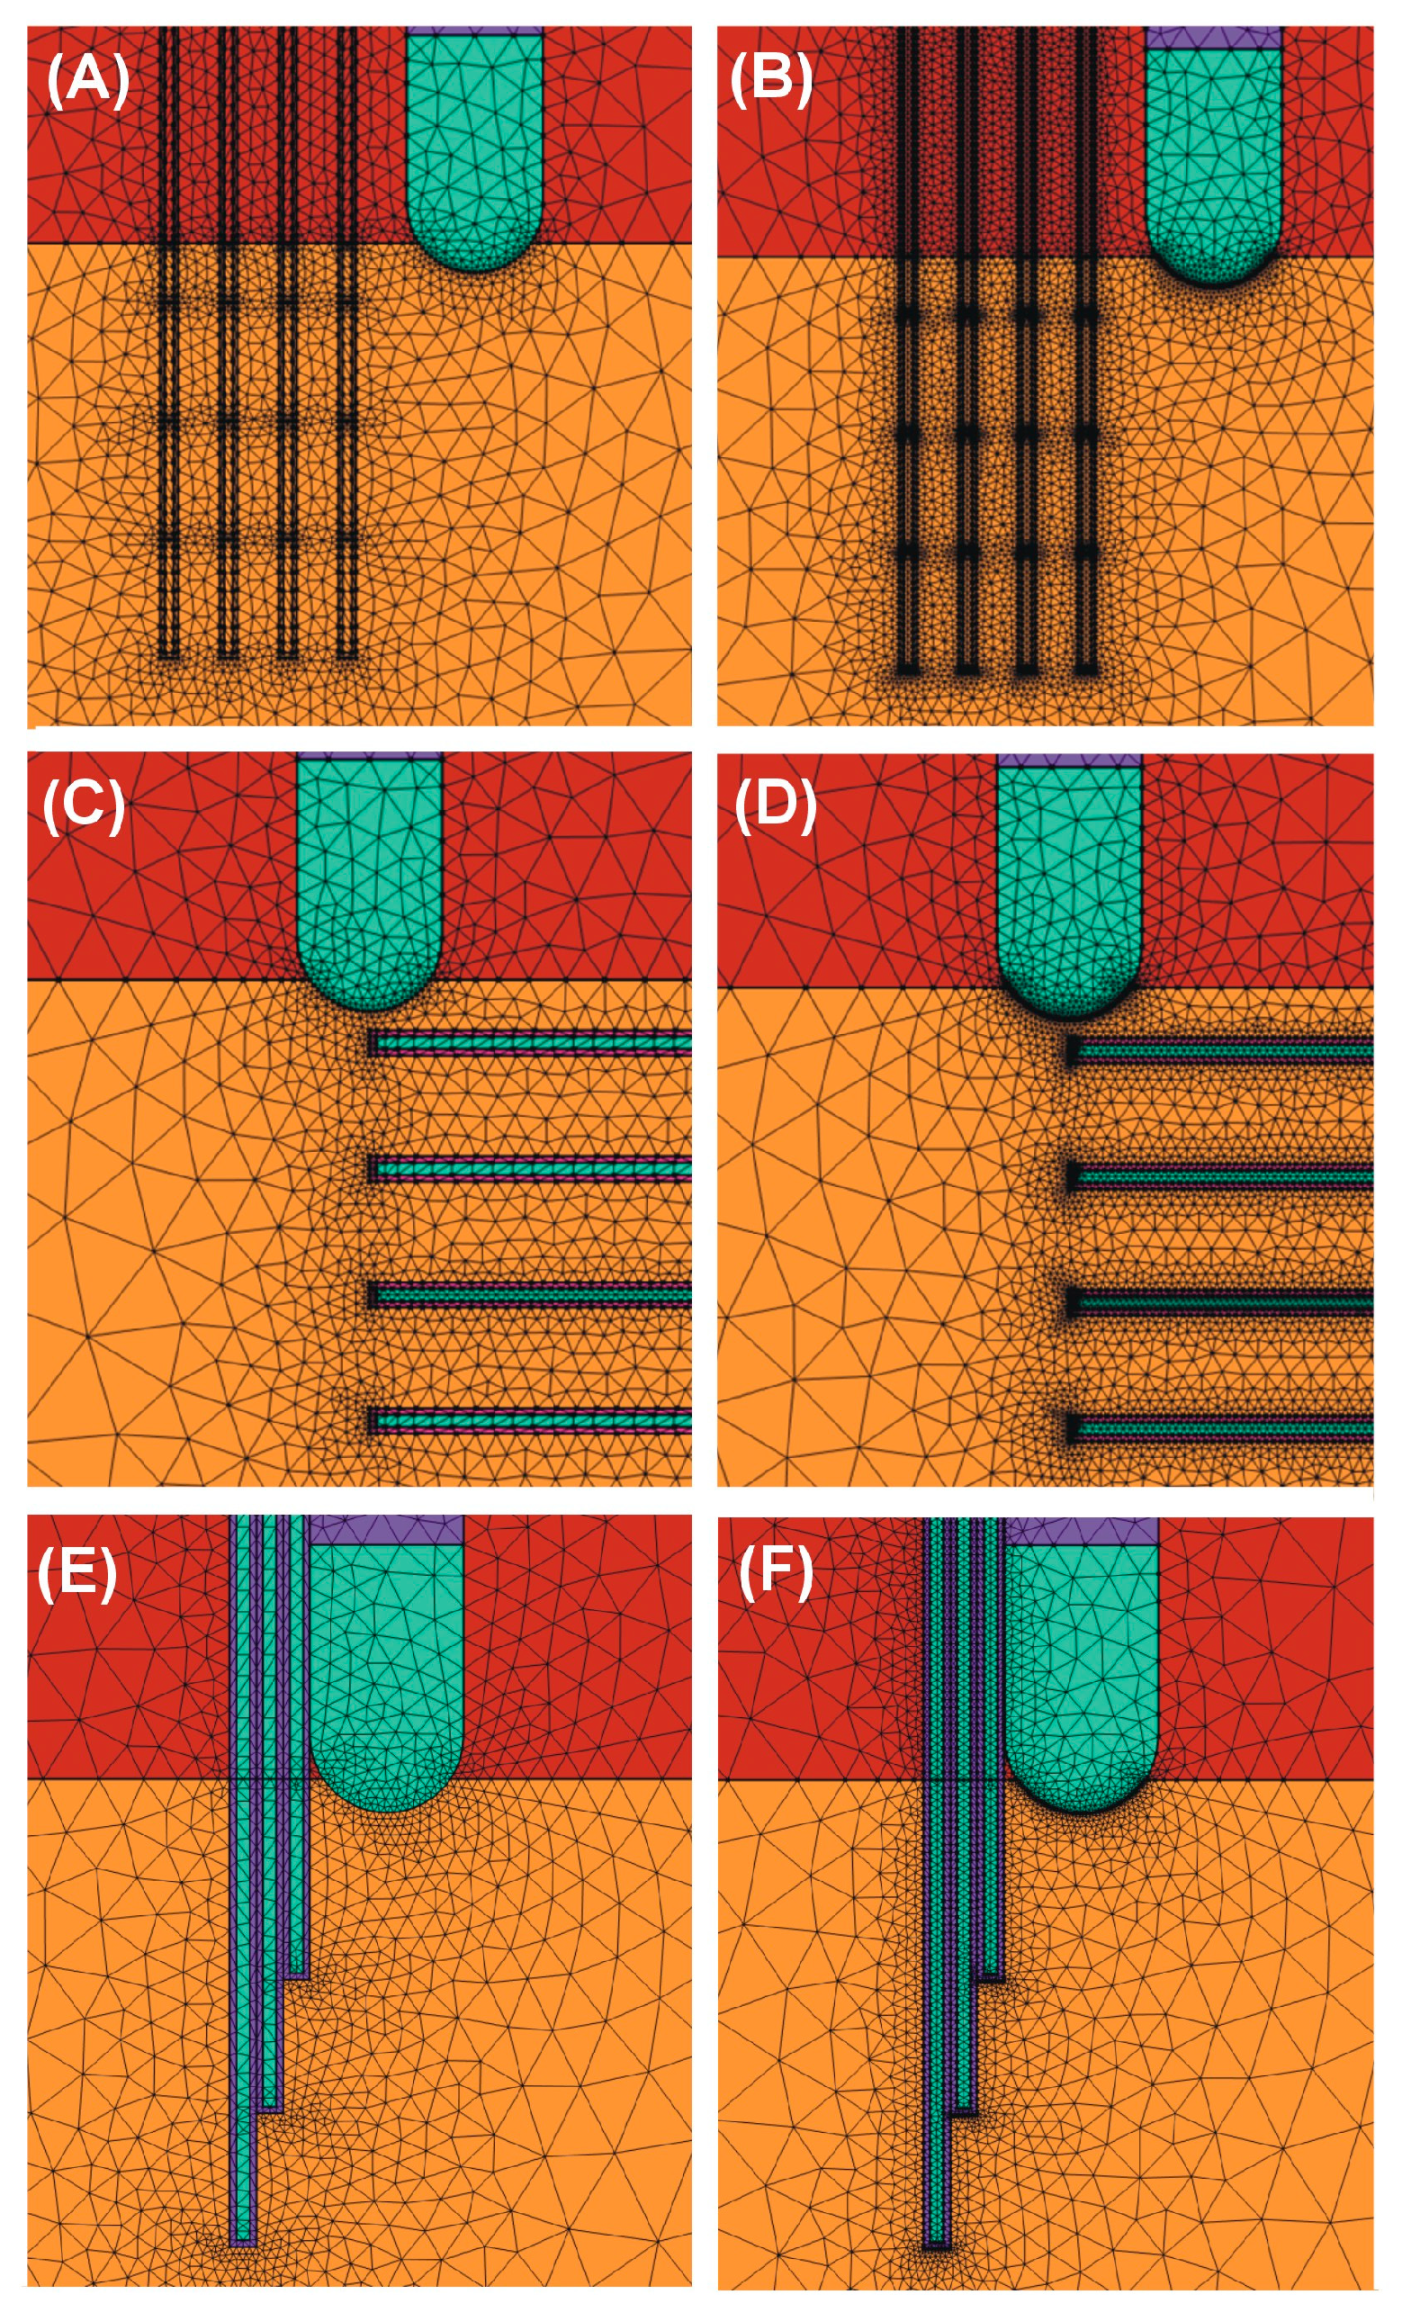
Each model (half of the entire domain) was made up of ~212,000 tetrahedral elements for the cases in which the sensors were placed parallel to the catheter, and ~235,000 tetrahedral elements for the case with the sensors perpendicular to the catheter. The mesh size (from 16 to 100 μm around each electrode and tips of the temperature sensors, and from 0.32 to 4.4 mm in the periphery) was verified by means of a convergence test, using the temperature reached at the evaluation points as convergence parameters, and 0.1 °C as convergence criterion, in a 10 s simulation, in comparison with another model with finer mesh (from 16 to 50 μm around each electrode and the tip of the temperature sensors, and from 0.12 to 2.8 mm at the periphery). Figure 6 shows the optimal and refined meshing for each model.

2.6. Governing Equations and Boundary Conditions

The model solved a coupled electric-thermal problem numerically using the Finite Element Method on COMSOL Multiphysics software (COMSOL, Burlington, MA, USA). The governing equation for the thermal problem was the Bioheat Equation (1):
ρ c T t = · ( k T ) + Q R F + Q p + Q m e t
where ρ is density (kg/m3), c specific heat (J/kg·K), T temperature (°C), t time (s), k thermal conductivity (W/m·K), QRF the heat source caused by RF power (W/m3), Qp the heat loss caused by blood perfusion (W/m3), and Qmet the metabolic heat generation (W/m3). Both Qmet and Qp were ignored as these terms are negligible compared to the others [1]. A quasi-static approximation was employed for the electrical problem. The magnitude of the vector electric field E as obtained from
E = Φ
where Φ is voltage. This equation was obtained from Laplace’s Equation,
· ( σ ( T ) Φ ) = 0
with σ being electrical conductivity. The RF heat source was then obtained as
Q R F = σ E 2
The vaporization was not considered since the tissue temperature remained below 100 °C. The dispersive electrode was simulated using conditions of 0 V on all the outer model surfaces, except on the symmetry plane, where an orthogonal condition of null electrical current was set. Computer simulations were conducted using a sufficiently low power to avoid temperatures over 100 °C for 10 s, as there is still no accurate model to reproduce the phenomena associated with vaporization temperatures. A value of 6 W (equivalent to 12 W in case of considering the full volume) and 10 s duration were used.
The thermal problem was not solved in the blood. Instead, thermal boundary conditions were set on the myocardium-blood and electrode-blood interfaces, specifically with thermal transfer coefficients for low blood flow conditions: 610 W/m2·K and 3346 W/m2·K, respectively, as explained in [13]. Likewise, the interfaces between thermocouple-blood and optical fiber-blood were modeled with thermal transfer coefficients: 8120 W/m2·K and 9470 W/m2·K, respectively. A temperature of 37 °C was set at the outer tissue contours to simulate body temperature.

3. Results

3.1. Sensors Parallel to the Ablation Catheter Axis

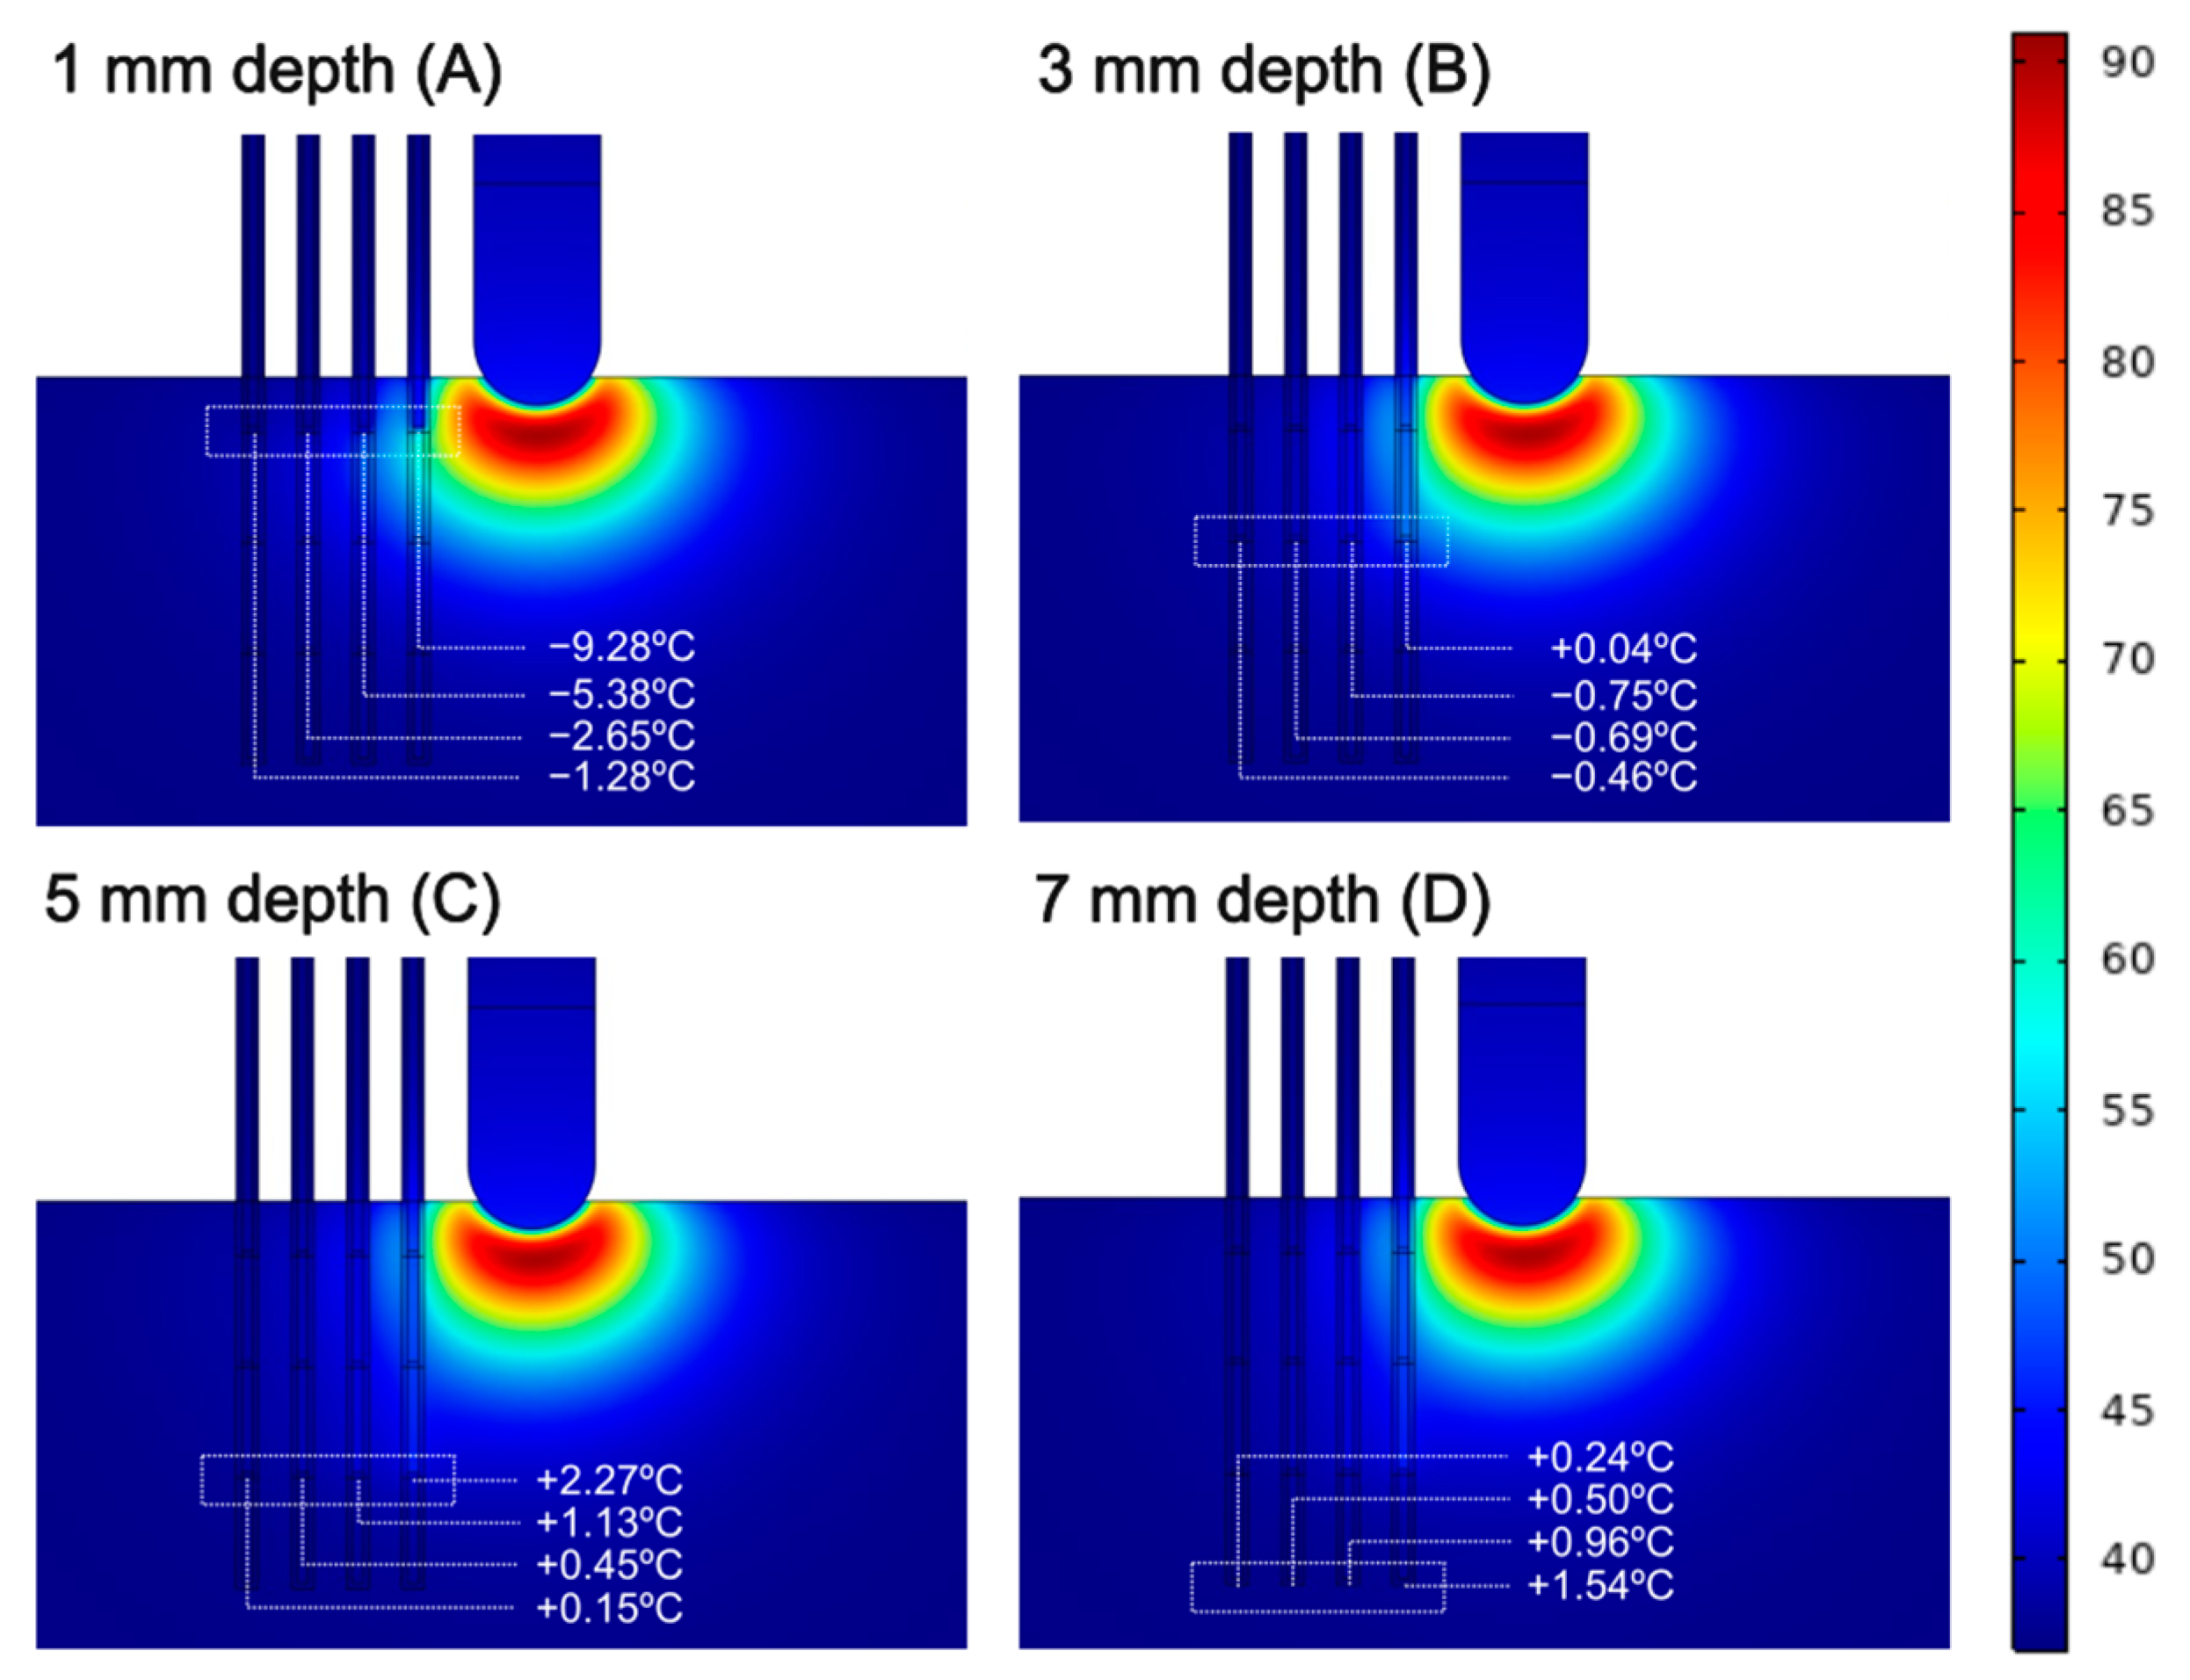
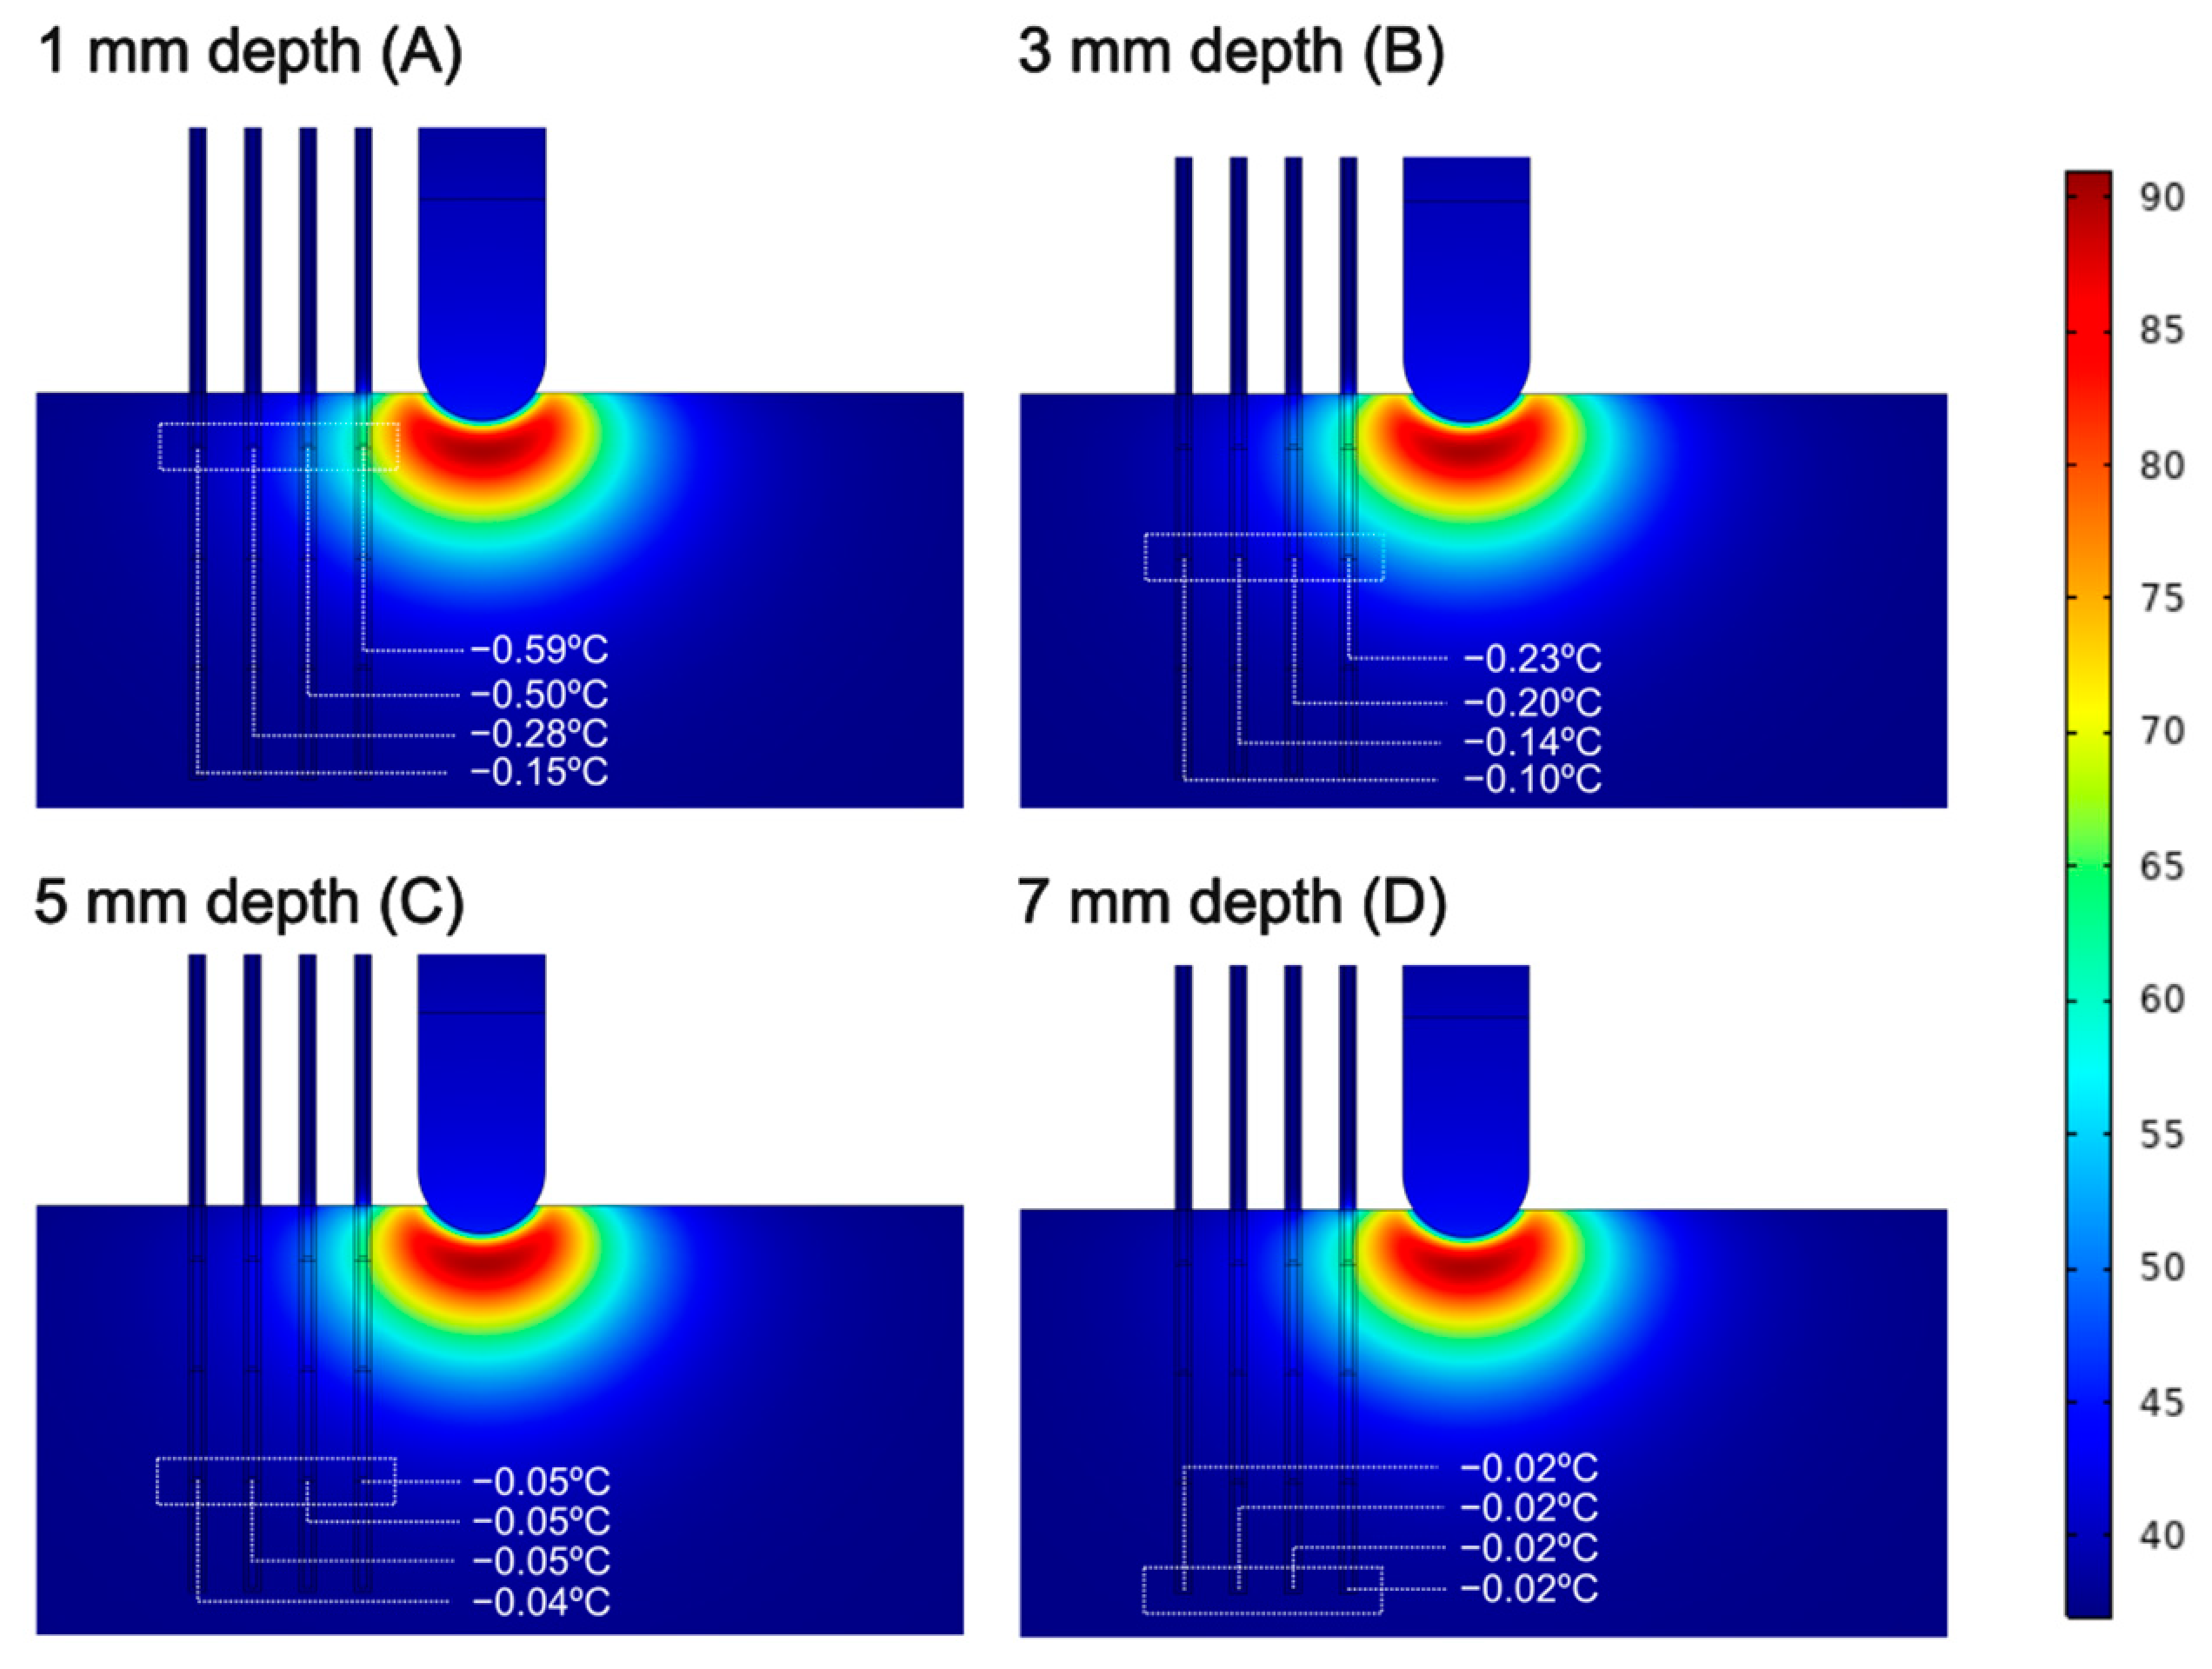
Figure 6 shows the temperature distributions at 10 s for the of T-type thermocouples placed at depths of 1, 3, 5, and 7 mm below the tissue surface and at 1, 2, 3, and 4 mm from the lateral edge of the tip of the ablation electrode. The numbers indicate differences with the cases without sensors, i.e., how the presence of sensors inside the tissues underestimates or overestimates the readings. Overall, these differences were smaller as the sensors were farther from the ablation electrode. There is a general trend toward underestimation in the measurement when the sensors are located at a shallow depth (Figure 6A) compared to an overestimation when they are located deeper (Figure 7C).
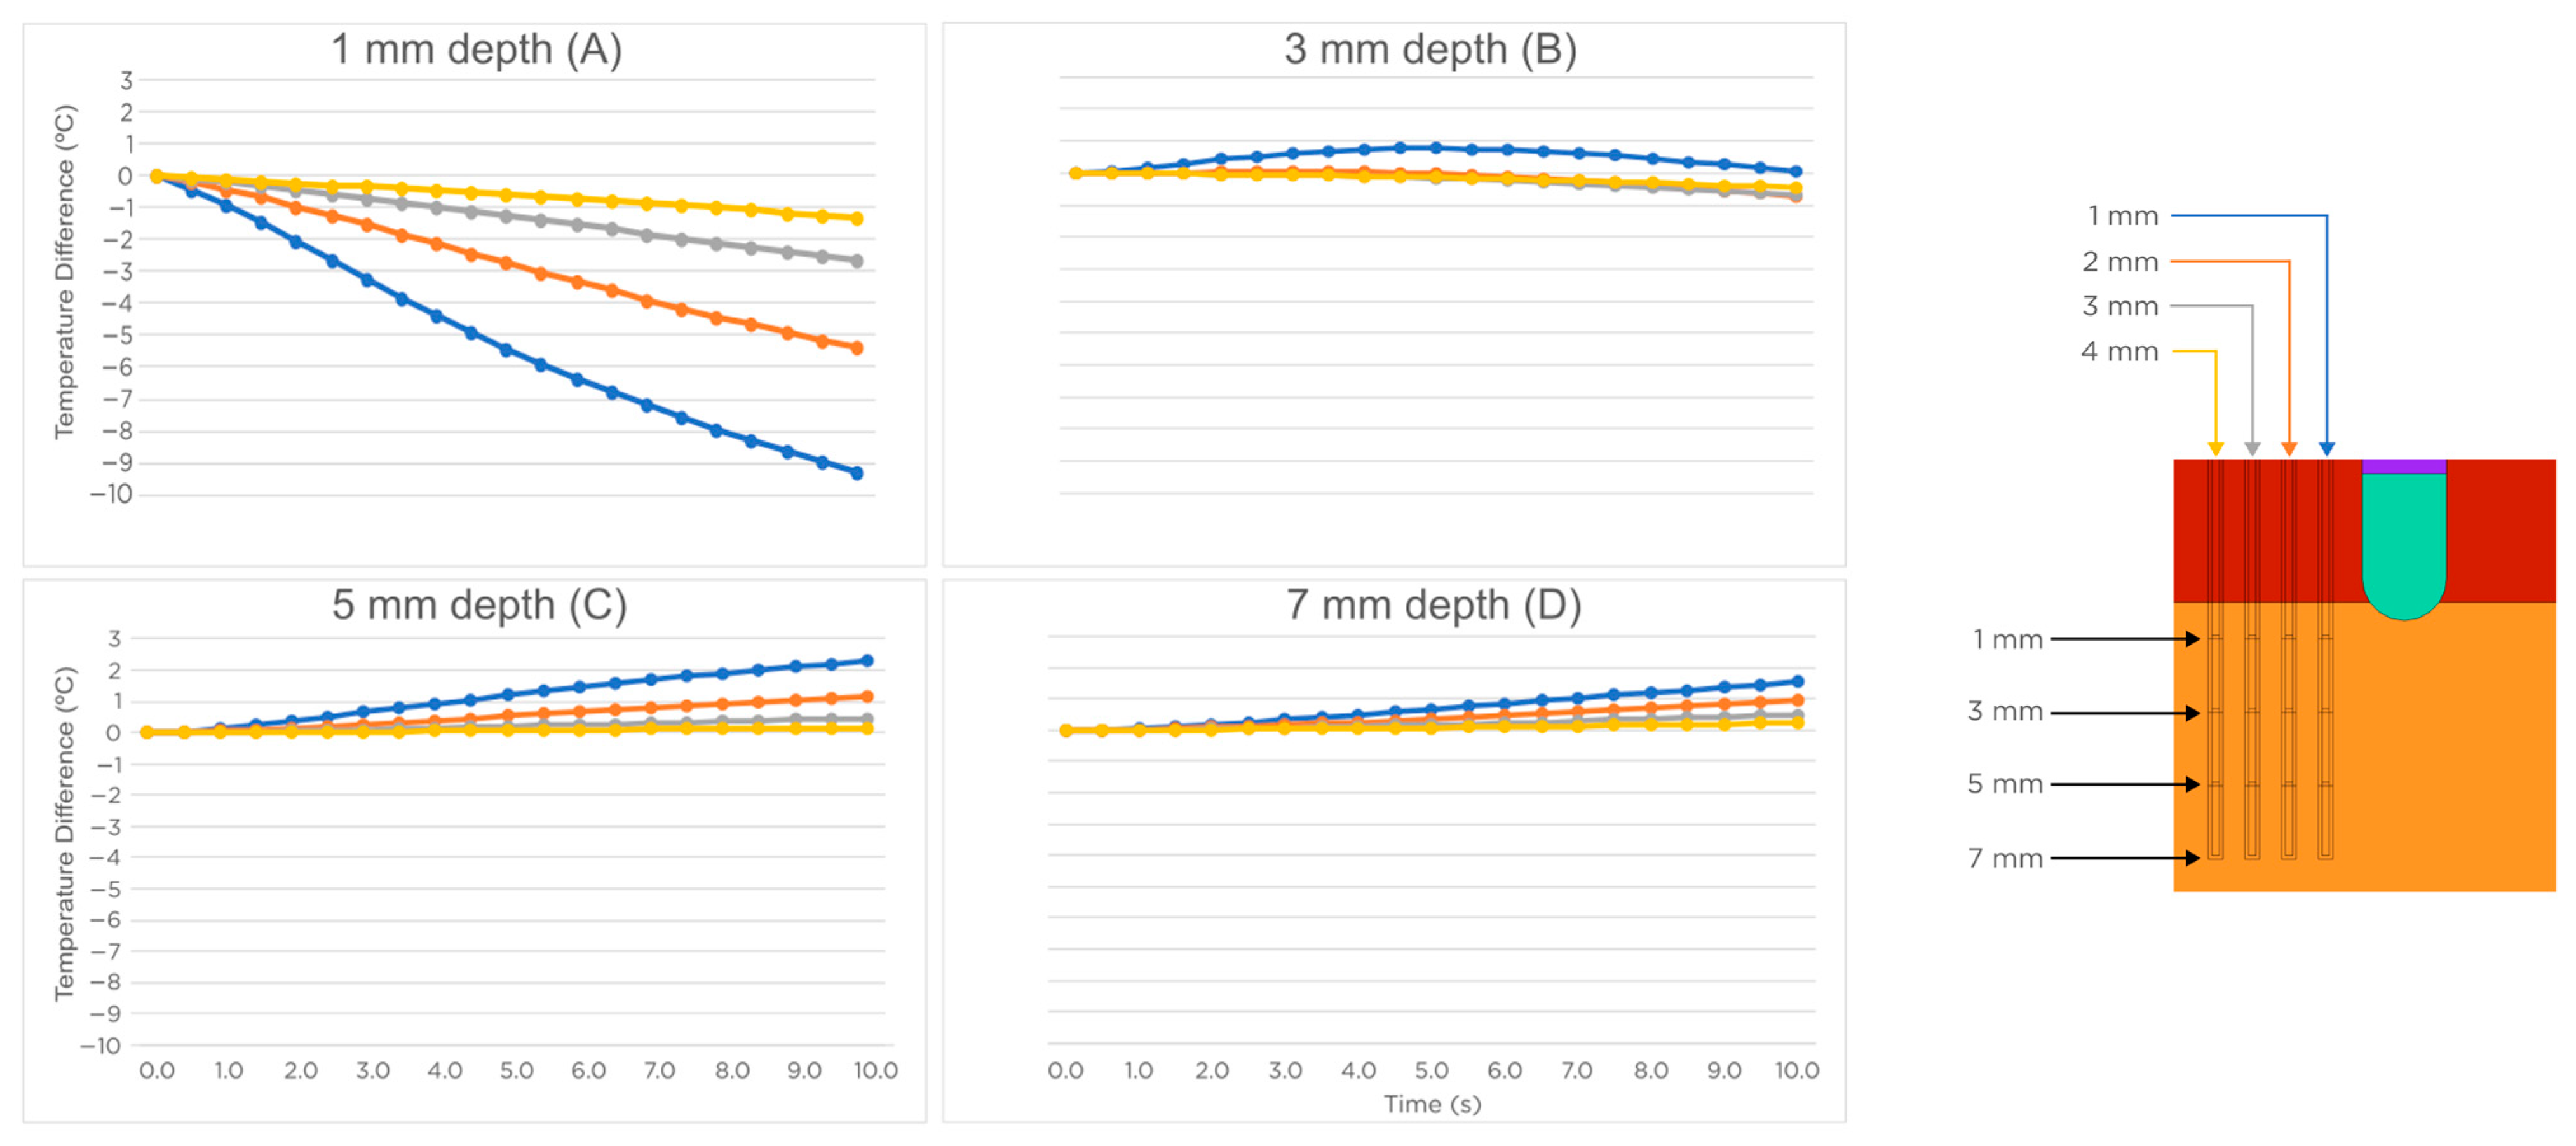
The maximum difference was recorded with the sensor at a depth of 1 mm and at 1 mm from the lateral edge of the catheter. In this case, the sensor underestimated the temperature by 9.28 °C at 10 s. However, the results also show that this value changed over time. In this regard, Figure 8 shows the progress of the differences between the four sensors inserted at different depths. At 1 mm, they underestimated the measured temperature. At 3 mm, the sensor at 1 mm lightly overestimated, and the rest underestimated the measured temperature. At 5 and 7 mm, they always overestimated the measured temperature.
The optical fibers placed parallel to the RF catheter axis had a much less disturbing effect than the T-type thermocouples. Figure 9 shows the temperature distributions at 10 s for the optical fibers at depths of 1, 3, 5, and 7 mm below the tissue surface and at 1, 2, 3, and 4 mm from the lateral edge of the tip of the ablation electrode.
Figure 10 shows the progress of the difference for the four sensors inserted at four different depths. In all cases, the sensor underestimated the temperatures and did so more markedly as time progressed. The differences with the case with no sensor were considerably smaller than with the T-type thermocouples (less than 0.6 °C at 1 mm depth).

3.2. Temperature Sensors Perpendicular to the Ablation Catheter Axis

Figure 11 shows the temperature distributions at 10 s for the case without sensors, T-type thermocouples, and optical fibers. The sensors were aligned with their axes perpendicular to the catheter axis and their tips just below the catheter axis at depths of 1, 3, 5, and 7 mm. The presence of the thermocouples considerably altered the temperature distributions on the side with the sensors. The optical fibers did not have this effect. This can be clearly seen in Figure 12, in which the thermocouple at 1 mm underestimated the temperature value by up to 9.8 °C, and the sensor at 3 mm underestimated it by 3.2 °C with the difference increasing over time. In contrast, optical fibers underestimated the temperature value by a maximum of 0.32 °C.
Figure 13 shows the temperature distributions at 10 s for the case without sensors, T-type thermocouples, and optical fibers. Although the sensors are quite close to the catheter, the tissue temperature was disturbed at 10 s by only 0.8 °C in the thermocouples and 0.25 °C in the optical fibers, both at a depth of 3 mm. Note that the lesion geometry does seem slightly deformed by the presence of the thermocouples (see Figure 13B).

4. Discussion

4.1. Main Findings

An RFCA in silico model was developed to analyze the possible disturbing impact of small temperature sensors in the tissue heated during RFCA pre-clinical studies. The models considered the technical details of three broadly used temperature sensors (T-type thermocouples and optical fibers) as well as the typical positions in pre-clinical studies [14]. Overall, we found that the disturbance caused by the presence of the T-type thermocouples was considerably larger (one order of magnitude) than that caused by the optical fibers. In addition, the disturbance increased with proximity to the ablation electrode and with time. In fact, the exact value of the disturbance depended on the exact position of the sensor with respect to the ablation electrode, as well as its relative position with respect to the RF catheter axis (perpendicular, parallel, and directly attached). In simulated cases, and with an ablation duration of only 10 s, the differences could reach ~10 °C. The most dramatic case in terms of disturbance was with T-type thermocouples placed very close to the ablation electrode (1 mm distance), both perpendicular and parallel to the catheter axis. In contrast, the fiber optic sensors slightly underestimated (<0.6 °C) the tissue temperature that would be recorded without sensors. In the third arrangement in which a multipoint sensor was in direct contact with the catheter surface, a disturbance similar to the other cases was found, as compared with the sensors at a depth of 3 mm. It must be borne in mind that this multipoint probe has its closest sensor at a depth of 3 mm, unlike the other configurations, in which some sensors are closer to the ablation electrode.
Both with thermocouples and optical fibers, there was an increasing trend in the difference between temperatures measured with and without sensors, which suggests even higher values for longer durations. Note that, in this study, only a 10-s duration was simulated, in accordance with the current trend to use short RF pulses. For this reason, our values provide a reasonable prediction about what would happen in the case of the current RFCA.
The only possible explanation we find for the better thermal performance of optical fibers compared to thermocouples is the absence of metallic parts inside the optical fibers. Our mathematical model solved a static electrical problem where displacement currents were ignored. Consequently, the differences found between the thermocouples and optical fibers can only be due to the different thermal properties of the sensors’ constituent elements, especially due to the higher thermal conductivity of the metals used in the thermocouple (206 W/m·K) compared with the interior of the optical fiber (2 W/m·K). It seems that, despite the fact that the thermocouples are electrically isolated from the tissue, the metallic cables inside would dissipate the heat in a much more effective way than the constituent material of the optical fiber. This is especially noticeable in the case where the thermocouples are very close to the active electrode. In addition, if we accept this physical explanation as valid, we can extrapolate these conclusions to the case of any sensor that is made up of metallic parts, such as thermistors (terminals and cables).
In addition to the temperature differences computed between the cases with and without sensors, it is also relevant to analyze how the lesion size would change due to the presence of sensors. This estimation was done by analyzing the location of the 55 °C isotherm. In this regard, and despite the appreciable perturbation caused by the thermocouples, the temperature distribution, in general, did not seem to be greatly altered at the 55 °C isotherm (see Figure 7, Figure 11 and Figure 13). This fact does not suggest that the temperature sensors could alter the size of the RF-induced lesion, but it presents an important practical implication for those researchers working with ex vivo and in vivo models in which temperature sensors are located inside the tissue. Our findings suggest that the presence of these sensors will have little impact on the lesion size, but that they should be taken into account when analyzing the temperatures reached at each point.

4.2. Practical Implications

Our study suggests that computer modeling could be a valuable complement to experimental studies with temperature sensors inserted into the tissue. Results also indicate that the characterization and quantification of the possible disturbance caused by the sensors themselves would allow adjusting the values measured experimentally and enhance the accuracy of the results. These implications are especially important given that the possible temperature measurement errors caused by the presence of the sensors will be greatly influenced by the specific details of each temperature sensor, such as constituent materials, geometry, and the specific power-duration settings of the RFCA.
It is also important to mention that our results could be useful not only in the context of RF cardiac ablation but also in other applications of heating biological tissues for different purposes, such as tumor ablation. In addition, taking into account the mechanism by which the thermal disturbance occurs when sensors made up of metallic parts are used, our results would also be useful in the context of ablative therapies using other sources of energy, such as microwave, laser, ultrasound, and cryoablation. In other words, apart from the possible interference between the energy source and the temperature sensors, the simple presence of small metal parts in places extremely close to the applicator would disturb the temperature map.

4.3. Limitations

Our modeling study was limited to specific conditions of electrode design, blood flow, power, time protocol, etc. However, it must be recognized that other conditions may occur in experimental RFCA studies and that our results do not cover all the possible circumstances. Despite these factors, since our study was based on comparisons between cases with and without temperature sensors, there is no physical reason to suspect that the conclusions would change under different conditions.
Also, our model did not consider the possible interference by capacitive coupling between the RF current and the metal wires in the thermocouple, as previously studied in the context of thermometry in hyperthermia [15,16,17,18,19]. Note that this interference depends, not only on the properties of the thermocouple and its relative position with respect to the RF electric field induced in the tissue but also on the electromagnetic susceptibility of the measurement equipment to which it is connected and its ability to reject such interference. The latter variable, however, was outside the scope of the present modeling study. In the case that the electronic system to process the temperature signal does not allow for completely rejecting the possible RF interference, the measurement would also be disturbed by this effect.
It must also be taken into account that the thermocouples modeled in our study were completely covered by an insulating part (see Figure 1B). However, some of the thermocouples used in experimental studies lack said insulation, or insulation does not extend to its most distal part, a condition which would favor not only thermal but also electrical disturbance. In this sense, our results can be considered conservative since they only describe the disturbance in the temperature measurement due to heat dissipation through the sensor itself.
Finally, while previous RFCA modeling studies included the different layers of tissue around the ablation electrode to imitate a real clinical scenario (such as myocardium, fat, and connective tissue [9]), our study aimed to assess the thermal impact of the sensors within the tissue, which is normally performed during pre-clinical studies using homogeneous material [3,4] such as agar or ex vivo cardiac tissue. We think that considering heterogeneous tissue would introduce "noise" in the analysis since the results would be strongly influenced by the relative position of the sensor within the different tissue layers. Simplifying the situation by assuming a homogeneous tissue, therefore, seems to be relevant in view of the objective of the study.

5. Conclusions

The findings suggest that the presence of thermocouples in the tissue close to the RF ablation electrode involves a disturbance that, although it does not substantially alter the shape and size of the thermal lesion, could affect the measured temperature value, especially when the sensors are very close to the ablation electrode (<3 mm). Optical fibers cause much less disturbance compared to thermocouples, possibly due to the absence of internal metal parts that favor heat conduction. In the case in which sensors with metallic parts (such as thermocouples and thermistors) are used to measure the temperatures at points very close to the ablation electrode, a computational model specifically adapted to the experimental conditions would be useful to carry out adjustments on the experimental data and thus minimize the impact of the presence of these sensors.

Supplementary Materials

The following supporting information can be downloaded at: https://www.mdpi.com/article/10.3390/pr11041168/s1, the raw data from the computer simulations are provided in an Excel file.

Author Contributions

L.C.-D. and E.B. conceived and designed the study; L.C.-D. and A.G.-S. performed the numerical calculations; L.C.-D., A.G.-S. and J.J.P. wrote the paper. All authors have read and agreed to the published version of the manuscript.

Funding

This research was funded by the Spanish Ministerio de Ciencia e Innovación/Agencia Estatal de Investigación (MCIN/AEI/10.13039/501100011033) by Grant number PID2022-136273OB-C31 and PID2022-136273OA-C33.

Institutional Review Board Statement

Not applicable.

Informed Consent Statement

Not applicable.

Data Availability Statement

The raw data of the computer simulations are published as Supplementary Material.

Conflicts of Interest

The authors declare no conflict of interest.

References

  1. González-Suárez, A.; Pérez, J.J.; Irastorza, R.M.; D’Avila, A.; Berjano, E. Computer modeling of radiofrequency cardiac ablation: 30 years of bioengineering research. Comput. Methods Programs Biomed. 2022, 214, 106546. [Google Scholar] [CrossRef] [PubMed]
  2. Hsu, S.S.; Hoh, L.; Rosenbaum, R.M.; Rosen, A.; Walinsky, P.; Greenspon, A.J. A method for the in vitro testing of cardiac ablation catheters. IEEE Trans. Microw. Theory Tech. 1996, 44, 1841–1847. [Google Scholar] [CrossRef]
  3. Rossmann, C.; Motamarry, A.; Panescu, D.; Haemmerich, D. Computer simulations of an irrigated radiofrequency cardiac ablation catheter and experimental validation by infrared imaging. Int. J. Hyperth. 2021, 38, 1149–1163. [Google Scholar] [CrossRef] [PubMed]
  4. Demazumder, D.; Mirotznik, M.S.; Schwartzman, D. Comparison of irrigated electrode designs for radiofrequency ablation of myocardium. J. Interv. Card. Electrophysiol. 2001, 5, 391–400. [Google Scholar] [CrossRef] [PubMed]
  5. Petersen, H.H.; Chen, X.; Pietersen, A.; Svendsen, J.H.; Haunsø, S. Tissue temperatures and lesion size during irrigated tip catheter radiofrequency ablation: An in vitro comparison of temperature-controlled irrigated tip ablation, power-controlled irrigated tip ablation, and standard temperature-controlled ablation. Pacing Clin. Electrophysiol. 2000, 23, 8–17. [Google Scholar] [CrossRef] [PubMed]
  6. Nakagawa, H.; Ikeda, A.; Sharma, T.; Govari, A.; Ashton, J.; Maffre, J.; Lifshitz, A.; Fuimaono, K.; Yokoyama, K.; Wittkampf, F.H.M.; et al. Comparison of in vivo Tissue Temperature Profile and Lesion Geometry for Radiofrequency Ablation with High Power-Short Duration and Moderate Power-Moderate Duration: Effects of Thermal Latency and Contact Force on Lesion Formation. Circ. Arrhythm. Electrophysiol. 2021, 14, e009899. [Google Scholar] [CrossRef] [PubMed]
  7. Kovoor, P.; Daly, M.P.; Pouliopoulos, J.; Byth, K.; Dewsnap, B.I.; Eipper, V.E.; Yung, T.; Uther, J.F.; Ross, D.L. Comparison of radiofrequency ablation in normal versus scarred myocardium. J. Cardiovasc. Electrophysiol. 2006, 17, 80–86. [Google Scholar] [CrossRef] [PubMed]
  8. Pérez, J.J.; Gonzalez-Suárez, A.; Maher, T.; Nakagawa, H.; D’Avila, A.; Berjano, E. Relationship between luminal esophageal temperature and volume of esophageal injury during RF ablation: In silico study comparing low power-moderate duration vs. high power-short duration. J. Cardiovasc. Electrophysiol. 2022, 33, 220–230. [Google Scholar] [CrossRef] [PubMed]
  9. Irastorza, R.M.; Gonzalez-Suarez, A.; Pérez, J.J.; Berjano, E. Differences in applied electrical power between full thorax models and limited-domain models for RF cardiac ablation. Int. J. Hyperth. 2020, 37, 677–687. [Google Scholar] [CrossRef] [PubMed]
  10. Hasgall, P.A.; Di Gennaro, F.; Baumgartner, C.; Neufeld, E.; Lloyd, B.; Gosselin, M.C.; Payne, D.; Klingenböck, A.; Kuster, N. IT’IS Database for Thermal and Electromagnetic Parameters of Biological Tissues, Version 4.1; IT’IS Foundation: Zürich, Switzerland, 2022; Available online: https://itis.swiss/virtual-population/tissue-properties/overview/ (accessed on 5 January 2023). [CrossRef]
  11. Pérez, J.J.; Ewertowska, E.; Berjano, E. Computer modeling for radiofrequency bipolar ablation inside ducts and vessels: Relation between pullback speed and impedance progress. Lasers Surg. Med. 2020, 52, 897–906. [Google Scholar] [CrossRef] [PubMed]
  12. Material Property Database. Available online: www.matweb.com (accessed on 5 January 2023).
  13. Suárez, A.G.; Hornero, F.; Berjano, E.J. Mathematical modeling of epicardial RF ablation of atrial tissue with overlying epicardial fat. Open Biomed. Eng. J. 2010, 4, 47–55. [Google Scholar] [CrossRef] [PubMed] [Green Version]
  14. Zaltieri, M.; Massaroni, C.; Cauti, F.M.; Schena, E. Techniques for Temperature Monitoring of Myocardial Tissue Undergoing Radiofrequency Ablation Treatments: An Overview. Sensors 2021, 21, 1453. [Google Scholar] [CrossRef] [PubMed]
  15. Dunscombe, P.B.; Constable, R.T.; McLellan, J. Minimizing the self-heating artefacts due to the microwave irradiation of thermocouples. Int. J. Hyperth. 1988, 4, 437–445. [Google Scholar] [CrossRef] [PubMed]
  16. Kaatee, R.S.; Crezee, H.; Visser, A.G. Temperature measurement errors with thermocouples inside 27 MHz current source interstitial hyperthermia applicators. Phys. Med. Biol. 1999, 44, 1499–1511. [Google Scholar] [CrossRef] [PubMed]
  17. Song, C.W.; Rhee, J.G.; Lee, C.K.; Levitt, S.H. Capacitive heating of phantom and human tumors with an 8 MHz radiofrequency applicator (Thermotron RF-8). Int. J. Radiat. Oncol. Biol. Phys. 1986, 12, 365–372. [Google Scholar] [CrossRef] [PubMed]
  18. Chakraborty, D.P.; Brezovich, I. Error sources affecting thermocouple thermometry in RF electromagnetic fields. J. Microw. Power. 1982, 17, 17–28. [Google Scholar] [CrossRef] [PubMed]
  19. Chakraborty, D.P.; Brezovich, I. A source of thermocouple error in radiofrequency electric fields. Electron. Lett. 1980, 16, 853–854. [Google Scholar] [CrossRef]
Figure 1. (A): Geometry of the model. (B): Detail of the temperature sensor tip, which was simplified by considering an inner part (metal in the case of the T-type thermocouple and quartz for the optical fiber), and an outer part mimicking the consistently thick coating, which completely covered the sensor tip.
Processes 11 01168 g001
Figure 2. Models of temperature sensors placed at depths of 1 mm (B), 3 mm (C), 5 mm (D), and 7 mm (E) below the tissue surface. The sensors were at 1, 2, 3, and 4 mm from the lateral edge of the tip of the ablation electrode. All the models, including the case without sensors (A), had the same geometry and meshing.
Processes 11 01168 g002
Figure 3. Model for the case of sensors aligned with their axes perpendicular to the catheter axis and their tips just below the catheter axis at depths of 1, 3, 5, and 7 mm (B). The model of the case without sensors (A) had the same geometry and meshing.
Processes 11 01168 g003
Figure 4. Model of a multipoint temperature probe attached only to the catheter surface, leaving the different “sensing zones” at different depths from the surface, i.e., at 3, 5, and 7 mm (B). The model of the case without sensors (A) had the same geometry and meshing.
Processes 11 01168 g004
Figure 5. Relevant points (black rectangles) for the sensitivity analysis (units in mm).
Processes 11 01168 g005
Figure 6. Optimal (A,C,E) and refined (B,D,F) meshing for sensors placed parallel, perpendicular, and attached to the RF catheter axis.
Processes 11 01168 g006
Figure 7. Temperature distributions at 10 s for T-type thermocouples placed at depths of 1 mm (A), 3 mm (B), 5 mm, (C) and 7 mm (D) below the tissue surface. The four sensors were at 1, 2, 3, and 4 mm from the lateral edge of the tip of the ablation electrode. The numbers indicate the differences with the case without temperature sensors (scale in °C).
Processes 11 01168 g007
Figure 8. Progress of the difference of temperatures computed with and without temperature sensors. The sensors were T-type thermocouples at 1, 2, 3, and 4 mm from the lateral edge of the tip of the ablation electrode. Four cases were plotted by considering the sensor tips at different depths below the tissue surface: 1 mm (A), 3 mm (B), 5 mm (C), and 7 mm (D).
Processes 11 01168 g008
Figure 9. Temperature distributions at 10 s of optical fibers at depths of 1 mm (A), 3 mm (B), 5 mm (C), and 7 mm (D) below the tissue surface. The four sensors were at 1, 2, 3, and 4 mm from the lateral edge of the tip of the ablation electrode. The numbers indicate differences with the case without temperature sensors (scale in °C).
Processes 11 01168 g009
Figure 10. Progress of the temperature difference computed with and without temperature sensors. The sensors were optical fibers at 1, 2, 3, and 4 mm from the lateral edge of the tip of the ablation electrode. Four cases were plotted by considering the sensor tips at different depths below the tissue surface: 1 mm (A), 3 mm (B), 5 mm (C), and 7 mm (D).
Processes 11 01168 g010
Figure 11. Temperature distributions at 10 s for the case without (A) and with (B,C) temperature sensors perpendicular to the RF catheter axis: T-type thermocouples (B) and optical fibers (C) (scale in °C).
Processes 11 01168 g011
Figure 12. Progress of the temperature difference computed with and without temperature sensors. The sensors were T-type thermocouples (A) and optical fibers (B) aligned with their axes perpendicular to the catheter axis and their tips just below the catheter axis at depths of 1, 3, 5, and 7 mm.
Processes 11 01168 g012
Figure 13. Temperature distributions at 10 s for the case without (A) and with (B,C) multi-point temperature sensors completely attached to the catheter surface: T-type thermocouples (B) and optical fibers (C) (scale in °C).
Processes 11 01168 g013
Table 1. Physical characteristics of tissues and materials of the elements used in the models [10,11,12].
Element/Materialσ (S/m)k (W/m·K)ρ (kg/m3)c (J/kg·K)
Electrode/Pt-Ir4.6 × 1067121,500132
Catheter/Polyurethane10−52314401050
Cardiac Chamber/Blood0.748------
Myocardium0.5410.5610813686
Optical fiber/Optical fused quartz5 × 10−922210750
Coating of optical fiber/Polyimide1 × 10−80.1214401090
T-type thermocouple/Copper-constant3.03 × 107206.48915389
Coating of thermocouple/Teflon1 × 10−160.321621350
σ, electrical conductivity (at 500 kHz); k, thermal conductivity; ρ, density; and c, specific heat (all assessed at 37 °C in case of tissue and blood).
Disclaimer/Publisher’s Note: The statements, opinions and data contained in all publications are solely those of the individual author(s) and contributor(s) and not of MDPI and/or the editor(s). MDPI and/or the editor(s) disclaim responsibility for any injury to people or property resulting from any ideas, methods, instructions or products referred to in the content.