Abstract
Upgrading wet biomass to char via hydrothermal carbonization is a promising method to produce valuable resources for adsorption of organic impurities. In this work, a fresh green seaweed, Ulva pertusa, was investigated to demonstrate the effects of pre-drying and pre-washing on the process and the hydrochar production. Surface moisture and bound moisture were found to affect this process. Hydrochar produced from fresh seaweed with additional water showed similar adsorption capacity to fresh seaweed without additional water and 38% higher than hydrochar from soaked dry seaweed. This was supported by FTIR spectra analysis, which showed that these hydrochars produced from fresh seaweed without additional water have the highest proportion of carboxyl functional groups.
1. Introduction
Hydrothermal carbonization (HTC) is an energy-efficient thermochemical conversion process to convert biowaste into value-added products [1]. Due to the aqueous reaction medium, the hydrothermal carbonization process is a suitable technology for conversion of biomass with high moisture content, such as algal waste, without a prior energy-intensive drying process [2,3,4]. Raw biomass material contains two types of moisture: surface and bound moisture [5]. The water in HTC helps to break down the biomass constituents including cellulose and hemicellulose. It also removes (dissolves) impurities such as minerals and contaminants. Water serves as a medium for the reaction and helps to control the conditions for producing high-quality hydrochar. A higher ratio of water to biomass leads to a more complete biomass conversion, as the water supports the decomposition of the biomass. It has been reported that most researchers have dried the biomass specifically to control the amount of water present in the HTC process, thus eliminating water variability in the feedstock as a source of variation in the process outcome. This is performed, research-wise, in order to find optimum HTC process conditions and to improve efficiency and yield [3,6,7], but there is still a lack of research on the impact of the water-to-biomass ratio on product quality, and there is no literature, to the best of the authors’ knowledge, on how biomass drying affects hydrochar quality.
This research aims to study the effects of temperature and water-to-biomass ratio on the hydrothermal carbonization treatment. Additionally, the adsorption capability of hydrochar produced from fresh, unwashed, and dried seaweed will be compared to investigate how these parameters affect the adsorption capacity, using methylene blue (MB) as a model compound.
2. Materials and Methods
This research used green algae called Ulva pertusa, collected from Busan city, South Korea, in January 2021. The moisture content of the waste seaweed was 80.2 ± 0.1%. Part of the seaweed was immediately used in the HTC experiment without any pretreatment, such as washing or dying, while another part was washed to remove other species and debris. All experiments were compared to hydrochar produced from dried seaweed that was investigated in previous work [8].
2.1. Experimental
The HTC experiment made use of an autoclave reactor filled with Ulva pertusa seaweed and an electric oven set at 180 °C, 210 °C, and 250 °C with autogenic pressure. The study comprised two types of experiments: one evaluated only the moisture content of the biomass, and the other included the addition of a specific amount of water, three times higher than the dry weight of the fresh seaweed (FS) as previously determined [8]. For this purpose, both washed fresh seaweed without added water (FS-0) and with added water (FS-3), were used. The resulting hydrochar slurry was then cooled, filtered, dried, and its yield was measured [9], with the hydrochar designated as coming from washed (FS) or unwashed (UFS) seaweed.
2.2. Characterization
The characterization of hydrochars has been achieved in previous work [8] using elemental analysis, TGA, and FTIR. Adsorption experiments were performed with methylene blue as the model compound. A mass of 10 mg of hydrochar was added to 5 mL of MB dye solution with different concentrations. The pH was fixed to 7 and the stirring rate was 150 rpm. The adsorption capacity was calculated using Equation (1). The equilibrium adsorption data was fitted with Langmuir and Freundlich isotherms using Equations (2) and (3), respectively [10,11].
The adsorption experiment aims to measure how much of the MB dye is adsorbed by the hydrochar. The Langmuir and Freundlich isotherm models describe the binding of methylene blue molecules to the hydrochar surface. The Langmuir isotherm describes a scenario where the adsorbate molecules bind to a specific site on the surface of the adsorbent, while the Freundlich isotherm describes a scenario where the adsorbate molecules can bind to multiple sites on the surface of the adsorbent.
where qe: adsorbed MB amount (mg g−1), C0: initial concentration (mg L−1), Ce: equilibrium concentration (mg L−1), V: volume of MB solution (L), m: hydrochar dosage (g), Q0: maximal MB adsorption capacity (mg g−1), KL: Langmuir equilibrium coefficient (L mg−1), KF: Freundlich equilibrium coefficient (mg1−1/n·L1/n g−1), and the factor 1/n represents the adsorption intensity, also known as the heterogeneity factor of the adsorption.
2.3. Statistic Analysis
The statistical significance of differences was explored using a one-way analysis of variance (ANOVA), with a significance level of α = 0.05. The one-way ANOVA was conducted using the f_oneway() function from the scipy.stats module in Python (refer to Supporting Information, S.1).
3. Results and Discussion
Figure 1 shows a lower yield at higher temperature, which is due to more biomass decomposition. However, the yield slightly increases as the temperature increases from 210 °C to 250 °C (fresh seaweed) due to secondary charring [12,13]. A lower water-to-biomass ratios increase the yield, as observed for FS-0, which had the highest yield 52.2 ± 0.4% at 210 °C among other types of biomasses. This is due to higher concentration of intermediates in the aqueous environment, favoring the hydrochar formation reaction.
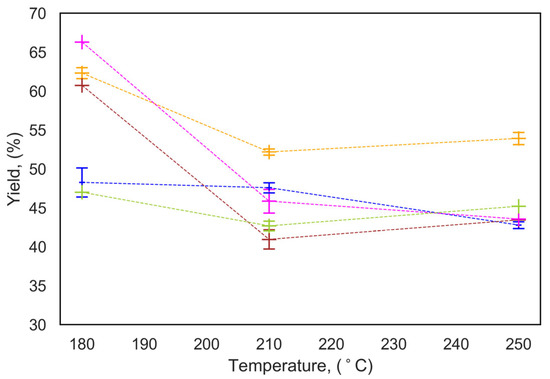
Figure 1.
Effect of reaction temperature and water-to-biomass ratio on hydrochar yield, (─) washed FS-0; (─) UFS-0; (─) FS-3; (─) UFS-3; (─) Dry S, W:B = 3. Dashed lines are added to guide the eye.
Table 1 shows the elemental composition of seaweed and hydrochar under different conditions. The oxygen content in the hydrochar decreases with carbonization temperature, indicating more complete carbonization. Notably, at 210 °C, the hydrochar from dried seaweed had a higher oxygen content (31.2 ± 0.3%) than fresh seaweed. Higher oxygen content indicates incomplete carbonization, hence carbonizing fresh seaweed without pre-drying results in a better hydrochar [14]. The highest increase in carbon content was observed at 250 °C in UFS-0 hydrochar with an increase of about 70%. The hydrochar produced from dried seaweed had the lowest ash content, which may be due to the fact that dried seaweed had a lower mineral content due to the leaching of some minerals into the water during the washing step. The elevated ash content observed in UFS-3 may be ascribed to the minerals and impurities that were attached to the biomass from the ocean and not thoroughly washed off prior to the hydrothermal carbonization process. The reason for the high ash content in FS-0 is the mineral precipitation that occurs at lower water ratios. As the aqueous solution becomes more concentrated, the likelihood of precipitation increases, resulting in a higher ash content compared to FS-3 [15].

Table 1.
Elemental analysis of hydrochar.
Table 1 presents the results of a comparison of p-values for different samples and temperatures. The p-values are used to determine the statistical significance of the differences between the measured values of each element (N, C, H, S, O, and Ash) in each biomass type at different reaction temperatures. The p-value is given for each biomass type group, which is a statistical measure of the probability of obtaining a result as extreme or more extreme than the observed result if the null hypothesis were true (i.e., if there were no significant difference between the temperatures). A p-value less than 0.05 is typically considered statistically significant, indicating that there is strong evidence against the null hypothesis. The p-values for C content for FS-0 and FS-3 are 0.32 and 0.23, which suggests that there is not a significant difference in carbon content between these two samples at different reaction temperatures. The statistical analysis indicates that the p-values for nitrogen (N) were not significant for both UFS-3 and FS-3. Similarly, the p-values for hydrogen (H) were also not significant for any sample or temperature. This suggests that the hydrogen content in the samples is not significantly influenced by the temperature or sample conditions. For oxygen (O), the p-values were significant for the UFS-0 and Dry-S samples. Additionally, the p-value for sulfur (S) was significant for FS-0. These results suggest that the sulfur and oxygen contents in these samples are significantly different from those at other temperatures [16].
The cumulative mass loss and rate of mass loss in thermogravimetric analysis for the hydrochar produced at 210 °C are shown in Figure 2. The details for all hydrochar at different reaction temperatures are given in the Supporting Information, Figure S1. From the TGA and dTG curves, it can be observed that the thermal decomposition process is divided into three phases: evaporation of moisture (lower than 105 °C), release of volatiles, and char formation. Most of the mass loss occurs in the second phase (between 190 and 320 °C), when the structures of remaining or degraded hemicellulose and cellulose begin to break down. The third peak is around 510 °C, which is related to the degradation of inorganic materials. The three peaks for hydrochar produced from washed fresh seaweed are more prominent than those of unwashed and dried seaweed, indicating a higher content of remaining (or partially degraded) cellulose and hemicellulose. A peak around 300 °C on the TGA curve could indicate the beginning of the thermal degradation process of cellulose. The hydrochar produced from washed dry seaweed had a higher remaining/degraded cellulose content than FS-3 and UFS-3, which, theoretically, have the same water-to-biomass ratio. The cellulose peak for FS-0 and UFS-0, which have a lower water-to-biomass ratio, was shifted to a lower temperature due to the different amount of water used in HTC, so the reaction path is likely to be different, and the cellulose is decomposed at a lower temperature. On the derivative thermogravimetric curve (Figure 2b), the highest total mass loss was observed for FS-0 and UFS-0, which shows the thermal instability of the mentioned hydrochar. Hydrochar produced from dry seaweed at 210 °C has a different thermal decomposition behavior that could be due to a different structure compared to the samples, which affects its TGA peak pattern [17,18].
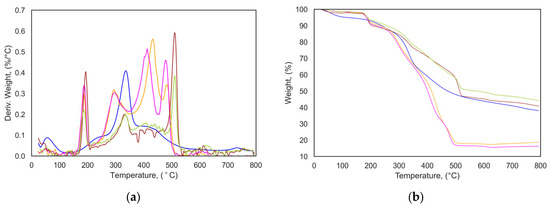
Figure 2.
(a) dTG curves and (b) TGA curves of hydrochar (─) washed FS, W:B = 0; (─) UFS, W:B = 0; (─) FS, W:B = 3; (─) UFS, W:B = 3; (─) Dry S, W:B = 3. Conditions: reaction temperature of 210 °C and reaction time of 4 h.
FTIR spectra of the hydrochars produced under different biomass conditions at 210 °C are shown in Figure 3a, and all reaction temperatures can be found in the Supporting Information (Figure S2). The oxygen-containing functional groups, which hold moisture via hydrogen bonds, are the first to be degraded in the decomposition process. The transmittance peak around 3500 cm−1 represents the hydroxyl group in carboxylic acids and hydroxyl functional groups. The peak at 1650 cm−1 is related to the C=O bond, and the peak at 1020 cm−1 represents C–O bonds. With increasing water-to-biomass ratio, these peaks become stronger, indicating more hydroxyl and carboxyl groups in that hydrochar. The same result was shown for pyrolysis of cellulose [19]. Adsorption experiment results correspondingly showed that FS-3 and UFS-3 hydrochars had the highest adsorption capacity and the most acidic functional groups that interact well with the cationic MB dye.
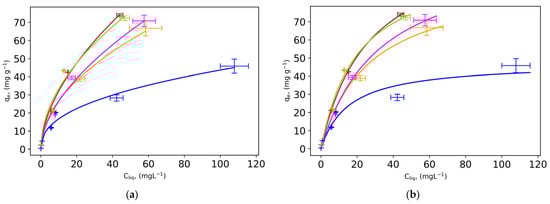
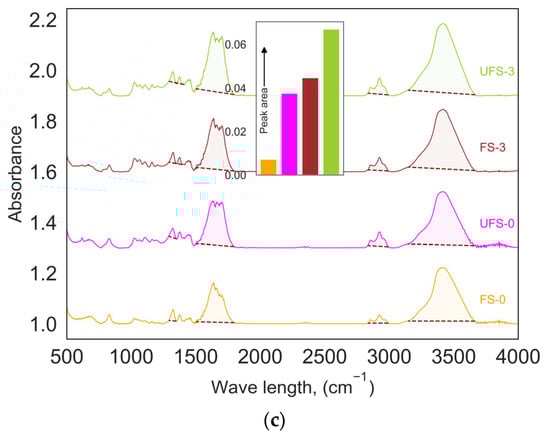
Figure 3.
(a) Freundlich and (b) Langmuir adsorption isotherms and (c) comparison of surface area underneath (colored part) the FTIR spectra for: (─) FS-0; (─) UFS-0; (─) FS, W:B = 3; (─) UFS-3; (─) Dry S, W:B = 3 at reaction temperature of 210 °C and reaction time of 4 h.
The intensity of an absorption band in an FTIR spectra is proportional to the number of absorbing bonds in a sample. The surface area under the absorption band in the FTIR spectra for different hydrochars corresponding to the carboxyl functional group (Figure 3a), shows that FS-3 and UFS-3 have the highest amount of this functional group, the highest adsorption capacity (Figure 3a,b), and the most acidic functional groups that interact well with the cationic MB dye.
The difference in adsorption between hydrochars produced from fresh and dried seaweed can be attributed to the fact that hydrochars produced from fresh seaweed originally contain more oxygen-containing functional groups, which can affect the quality of the hydrochar produced and, subsequently, the chemistry of the HTC. The introduction of additional water to the fresh biomass is beneficial for the development of dehydration and decarboxylation reactions and results in hydrochar with a higher carbon content. The Van Krevelen diagram (Supporting Information, Figure S3) demonstrates that the hydrochar made from dried seaweed has fewer chemical changes in comparison to other biomasses, whereas the hydrochar produced from 210 °C UFS-3 displays the highest carbon content and the most advanced stages of dehydration and decarboxylation development [20].
The Freundlich and Langmuir models show that the hydrochar from fresh waste seaweed with added water has the highest adsorption capacity (see Table 2) and performs better in comparison to other types of biomasses. The results showed that the maximum adsorption capacity of hydrochar produced from fresh waste seaweed with additional water was 73.9 ± 0.9 mg g−1 at a reaction temperature of 210 °C. This hydrochar showed superior adsorption behavior compared to other hydrochars. The higher data of the functional group also indicated a higher concentration of acidic functional groups in this hydrochar, which was 15% higher than UFS-0 and 83% higher than FS-0. Hydrochar from dried seaweed has about 38% lower adsorption capacity compared to hydrochar from fresh seaweed. One possible reason could be that the prior drying process affects the characteristics of the produced hydrochar. In general, the drying process results in a hydrochar with a more aromatic chemical structure, which may affect the hydrochar’s ability to adsorb contaminants.
Table 2.
Adsorption isotherm parameters of MB adsorption onto different hydrochar.
4. Conclusions
This manuscript discusses the practical significance of key hydrochar parameters and their optimization. The authors found that a higher temperature results in lower yield due to more biomass decomposition, but the yield slightly increases with temperature going from 210 °C to 250 °C due to secondary charring.
FTIR spectra of the hydrochars produced under different biomass conditions at 210 °C showed that hydroxyl and carboxyl groups increase with increasing water-to-biomass ratio, indicating more acidic functional groups.
Adsorption experiment results correspondingly showed that hydrochars with the most acidic functional groups, such as FS-3 and UFS-3, had the highest adsorption capacities and interacted well with cationic MB dye.
Hydrochar produced from fresh waste seaweed with additional water had the highest adsorption capacity and performed better than other types of hydrochars. However, hydrochar produced from dried seaweed had about 38% lower adsorption capacity, possibly due to the drying process affecting the characteristics of the produced hydrochar. Overall, this manuscript provides valuable insights into the optimization of hydrochar parameters for practical applications, particularly in the area of adsorption.
Supplementary Materials
The following supporting information can be downloaded at: https://www.mdpi.com/article/10.3390/pr11041123/s1, Figure S1: TGA curves of hydrochar, (a) FS-0; (b) FS-3; (c) UFS-0; (d) UFS-3; (e) dry seaweed. W:B = 3; at temperature of (─) 180 °C (―) 210 °C (―) 250 °C. Conditions: reaction temperature 210 °C and reaction time 4 h. Figure S2: FT-IR analysis, (a) FS-0; (b) FS-3; (c) UFS-0; (d) UFS-3 at the temperature of (─) 180 °C (―) 210 °C (―) 250 °C. Figure S3: Van Krevelen diagram of hydrochar, at temperature of (─) 180 °C (―) 210 °C (―) 250 °C.
Author Contributions
Conceptualization, S.S. and F.R.; methodology, S.S., F.R. and P.M.H.; software, S.S.; validation, S.S.; formal analysis, S.S.; investigation, S.S.; resources, J.P.; data curation, S.S.; writing—original draft preparation, S.S.; writing—review and editing, F.R., J.P. and P.M.H.; visualization, S.S.; supervision, F.R. and P.M.H.; project administration, P.M.H.; funding acquisition, P.M.H. All authors have read and agreed to the published version of the manuscript.
Funding
This research received no external funding.
Data Availability Statement
The data presented in this study are available on request from the corresponding author.
Acknowledgments
This work has been supported by the Research and Development Program of Ghent University Global Campus (GUGC), Korea. The authors thank Jonathan Ozelton from the Center for Language and Learning (LLC) at Ghent University Global Campus (GUGC) for proofreading of the document. The authors would like to thank the reviewers for the constructive remarks.
Conflicts of Interest
The authors declare no conflict of interest.
References
- Wang, L.; Chang, Y.; Li, A. Hydrothermal carbonization for energy-efficient processing of sewage sludge: A review. Renew. Sustain. Energy Rev. 2019, 108, 423–440. [Google Scholar] [CrossRef]
- Stemann, J.; Putschew, A.; Ziegler, F. Hydrothermal carbonization: Process water characterization and effects of water recirculation. Bioresour. Technol. 2013, 143, 139–146. [Google Scholar] [CrossRef] [PubMed]
- Steinbruch, E.; Drabik, D.; Epstein, M.; Ghosh, S.; Prabhu, M.S.; Gozin, M.; Kribus, A.; Golberg, A. Hydrothermal processing of a green seaweed Ulva sp. for the production of monosaccharides, polyhydroxyalkanoates, and hydrochar. Bioresour. Technol. 2020, 318, 124263. [Google Scholar] [CrossRef] [PubMed]
- Seyedsadr, S.; Al Afif, R.; Pfeifer, C. Hydrothermal carbonization of agricultural residues: A case study of the farm residues -based biogas plants. Carbon Resour. Convers. 2018, 1, 81–85. [Google Scholar] [CrossRef]
- Shafie, S.A.; Al-attab, K.A.; Zainal, Z.A. Effect of hydrothermal and vapothermal carbonization of wet biomass waste on bound moisture removal and combustion characteristics. Appl. Therm. Eng. 2018, 139, 187–195. [Google Scholar] [CrossRef]
- Yan, M.; Liu, J.; Yoshikawa, K.; Jiang, J.; Zhang, Y.; Zhu, G.; Liu, Y.; Hantoko, D. Cascading disposal for food waste by integration of hydrothermal carbonization and supercritical water gasification. Renew. Energy 2022, 186, 914–926. [Google Scholar] [CrossRef]
- Ahmed Alshareef, S.; Abdullah Alqadami, A.; Ali Khan, M.; Alanazi, H.S.; Raza Siddiqui, M.; Jeon, B.-H. Simultaneous co-hydrothermal carbonization and chemical activation of food wastes to develop hydrochar for aquatic environmental remediation. Bioresour. Technol. 2022, 347, 126363. [Google Scholar] [CrossRef] [PubMed]
- Soroush, S.; Ronsse, F.; Verberckmoes, A.; Verpoort, F.; Park, J.; Wu, D.; Heynderickx, P.M. Production of solid hydrochar from waste seaweed by hydrothermal carbonization: Effect of process variables. Biomass Convers. Biorefinery 2022. [Google Scholar] [CrossRef]
- Xu, Q.; Qian, Q.; Quek, A.; Ai, N.; Zeng, G.; Wang, J. Hydrothermal Carbonization of Macroalgae and the Effects of Experimental Parameters on the Properties of Hydrochars. ACS Sustain. Chem. Eng. 2013, 1, 1092–1101. [Google Scholar] [CrossRef]
- Coles, C.A.; Yong, R.N. Use of equilibrium and initial metal concentrations in determining Freundlich isotherms for soils and sediments. Eng. Geol. 2006, 85, 19–25. [Google Scholar] [CrossRef]
- Tseng, R.-L.; Wu, F.-C. Inferring the favorable adsorption level and the concurrent multi-stage process with the Freundlich constant. J. Hazard. Mater. 2008, 155, 277–287. [Google Scholar] [CrossRef] [PubMed]
- Anca-Couce, A.; Mehrabian, R.; Scharler, R.; Obernberger, I. Kinetic scheme of biomass pyrolysis considering secondary charring reactions. Energy Convers. Manag. 2014, 87, 687–696. [Google Scholar] [CrossRef]
- Guiotoku, M.; Rambo, C.R.; Hansel, F.A.; Magalhães, W.L.E.; Hotza, D. Microwave-assisted hydrothermal carbonization of lignocellulosic materials. Mater. Lett. 2009, 63, 2707–2709. [Google Scholar] [CrossRef]
- Nobre, C.; Alves, O.; Durão, L.; Şen, A.; Vilarinho, C.; Gonçalves, M. Characterization of hydrochar and process water from the hydrothermal carbonization of Refuse Derived Fuel. Waste Manag. 2021, 120, 303–313. [Google Scholar] [CrossRef] [PubMed]
- Jiang, J.; Tie, Y.; Deng, L.; Che, D. Influence of water-washing pretreatment on ash fusibility of biomass. Renew. Energy 2022, 200, 125–135. [Google Scholar] [CrossRef]
- Krysanova, K.; Krylova, A.; Kulikova, M.; Kulikov, A.; Rusakova, O. Biochar characteristics produced via hydrothermal carbonization and torrefaction of peat and sawdust. Fuel 2022, 328, 125220. [Google Scholar] [CrossRef]
- Kang, K.; Nanda, S.; Sun, G.; Qiu, L.; Gu, Y.; Zhang, T.; Zhu, M.; Sun, R. Microwave-assisted hydrothermal carbonization of corn stalk for solid biofuel production: Optimization of process parameters and characterization of hydrochar. Energy 2019, 186, 115795. [Google Scholar] [CrossRef]
- Magdziarz, A.; Wilk, M.; Wądrzyk, M. Pyrolysis of hydrochar derived from biomass—Experimental investigation. Fuel 2020, 267, 117246. [Google Scholar] [CrossRef]
- Mok, W.S.L.; Antal, M.J., Jr.; Szabo, P.; Varhegyi, G.; Zelei, B. Formation of charcoal from biomass in a sealed reactor. Ind. Eng. Chem. Res. 1992, 31, 1162–1166. [Google Scholar] [CrossRef]
- Nguyen, T.-B.; Truong, Q.-M.; Chen, C.-W.; Doong, R.-a.; Chen, W.-H.; Dong, C.-D. Mesoporous and adsorption behavior of algal biochar prepared via sequential hydrothermal carbonization and ZnCl2 activation. Bioresour. Technol. 2021, 346, 126351. [Google Scholar] [CrossRef] [PubMed]
Disclaimer/Publisher’s Note: The statements, opinions and data contained in all publications are solely those of the individual author(s) and contributor(s) and not of MDPI and/or the editor(s). MDPI and/or the editor(s) disclaim responsibility for any injury to people or property resulting from any ideas, methods, instructions or products referred to in the content. |
© 2023 by the authors. Licensee MDPI, Basel, Switzerland. This article is an open access article distributed under the terms and conditions of the Creative Commons Attribution (CC BY) license (https://creativecommons.org/licenses/by/4.0/).