Abstract
This paper investigates the failure of a regulating valve stem in a petrochemical plant, which was mainly caused by vibration fatigue under small opening conditions. The fractured valve stem was analyzed using macroscopic analysis, chemical composition analysis, mechanical property analysis, metallographic analysis, fracture surface observation, and energy spectrum analysis. Additionally, fluid-structure interaction (FSI) modal analysis was used to investigate the failure of the regulating valve. The results indicate that the valve opening had a direct impact on the vibration of the valve body, which, when operated at small openings, led to fatigue fracture at the step of variable cross-section. The paper suggests a smooth transition treatment be performed at the variable cross-section of the valve stem to avoid stress concentration. Although this study is limited to a specific case, it provides valuable insights for the failure analysis of valves operating at small openings.
1. Introduction
Regulating valves, as a type of valve used for regulating process parameters of fluids in the petroleum, chemical, and metallurgical industries, have found widespread applications [1,2,3]. By adjusting the valve opening, the fluid flow rate, pressure, temperature, liquid level, and other parameters can be effectively controlled. However, the improper selection and usage of control valves, particularly when handling high-temperature, high-pressure, flammable, explosive, toxic, or hazardous media, can lead to degraded control quality, increased risk of unplanned shutdown, and can even jeopardize the safe and stable long-term operation of the process equipment, resulting in significant economic losses to the company [4,5].
Extensive research has been carried out to address these difficulties. Tu et al. [6] used computational and experimental methods to evaluate flow-induced vibrations in cage control valves. Wang et al. [7] investigated the flow-induced resonance problem of sleeve control valves in depth, using transient flow field simulation and fluid-solid coupled modal analysis. Xu et al. [8] conducted a computational fluid dynamics discrete element method (CFD-DEM) simulation to study the solid-liquid two-phase flow characteristics and erosion characteristics of a butterfly valve with different openings. Gabel et al. [9] used a coupled computational and experimental methodology to analyze the complex flow within a choke valve under laminar inflow conditions. They found that dominant frequency peaks can result in FIV and the resonance failure of control valves. Sun et al. [10] investigated the flow characteristics of high-parameter multi-stage sleeve control valves. Makaryants et al. [11] explored low-frequency self-excited oscillation as well as external vibration coupled with acoustic resonance of the vessel with an attached pipe, leading to the fleeting reduction of drag force in the valve and to high-frequency valve chatter. Grice et al. [12] found that the globe valve stem experienced brittle fracture, caused by environmental stress cracking. Michaud et al. [13] proposed that the high-frequency noise of the valve was the primary source causing fatigue failure. The literature [14,15] determined that the fracture failure of 17-PH stainless steel valve stems was caused by hydrogen embrittlement. Chandra et al. [16] proposed that valve stem failure occurred due to sulphide stress cracking caused by hydrogen embrittlement of the ferrite phase for the duplex stainless steel 329 stem fracture problem. A computational tool was created in the literature [17] by using numerical simulation methods for predicting the fatigue life of valve stems.
This paper reported a rare case of a regulating valve operating at a small opening with a broken stem within a few days. In a sulfur recovery unit of a petrochemical company in China, the regulating valve LV5401 was used to regulate the rich liquid entering the regeneration tower, and the control valve LV5403 was used to regulate the lean liquid leaving the tower. The rich liquid is regenerated in the tower after passing through LV5401, while the lean liquid at the bottom of the tower enters the lean liquid pump after being heated by the heat exchanger, and then passes through LV5403. The process flow diagram of LV5401 and LV5403 in the unit is shown in Figure 1. The structures of these two control valves are identical, as shown in Figure 2. The valve stem and valve core were machined and are made of 316 L austenitic stainless steel. The valve stem is composed of two sections, with diameters of Φ24 mm and Φ16 mm, respectively.
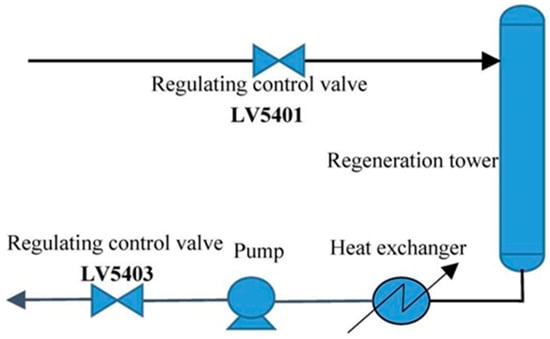
Figure 1.
Schematic diagram of the process flow of the failed regulating valve.
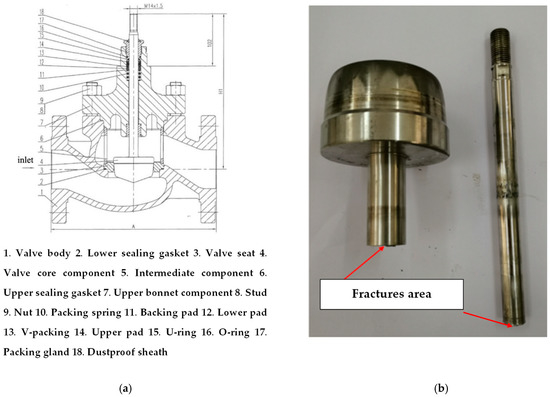
Figure 2.
Diagram of the studied regulating valve; (a) Structural diagram of the regulating valve; (b) Fractured stem of the regulating valve.
During the routine shutdown maintenance of the equipment, it was necessary to completely drain the medium in the system to proceed with the next step of steam blowing. As the flow rate of the medium decreases, the valve opening must be adjusted to achieve a balance of medium inflow and outflow. Table 1 shows the opening and working conditions of the LV5401 and LV5403 control valves. The valve stem, made of 316 L austenitic stainless steel, is composed of two sections with diameters of Φ24 mm and Φ16 mm, respectively. The valve stem and valve core are integrally machined and are one of the main components of the control valve. The structure of the control valve is shown in Figure 2a. During the shutdown maintenance process, the valve stem of the LV5401 control valve broke first, followed by the valve stem of the LV5403 control valve. These fractures occurred at the step where the diameter of the valve stem changed from Φ24 mm to Φ16 mm, where no back-cut groove was machined, and there was no smooth transition. The broken valve stems are shown in Figure 2b.

Table 1.
Regulating valve openings and working conditions.
In this study, the root cause of the failure of the 316 L valve stem is scientifically investigated by analyzing the fracture of the stem during a small opening operation over a short period of time. A macroscopic analysis, a chemical composition analysis, a mechanical property analysis, a metallographic analysis, and a fracture analysis were conducted, which determined that the stem fracture was caused by fatigue, with the cyclic bending load mainly induced by fluid flow-induced vibration in Section 2. To verify the analysis results, numerical simulations of fluid flow at different valve openings and a fluid-structure coupling modal analysis of the valve core were conducted using ANSYS software, as elaborated upon in Section 3. The causes of the valve stem fracture are comprehensively discussed in the Section 4. In Section 5, the paper is summarized, indicating that vibration fatigue is the main cause of regulator valve fracture, and suggestions for improvement are proposed.
This study aims to investigate the root cause of a regulating valve stem fracture under small opening conditions. The fluid-structure coupling method was applied in the analysis process to connect the fluid field and the structural mechanics field, providing a deep understanding of the mechanism of valve stem fracture and methodological guidance for the operation and optimization of regulating valves under small opening conditions.
2. Experiments and Results
2.1. Visual Inspection
Based on Figure 3, a macroscopic examination of the fracture position and fracture surface was carried out in four different directions. The fracture surface exhibited a smooth appearance without any notable plastic deformation or shear lips, but fatigue striations were observed, suggesting that the fracture resulted from fatigue failure. Typically, fatigue fracture exhibits a characteristic inclined fracture surface at an angle of 45° to the axial direction of the rod. However, in this particular case, a significant stress concentration phenomenon was present at the valve stem radius transition, and the fracture occurred along the direction of maximum stress concentration. Figure 3 depicts a schematic of the fatigue feature area of the fracture, which shows the crack origin area, fatigue propagation area, and brittle fracture area. The crack was initiated from the stress concentration area around the small end of the valve stem, and multiple crack sources were identified, indicating that multiple sources of initiation occurred. After the crack was initiated from the stress concentration area, it propagated towards the center under alternating bending loads. When the crack propagation of adjacent crack sources overlapped, a ratchet mark was formed. Multiple obvious ratchet marks could be observed around the fracture surface, indicating that the crack initiated from multiple sources along the edge of the small rod.
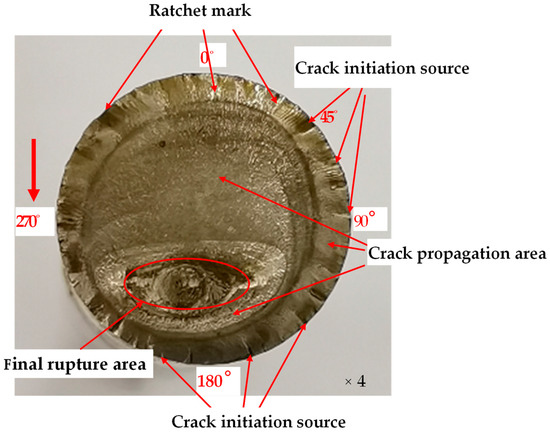
Figure 3.
Schematic diagram of fatigue fracture.
The fatigue striations are observed in the crack propagation area, and the area on the side of the instantaneous fracture is larger than the other side. In the upstream flow direction, the impact of fluid flow causes larger alternating stresses and faster fatigue crack propagation, resulting in a larger fracture surface area. On the other side, where there is no impact from fluid flow, the stress is smaller, resulting in slower fatigue crack propagation and a relatively smaller fracture surface area.
The instantaneous fracture area is the final area where the crack breaks. When the crack propagates to a certain extent, the crack breaks under the combined action of tensile and bending stresses.
2.2. Chemical and Mechanical Property Analysis
During the study, two samples were prepared from the valve stem metal using a wire cutting machine. The chemical composition of the valve stem samples was analyzed using spectral analysis techniques. The average results after three analyses are presented in Table 2. The analyses indicate that, except for the low Ni content, the chemical composition of the steel meets the standard requirements. Ni is an element that forms austenite, and a lower content may affect the corrosion resistance of 316 L steel, but it has little effect on the fatigue failure in this case.

Table 2.
Chemical composition analysis (wt.%).
The valve stem was sampled for testing of its mechanical properties at room temperature, including tensile strength, yield strength, elongation after fracture, impact toughness, and hardness, as shown in Table 3. The test results indicate that the valve stem material meets the standard requirements for all tested parameters of tensile strength, yield strength, elongation after fracture, impact toughness, and hardness.

Table 3.
Mechanical properties test results.
2.3. Microstructure Observation
To investigate the root cause of the valve stem fracture, a sample of the valve stem was taken for metallographic observation. Figure 4 shows the microstructure of the base material near the fractured valve stem. Figure 4a,b show metallographic images of the stem material at 100× and 500× magnification, respectively. It exhibits a normal austenite structure with a grain size of 10 to 11, and non-metallic inclusions at a level of 0.6.
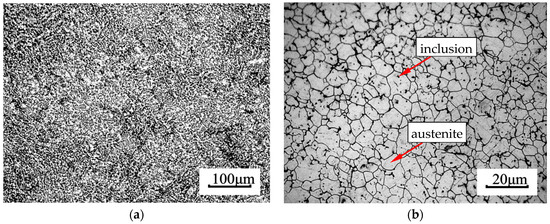
Figure 4.
Metallographic microstructures of the valve stem. (a) 100× (b) 500×.
2.4. Fracture Surface Characterisation
Figure 5 presents scanning electron microscopy (SEM) images of the fracture surface. The crack initiation sources can be observed moving from 0° to 270° directions through SEM observation. The SEM fracture pattern at the source of the crack is shown in Figure 5b, which indicates that the cracks originate from the stress concentration area at the valve stem edge and propagate to the center. The micromorphology at different periods during the crack propagation process is shown in Figure 5c,d. Zone B underwent a period of slow propagation of the fatigue crack, where fatigue striations are visible, and partial crushing of the metal can be observed. Area C underwent a period of rapid fatigue crack propagation, where in addition to fatigue striations, there are already local metal torn dimples. Figure 5e shows the micromorphology of the fracture zone D, where the fracture mainly appears as dimples and grains with lateral tensile deformation. This indicates that the valve stem has good plasticity, and grains elongate, deform, and fracture under alternating bending and shearing stress. Figure 5f displays the microstructure of the fracture in the final fracture region E, where the fracture mainly occurs in the form of dimples, and elongated and deformed grains can also be observed laterally.
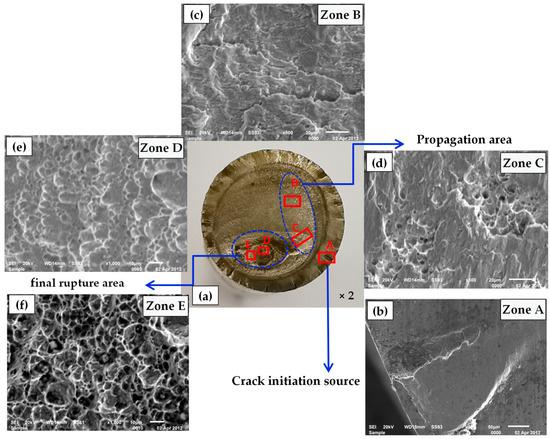
Figure 5.
SEM images of the fracture surface. (a) SEM observation locations of the fracture. (b) Fracture pattern of area A at the crack source (300×). (c) Fracture pattern of B crack propagation area (800×). (d) Fracture pattern of C crack propagation area 5 (800×). (e) Fracture pattern of D final fracture area (1000×). (f) Fracture pattern of E final rupture area (1000×).
The energy dispersive spectroscopy (EDS) analysis of an example is presented in Figure 6. The results indicate that metal oxides are the main product of the fracture, with some local areas containing residual sulfides from the media.
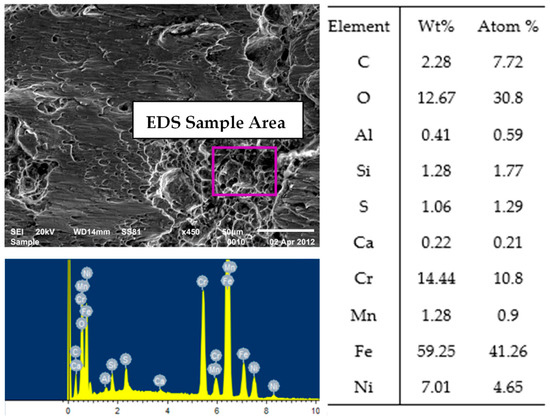
Figure 6.
Energy Dispersive Spectroscopy (EDS) results of the fracture surface.
Based on the above analysis, it is inferred from the morphological characteristics that the fracture is a fatigue fracture. At the source of the crack, all cracks initiate at the stress concentration area at the variable diameter part of the valve stem and propagate to the center, where fatigue striations can be observed. In the crack propagation area, fatigue cracks can also be observed during the slow propagation period. During the fast crack propagation period, in addition to the fatigue striations, local dimples with torn metal can be observed. From the microscopic pattern of the final fracture area, it can be seen that there are mainly dimples and grains that are elongated and deformed laterally on the fracture. It is well-known that the main failure modes of control valves include blockage, leakage, and vibration [18]. Many studies on control valve failures [5,19,20] are related to vibration problems.
3. Numerical Simulation and Analysis
According to the structure and operating conditions of the regulating valve, the cyclic bending load may mainly come from the vibration of the valve stem caused by the impact of fluid flow. The cause for the greater stress concentration is that the valve stem is not provided with an undercut or smooth transition at the transition between the variable diameter parts of the valve stem. Therefore, it is necessary to perform the numerical simulation of fluid flow. Some scholars [21,22,23,24] used Computational Fluid Dynamics (CFD) technology to analyze the internal flow field of the regulating valve by visualizing it.
3.1. Modeling of Flow Passage of the Regulating Valve
Figure 2 shows the actual structural model and assembly structure of the regulating valve, and Table 4 presents the dimensional data of the valve. The valve has a nominal pressure of 0.6 MPa and an equal percentage flow characteristic. SolidWorks three-dimensional modeling software was used to build the regulating valve models at different openings. Since this study only focused on the valve core and flow passage, the valve is simplified, and the flow passage data, as well as the data of the valve stem and valve core, are extracted to build the corresponding models. As shown in Figure 7, the mesh division model has good orthogonality, which allows it to accurately capture the boundary layer and obtain higher-precision calculation results [25,26]. The mesh in the coupling area between the valve stem and valve core and the fluid, valve seat, and intermediate component is partially densified, while the unstructured grids are used to divide the valve body. The model is divided into different numbers of grids: 230,000, 590,000, 1.12 million, 1.66 million, and 2.13 million. The calculation result with 230,000 grids is used as the reference value to compare the average mass flow at the outlet of the regulating valve.

Table 4.
Data sheet of regulating valve sizes.
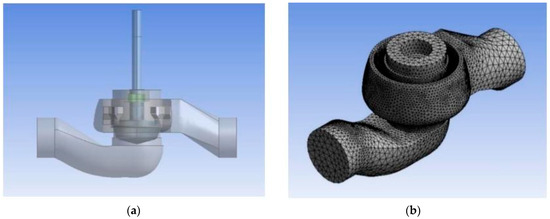
Figure 7.
Regulating valve model and grid model diagram; (a) Regulating valve model; (b) Grid of overall flow channel model.
By checking the grid independence under the same operating conditions with different openings of the regulating valve, it was found that when the number of meshes exceeds 1.6 million, the simulation results are not relevant. Therefore, the final number of meshes used was about 1.66 million.
3.2. CFD Solution Process and Related Settings
3.2.1. Selection of Fluid Model
As the regulating valve failed during the shutdown period, and the medium is lean solution with flow properties similar to water, it can be treated as water with a density of 1.0 g/cm3. Therefore, the turbulence model [27] was chosen and the standard model [28,29] was used. To solve the calculation, the commonly used SIMPLE method using the finite volume method was adopted.
3.2.2. Establishment of a Computation Model
The N-S governing equation, a closed equation consisting of a mass conservation equation and three momentum conservation equations, is utilized as the governing equation. This includes the continuity equation, which is the mathematical expression of the law of conservation of mass in the flow field. The mass conservation equation is expressed as:
The governing equation adopts the N-S governing equation, which is a closed equation composed of a mass conservation equation and three momentum conservation equations, including the following:
- Continuity equation
The mathematical expression of the law of conservation of mass in the flow field is called the continuity equation. The mass conservation equation is
where , , are velocity components (m/s) in x, y and z directions, respectively, t is time, and ρ is density. The fluid in this study is a lean solution or an incompressible fluid, ρ is a constant, and Equation (1) can be simplified as
- 2.
- Momentum equation
The mathematical expression of the law of conservation of momentum in the flow field is called the momentum equation, which can be expressed as:
where: are the unit mass force () in the directions, p represents the pressure acted on the volume micro-element body, and represents the components of the viscous force acting on the surface of the micro-element body.
3.2.3. Boundary Conditions and Parameter Settings
The pressure inlet and pressure outlet boundary conditions were selected in this study. The inlet pressure is set to 0.6 MPa and the outlet pressure is 0.45 MPa. Solid wall conditions are adopted for all interfaces in contact with the fluid, the medium is treated as water, and the medium temperature is 40 °C. For the research, nine openings, namely, 1%, 2%, 5%, 10%, 15%, 40%, 60%, 80%, and 100%, were chosen.
3.3. Analysis of Simulation Results
The pressure distribution on a symmetrical surface under different openings is presented in Figure 8. When the valve is fully open, the pressure change from inlet to outlet is relatively uniform, and the pressure drop is mainly concentrated at the top and bottom of the valve core. A low-pressure area appears at the valve core near the outlet side, while a local high-pressure area appears at the bottom of the spool. Notably, the pressure changes significantly at the throttling location, and the minimum pressure occurs on the outlet side of the throttle valve.
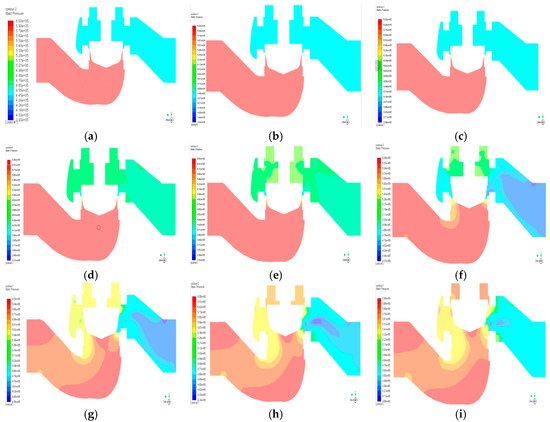
Figure 8.
Contour maps of pressure distribution on the symmetrical surface at various valve openings: (a) 1%; (b) 2%; (c) 5%; (d) 10%; (e) 15%; (f) 40%; (g) 60%; (h) 80%; (i) 100%.
Similar to the full opening situation, the pressure distribution remains relatively stable at 80% opening. However, at 60% and 40% opening, the local high-pressure area at the bottom of the spool expands, and the pressure gradient at the throttle changes more compared to the full opening condition. Further reduction of the opening to 15% and 10% causes the high-pressure area at the bottom of the spool to expand continuously, and there is a significant pressure gradient on both sides of the top and bottom of the spool.
The cloud pictures of pressure distribution at 5%, 2%, and 1% openings exhibit remarkable similarity. The high-pressure area at the bottom of the spool further increases and strengthens, resulting in a larger pressure gradient on both sides of the top and bottom of the spool.
A pressure difference diagram at the top and bottom of the valve core for each opening is plotted based on the pressure nephogram, as shown in Figure 9. As seen from the figure, the pressure difference decreases as the opening increases, with the maximum pressure difference occurring at 1%, 2%, and 5% opening, with all three pressure differences reaching 1.34 MPa. Under this condition, the valve stem is bent by the high pressure difference, causing an increase in the gap between the valve core and valve seat, which leads to a decrease in the pressure difference. The valve stem then rebounds within the elastic range and returns to the original opening, causing the pressure difference to increase again, resulting in a cyclic reciprocation process that forms an alternating load. During the shutdown maintenance of the failed valve under study, the valve stems broke and failed when working at small openings of 1% to 5%. The fatigue load comes from the large pressure difference at small openings.
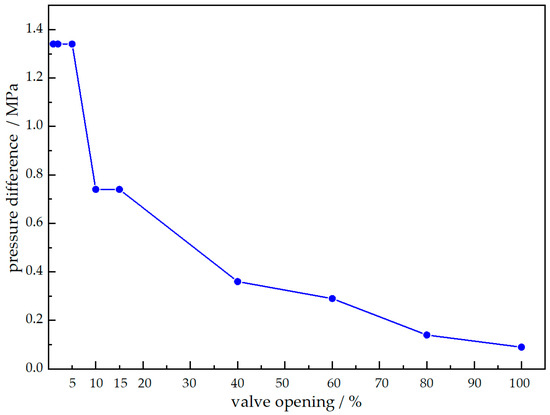
Figure 9.
Pressure difference across the valve core at different openings.
The above analysis reveals that the flow fields at adjacent valve openings are similar. Consequently, the subsequent analysis will focus solely on typical flow fields with three openings, namely 2%, 15%, and 60%.
3.4. Modal Analysis of Fluid-Structure Interaction of Regulating Valve Bodybsection
Based on the wet mode theory [30], the fluid surrounding the valve core and valve stem is taken as the unidirectional fluid-structure interaction mode in this paper. The modal analysis on the regulating valve is conducted with the wet mode. ANSYS Workbench was used to simulate the stem and valve core of the single-seat regulating valve, and a fluid-structure interaction model was established with SolidWorks software, as illustrated in Figure 10. The grid number is 77,517. Steady-state flow field calculations for the throttling model at each typical opening were performed with reference to the boundary conditions of the flow field of the regulating valve in Section 3.1. In the static field, fixed constraints were imposed on the inlet and outlet ends of the regulating valve. The flow field information was loaded in the static field to obtain the fluid-structure interaction surface pressure information. The elastic modulus of 316 L austenitic stainless steel was set to E = 206 MPa, the density was 7.98 g/cm3, and the Poisson’s ratio was set to u = 0.3.
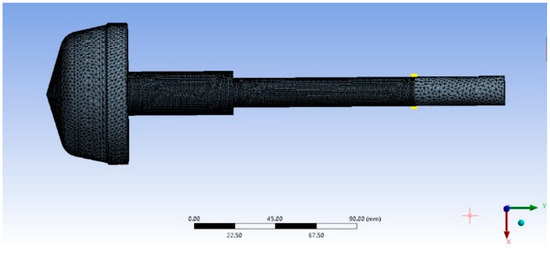
Figure 10.
Fluid-structure interaction model of stem and valve core.
3.4.1. The Equivalent Stress at the Variable Diameter Sections of the Valve Stem
The equivalent stress diagrams of the valve core and stem at three different openings (2%, 15%, and 60%) are shown in Figure 11. As depicted in the figure, the valve core deforms towards the right, i.e., in the direction of fluid flow, and the amount of deformation increases gradually from the top of the valve stem towards the valve core. The largest deformation occurs at the top end of the valve core. Additionally, the stress decreases from the top of the valve stem towards the valve core. However, it is worth noting that a local high-stress area is present between the variable diameter parts of the valve stem, precisely where the stem broke. This local stress area is the source of crack initiation for fracture failure, and it is particularly high at the 2% opening. As the opening increases, the stress between the variable diameter parts of the valve stem decreases, and the possibility of fracture becomes smaller.
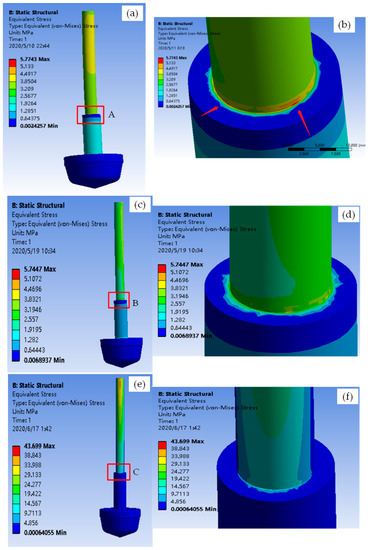
Figure 11.
The total deformation diagram and equivalent stress diagram of the valve core and stem; (a) Equivalent stress diagram at 2% opening; (b) Enlarged view of Zone A; (c) Equivalent stress diagram at 15% opening; (d) Enlarged view of Zone B; (e) Equivalent stress diagram at 60% opening; (f) Enlarged view of Zone C.
3.4.2. Modal Analysis of the Regulating Valve Model at Each Opening
In order to analyze the vibration characteristics of the regulating valve, a modal analysis was conducted at three typical openings: 2%, 15%, and 60%, which have similar valve characteristics. The first three-order modes were studied in this paper because of the low influence of high-order modes on the vibration. Figure 12 shows the modal diagrams of each order at different openings, and Table 5 lists the vibration modes at each opening. The analysis reveals that the valve stems have a large deformation in all modes, especially in the first-order mode, which mainly involves left and right swinging. The second-order mode mainly involves periodic vibration formed in the form of left and right swinging at about 45°, which is referred to as induced vibration [31]. According to classical theory [32], the influence of low-order modes on vibration is much greater than that of high-order modes. When fluid flows perpendicular to the cylinder axis, the cylinder vibrates laterally in the direction perpendicular to the direction of fluid flow due to various causes, which becomes the cause of the fatigue fracture of the valve stem.
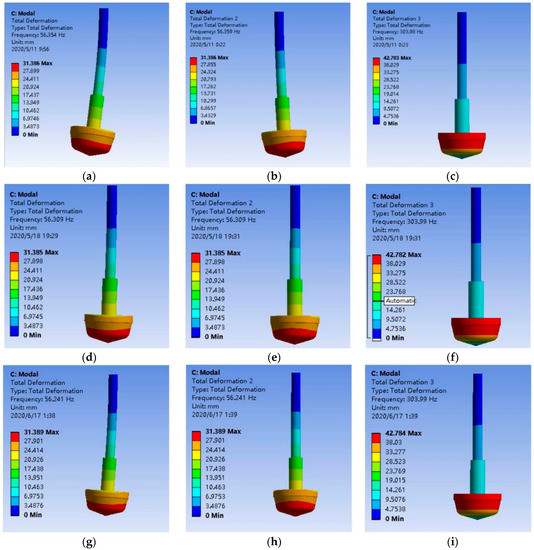
Figure 12.
Vibration mode diagrams for the first, second, and third order modes at valve openings of 2%, 15%, and 60%; (a) First-order mode at 2% opening; (b) Second-order mode at 2% opening; (c) Third-order mode at 2% opening; (d) First-order mode at 15% opening; (e) Second-order mode at 15% opening; (f) Third-order mode at 15% opening; (g) First-order mode at 60% opening; (h) Second-order mode at 60% opening; (i) Third-order mode at 60% opening.

Table 5.
Table of vibration modes of each order at different openings.
Through simulation analysis, the valve stem and valve core were found to undergo periodic bending, pressure difference reduction, and elastic range rebound when subjected to high pressure differences at the small hole. This results in induced vibration, which is characterized by left and right periodic vibration of valve flow and 45-degree angle periodic vibration. The stress concentration is highest in the variable diameter parts of the stem, leading to the appearance of a local high stress area. This area became the source of the crack. Therefore, the stem experiences both alternating loads and stress concentration conditions, leading to fatigue fracture in the variable diameter range. In summary, the simulation analysis reveals that induced vibration, combined with stress concentration, is the root cause of the fatigue fracture in the variable diameter range of the valve stem.
4. Discussion and Recommendations
According to the analysis of the adjusting valve stem fracture failure, it was determined that it was a vibration fatigue fracture, characterized by fatigue striations that can be observed at both macroscopic and microscopic levels. All cracks initiate at the stress concentration at the edge of the variable diameter part of the valve stem and extend to the central portion under alternating loads until they break. The cyclic alternating load mainly comes from the vibration caused by the impact of fluid flow on the valve stem. The high stress concentration is mainly due to the absence of a tool retreat groove and the smooth transition in the variable diameter part of the valve stem.
The simulation results in the third part of the paper show that the valve stem and core undergo periodic bending, a reduction in pressure difference, and the rebound of the elastic range under the action of high pressure difference when the valve is closed and operating in the small opening, which is an induced vibration process. The maximum stress is concentrated in the variable diameter part of the valve stem, and the local high-stress area is the source of crack initiation leading to fracture failure.
Vibration fatigue is a common cause of equipment or component fatigue fracture under dynamic loads such as vibration load, water hammer, or unstable fluid flow. The effects of vibration fatigue on material failure have been extensively studied, including low cycle fatigue [33], random vibration load on joint fatigue [34], vibration fatigue simulation [35], 316 L stainless steel fatigue life prediction [36], average stress on austenitic stainless steel fatigue performance [37], and microdefects on 316 L stainless steel shaft fatigue life analysis [38,39]. Although the valve stem material studied in this paper was 316 stainless steel, when vibration load occurs, cracks may occur at high-stress points or structural discontinuities, even in stainless steel. Hence, it is suggested that regulating valves should minimize their operation at small openings whenever feasible.
It is worth noting that literature reporting fatigue fractures of valve stems in the small opening state after short-term operation is very rare. Therefore, this study focused on the fracture of a variable cross-section stepped valve stem during operation in the small opening state. During normal production, the opening of the LV5401 regulating valve is 15% to 20%, and that of the LV5403 regulating valve is 30% to 40%. In combination with the results of Figure 8 and Figure 9, it was found that the valve stem pressure difference during normal valve opening is lower. The LV5401 has a smaller opening and a larger pressure difference, resulting in a larger bending load on the valve stem. Therefore, the LV5401 valve broke first at 1% to 2% opening later in the shutdown period.
Meanwhile, the sudden structural change of the variable diameter part of the stem is also an important factor affecting stem fatigue fracture. The fatigue behavior of 316 L stainless steel has been extensively studied in numerous manuals and studies [40,41]. As shown in Figure 11, the maximum calculated equivalent force is 43.7 MPa. However, it is crucial in considering the stress concentration factor at the variable section of the valve stem. In this study, the valve stem has a diameter of D = 24 mm and a diameter of d = 16 mm, with a nearly right-angled stem transition, resulting in a very small r value. Specifically, D/d = 24/16 = 1.5, and r/d→0. When r/d = 0.01, the stress concentration factor exceeds 4.5. Thus, the stress at the variable section step of the valve stem can be estimated to be at least 196.65 MPa (43.7 MPa × 4.5 = 196.65 MPa). According to the S-N curve presented in the literature [42], the expected lifetime under this stress level is 5.5 × 10⁵ cycles. However, at the operating opening (2% opening), the vibration frequency of the first-order mode is 56.354 Hz, and the vibration frequency of the regulating valve for one working day is approximately 4.8 × 10⁶ times, which surpasses its fatigue life, thereby leading to fatigue fracture.
Consequently, the absence of a smooth transition in this region and the high stress concentration in the variable diameter part of the valve stem is the main reason for the valve stem fracture. Therefore, the structure was improved in the variable diameter region of the valve stem, as shown in Figure 13a. Figure 13b displays the local stress distribution in the variable diameter region. It can be seen from the figure that the stress decreases at the smooth transition of the variable diameter region, thus avoiding stress concentration and improving the safety of the valve stem.
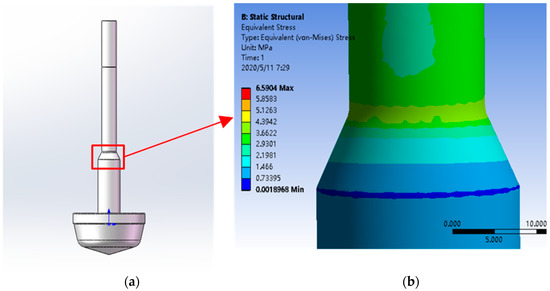
Figure 13.
Diagram of improved valve stem structure and of local stresses. (a) Improved valve stem structure; (b) Local diagram of optimized equivalent stresses.
5. Conclusions
In conclusion, this study investigated the failure of a regulating valve stem in a petrochemical plant, and proposed two suggestions to improve its reliability based on the analysis of the cause of the valve stem fracture and the operating conditions. The suggestions were successfully implemented and yielded positive results. Moreover, the flow and structural response inside the valve in the small opening state is a complex multiphysics coupling problem involving multiple disciplines. Flow-structure coupling can provide a more accurate simulation of the flow and structural response inside the valve in the small opening state, facilitating a better understanding of its physical nature and mechanism. However, this study has limitations, such as the absence of experimental verification of the simulation results. In the future, more experimental work is needed to validate the simulation, and further investigation of the flow and structural response inside the valve is required. Nevertheless, this study provides a valuable reference for the failure analysis of valves operating at small openings which can benefit the design and operation of similar equipment in the industry.
Author Contributions
Data curation, F.G., F.C. and Z.F.; formal analysis, Y.L. and F.G.; investigation, Z.D. and W.L.; resources, Y.L. and Z.D.; writing—review and editing, F.G. and W.L.; writing—original draft, F.G. All authors have read and agreed to the published version of the manuscript.
Funding
This research work was funded by the Open Fund Project of the Guangdong Provincial Key Laboratory of Petrochemical Equipment Fault Diagnosis, Guangdong University of Petrochemical Technology, grant number 91720218.
Institutional Review Board Statement
Not applicable.
Informed Consent Statement
Not applicable.
Data Availability Statement
Data can be provided upon request to the corresponding author.
Conflicts of Interest
The authors declare that they have no conflict of interest.
References
- Qian, J.-Y.; Chen, M.-R.; Jin, Z.-J.; Chen, L.-L.; Sundén, B. A numerical study of heat transfer effects and aerodynamic noise reduction in superheated steam flow passing a temperature and pressure regulation valve. Numer. Heat Transfer Part A Appl. 2020, 77, 873–889. [Google Scholar] [CrossRef]
- Chern, M.-J.; Hsu, P.-H.; Cheng, Y.-J.; Tseng, P.-Y.; Hu, C.-M. Numerical Study on Cavitation Occurrence in Globe Valve. J. Energy Eng. 2013, 139, 25–34. [Google Scholar] [CrossRef]
- Wang, Z.; Lin, S.; Yao, J. Evaluating the Impact of Core Design on Small Modular Reactor Performance Using a Novel Coupled Neutronics-Thermal-Hydraulics Approach. Ann. Nucl. Energy 2022, 166, 109579. [Google Scholar] [CrossRef]
- Chattopadhyay, H.; Kundu, A.; Saha, B.K.; Gangopadhyay, T. Analysis of flow structure inside a spool type pressure regulating valve. Energy Convers. Manag. 2012, 53, 196–204. [Google Scholar] [CrossRef]
- Jin, H.; Zheng, Z.; Ou, G.; Zhang, L.; Rao, J.; Shu, G.; Wang, C. Failure analysis of a high pressure differential regulating valve in coal liquefaction. Eng. Fail. Anal. 2015, 55, 115–130. [Google Scholar] [CrossRef]
- Tu, S.; Wang, C.; Tang, Y.; Dong, D. Study on flow-induced vibration of cage type control valve. AIP Conf. Proc. 2013, 1542, 1319–1322. [Google Scholar] [CrossRef]
- Wang, W.; Jiang, Y.; Zhu, X.; Zhou, C.; Wu, M.; Zhu, X. Design of orifice and flow-induced vibration characteristics of porous sleeve control valve. Chinese J. Sci. Instrum. 2020, 41, 169–179. [Google Scholar] [CrossRef]
- Xu, B.; Zhu, Z.; Lin, Z.; Wang, D. Solid–liquid two-phase flow and erosion calculation of butterfly valves at small opening based on DEM method. Ind. Lubr. Tribol. 2021, 73, 414–421. [Google Scholar] [CrossRef]
- Gabel, T.; Mitra, H.; Williams, D.; Koeck, F.; Mónico, R.O.; Alba, K. Incompressible flow through choke valve: An experimental and computational investigation. J. Fluids Struct. 2022, 113, 103669. [Google Scholar] [CrossRef]
- Sun, Y.; Wu, J.; Xu, J.; Bai, X. Flow Characteristics Study of High-Parameter Multi-Stage Sleeve Control Valve. Processes 2022, 10, 1504. [Google Scholar] [CrossRef]
- Makaryants, G.M. Fatigue failure mechanisms of a pressure relief valve. J. Loss Prev. Process. Ind. 2017, 48, 1–13. [Google Scholar] [CrossRef]
- Grice, D.; Hanke, L.; Mathias, J. Analysis of Stop Valve Leaks: Environmental Stress Cracking of Styrene Copolymer Valve Stems. J. Fail. Anal. Prev. 2022, 22, 666–675. [Google Scholar] [CrossRef]
- Michaud, S.; Ziada, S.; Pastorel, H. Acoustic Fatigue of a Steam Dump Pipe System Excited by Valve Noise. J. Press. Vessel. Technol. 2001, 123, 461–468. [Google Scholar] [CrossRef]
- Macha, J.H.; Kirby, M.L.; Hickey, W.F.; Riha, D.S.; Alston, J.K.; Holden, B.B. Investigation of Thermal Embrittlement of 17-4PH Stainless Steel Main Steam Isolation Valves. J. Fail. Anal. Prev. 2021, 21, 1445–1465. [Google Scholar] [CrossRef]
- Jiang, T.; Zhong, J.; Zhang, X.; Wang, W.; Guan, K. Hydrogen embrittlement induced fracture of 17-4 PH stainless steel valve stem. Eng. Fail. Anal. 2020, 113, 104576. [Google Scholar] [CrossRef]
- Chandra, K.; Singh, A.; Kain, V.; Kumar, N. Sulphide stress cracking of a valve stem of duplex stainless steel. Eng. Fail. Anal. 2018, 94, 41–46. [Google Scholar] [CrossRef]
- Ahmadimoghaddamseighalani, H.; Mertiny, P. Application of Numerical Modeling for Predicting the Fatigue Crack Growth of an Elliptical Crack in Kelly Valves. In Proceedings of the ASME 2016 Pressure Vessels and Piping Conference, Volume 3: Design and Analysis, Vancouver, BC, Canada, 17–21 July 2016. [Google Scholar]
- Skousen, P.L. Valve Handbook; McGraw-Hill: New York, NY, USA, 1997. [Google Scholar]
- Yi, J.; Hu, H.; Zheng, Y.; Zhang, Y. Experimental and computational failure analysis of a high pressure regulating valve in a chemical plant. Eng. Fail. Anal. 2016, 70, 188–199. [Google Scholar] [CrossRef]
- Kwon, O.G.; Han, M.S. Failure analysis of the exhaust valve stem from a Waukesha P9390 GSI gas engine. Eng. Fail. Anal. 2004, 11, 439–447. [Google Scholar] [CrossRef]
- Mazloum, J.; Shamsi, A. 3D design and numerical simulation of a check-valve micropump for lab-on-a-chip applications. J. Micro-Bio Robot. 2020, 16, 237–248. [Google Scholar] [CrossRef]
- Misra, A.; Behdinan, K.; Cleghorn, W.L. Self-Excited Vibration of a Regulating Valve due to Fluid-Structure Interaction. J. Fluids Struct. 2003, 16, 649–665. [Google Scholar] [CrossRef]
- Lin, Z.; Sun, X.; Yu, T.; Zhang, Y.; Li, Y.; Zhu, Z. Gas–solid two-phase flow and erosion calculation of gate valve based on the CFD-DEM model. Powder Technol. 2020, 366, 395–407. [Google Scholar] [CrossRef]
- Zhu, S.; Wu, H.; Gao, H.; Guo, H.; Hao, W.; Hu, J.; Hu, C. Simulation of the Real Working Conditions of Cryogenic Valves. Fluid Mach. 2020, 48, 58–61. [Google Scholar]
- Hu, F. Research on the Speediness Improvement of Water Jet Propelling High-Speed Landing Transport Ships. Ph.D. Thesis, Wuhan University of Technology, Wuhan, China, 2017. [Google Scholar]
- Cao, J. A Hybrid Grid Generation Algorithm Adapted to the Simulation of Viscous Flow with Complex Shapes. Ph.D. Thesis, Zhejiang University, Zhejiang, China, 2013; pp. 73–74. [Google Scholar]
- Wood, B.D.; He, X.; Apte, S.V. Modeling Turbulent Flows in Porous Media. Annu. Rev. Fluid Mech. 2019, 52, 171–203. [Google Scholar] [CrossRef]
- Qian, Z.; Wu, P.; Guo, Z.; Huai, W. Numerical simulation of air entrainment and suppression in pump sump. Sci. China Technol. Sci. 2016, 59, 1847–1855. [Google Scholar] [CrossRef]
- Durbin, P.A. Some Recent Developments in Turbulence Closure Modeling. Annu. Rev. Fluid Mech. 2018, 50, 77–103. [Google Scholar] [CrossRef]
- Wang, W. Simulation Research on Transient Flow Field and Vortex-Induced Vibration of High Pressure Drop Labyrinth Cage Combination Regulating Valve. Ph.D. Thesis, Lanzhou University of Technology, Lanzhou, China, 2018. [Google Scholar]
- Li, W.J.; Shi, L.L.; Yang, W.D.; Ping, Y.F.; Zhang, W.Q. Experiment of Flow Induced Vibration of Mixed-Flow Pump Based on Hilbert-Huang Transform. Trans. Chin. Soc. Agric. Eng. 2018, 34, 47–54. [Google Scholar]
- Cao, S.; Zhang, W.; Xiao, L. (Eds.) Vibration Structure Modal Analysis; Tianjin University Press: Tianjin, China, 2014. [Google Scholar]
- Hassan, T.; Rahman, M.; Bari, S. Low-Cycle Fatigue and Ratcheting Responses of Elbow Piping Components. J. Press. Vessel. Technol. 2015, 137, 031010. [Google Scholar] [CrossRef]
- Qin, F.; Bie, X.; Chen, S.; An, T. Fatigue life model of plastic ball grid array leaded solder joints under random vibration load. Vib. Shock. 2021, 40, 164–170. [Google Scholar]
- Li, F.; Wu, H.; Wu, P. Vibration fatigue dynamic stress simulation under non-stationary state. Mech. Syst. Signal Process. 2021, 146, 107006. [Google Scholar] [CrossRef]
- Jiang, W.; Xie, X.; Wang, T.; Zhang, X.; Tu, S.-T.; Wang, J.; Zhao, X. Fatigue life prediction of 316 L stainless steel weld joint including the role of residual stress and its evolution: Experimental and modelling. Int. J. Fatigue 2021, 143, 105997. [Google Scholar] [CrossRef]
- Chen, W.; Spätig, P.; Seifert, H. Role of mean stress on fatigue behavior of a 316 L austenitic stainless steel in LWR and air environments. Int. J. Fatigue 2020, 145, 106111. [Google Scholar]
- Wang, Y.; Su, Z. Effect of micro-defects on fatigue lifetime of additive manufactured 316 L stainless steel under multiaxial loading. Theor. Appl. Fract. Mech. 2021, 111, 102849. [Google Scholar] [CrossRef]
- Prasad, S.R.; Sekhar, A.S. Life estimation of shafts using vibration based fatigue analysis. J. Mech. Sci. Technol. 2018, 32, 4071–4078. [Google Scholar] [CrossRef]
- ASM Handbook, Volume 19: Fatigue and Fracture; ASM International: Materials Park, OH, USA, 1996.
- Peterson, R.E.; Grandt, H.F., Jr. Stress Concentration Factors, 2nd ed.; Wiley: New York, NY, USA, 1997. [Google Scholar]
- A Mohammad, K.; Ali, A.; Sahari, B.B.; Abdullah, S. Fatigue behavior of Austenitic Type 316L Stainless Steel. IOP Conf. Series: Mater. Sci. Eng. 2012, 36, 012012. [Google Scholar] [CrossRef]
Disclaimer/Publisher’s Note: The statements, opinions and data contained in all publications are solely those of the individual author(s) and contributor(s) and not of MDPI and/or the editor(s). MDPI and/or the editor(s) disclaim responsibility for any injury to people or property resulting from any ideas, methods, instructions or products referred to in the content. |
© 2023 by the authors. Licensee MDPI, Basel, Switzerland. This article is an open access article distributed under the terms and conditions of the Creative Commons Attribution (CC BY) license (https://creativecommons.org/licenses/by/4.0/).