Pozzolanic Reactivity and Hydration Products of Cementitious Material Prepared Using Molybdenum Tailings
Abstract
:1. Introduction
2. Materials and Methods
2.1. Materials
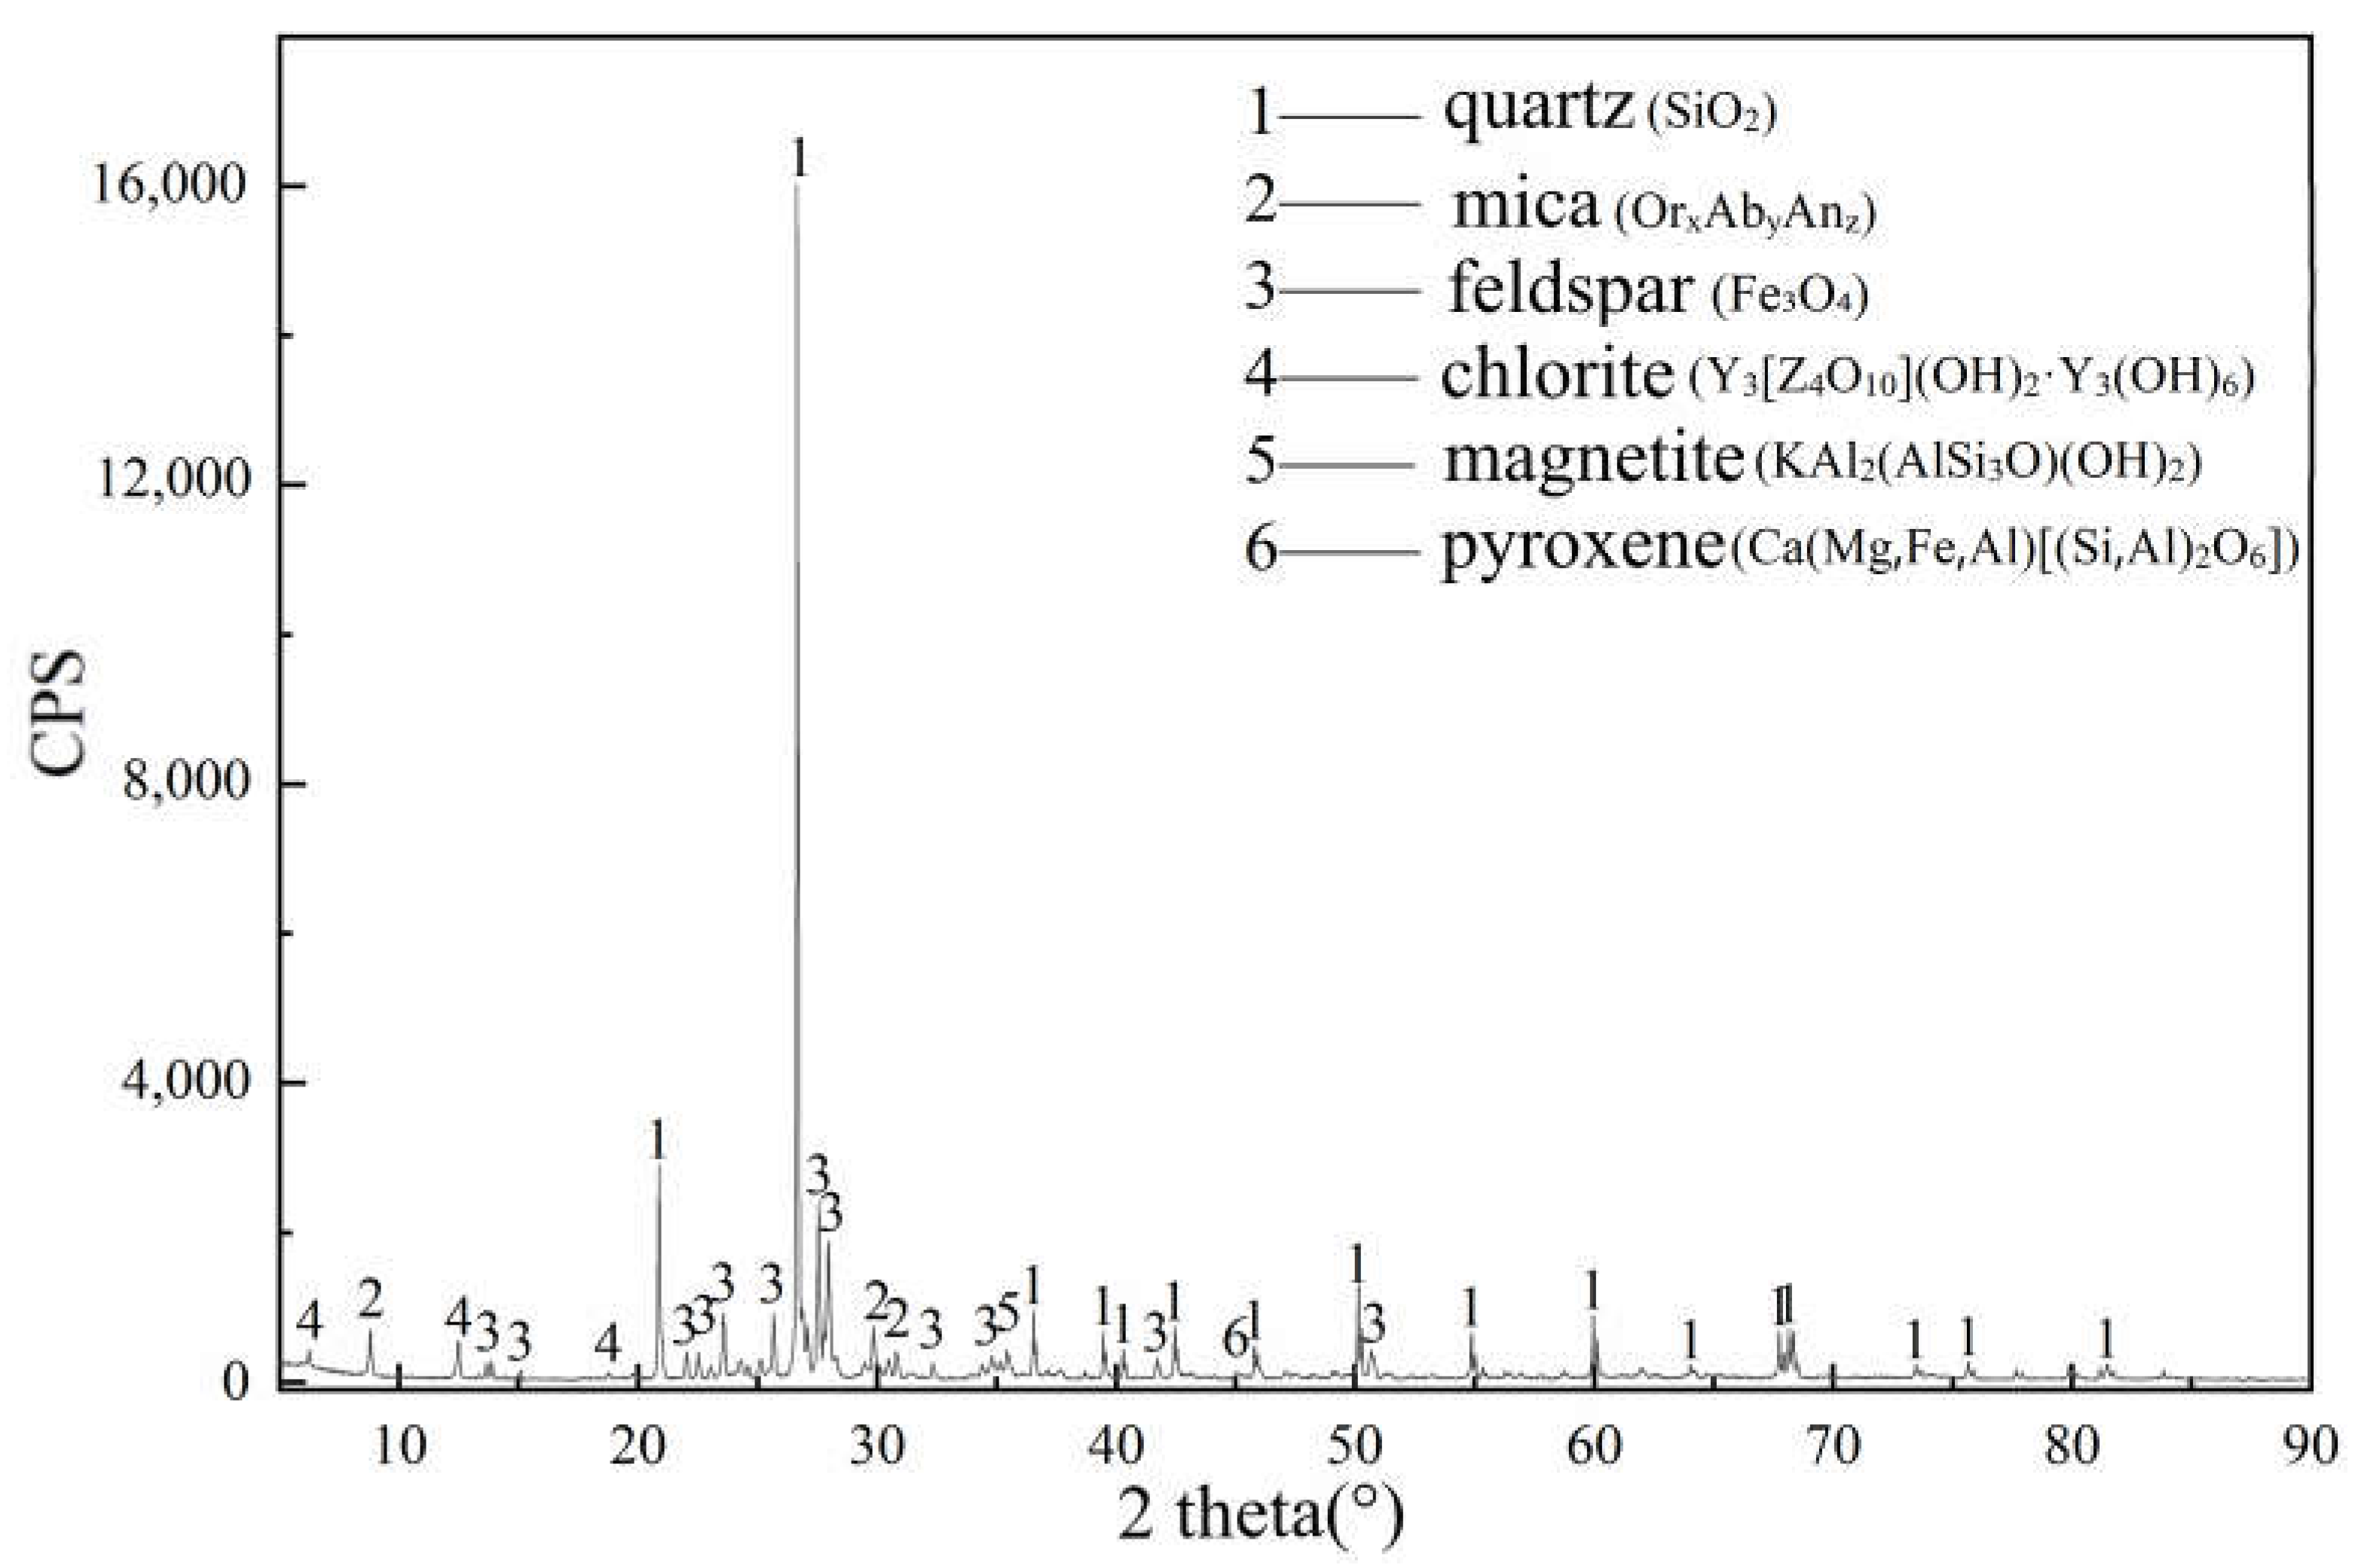
2.2. Characteristics of Molybdenum Tailings
2.3. Specimen Preparation and Testing
3. Results
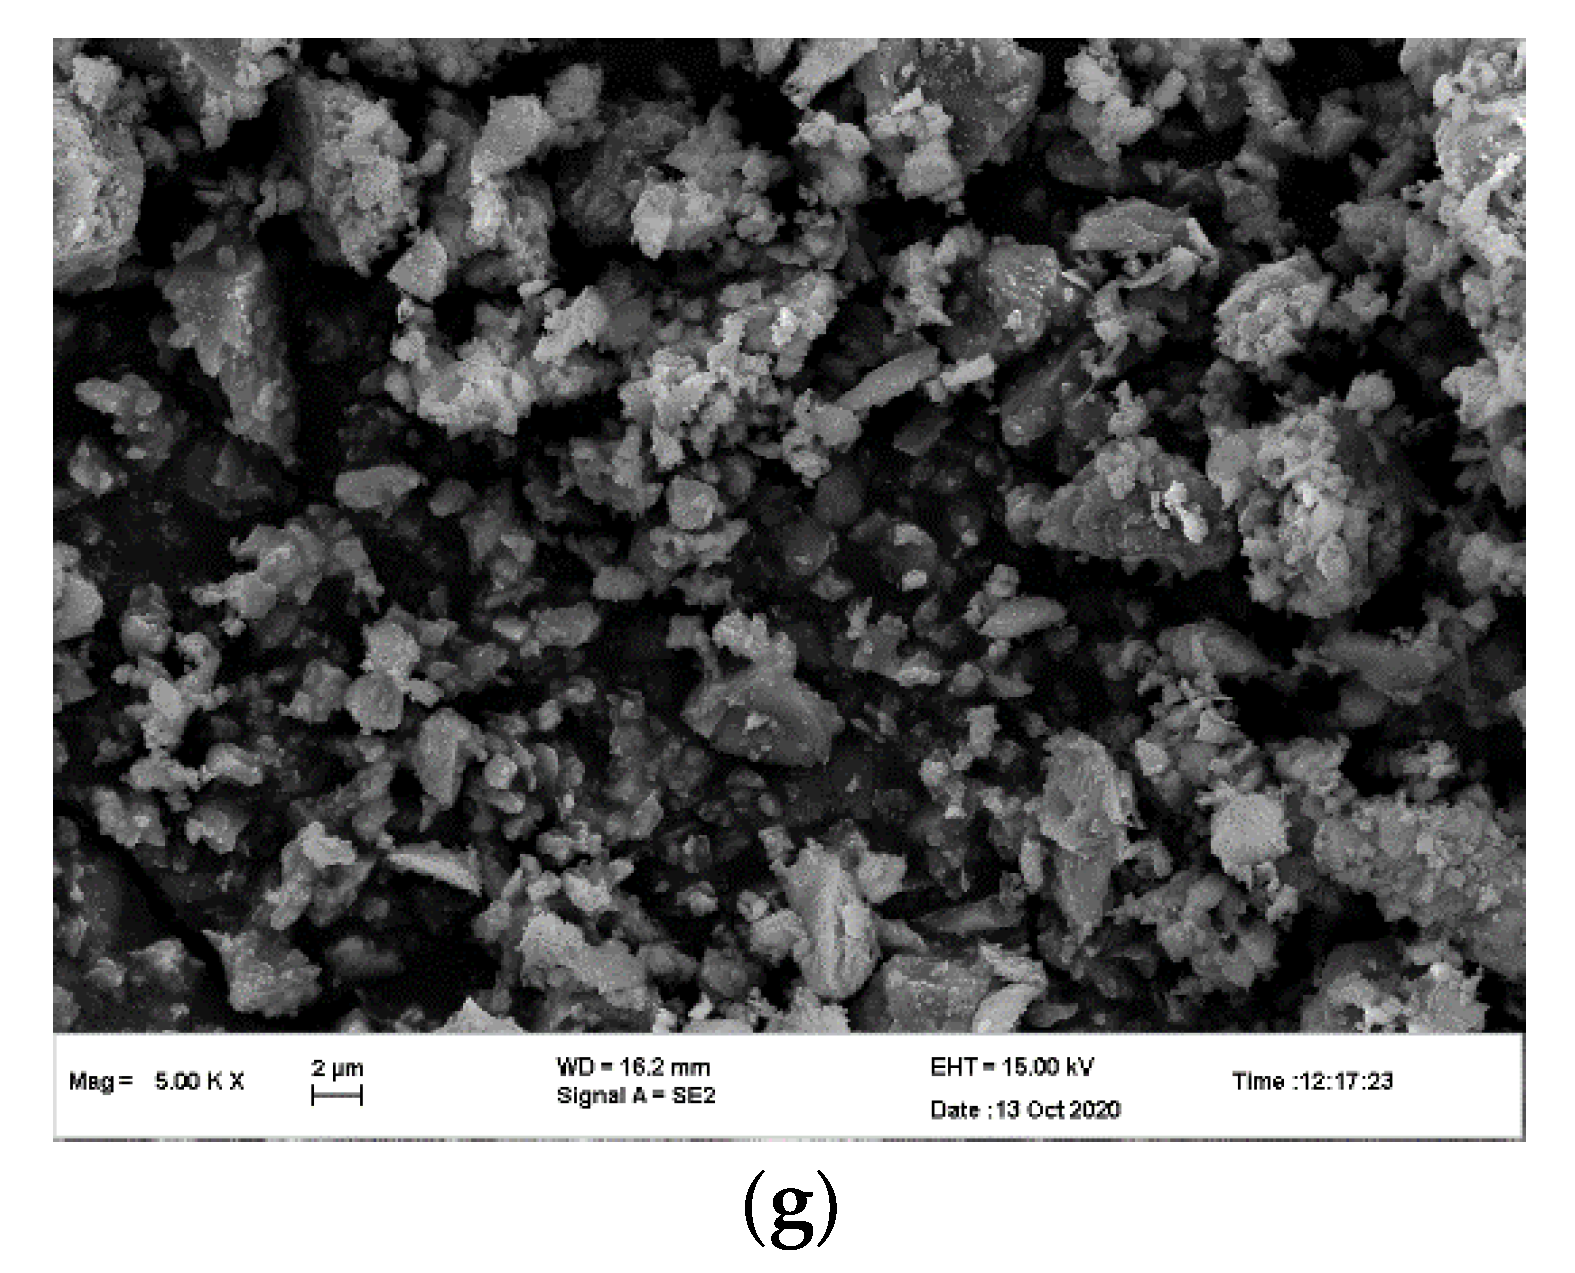
3.1. Specific Surface Area, Characteristic Particle Size, and Morphological Change of Molybdenum Tailings at Different Grinding Times
3.2. Compressive Strength of Paste Mixtures
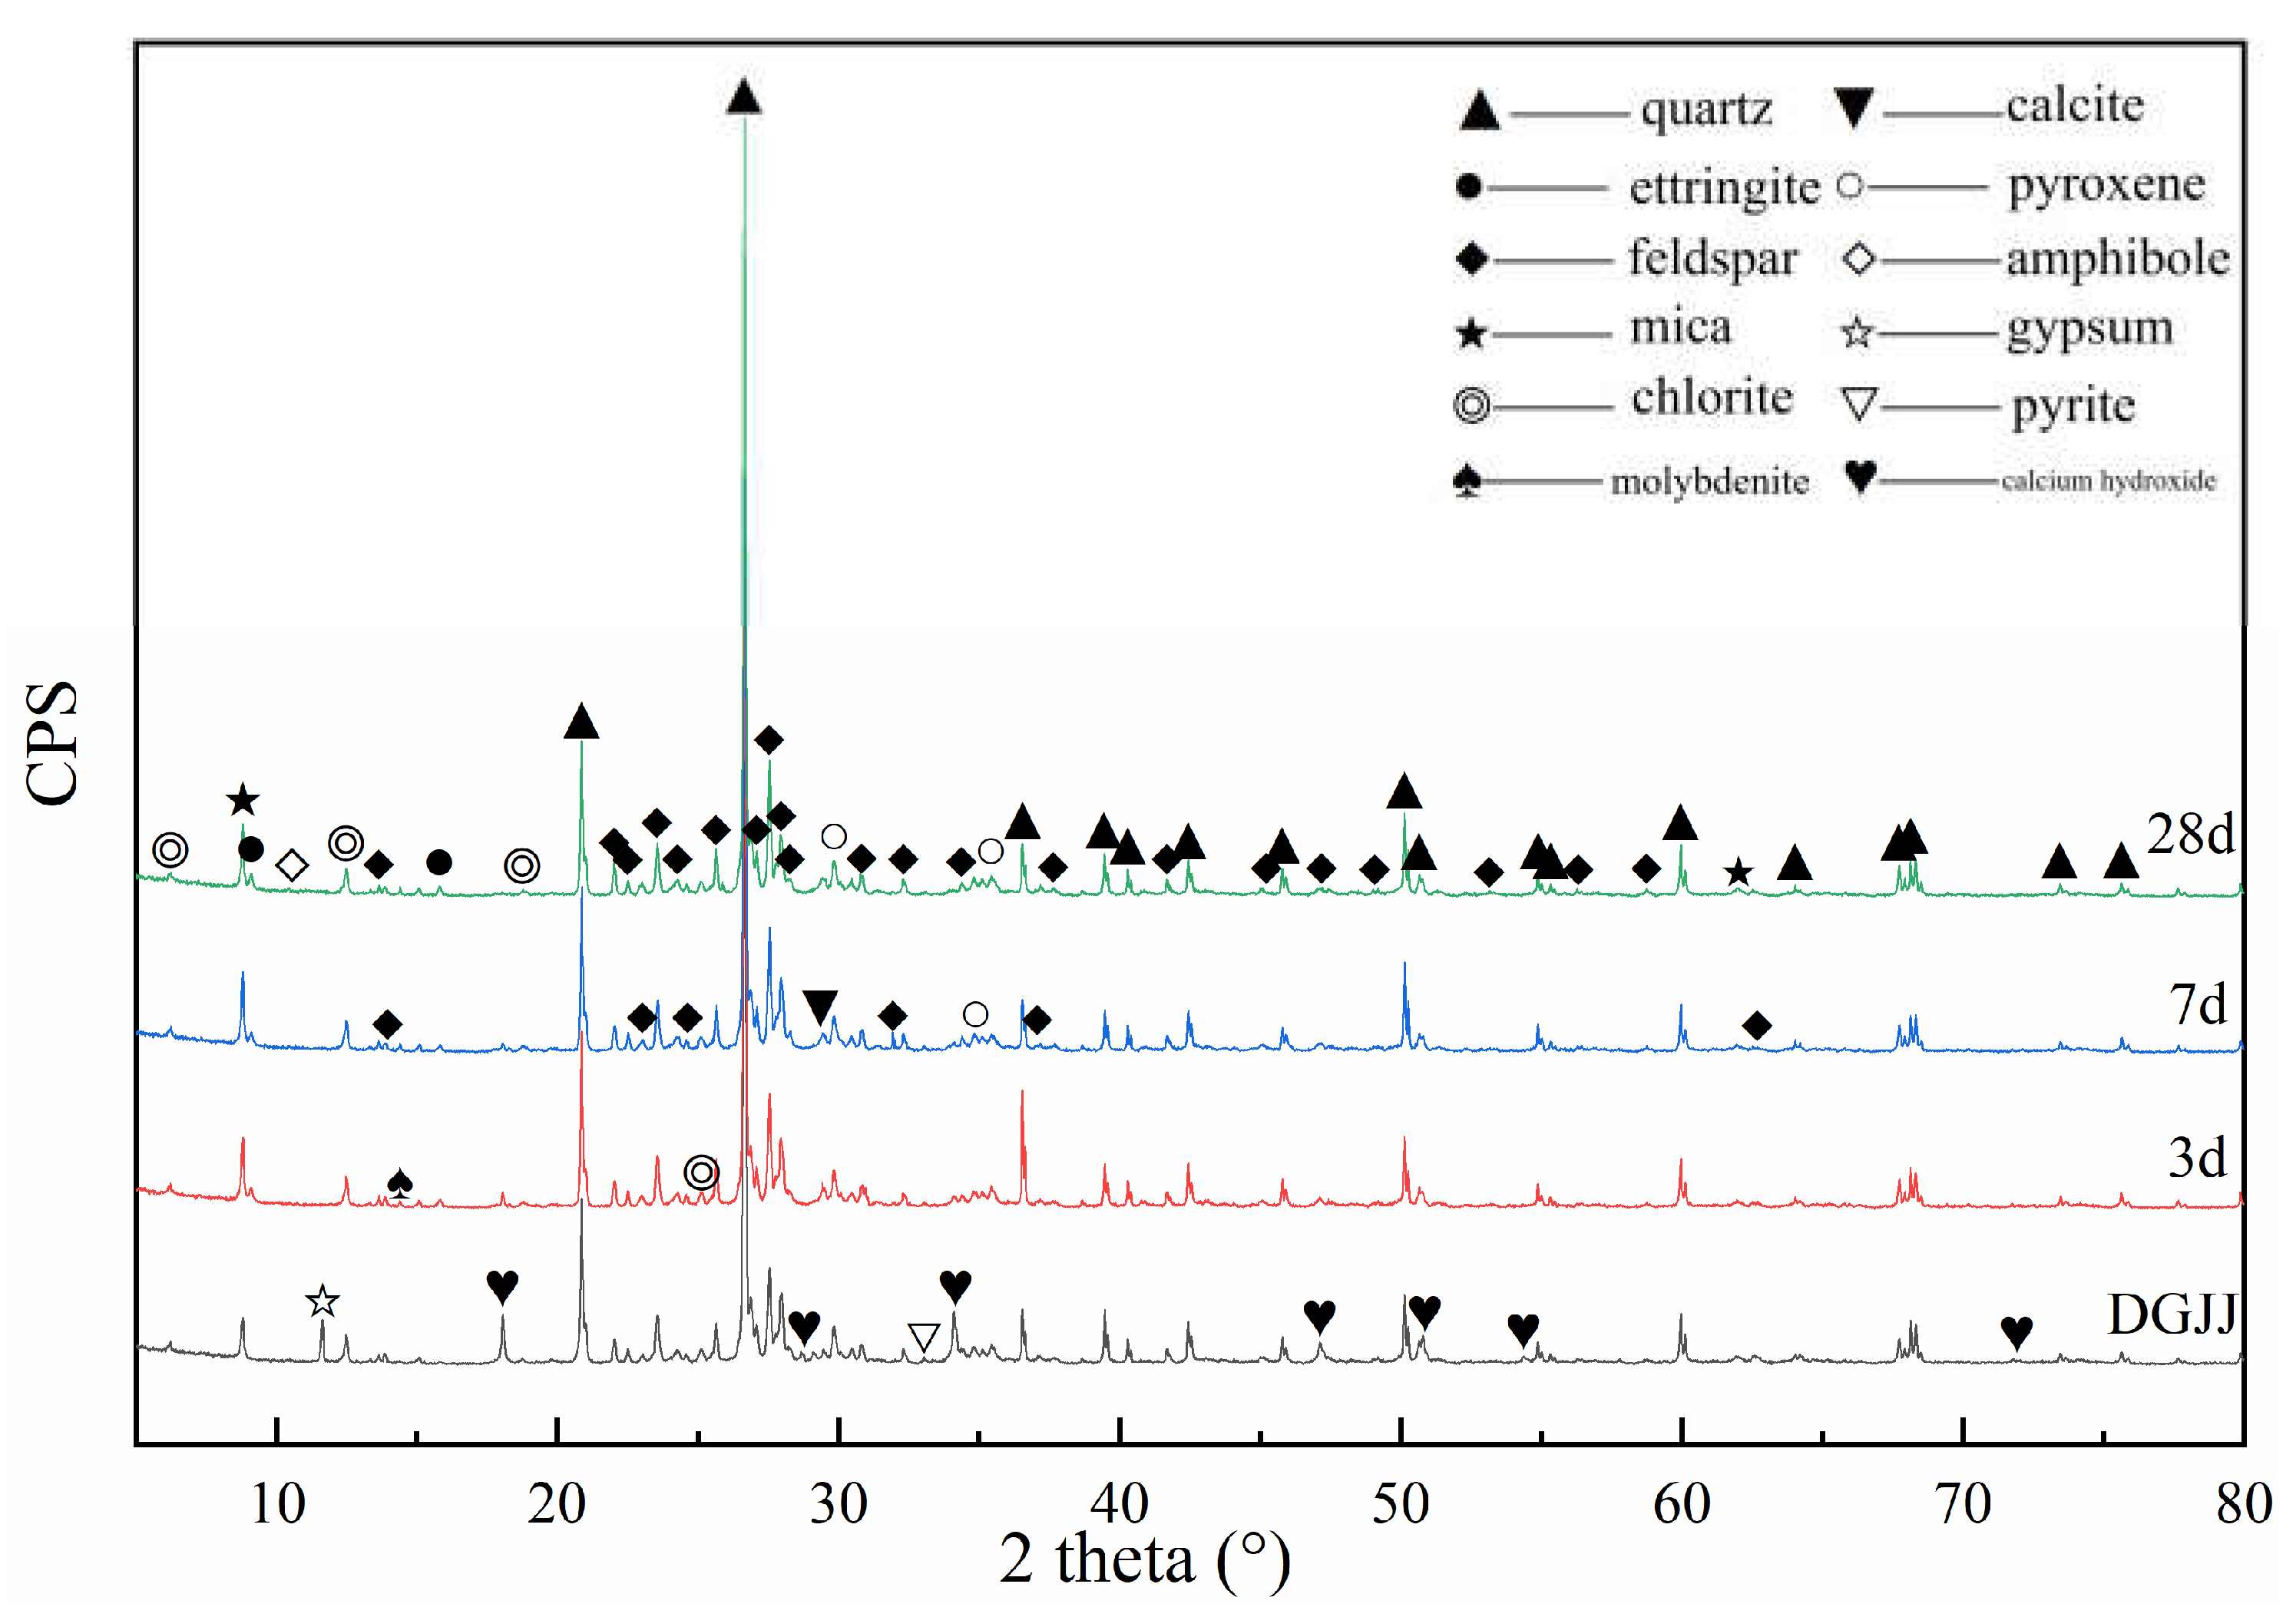
3.3. XRD Analyses of Paste Mixtures
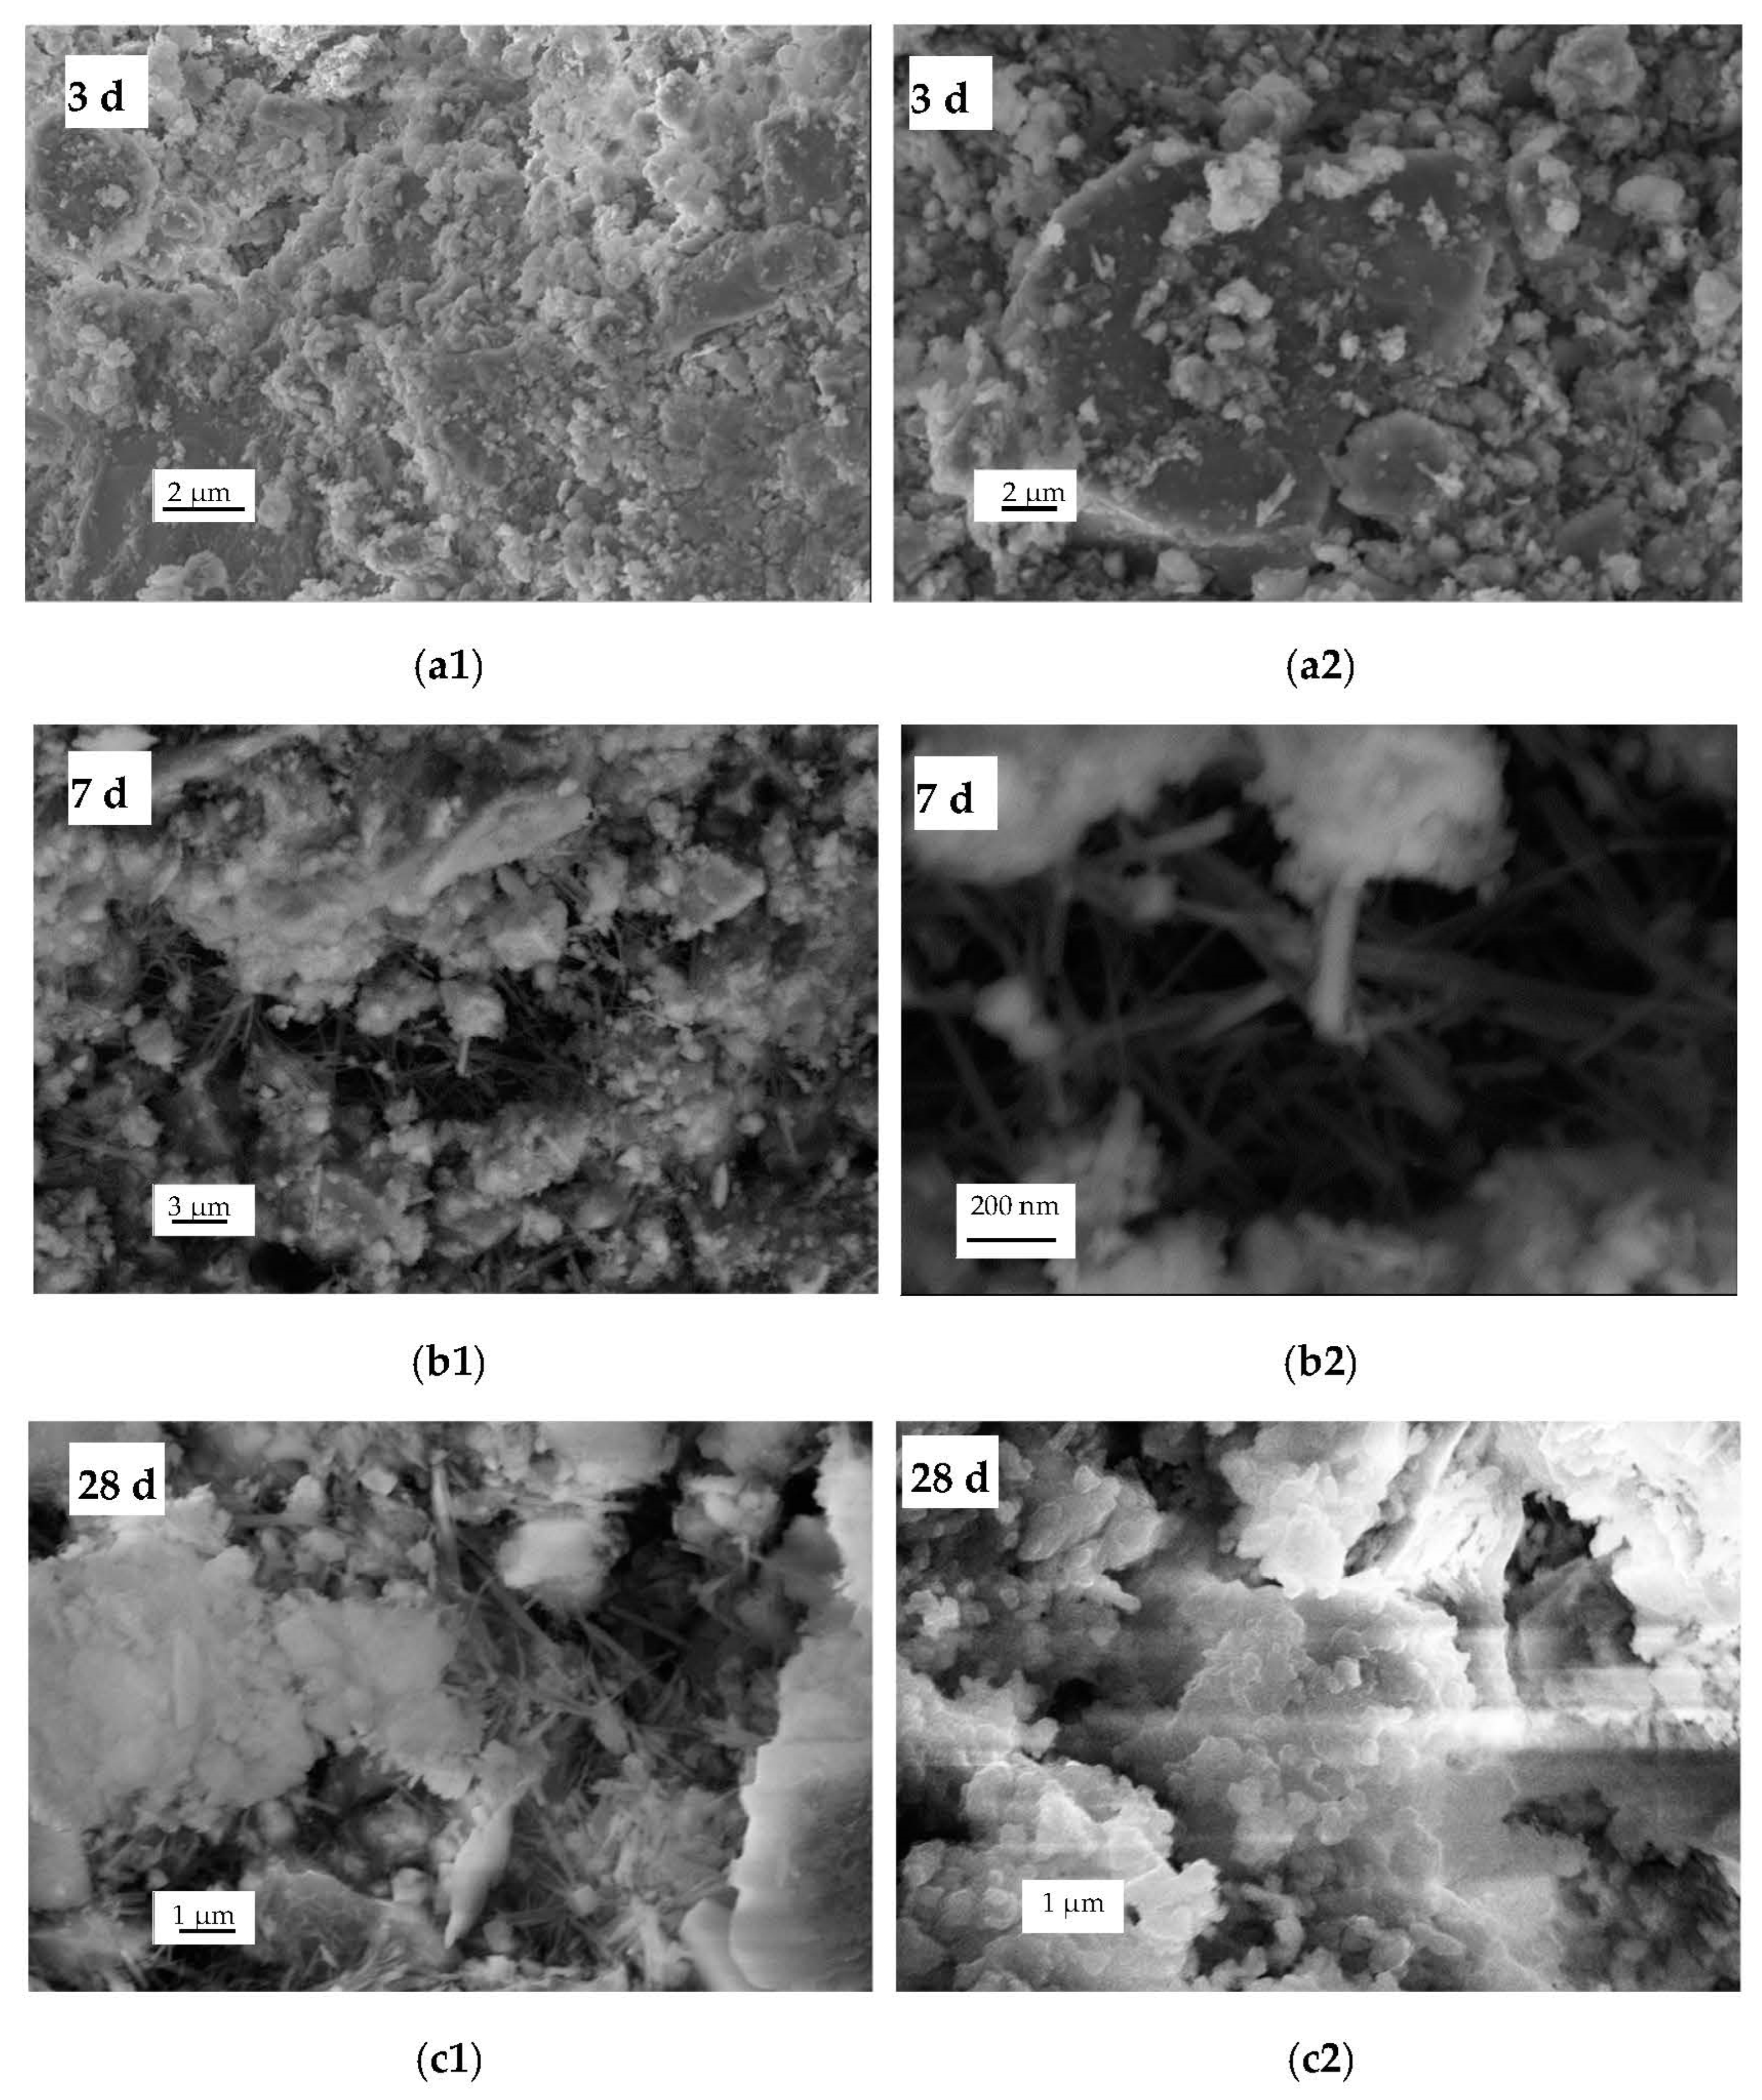
3.4. SEM Analyses of the Paste Mixtures
3.5. FTIR
4. Discussion
5. Conclusions
Author Contributions
Funding
Data Availability Statement
Acknowledgments
Conflicts of Interest
References
- Zhang, W. Progress of research on dressing technology of molybdenum ores. China Molybdeunm Ind. 2009, 33, 1–6. [Google Scholar]
- Di, Y.; Cui, X.; Pang, H. Preparation of a new type of lightweight building thermal insulation material mixed with tailings. Concr. Cem. Prod. 2016, 66–69. [Google Scholar]
- Di, Y.; Cui, X.; Li, C. Preparation of foamed cement thermal insulation material mixed with molybdenum tailings. New Build. Mater. 2016, 10–13. [Google Scholar]
- Di, Y.; Cui, X. Preparation of high-performance concrete mixed with tailings. J. Shangluo Univ. 2015, 32–36. [Google Scholar]
- Guo, X.; Yang, Y.; Lin, H. Study on the preparation of road cement clinker using molybdenum slag. New Build. Mater. 2011, 21–34. [Google Scholar]
- Cui, X.; Di, Y.; Nan, N. Experimental Study on Molybdenum Tailings Aggregate Concrete. Concr. Cem. Prod. 2016, 84–87. [Google Scholar]
- Cui, X.; Di, Y.; Nan, N. Preparation of high-performance concrete mixed with molybdenum tailings. Met. Mines 2017, 192–196. [Google Scholar]
- Yang, N. Mechanochemical processes and effects (I)—Mechanochemical effects. J. Build. Mater. 2000, 3, 19–26. [Google Scholar]
- Bensted, J.; Barnes, P. Structure and Performance of Cements, 2nd ed.; Spon Press: New York, NY, USA, 2002. [Google Scholar]
- Ylmén, R.; Jäglid, U.; Steenari, B.M.; Panas, I. Early hydration and setting of Portland cement monitored by IR, SEM and Vicat techniques. Cem. Concr. Res. 2009, 39, 433–439. [Google Scholar] [CrossRef]
- Silva, D.A.; Roman, H.R.; Gleize, P.J.P. Evidences of chemical interaction between EVA and hydrating Portland cement. Cem. Concr. Res. 2002, 32, 1383–1390. [Google Scholar] [CrossRef]
- Lee, T.C.; Wang, W.J.; Shih, P.Y.; Lin, K.L. Enhancement in early strengths of slag-cement mortars by adjusting basicity of the slag prepared from fly-ash of MSWI. Cem. Concr. Res. 2009, 39, 651–658. [Google Scholar] [CrossRef]
- Mollah, M.Y.A.; Yu, W.; Schennach, R.; Cocke, D.L. A Fourier transform infrared spectroscopic investigation of the early hydration of Portland cement and the influence of sodium lignosulfonate. Cem. Concr. Res. 2000, 30, 267–273. [Google Scholar] [CrossRef]
- Trezza, M.A.; Lavat, A.E. Analysis of the system 3CaO·Al2O3-CaSO4·2H2O-CaCO3-H2O by FT-IR spectroscopy. Cem. Concr. Res. 2001, 31, 869–872. [Google Scholar] [CrossRef]
- Carmona-Quiroga, P.M.; Blanco-Varela, M.T. Ettringite decomposition in the presence of barium carbonate. Cem. Concr. Res. 2013, 52, 140–148. [Google Scholar] [CrossRef]
- Hughes, T.L.; Methven, C.M.; Jones, T.G.; Pelham, S.E.; Fletcher, P.; Hall, C. Determining cement composition by Fourier transform infrared spectroscopy. Adv. Cem. Based Mater. 1995, 2, 91–104. [Google Scholar] [CrossRef]
- Yu, P.; Kirkpatrick, R.J.; Poe, B.; McMillan, P.F.; Cong, X. Structure of calcium silicate hydrate (C-S-H): Near-, mid-, and far-infrared spectroscopy. J. Am. Ceram. Soc. 1999, 82, 742–748. [Google Scholar] [CrossRef]
- Lodeiro, I.G.; Macphee, D.E.; Palomo, A.; Fernández-Jiménez, A. Effect of alkalis on fresh C-S-H gels. FTIR analysis. Cem. Concr. Res. 2009, 39, 147–153. [Google Scholar] [CrossRef]
- Geng, B.Y.; Ni, W.; Wang, J.J.; Qiu, X.J.; Huang, X.Y. An Initiative Investigation of the Pozzolanic Reaction of Ground Lead-Zinc Ore Tailings. Int. J. Earth Sci. Eng. 2015, 8, 1271–1278. [Google Scholar]
- Geng, B.Y.; Ni, W.; Wang, J.J.; Qiu, X.J.; Cui, X.; Ren, C.; Xing, Y. Pozzolanic Reactivity and Hydration Products of Hedenbergite. Chem. Eng. Trans. 2017, 62, 943–948. [Google Scholar]
- Geng, B.Y.; Ni, W.; Wang, J.J.; Qiu, X.J.; Cui, X.; Ren, C.; Xing, Y. Pozzolanic reactivity and hydration products of Quartz. J. Mines Met. Fuels 2017, 65, 641–647. [Google Scholar]


| Composition | SiO2 | Al2O3 | Fe | K2O | MgO | CaO | Na2O | TiO2 | P2O5 | MnO | Loss | S |
|---|---|---|---|---|---|---|---|---|---|---|---|---|
| Molybdenum tailings | 69.24 | 10.07 | 3.86 | 4.89 | 0.89 | 2.14 | 1.99 | 0.68 | 0.20 | 0.17 | 1.45 | 0.38 |
| Composition | SiO2 | Al2O3 | Fe | K2O | MgO | CaO | SO3 | K2O | TiO2 | P2O5 | MnO | Loss |
|---|---|---|---|---|---|---|---|---|---|---|---|---|
| Natural gypsum | 1.07 | 0.29 | 0.855 | 0.04 | 1.43 | 48.76 | 43.21 | 0.04 | 0.02 | 0.02 | 0.009 | 1.45 |
| Contaminant | Cu | Pb | Zn | Ni | Cd | Cr | As | Hg |
|---|---|---|---|---|---|---|---|---|
| Regulatory level (mg/L) | 100 | 5 | 100 | 5 | 1 | 5 | 5 | 0.1 |
| Leachable concentration of contaminants in molybdenum tailing powder (mg/L) | <0.01 | <0.05 | <0.006 | <0.01 | 0.004 | <0.01 | <0.01 | <0.001 |
| Index | 40K | 226Ra | 232Th | IRa | Ir |
|---|---|---|---|---|---|
| Radionuclide of molybdenum tailing powder | 1249.94 | 32.29 | 42.29 | 0.2 | 0.6 |
| Limitation of GB6566 | ≤1.0 | Ir ≤ 1.0 |
| Grinding Time (min) | 0 | 15 | 30 | 45 | 60 | 75 | 90 |
|---|---|---|---|---|---|---|---|
| Specific surface area (m2/kg) | 67.2 | 367.0 | 552.7 | 730.6 | 934.2 | 775.1 | 633.9 |
| Grinding Time (min) | Characteristic Particle Size (μm) | ||
|---|---|---|---|
| D10 | D50 | D90 | |
| 0 | 11.726 | 141.911 | 371.131 |
| 15 | 1.648 | 12.485 | 48.701 |
| 30 | 1.375 | 9.846 | 44.399 |
| 45 | 1.195 | 7.648 | 33.448 |
| 60 | 1.041 | 6.275 | 29.900 |
| 75 | 0.963 | 5.434 | 25.246 |
| 90 | 1.308 | 10.573 | 64.568 |
| Curing age (days) | 3 | 7 | 28 |
| Compressive strength (MPa) | 1.67 | 3.17 | 3.83 |
| Mineral Composition | 2θ | Original Powder | 3 Days | 7 Days | 28 Days |
|---|---|---|---|---|---|
| Portlandite | 18.04°; 34.04° | exist | weaken | weaken | disappear |
| Gypsum | 11.63° | exist | disappear | non-existent | non-existent |
| Ettringite (AFt) | 9.16°, 15.68° | non-existent | appear | intensify | intensify |
| C-S-H gel | Between 26° and 34° | non-existent | appear | intensify | intensify |
Disclaimer/Publisher’s Note: The statements, opinions and data contained in all publications are solely those of the individual author(s) and contributor(s) and not of MDPI and/or the editor(s). MDPI and/or the editor(s) disclaim responsibility for any injury to people or property resulting from any ideas, methods, instructions or products referred to in the content. |
© 2023 by the authors. Licensee MDPI, Basel, Switzerland. This article is an open access article distributed under the terms and conditions of the Creative Commons Attribution (CC BY) license (https://creativecommons.org/licenses/by/4.0/).
Share and Cite
Geng, B.; Wang, Z.; Shi, S.; Wang, K.; Fu, J.; Wen, Z.; Guo, X. Pozzolanic Reactivity and Hydration Products of Cementitious Material Prepared Using Molybdenum Tailings. Processes 2023, 11, 1101. https://doi.org/10.3390/pr11041101
Geng B, Wang Z, Shi S, Wang K, Fu J, Wen Z, Guo X. Pozzolanic Reactivity and Hydration Products of Cementitious Material Prepared Using Molybdenum Tailings. Processes. 2023; 11(4):1101. https://doi.org/10.3390/pr11041101
Chicago/Turabian StyleGeng, Biyao, Zongwen Wang, Shihu Shi, Kun Wang, Jianxun Fu, Zhenjiang Wen, and Xiaogang Guo. 2023. "Pozzolanic Reactivity and Hydration Products of Cementitious Material Prepared Using Molybdenum Tailings" Processes 11, no. 4: 1101. https://doi.org/10.3390/pr11041101
APA StyleGeng, B., Wang, Z., Shi, S., Wang, K., Fu, J., Wen, Z., & Guo, X. (2023). Pozzolanic Reactivity and Hydration Products of Cementitious Material Prepared Using Molybdenum Tailings. Processes, 11(4), 1101. https://doi.org/10.3390/pr11041101


