Article

Mixed Seeds of Oat and Vetch Based on DEM-Fluent Coupling Motion Simulation in a Venturi Tube

Department of Agricultural Engineering, College of Engineering, China Agricultural University, Beijing 100083, China
*
Author to whom correspondence should be addressed.
Processes 2023, 11(4), 1095; https://doi.org/10.3390/pr11041095
Submission received: 9 March 2023 / Revised: 26 March 2023 / Accepted: 29 March 2023 / Published: 4 April 2023
(This article belongs to the Special Issue Computational Modeling of Multiphase Flow (II))

Abstract

:
The gas–solid flow of mixed seeds of oat and vetch in the air-blowing venturi tube was simulated numerically by means of a coupling approach of the discrete element method (DEM) and computational fluid dynamics (CFD). In the gas–solid coupling model, EDEM software was used to depict the discrete particle phase, and ANSYS Fluent software was used to describe the continuous gas phase. The effects of the seed entry angle and inlet air velocity on the uniformity of mixed seed supply were studied and analyzed from the angle of airflow field variation and mixed seeds movement characteristics. The simulation results showed that the seeding angle has a great influence on the seed movement in the tube and affects the pressure and velocity gradient of the airflow field. If the seed insertion angle is too large, the number of collisions between the seed and the tube wall will increase, and the phenomenon of seeds retention and disordered jumping will occur. The inlet air velocity mainly affects the outlet air velocity and seed velocity and has little effect on the change in airfield. With the increase in inlet air velocity, the greater the velocity and force of the seeds, the closer the mixed seeds collide with the wall to the outlet pipe. At high inlet airflow velocity, there is a great disparity in the movement speed between the seeds, resulting in uneven spacing between the seeds. The results showed that under the conditions of 60° seed entry angle and 35~40 m/s inlet air velocity, the airflow field distribution in the tube was uniform and the seed movement was continuous and uniform.

1. Introduction

The mixed sowing of legume and gramineous grasses is an important planting technology that can be used to establish artificial grassland and artificial lawn. Compared with the single sowing of forage seeds, mixed sowing has the advantages of different grasses to overcome their individual shortcomings and achieve complementary advantages [1,2,3]. Oat grass has high grass yield, great palatability, and low crude protein content, which cannot meet the protein needs of livestock. The crude protein content of annual legume vetch in the flowering period is as high as 26.8%, but when it is planted alone, its branches are creeping, unable to make full use of space, and the grass yield is not high. When mixed with oats, it can stand up with the support of oats to obtain high yield, and the total protein of forage can also be significantly increased. In addition, vetch can also fix nitrogen in the atmosphere to improve soil fertility and increase the yield of mixed sown grassland. Therefore, this has become an important mixed sowing combination mode. The mixed sowing amount and proportion are the main factors affecting the mixed sowing effect. Among them, the mixed sowing of oat and vetch seeds with a mass ratio of 1:1 has the highest benefit [4,5].
Currently, most of the forage seed-metering devices are external-grooved wheel or friction disc-type seed-metering devices, which have poor adaptability and mobility to small-grain-size forage seeds, resulting in difficult seed metering and a poor seed metering effect. However, the air delivery header has become the main trend of the development of seeders because of its strong applicability and high efficiency to the seeds of legumes and gramineous grasses [6,7,8], in which the venturi pipe directly affects the movement state of the seeds in the transmission pipeline and the uniformity of the seed supply [9,10,11]. The structure of the venturi tube not only affects the movement state of the seeds, but also has an important influence on the seed filling performance of the seed metering device.
Due to the inherent complexity of gas–solid two-phase flow, many aspects rely on empirical formulas and empirical data, and there is still a large gap in the empirical data obtained by different researchers, lacking a unified formula with strong applicability. In recent years, with the development of numerical simulation, DEM-CFD has become an important means to study the mechanism of gas–solid two-phase flow and has been widely used in the optimization design of agricultural machinery, especially for analyzing the complex force and motion law of seeds in the pneumatic precision seed-metering device [12,13,14]. Leno Guzman [15] used the CFD-DEM coupling method to simulate the transport process of seeds in the distribution pipe of the pneumatic seeder and analyzed the impact of different air velocities on the contact force acting on the seeds, so as to reduce the loss of seeding equipment and seeds. Yingbo Wang [16] adopted the DEM-CFD coupling method to simulate the effects of rotational speed, width, and length of the opening window on the seed motion characteristics in a self-priming wheat metering device, studied the seed filling performance, seed speed, resistance, and shooting speed characteristics under different parameter combinations, and verified the feasibility of the DEM-CFD coupling model. Dandan Han [17] used the DEM-CFD coupling method to simulate the gas–solid flow in an internal air-blown corn precision metering device, and used the orthogonal experimental design to evaluate the primary and secondary factors and parameters of the largest evaluation index affecting the working performance of the metering device, verifying that the DEM-CFD coupling method was a reliable tool for simulating the physical phenomenon of seed movement in the air field. Hongji Hu [18] carried out a numerical study on the movement characteristics of rapeseed in the two-phase flow of the distribution head of an air-assisted central metering device, studied the effects of different structures and working parameters on the seed movement characteristics and airflow field, and optimized the structure of the distribution head of the metering device. Xiaojun Gao [19] studied a new quantitative seed-feeding system using DEM-CFD coupling method, analyzed the flow characteristics and airflow field of seed particles in the system, and investigated the influence of different variables related to venturi and operation, obtaining the appropriate convergence angle and seeding angle of the system. Xiaolong Lei [20] used the DEM-CFD coupling method to simulate the seed movement in the distribution head of the air-blowing seed-metering system, describing the seed migration trajectory and distribution behavior. The results explained the seed distribution mechanism and optimized the distribution head structure. In order to verify the applicability of the DEM-CFD coupling method to describe the motion characteristics of gas–solid two-phase flow, H. Kruggel-Emden [21] established a mathematical model that can describe the motion of particles of arbitrary shape in the pneumatic conveying process and analyze the motion law of particles of different shapes in the pneumatic conveying elbow using the DEM-CFD method.
However, the DEM-CFD coupling method is also used to simulate the motion of other particles in the pneumatic conveying device. Gu Fengwei [22] established the flexible body model of rod-shaped and block-shaped crushed straw and the coupling model including the mechanical structure of the device. The DEM-CFD coupling method was used to simulate the conveying performance of different pipes under different throwing blade speed, conveying capacity, pipe diameter, and initial feed speed, and determine the impact of these parameters on the performance of the conveying device and its own changes. Jing Xu [23] studied the conveying performance of powder injector based on single venturi effect and double venturi effect and the influence of nozzle position on conveying performance using an experimental method and numerical simulation method based on CFD-DEM coupling.
Although there are many kinds of simulation studies on seed-metering devices, most of them only focus on the motion simulation of a single seed or particle in the device. However, there are less motion characteristics of mixed seeds with different shapes under the action of airflow in the device. A multiphase flow model combining the discrete element method (DEM) and computational fluid dynamics (CFD) was adopted in this study. In the simulations, the seed was a discrete phase model based on Newton’s law of motion, and the airflow was considered as local averaged Navier–Stoke equations. The movement process of mixed seeds of oat and vetch in an air-blown venturi was simulated using a gas solid two-phase flow model. The effects of seed entry angle and inlet air velocity on the uniformity of mixed seed supply were studied and analyzed from the angle of airflow field and mixed seed movement, and the appropriate seed entry angle and inlet air velocity were obtained. This study well described the motion characteristics of mixed seeds with different shapes under the action of high-speed airflow in the venturi tube, and provided a basis for the research of the air-blowing mixed seeding device.

2. Structure and Working Principle of Air-Blowing Seed-Metering Device

The air-blowing seed-metering device was composed of a fan component, an air inlet pipe, a venturi tube, two mixed seed boxes, two stepper motors, spiral seed-feeding wheels, a seed-feeding elbow, and a conical distributor, as shown in Figure 1. In specific, the speed of two stepper motors was controlled according to the seeding amount and seeding proportion of oat seeds and vetch seed, and the spiral seed-feeding wheels were driven to rotate by two stepper motors. The process of seed filling, seed carrying, and seed feeding was completed by the spiral seed-feeding wheels. Oat seeds and vetch seeds were continuously and evenly transported to the “Y”-shaped mixed seed-feeding tube in proportion for uniform mixing, and the mixed seeds were discharged into the venturi tube. The gas–solid two-phase flow formed after mixing the mixed seeds and the airflow in the venturi tube, which then entered the seed-feeding elbow. The mixed seeds moved upward in the seed-feeding elbow and were blown into the conical distributor more evenly under the action of the corrugated booster pipe. In the uniformly arranged pipes of the conical distributor, under the effect of the internal and external air pressure difference, the mixed seeds were evenly distributed to the seed-feeding pipe to complete the mixed sowing operation.
The venturi tube was a key component to realize uniform mixing of airflow and seeds and continuous and uniform seed supply. Its structure diagram is shown in Figure 2. The venturi tube was divided into the seed-feeding area, air inlet area, mixing area, transition area, and conveying area, among which θ was the angle between the seed-feeding area and the mixing area. In specific, the mixed seeds in the seed boxes fell into the seed-feeding area in proportion, and the high-speed airflow generated by the fan entered the mixing area through the air inlet pipe. The mixed seeds were blown into the mixing area from the seed-feeding area by the high-speed airflow to form gas–solid two-phase flow. Because the mixing area maintained a high-speed airflow, the mixed seeds were blown into the transition area and the conveying area under the drag force of the high-speed airflow.

3. Basic Parameters and Model Establishment of Seed Delivery Device

This section may be divided by subheadings. It should provide a concise and precise description of the experimental results, their interpretation, as well as the experimental conclusions that can be drawn.

3.1. Basic Parameters of Venturi Seed Delivery Device

3.1.1. Air Inlet Velocity

According to the transport theory of particles in seed pipeline [24], the air inlet velocity can be expressed as follows:
v g = k l ρ p + k d L G
where v g is the air inlet velocity, m/s; k l is the seed granularity coefficient; ρ p is the seed particle density, ×103 kg/m3; k d is seed characteristic coefficient; L G is the pipe length, m.
If the seed size is 1~10 mm, k l is 16~20. Since the equivalent diameter of oat seeds and vetch seeds were about 5 mm, k l is taken as 18. Because the length of seed pipeline is generally not more than 3 m, and k d is (2~5) × 10−5, the influence of seed characteristic coefficient on air velocity can be ignored in the study. The seed densities of oat seeds and vetch seeds are 802 kg·m−3 and 1076.5 kg·m−3, respectively. To ensure the airflow velocity in the pipeline, 30% allowance is reserved, and the air inlet velocity of oat seeds and vetch seeds is calculated to be 20.86 m/s and 24.28 m/s, respectively.

3.1.2. Seed Gas Delivery Ratio

Seed gas delivery ratio is a measure of the mass ratio of seeds in the airflow, as shown in Equation (2):
η = G Z G Q
where, η is seed gas delivery ratio; G Z is the mass of seed delivery in unit time, kg/s; G Q is the mass of airflow in unit time, kg/s.

3.1.3. Air Inlet Pipe Diameter

The diameter of gas inlet pipe is calculated by Equation (3).
D G = 4 G Z π η ρ g v g
where, ρ g is the airflow density, taken as 1.205 kg/m3; D G is the air inlet pipe diameter, m. According to the requirements for the mixed sowing amount and sowing proportion of oat seeds and vetch seeds, when the forward speed is 1.5 m/s, the mixed sowing amount of oat seeds and vetch seeds with 1:1 quality is 15 g/s. As the gas–solid two-phase flow of the seed in the seed delivery pipeline is a dilute phase flow, the value range of η is 0.1~1.0, and the value in this study is 0.7. According to the calculation and the actual size of the pipeline, the diameter of the seed pipeline is 30 mm.

3.2. Establishment of Gas–Solid Two-Phase Flow Model

The gas flow in the cleaning device belongs to the turbulent motion of incompressible gas. Compared with the whole air-blowing seed-metering device, the volume fraction of the particle phase is less than 5%, and the volume fraction of the gas phase is close to 1. To analyze the motion state of the seed in the airflow field, the gas phase was treated as a continuous phase using the Eulerian–Langrangian approach, and the motion state of the seed in the airflow field was solved using Newton’s second law in the Lagrangian coordinate system. The gas continuity equation and momentum conservation equation in gas–solid two-phase flow are shown in Equations (4) and (5).
α f ρ g t + α f ρ f u f j x i = 0
α f ρ g u f i t + α f ρ f u f i u f j x j = α f p x i + α f τ i j x i + F s f + α f ρ g g
where, α f is the gas phase volume fraction; u f is the movement speed of airflow, that is, the air inlet velocity v g ; ρ g is the airflow density; p is the airflow pressure; τ is a time variable through which the whole movement of particles from the time of starting acceleration to the time of calculation is integrated; F s f is the force exerted by the solid phase on the gas phase.
According to Newton’s second law, the equations of motion of particle phase are shown in Equations (6)–(8).
m p d v p d t = F f p
I p d ω p d t = M f p
F f p = F D + F M + F L + F P + F a + F B
where, m p and I p is the mass and inertia term of particles, respectively; F f p is the fluid force of continuous gas phase for particles; M f p is the total rotational moment acting on particles. Among them, the main fluid forces acting on particles include motion resistance ( F D ) , Magnus spin lift force ( F M ), Saffman shear lift force ( F L ), pressure gradient force ( F P ), virtual mass force ( F a ), and Basset force ( F B ).
The motion resistance of a continuous gas phase acting on a single particle is calculated as in Equation (9):
F D = 1 8 C D π d p 2 ρ g u f u p 2
where, u p is the particle velocity; C D is the coefficient of drag force calculated according to [25].
C D = 24 R e p R e p 1 24 R e p 1 + 0.15 R e p 0.687 1 < R e p 1000 0.44 1000 < R e p 2 × 10 5
R e p = ρ g d p u f u p μ
where, μ is the dynamic viscosity coefficient of airflow.
In the process of gas–solid two-phase flow, the non-centripetal collision between particles and the non-uniform airflow field will cause particles to rotate; that is, they will be subject to Magnus spin lift force. The direction of action is perpendicular to the flow direction of the flow field, and the direction of action is from countercurrent to downstream. The Magnus spin lift force is calculated as in Equation (12).
F M = π d p 3 ρ g ω u p u f 1 + O R e
where, ω is the angular velocity of particle rotation.
If there is a velocity gradient in the airflow field where the particles are located, no matter whether the particles rotate or not, the particles will be subject to a lifting force, which is caused by the shear of the gas fluid. The Saffman shear lift force is calculated by Equation (13).
F L = 6.46 d p 2 ρ g μ k 1 2 u p u f
where, k is the absolute value of the transverse velocity gradient of the airflow.
The pressure gradient force is generated due to the existence of pressure gradient in the airflow field, and its action direction is opposite to the direction of the pressure gradient. The pressure gradient force is calculated as in Equation (14).
F P = 4 3 π d p 3 p x
When a particle flows through the nozzle, the acceleration of the fluid around it will produce a secondary flow around it, and the particle will attach a virtual mass force. At the same time, due to the viscous effect of the fluid, the Bessel force will also be generated. The calculation formulas are shown in Equations (15) and (16).
F a = 2 3 π d p 3 ρ g d u f u p d t
F B = 6 d p 2 π ρ g μ 0 t t τ 1 2 d u f u p d τ d τ

3.3. DEM-CFD Coupling Simulation Method
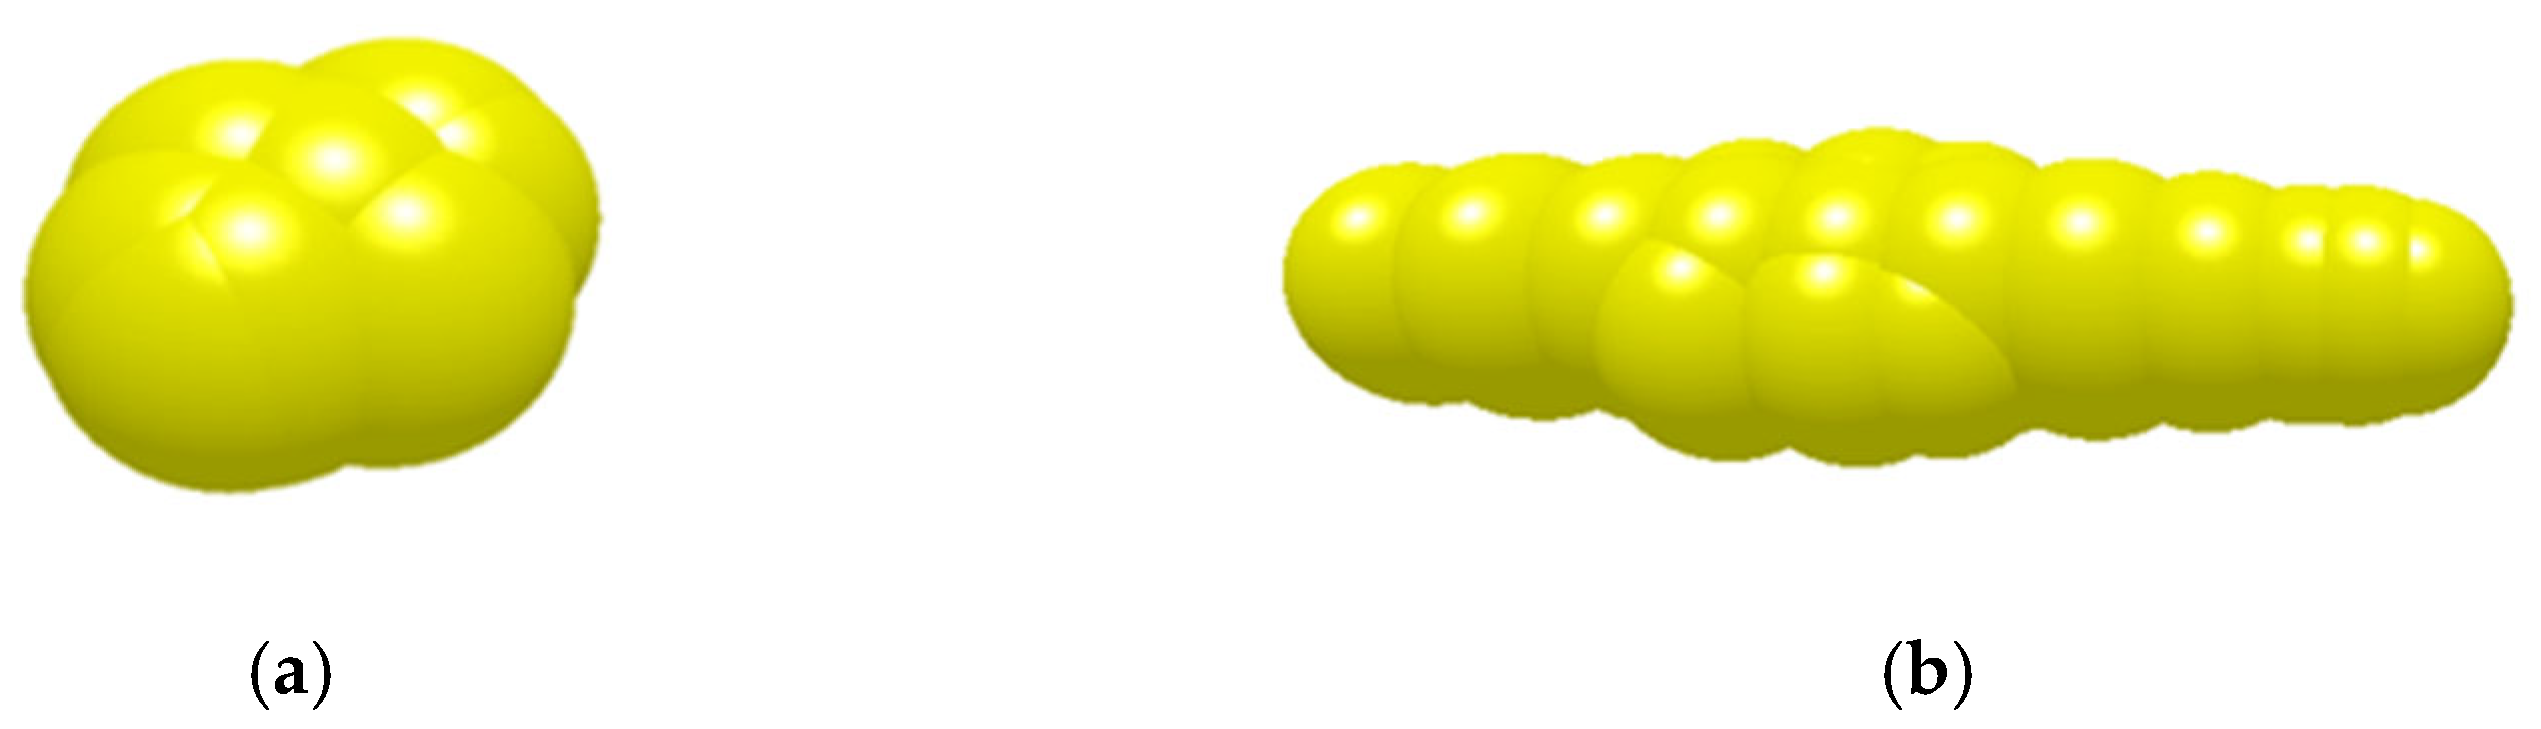
3.3.1. Solid Model

The discrete element models of oat seed and common vetch seed were established by using the EDEM simulation software, as shown in Figure 3. Since oat seeds and vetch seeds were both irregular bodies, it was difficult to establish their discrete element models through a single particle. The model was established by aggregating multiple spherical particles to more accurately simulate the actual seed characteristics. The Hertz–Mindlin nonslip model is selected as the particle contact model. As shown in Table 1, the geometric size and mechanical characteristic parameters of oat and vetch seeds were obtained through previous measurement and parameter calibration [26].

3.3.2. Airflow Phase Model

In the gas–solid coupling simulation, the CFD technique and particle motion was based on software of ANSYS Fluent 19.0 and EDEM 2018 (Engineering discrete element method, DEM Solutions Ltd, Edinburgh, UK), respectively. The grid division was carried out for the gas solid coupling analysis area, namely, the venturi tube. Meshing module of the software ANSYS was used to grid the seed-feeding tube. In order to ensure the accuracy of the calculation results, it was necessary to verify the grid independence of the model. As shown in Figure 4, 8285, 16,476, and 28,886 grids were selected for simulation testing. The results showed that the variation trend in the gas flow field in the tube was consistent under three different grid numbers. We considered local mesh refinement when selecting mesh sizes. Compared to the overall grid encryption, it could improve the accuracy of the calculation results, reduce the overall grid number, improve the calculation speed, and stabilize the simulation results. Therefore, the grid size of this study selected the number of 16,476 grids.
As shown in Figure 5, the total number of grids generated was 16,476, and the average grid volume was 3.69 × 10⁻³, as shown in Figure 4. Since the airflow entered from the nozzle inlet and flowed out from the opening at the other end, the nozzle inlet was selected as the velocity inlet boundary condition, and the seed inlet and the seed outlet at the other end of the pipe were selected as the pressure outlet boundary condition. The seed inlet was the inlet of the seed-feeding device for feeding seeds to the venturi tube, and the seed outlet was the outlet of gas–solid two-phase flow for mixing seeds and gas flow.

3.3.3. Seed-Feeding Process Simulation

The seeds were generated by the particle factory at the seed inlet, and the generated seeds entered the venturi tube under the action of their own gravity. The number of mixed seeds of oat seeds and vetch seeds with dynamic generation quality of 1:1 was set as 15 g/s. High speed airflow entered from the nozzle inlet and converged with the seed at the contraction port. The boundary condition of flow field pressure inlet was set as 8 kPa pressure inlet. The seeds were blown into the mixing chamber under the action of high-speed airflow and were uniformly mixed with the airflow before being blown out of the tube to realize seed supply. In this process, the real-time particle position and contact information was obtained from the software EDEM, and the obtained information was transferred to the software Fluent. The influence of particles on the flow field was simulated and calculated through the obtained information. The obtained flow field information was fed back to the software EDEM to simulate the influence of the flow field on particles, and then circulated in turn to achieve the effect of two-way gas–solid coupling.
In the process of simulation, the time step of EDEM and Fluent was selected as 2 × 10⁻⁶ s and 1 × 10⁻⁴ s, respectively. The number of the software Fluent steps was selected as 10,000, and the simulation time was 1 s. For more detailed particle motion information, data were saved every 0.01 s in the software EDEM and Fluent. The DEM-Fluent coupling simulation method was used to simulate the changes of the airflow field in the tube and the seed movement state under different entrance angles of the mixed seeds. Based on this simulation, the best entrance angle can be obtained and used to simulate the flow field change and seed movement state under different inlet air velocities, verifying the seed-feeding mechanism in the air-blowing venturi tube.

4. Results and Discussion

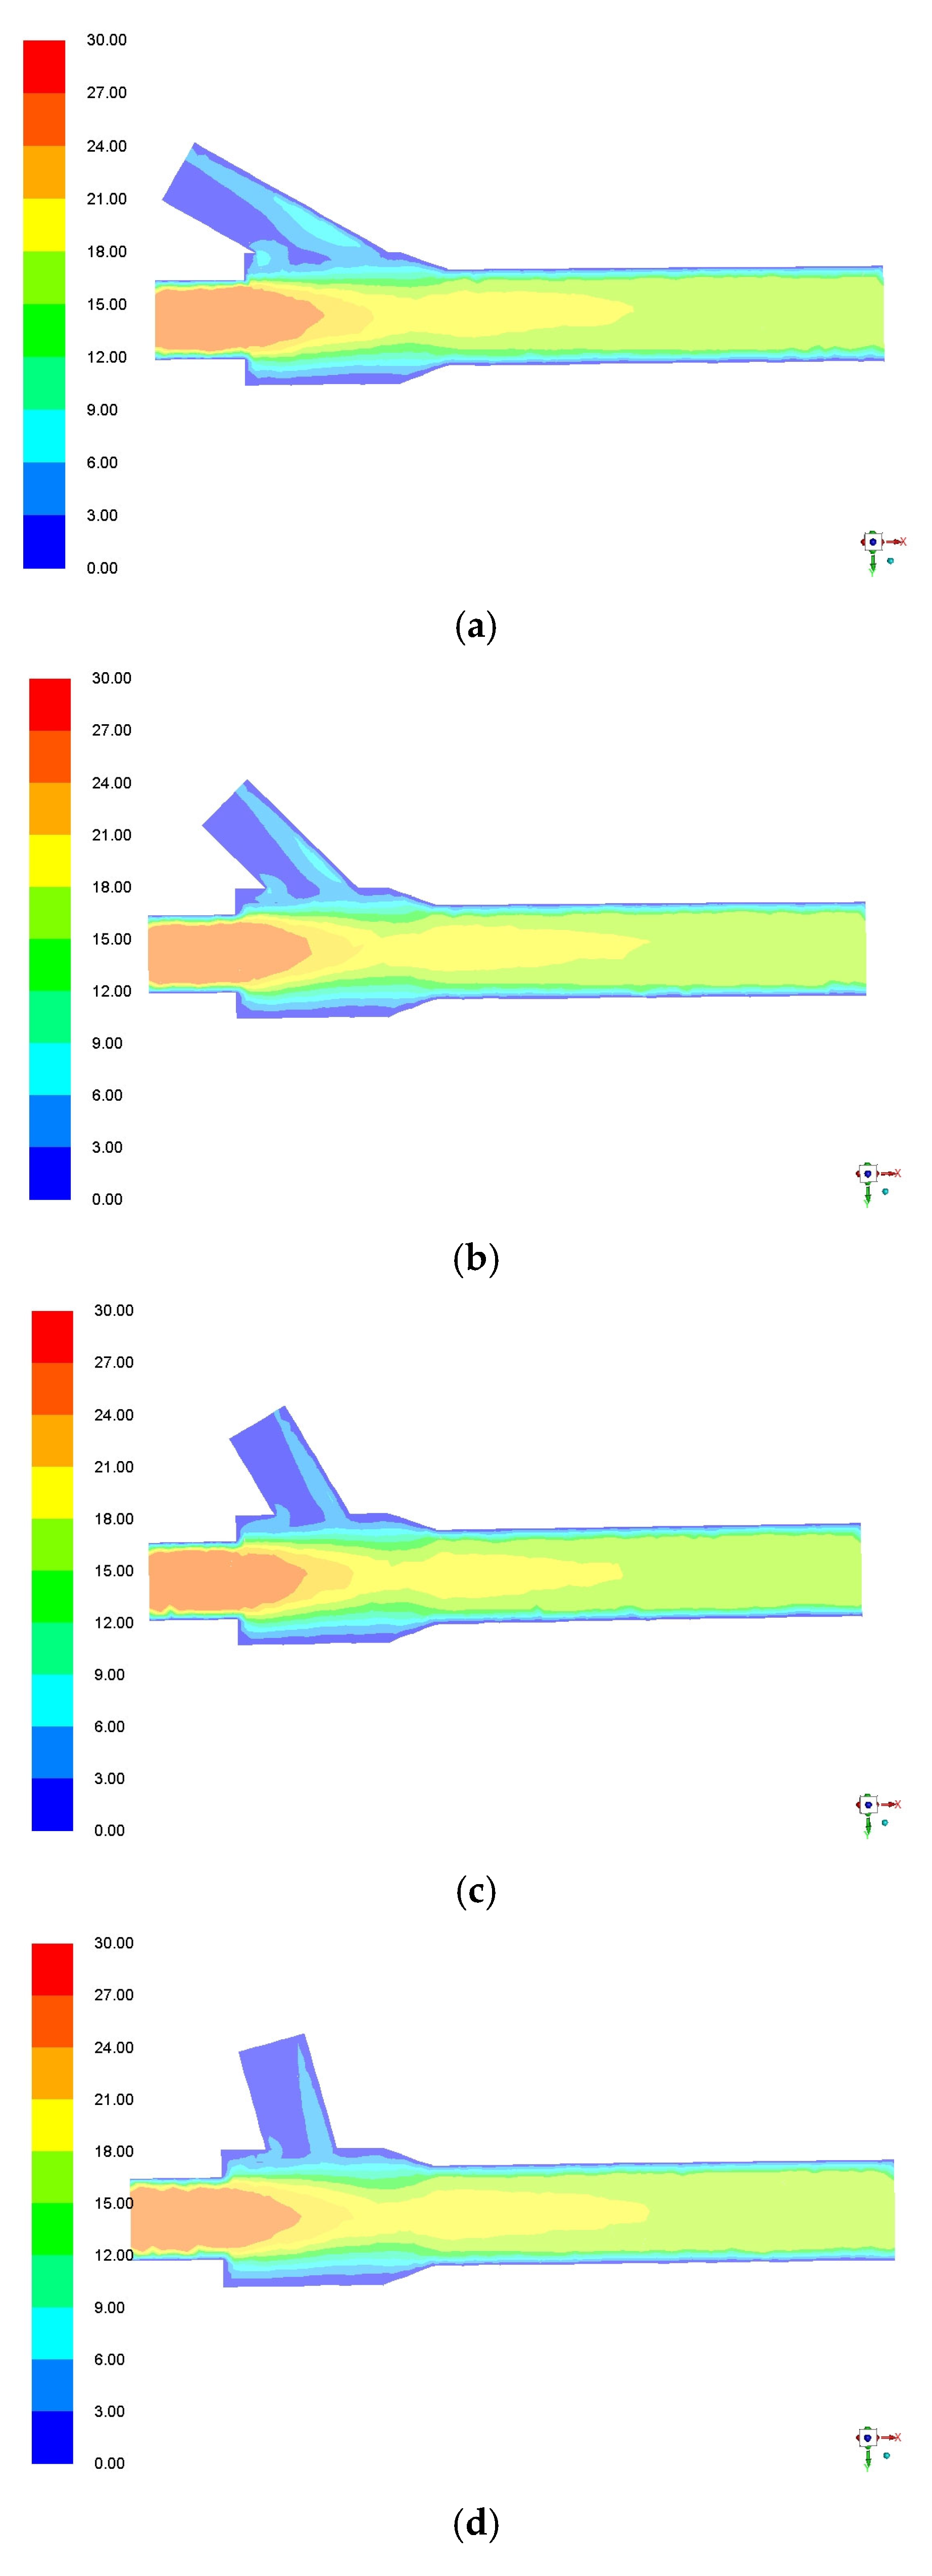
4.1. Effect of Seeding Angle on the Flow Field in the Tube

The angle of the seed entrance could affect the velocity of the seeds entering the venturi tube and the distribution of the airflow field. Therefore, the simulation of the mixed seeds of oat and vetch movement was carried out at five different seed entrance angles to obtain a specific angle for better seed-blowing results. The inlet angle was set at five levels: 30°, 45°, 60°, 75°, and 90°, and the velocity of the air inlet was set at 25 m/s.
The change in airflow field in the tubes with different seeding angles is shown in Figure 6. The results showed that the seeding angle had a significant impact on the airflow velocity in the venturi tube.
With the increase in seeding angle, the air velocity in the mixing zone first increased and then decreased, and the change in velocity gradient was prolonged along the x-axis. At a smaller seeding angle, the cross-section of the outlet nozzle of the seeding tube was larger, and the airflow had a large reflux at the junction of the mixing zone and the seeding zone. This result showed the existence of a local eddy current, resulting in a small airflow velocity in the mixing zone and a short change in the velocity gradient along the x-axis With the increased seeding angle in the range of 30°~60°, the decrease was observed in the cross section of the outlet nozzle of the seeding tube and the eddy current range at the junction. However, when the seeding angle was 75°~90°, the velocity gradient along the x-axis direction became shorter, and the seed-blowing ability was weakened. This was due to the pressure change in the mixing zone not being obvious at a larger seeding angle. The results suggested that when the seeding angle selected was 60°, the velocity change in the mixing zone was obvious, and the seed-blowing ability was strong with the relatively uniform airflow field.

4.2. Effect of Seed Insertion Angle on Seed Movement in Tube

The influence of five different seed insertion angles on the force and speed of seeds was shown in the Table 2. The results showed that the velocity of seeds in the tube was mainly composed of x-axis and y-axis velocity, and mainly moved along the x-axis. When the seed angle was 60°, the seed velocity, angular velocity, and x-axis velocity were higher than the other four kinds of seed angle structures. When the seed insertion angle was 30°, 45°, 60°, or 75°, the force difference of seed was small. Compared with the angle of 90°, the force on the seeds was larger, which was mainly because most of the seeds collided with the wall of the mixing zone. At the seed entry angles of 30°, 45°, and 60°, the number of collisions n between seeds in the mixing zone and the tube wall was small. However, at the seed entry angles of 75° and 90°, the collisions between seeds and the tube wall would cause sudden changes in seed speed and disordered movement. This was mainly because the speed of seeds increased in the y-axis from the feeding tube into the mixing zone at a larger entry angle.
The motion state of the mixed seeds of oats and vetch in the venturi tube with five different seed insertion angles at the air inlet velocity of 25 m/s is shown in Figure 7. Under the action of gravity and friction with the tube wall, the mixed seeds slowly slid from the seed inlet to the venturi tube along the tube and were transported forward along the y-axis direction under the action of airflow. With the increase in seed angle, the friction between the seed and the pipe wall decreased, and the distance before the seed contacts the pipe wall was shorter. A smaller seed entry angle could lead to a larger horizontal velocity vx and a smaller vertical velocity vy of the seeds entering the mixing zone. Most seeds were blown out under the action of airflow and gravity, but there was a great disparity in the velocity change—that is, the spacing between seeds was large, and there was a discontinuity. When the seed entry angle was large, the horizontal velocity v x of seeds entering the mixing zone was small, and the vertical velocity v y was large. Some seeds were stuck in the mixing zone and the transition zone after collision with the tube wall and could not be transported forward. In addition, the seeds blown into the conveying zone also slid along the tube wall, affecting the subsequent seed delivery. Considering that the suitable seed entry angle was 60°, at this time, the speed change of the seeds was consistent, there was no significant difference, and there was no seed retention phenomenon. Under this condition, the seeds could be continuously and evenly blown into the conveying area.

4.3. Influence of Inlet Air Velocity on Airflow Field

The airflow speed was set at 5 levels, namely 30 m/s, 35 m/s, 40 m/s, 45 m/s, and 50 m/s. It could be seen from Figure 8 that the change law in the airflow field in the venturi with different inlet air velocities was basically the same, and the change in the velocity gradient was the same. From the air inlet to the mixing zone, the air velocity first increased and then decreased along the x-axis. From the transition area to the conveying area, the airflow velocity slightly increased along the x-axis direction and then slowly decreased.

4.4. Effect of Inlet Air Velocity on Seed Movement in Tube

The influence of different inlet air velocities on the movement characteristics of seeds in the tube is shown in Table 3. The movement velocity and resultant force of seeds increased with the increase in inlet air velocity, indicating that the increase in inlet air velocity led to the increase in drag force of airflow on seeds. With the increase in inlet air velocity, the velocity of seeds in the x-axis direction increased significantly, while the velocity in the y-axis direction increased slightly and steadily. With the increase in inlet gas flow velocity, the angular velocity of seeds in the tube increased first and then decreased. This was because the seeds rotated in the process of gas–solid two-phase flow in the tube, which was caused by the non-centripetal collision between seeds and the velocity gradient in the gas flow field. However, the seed speed varied greatly under a higher air velocity, resulting in the wide and uneven seed spacing. This suggested that the angular velocity of seeds would significantly decrease at the seeds speed more than 40 m/s.
The motion state of the mixed seeds of oats and vetch in the venturi tube at five different inlet air velocities is shown in Figure 9. With the increase in the inlet air velocity, the position where the mixed seeds collide with the wall was closer to the outlet pipe. When the inlet air velocity was lower than 30 m/s, the seeds collided with the pipe wall in the mixing zone. When the inlet air velocity was higher than 30 m/s, the seeds collided with the pipe wall in the conveying area. This was because the inlet air velocity was low, and thus the drag force generated by the airflow on the seeds was small, and the seeds collided with the pipe wall in the mixing zone under the combined force of their own gravity and buoyancy. The distance between the mixed seeds also increased with the increase in inlet gas velocity. When the inlet air velocity was 45 m/s and 50 m/s, some seeds were too small and some were too large, resulting in discontinuous and uneven seed movement. When the inlet air velocity was 35 m/s and 40 m/s, the seeds continuously and uniformly entered the mixing area from the seed inlet and moved forward along the x-axis direction in the conveying area. In addition, when the inlet air velocity was 35 m/s and 40 m/s, the proportion of oat and vetch seeds transported to the outlet pipe was relatively uniform, which met the requirements of mixed sowing of two kinds of seeds with a mass ratio of 1:1. Therefore, when the inlet air velocity was 35~40 m /s, oat and vetch seeds could continuously and evenly enter the venturi mixing area and conveying area with a mass ratio of 1:1 and blow out in order.

4.5. Test Verification

In order to verify the effectiveness and feasibility of the simulation test, the pneumatic seed delivery device was processed based on the simulation results and validated by bench tests, as shown in the Figure 10. During the experiment, 0.075 kg of oat seeds and vetch seeds were each placed in the seed box. Then, the fan and motor were started, and the inlet speed of the airflow was controlled to 35 m/s for seed metering. The seeds discharged within 5~10 s after the start of the test were collected, and the mass ratio of oat seeds and vetch seeds discharged was calculated. The mass ratio of oat and vetch seeds discharged by the pneumatic seed delivery device was measured to be 0.96. The results showed that the structure and operating parameters obtained by simulation could ensure uniform and stable discharge of oat seeds and vetch seeds. The feasibility and effectiveness of analyzing the seed supply and delivery process of mixed seeds in the venturi tube based on the DEM-Fluent coupled simulation method were verified.

5. Conclusions

In this study, the EDM-Fluent coupling method was used to simulate the effects of seed entry angle and inlet air velocity on the movement characteristics of mixed oat and vetch seeds in the air-blowing venturi tube, and the movement law of mixed seeds in the tube was well described. The following conclusions were obtained:
(1)
The flow characteristics of gas–solid two-phase flow in the venturi tube and the force acting on the mixed seeds were analyzed. The mixed seeds of oat and vetch slowly entered the mixing zone from the seed tube to form gas–solid two-phase flow. Due to the large air velocity in the mixing zone, the seeds accelerated in the mixing zone to the transition zone and the transport zone under the drag force of the airflow. In the tube, there was a relative movement between the airflow and the seed, and the airflow speed was greater than the seed movement speed. It is shown that the drag force generated by the airflow on the seed promotes the seed movement.
(2)
Different seeding angles have great influence on the variation of airflow field in the tube and the motion characteristics of mixed seeds. With the increase in seeding angle, the air velocity in the mixing zone first increases and then decreases, and the change in velocity gradient along the x-axis direction is prolonged. The increase in seed entry angle leads to the reduction in friction between the seeds and the pipe wall. The shorter the distance before the seeds contact the pipe wall, the more seeds will be blown forward. After the seeds collide with the pipe wall, some seeds will remain in the mixing zone and transition zone and cannot be transported forward. When the angle of entry and exit is 60°, the pressure and velocity of the airflow field change obviously and the range is reasonable, the airflow field is relatively uniform, the speed change of the seeds is consistent, there is no seed retention phenomenon, and the seeds are continuously and evenly blown out.
(3)
The inlet air velocity has a significant influence on the air velocity in the tube, the moving velocity of the mixed seeds, and the force acting on the mixed seeds. The greater the inlet air velocity is, the greater the air velocity in the pipe is, while the pressure and velocity of the airflow field are basically the same. With the increase in inlet air velocity, the resultant force on the seeds and the movement speed of the seeds are larger, the collision position between the mixed seeds and the wall is closer to the outlet pipe, and the spacing between the seeds is larger. When the inlet air velocity is too high, the speed of the seeds varies greatly, and the spacing between some seeds is too large or too small, resulting in discontinuous and uneven seed movement. The appropriate air velocity is 35~40 m/s, and the mixed seeds of oat and vetch can continuously and uniformly enter the venturi mixing area and conveying area with a mass ratio of 1:1 and be blow out in order.

Author Contributions

Methodology, Y.L. and Y.Y.; software, Y.L. and X.Z.; validation, Y.L., Y.Y. and Y.H.; data curation, Y.L.; writing—original draft preparation, Y.L.; writing—review and editing, Y.Y. and D.W. All authors have read and agreed to the published version of the manuscript.

Funding

This work was supported by the earmarked fund for National Key R&D Program of China (2022YFD2001903) and China Agriculture Research System (CARS-34). The authors wish to thank the useful comments of the anonymous reviewers of this paper.

Data Availability Statement

Data will be made available on request.

Acknowledgments

This work was supported by the earmarked fund for National Key R&D Program of China (2022YFD2001903) and China Agriculture Research System (CARS-34). The authors wish to thank the useful comments of the anonymous reviewers of this paper.

Conflicts of Interest

We declare that we do not have any commercial or associative interest that represents a conflict of interest in connection with the work submitted.

References

  1. Zhao, C.Z.; Zhang, J.; Sheng, Y.P. The niche of annual mixed-seeding meadow in response to density in alpine region of the Qilian Mountain, China. Shengtai Xuebao Acta Ecol. Sin. 2013, 33, 5266–5273. [Google Scholar] [CrossRef] [Green Version]
  2. Sturlu Dottir, E.; Brophy, C.; Belanger, G.; Gustavsson, A.M.; Jorgensen, M.; Lunnan, T.; Helgadottir, A. Benefits of mixing grasses and legumes for herbage yield and nutritive value in Northern Europe and Canada. Grass Forage Sci. J. Br. Grassl. Soc. 2014, 69, 22940. [Google Scholar] [CrossRef] [Green Version]
  3. Lu, Y.X.; Mu, L.; Yang, H.M. Research progress of mixed planting of leguminous and gramineous forages to improve soil. Trans. Chin. J. Grassl. 2019, 41, 94–100. [Google Scholar]
  4. Zhu, Y.Q.; Yu, H.; Zheng, W.; Li, S.S.; Naerkezi; Liu, Y.H.; Hao, S.; Ailifeire. Effects of different planting configurations on yield of Avena sativa and Vicia sativa mixed plantings with soybean in alpine pastures. Acta Prataculturae Sin. 2020, 29, 74–85. [Google Scholar]
  5. Qi, Y.S.; Zhu, L.; Xu, X. Mixed Sowing Combination of Grass, Bean and Forage in Ningxia Oasis and Its Proportional Effect. Trans. Grass Ind. Sci. 2015, 32, 1463–1472. [Google Scholar]
  6. Yang, L.; Yan, B.X.; Cui, T.; Yu, Y.M.; He, X.T.; Liu, Q.W.; Liang, Z.J.; Yin, X.W.; Zhang, D.X. Global overview of research progress and development of precision maize planters. Int. J. Agric. Biol. Eng. 2016, 9, 9–26. [Google Scholar] [CrossRef]
  7. Yin, W.Q.; Zhao, L.; Li, H.; Hu, F.; Yu, H.M. Design and experiment on suction nozzle type hole of pneumatic-sheave combined vegetable precision metering device. Trans. Chin. Soc. Agric. Mach. 2019, 50, 68–76. [Google Scholar] [CrossRef]
  8. Li, Y.J.; Liu, R.; Liu, C.X.; Liu, L.J. Test of seed velocity of seed tube based on EDEM-Fluent coupling. Trans. Chin. Soc. Agric. Mach. 2021, 52, 54–61. [Google Scholar]
  9. Ji, Y.; Liu, S.; Li, J. Experimental and numerical studies on dense-phase pneumatic conveying of spraying material in venturi. Powder Technol. 2018, 339, 419–433. [Google Scholar] [CrossRef]
  10. Gao, X.J.; Xu, Y.; Yang, L.; Zhang, D.X.; Li, Y.H.; Cui, T. Simulation and experiment of uniformity of venturi feeding tube based on DEM-CFD coupling. Trans. Chin. Soc. Agric. Mach. 2018, 49, 92–100. [Google Scholar]
  11. Yang, Q.L.; Li, Z.H.; Li, H.W.; He, J.; Wang, Q.J.; Lu, C.Y. Numerical analysis of particle motion in pneumatic centralized fertilizer distribution device based on CFD-DEM. Trans. Chin. Soc. Agric. Mach. 2019, 50, 81–89. [Google Scholar] [CrossRef]
  12. Mori, Y.; Sakai, M. Development of a robust Eulerian—Lagrangian model for the simulation of an industrial solid–fluid system. Chem. Eng. J. 2021, 406, 126841. [Google Scholar] [CrossRef]
  13. Patro, P.; Dash, S.K. Two-fluid modeling of turbulent particle–gas suspensions in vertical pipes. Powder Technol. 2014, 264, 320–331. [Google Scholar] [CrossRef]
  14. Lei, X.L.; Liao, Y.T.; Liao, Q.X. Simulation of seed motion in seed feeding device with DEM-CFD coupling approach for rapeseed and wheat. Comput. Electron. Agric. 2016, 131, 29–39. [Google Scholar] [CrossRef]
  15. Guzman, L.; Chen, Y.; Landry, H. Coupled CFD-DEM Simulation of Seed Flow in an Air Seeder Distributor Tube. Processes 2020, 8, 1597. [Google Scholar] [CrossRef]
  16. Wang, Y.; Li, H.; Hu, H.; He, J.; Wang, Q.; Lu, C.; Liu, P.; He, D.; Lin, X. DEM—CFD coupling simulation and optimization of a self-suction wheat shooting device. Powder Technol. 2021, 393, 494–509. [Google Scholar] [CrossRef]
  17. Han, D.D.; Zhang, D.X.; Jing, H.R.; Yang, L.; Cui, T.; Ding, Y.Q.; Wang, Z.D.; Wang, Y.X.; Zhang, T.L. DEM-CFD coupling simulation and optimization of an inside-filling air-blowing maize precision seed-metering device. Comput. Electron. Agric. 2018, 150, 426–438. [Google Scholar] [CrossRef]
  18. Hu, H.; Zhou, Z.; Wu, W.; Yang, W.; Li, T.; Chang, C.; Ren, W.; Lei, X. Distribution characteristics and parameter optimisation of an air-assisted centralised seed-metering device for rapeseed using a CFD-DEM coupled simulation. Biosyst. Eng. 2021, 208, 246–259. [Google Scholar] [CrossRef]
  19. Gao, X.; Zhou, Z.; Xu, Y.; Yu, Y.; Su, Y.; Cui, T. Numerical simulation of particle motion characteristics in quantitative seed feeding system. Powder Technol. 2020, 367, 643–658. [Google Scholar] [CrossRef]
  20. Lei, X.; Liao, Y.; Zhang, Q.; Wang, L.; Liao, Q. Numerical simulation of seed motion characteristics of distribution head for rapeseed and wheat. Comput. Electron. Agric. 2018, 150, 98–109. [Google Scholar] [CrossRef]
  21. Kruggel-Emden, H.; Oschmann, T. Numerical study of rope formation and dispersion of non-spherical particles during pneumatic conveying in a pipe bend. Powder Technol. 2014, 268, 219–236. [Google Scholar] [CrossRef]
  22. Fengwei, G.; Youqun, Z.; Feng, W.; Zhichao, H.; Lili, S. Simulation analysis and experimental validation of conveying device in uniform rrushed straw throwing and seed-sowing Machines using CFD-DEM coupled approach. Comput. Electron. Agric. 2022, 193, 106720. [Google Scholar] [CrossRef]
  23. Xu, J.; Liu, X.; Pang, M. Numerical and experimental studies on transport properties of powder ejector based on double venturi effect. Vacuum 2016, 134, 92–98. [Google Scholar] [CrossRef]
  24. Chang, J.L.; Zhang, X.H. Design and test of one-step centralized type pneumatic seeding system. Trans. CSAE 2011, 27, 136–141. [Google Scholar]
  25. Sommerfeld, M. Analysis of collision effects for turbulent gas-particle flow in a horizontal channel: Part I. Particle transport. Int. J. Multiph. Flow 2003, 29, 675–699. [Google Scholar] [CrossRef]
  26. Liao, Y.Y.; You, Y.; Wang, D.C.; Zhang, X.N.; Zhang, H.F.; Ma, W.P. Parameter Calibration and Experiment of Discrete Element Model for Mixed Seeds of Oat and Arrow Pea. Trans. Chin. Soc. Agric. Mach. 2022, 53, 14–22. [Google Scholar]
Figure 1. Air-blowing seed meter. (1. Air inlet pipe; 2. Fan component; 3. Mixed seed box; 4. Stepper motor; 5. Conical distributor; 6. Corrugated booster pipe; 7. Seed-feeding pipe; 8. Seed-feeding elbow; 9. Venturi tube).
Processes 11 01095 g001
Figure 2. Schematic diagram of the structure of the venturi tube. (1. Transition area; 2. Mixing area; 3. Air inlet area; 4. Seed-feeding area; 5. Conveying area).
Processes 11 01095 g002
Figure 3. Discrete element model of seeds. (a) Vetch seeds model; (b) Oat seed model.
Processes 11 01095 g003
Figure 4. Velocity nephogram with different grid numbers. (a) Velocity nephogram with 8285 grids; (b) Velocity nephogram with 16,476 grids; (c) Velocity nephogram with 28,886 grids.
Processes 11 01095 g004
Figure 5. Boundary conditions and mesh division of the venturi seed supply pipe.
Processes 11 01095 g005
Figure 6. Variation of airflow field in different seed-feeding angle tubes: (a) 30°; (b). 45°; (c) 60°; (d) 75°; (e) 90°.
Processes 11 01095 g006aProcesses 11 01095 g006b
Figure 7. Five motion states in venturi tube with different implantation angles: (a) 30° (b) 45°; (c) 60° (d) 75°; (e) 90°.
Processes 11 01095 g007
Figure 8. Variation of airflow field in venturi tube with different inlet air velocity: (a) 30 m/s; (b) 35 m/s; (c) 40 m/s; (d) 45 m/s; (e) 50 m/s.
Processes 11 01095 g008aProcesses 11 01095 g008b
Figure 9. Five motion states in venturi tube under different inlet gas velocities: (a) 30 m/s.; (b) 35 m/s; (c) 40 m/s; (d) 45 m/s; (e) 50 m/s.
Processes 11 01095 g009
Figure 10. Test bench (1. Rack; 2. Venturi tube; 3. Mixed seed box; 4. Stepper motor; 5. Governor; 6. Fan).
Processes 11 01095 g010
Table 1. Computational parameters used in the simulations.
MaterialParametersValue
ABS plasticPoisson’s ratio0.34
Shear modulus (Pa)3 × 10⁹
Density (kg·m−3)1250
Oat seedsGeometric dimension (mm × mm × mm)10.977 × 3.253 × 2.437
Poisson’s ratio0.40
Shear modulus (Pa)1.1 × 10⁸
Density (kg·m−3)802
Collision recovery coefficient with ABS plastic0.441
Static friction coefficient with ABS plastic0.506
Rolling friction coefficient with ABS plastic0.059
Vetch seedsGeometric dimension (mm × mm × mm)5.506 × 4.794 × 3.594
Poisson’s ratio0.25
Shear modulus (Pa)2.7 × 10⁸
Density (kg·m−3)1076.5
Collision recovery coefficient with ABS plastic0.435
Static friction coefficient with ABS plastic0.454
Rolling friction coefficient with ABS plastic0.047
Mixed seedsInterspecific collision recovery coefficient0.320
Interspecific static friction coefficient0.327
Interspecies rolling friction coefficient0.042
Table 2. Effect of seed insertion angle on force and speed of seeds.
Feeding Tube Angle (°)v v x v y ω ω z FThe Number of Collisions n
300.550.450.1654.5027.341.43 × 10−35
450.830.670.2573.9341.891.62 × 10−33
600.920.700.3082.0049.831.54 × 10−36
750.880.600.3173.6648.971.58 × 10−329
900.600.330.2943.6624.162.11 × 10−359
Table 3. Effects of different inlet air velocities on the motion characteristics of seeds in tubes.
Air Velocity (m/s)V (m/s) v x (m/s) v y (m/s) ω (rad/s) ω z (rad/s) F (N)
301.261.060.35101.2153.531.68 × 10−3
351.431.250.37107.8271.461.84 × 10−3
401.551.340.39100.6168.571.97 × 10−3
451.641.400.4193.8462.812.15 × 10−3
501.721.470.4386.8451.602.45 × 10−3
Disclaimer/Publisher’s Note: The statements, opinions and data contained in all publications are solely those of the individual author(s) and contributor(s) and not of MDPI and/or the editor(s). MDPI and/or the editor(s) disclaim responsibility for any injury to people or property resulting from any ideas, methods, instructions or products referred to in the content.

