Abstract
(1) Background: Photodynamic therapy (PDT) involves the selective killing of tumor cells by the generation of reactive oxygen species using a photosensitizer (PS) activated by irradiation. In melanoma, PDT efficiency is altered by several mechanisms, such as the presence of melanin and melanosomes and pro-survival pathways mediated by transcription factors such as: AP-1 (activator protein), MITF (microphthalmia inducible transcription factor), HIF1α (hypoxia inducible factor), and NF-kB (nuclear factor kappa B). The study aimed to investigate the anti-melanoma effects of PDT mediated by meso-5,10,15,20-tetrakis-(4-hydroxyphenyl)-porphyrin (THPP) as a photosensitizer. (2) Methods: Cocultures of melanoma, two human, WM35 and M1–15, and murine B16-F10, with endothelial cells, were used. Cytotoxicity, oxidative damage, angiogenesis markers, and melanogenesis were assessed using colorimetry, flowcytometry, confocal microscopy, spectrophotometry, ELISA, and Western blotting. (3) Results: The maximal killing efficiency of PDT was reached in WM35, followed by M1–15, and then B16-F10, and it occurred through both apoptosis and necrosis. Although constitutive pigmentation diminished the PDT efficiency, de novo melanogenesis exhibited no protection. PDT increased TNFα, and inhibited NFkB, MITF, HIF1α, and AP1, leading to inflammation and angiogenesis markers’ inhibition. (4) Conclusions: THPP-mediated PDT efficiently induced cell death through apoptosis, necrosis, and the inhibition of pro-survival pathways mediated by NFkB, AP1, HIF1α, and MITF in the melanoma coculture models.
1. Introduction
Photodynamic therapy (PDT) is a minimally invasive technique and involves the selective killing of target cells based on the energy of light of specific wavelengths which activate photosensitizing agents (PS). PS accumulate in targeted tissues and, upon light activation, release different free species of oxygen (ROS), leading to their destruction, with minimum collateral damage [1,2]. The ability of PDT to selectively destroy the target tissue has facilitated its use against a variety of cancers, such as non-melanoma skin cancers, cancers of esophagus and lung, but also against infectious diseases or immune-related diseases [1].
Melanoma causes 79% of skin cancer-related deaths due to its aggressiveness and resistance to therapy [3,4]. Despite the recent immunotherapy advances in metastatic melanoma, prognosis remains very poor. Some reports have shown the beneficial effects of PDT in small clinical trials against choroidal melanoma, or in metastatic melanomas, which indicate that PDT might be an adjuvant therapy in advanced cases [2]. In experimental settings, PDT induced direct tumor destruction, anti-angiogenesis effects, and the activation of an antitumor immune response. Additionally, PDT has minor side effects and may be combined with other anti-melanoma therapies such as immunotherapy or chemotherapy [2]. Despite all of these achievements, the efficacy of PDT in melanoma is limited and its underlining mechanisms still need to be proven. This is mainly due to the activation of the pro-survival mechanisms upon PDT exposure. An important role is attributed to melanin pigment (especially in hyperpigmented melanomas). Melanin acts as a physical shield against PDT irradiation and also as a free radical scavenger. Melanosomes protect the cytosol and mitochondria against PS accumulation and the subsequent generation of oxidative stress. Melanomas also show defects in the apoptotic pathways [5], a high ability for immune evasion and the stimulation of vascular neoformation, which renders them more resilient against the proapoptotic effect of ROS generated by PDT.
In PDT, there are several survival pathways mediated by transcription factors such as AP-1 (activator protein 1), HIF1α (hypoxia inducible factor 1 alpha), NF-kB (nuclear factor kappa B), and NRF2 (erythroid nuclear factor related factor 2) that induce the proteotoxic stress response and which are also activated by ROS and help cells survive in the case of non-lethal PDT. Cancer cells, which are able to activate these pathways, become resistant to therapy and can also change the tumor micro-environment, leading to tumor survival to therapy [6,7]. Therefore, the results of PDT mainly depend on the nature of the PS and its ability to generate enough ROS to overcome the defense mechanisms of melanoma cells. Previously, we reported the PDT anti-melanoma effects using meso-5,10,15,20-tetrakis-(4-hydroxyphenyl)-porphyrin (THPP) as a photosensitizer against a lightly pigmented melanoma cell line, such as DNA damage, cell death, and enhanced melanin production [8].
The current study aims to investigate the effects of THPP-mediated PDT on melanoma models in vitro, consisting of three different co-cultures of melanoma lines of human origin, WM35, M1-15, and murine -B16-F10, with human umbilical vein endothelial cells (HUVEC) on cell death, angiogenesis, and the ability of the melanoma cells to survive the phototoxic effects of the therapy.
2. Materials and Methods
2.1. Synthesis and Characterization of Meso-5,10,15,20-tetrakis-(4-hydroxyphenyl)-porphyrin (THPP)
The compound THPP was obtained from the freebase porphyrin H2TMPP using the Lindsey method [9], followed by column chromatography purification on silica gel (100–200 mesh) using chloroform followed by 25% methanol in chloroform as an eluent as previously reported (Figure S1) [10].
2.2. Octanol Water Partition Coefficient of THPP
Lipophilic and hydrophilic properties are determined by the partition coefficient Po/w = Co/Cw of each compound present in the studied system by using two immiscible solvents, n-octanol (o) and water (w) [11]. A total of 20 mM of sensitizer were mixed with 5 mL of octanol and 5 mL of water. The tubes were vortexed for 1 min at a high speed, placed in a shaker for 4 h at RT, then centrifuged for 10 min to separate octanol and water phases. After separation, the partition coefficient P was determined.
2.3. Partition Coefficient Measurements
The apparent partition coefficients at pH 7.4 were determined by introducing 1 mM of THPP in DMF into an n-octanol/phosphate buffer (0.66. mM, pH 7.4) mixture. The 1-octanol–water partition coefficient (P) was determined at 25 °C by means of equal volumes of preequilibrated water (milliQ, 3 mL) and 1-octanol (3 mL). The two phases were previously mutually saturated. The combined phases were then shaken by vortexing for 1 min, centrifuged for 20 min at 4000 rpm. to separate the layers, and each phase was analyzed by spectrophotometry. The aqueous solution of the porphyrin (40 μM) was stirred for 8 h in the thermostat in the presence of octanol, then an aliquot (200 μL) of both aqueous and organic phases were diluted with DMF up to 2 mL and the porphyrin final concentration was determined using absorption spectroscopy [12,13].
2.4. Singlet Oxygen Quantum Yields
The singlet oxygen quantum yields, to estimate the photosensitizer efficiency of THPP, were measured using 1,3-diphenylisobenzofuran as the scavenger [13]. A solution of sensitizer and the 1,3-diphenylisobenzofuran singlet oxygen acceptor was irradiated with light at 652 nm, and the rate of consumption of 1,3-diphenylisobenzofuran was followed spectrophotometrically by observing the decrease in an absorption band at 410 nm as a function of the irradiation time. A total of 2.5 mL of methanol was added to an adequate amount of sensitizer (THPP) to obtain an optical density of 1.00 at its Soret band. An aliquot of freshly prepared 1,3-diphenylisobenzofuran (25 mL) was added to obtain an optical density of approx.1.00 at 410 nm. ΦΔ std is the singlet oxygen quantum yield of the standard sample (in our case, TPP (5,10,15,20-tetraphenyl-porphyrin) dissolved in DMF, ΦΔ std = 0.66) [14,15,16,17]
Prior to the in vitro use of THPP, the substance was solved in DMSO (Sigma Chemical Co. St. Louis, MO, USA) to obtain a stock solution of 10 mg/mL. Dilutions of this solution in fresh medium were made immediately before use. The DMSO final concentration in the medium was <0.01%, which is not harmful to the cells [10].
2.5. Bioassays
2.5.1. Cell Cultures
The assessment was performed on radial growth phase, lightly pigmented -WM35 human melanoma (Wistar Institute, Philadelphia, PA, USA), a human Caucasian, pigmented metastatic melanoma cell line M1-15 donated by professor Andras Falus, Genetics Department, University Semmelweis, Budapest [18], and a metastatic murine melanoma cell line, highly pigmented B16-F10 (ECCACC, Sigma Aldrich, Steinheim am Albuch, Germany), and, respectively, human umbilical vein endothelial cells, HUVEC (ECCACC). The cells were cultured in RPMI medium supplemented with 5% fetal calf serum, 50 μg/mL of gentamicin, and 5 ng/mL of amphotericin, all from Biochrom AG (Berlin, Germany), to avoid the medium influence on the cells’ properties. The cultures were fed twice weekly. Experiments were conducted on the co-cultures of HUVECs and each melanoma cell line. First, HUVECs were seeded for 1 h, then the melanoma cells (WM35, M1-15 and B16-F10) were seeded and further settled for 48 h. Then, the co-cultures were treated according to each of the protocol specifications. All experiments were conducted in subdued light in triplicate.
2.5.2. Light Source
PDT irradiation was done by a red-light lamp obtained from OSRAM Opto Semiconductors Osram Premstaetten, Austria made of LEDs (OSRAM OSLON® Square Hyper Red, 660 nm, GH CSSRM3.24-V4V5-1-1-L, with OptotronicR OTe 13/220-240/350 stabilized constant current power supply 1–13W (Osram, Premstaetten, Austria). The lamp characteristics are the wavelength of 660 nm and lamp power of 11.83 mW/cm2, measured at a distance of 5 cm from the lamp [19]. The irradiation dose used was 100 mJ/cm2. The lamp emission spectrum is presented in the Supplemental Materials, Figure S2.
2.5.3. Cytotoxicity assay
The co-cultures were directly established in ELISA 96-well micro titration flat bottom plaques (TPP, Trasadingen, Switzerland) at a final density of 103/well. The cells were treated for 24 h with different THPP concentrations (1–100 μg/mL), respectively, (1.47–147.32 μM) in the medium, then washed and treated with w/w. irradiation (100 mJ/cm2), and further incubated for 24 h with fresh medium. The cytotoxicity was evaluated using a CellTiter 96® AQueous Non-Radioactive Cell Proliferation Assay using 3-(4,5-dimethylthiazol-2-yl)-5-(3-carboxymethoxyphenyl)-2-(4-sulfophenyl)-2H-tetrazolium (MTS assay-Promega Corporation, Madison, USA), as indicated by the producer. Readings were done using an ELISA plate reader at 540 nm (Tecan, Männedorf, Switzerland). Untreated cultures exposed to a medium were used as the controls. Cytotoxicity is presented as a % of the untreated controls; toxicity limit was considered 70%.
2.5.4. Experimental Design
Co-cultures of melanoma (WM35, M1-15 and B16-F10) with HUVECs, seeded in Petri dishes at a density of 104/cm2, were exposed to THPP (15 μg/mL) for 24 h, then irradiated with 100 mJ/cm2. Following irradiation, the cells were washed, further incubated for 24 h with fresh medium, and afterwards, tested for cell death induction and oxidative stress-induced damage and alterations such as inflammation, angiogenesis, melanogenesis, AP1 trafficking, and autophagy. Untreated co-cultures were used as the controls.
2.5.5. Confocal Microscopy
Before co-culturing, HUVECs were labeled with PKH 26 red fluorescent dye (PKH26 fluorescent linker kit—Sigma Aldrich), according to the manufacturer’s specifications. Afterwards, co-cultures were established on chamber slides (Nalgene, Rochester, NY, USA) at a density of 5 × 10³/cm2 for 48 h. Following PDT, the cells were fixed in 2% paraformaldehyde. A total of 50 μg/mL of phalloidin-FITC staining (Sigma Chemical Co., St. Louis, MO, USA) was used as a marker for the actin myofilaments (green) to assess cytoskeleton morphology. Images were recorded using a 63× oil immersion apochromat Zeiss objective (Zeiss LSM 710 Confocal Laser Scanning unit, Carl Zeiss AG, Oberkochen, Germany) with a phalloidin-FITC excitation/emission of 490/525 nm, and a 630/680 nm excitation/emission for PKH26. Image combining, processing, and analysis were performed using the standard ZEN software package (Carl Zeiss Microimaging GmbH, Oberkochen, Germany) [19].
2.5.6. Flowcytometry
Cells (treated as above) were stained with annexin V-fluorescein isothiocyanate (FITC)/vital dye propidium iodide (PI) (BD Pharmingen Biosciences, San Jose, CA, USA). Viable cells were annexin V (−)/PI (−), early apoptotic cells were identified as annexin V-FITC (+), while necrotic cells were PI (+); late apoptosis was shown by annexin V (+)/PI (+). Differentiation among these cell populations was detected by flow cytometric detection using a BD FACS Canto II flow cytometer (Becton Dickinson and Company, Franklin Lakes, NJ, USA) equipped with two lasers as excitation sources: blue (488 nm, air cooled, 20 mW solid state) and red (633 nm, 17 mW HeNe) and BD FACSDiva Software V. 6.1.3, (Becton Dickinson) [19].
2.5.7. Mitochondrial Membrane Potential
The mitochondrial membrane potential (MMP) was measured to assess mitochondrial-induced apoptosis using the Mito-ID Membrane Potential Detection Kit (Enzo Life Sciences, Inc., Farmingdale, NY, USA), according to the manufacturer’s instructions (fluorescence emission = 540 nm/excitation = 570 nm). Data are presented as OD 570 nm.
2.5.8. Cell Lysis
The cell lysates were prepared as described [19]. Protein concentrations were determined using the Bradford method (Biorad, Hercules, CA, USA) and using bovine serum albumin as standard. For all assays, the lysates were corrected by the total protein concentration.
2.5.9. Spectrophotometry and Fluorometry
The quantification of malondialdehyde (MDA), a marker for the peroxidation of membrane lipids induced by oxidative damage and nitric oxide (NO) formation, was conducted using spectrophotometry. Data were expressed as the nM/mg protein [19]. To assess melanogenesis, the total melanin content (mg/mL) and the enzymatic activity of tyrosinase EC:1.14.18.1, as DOPA oxidase, were determined through spectrophotometry [20]. Data are presented as (Units/mg protein). All reactives were purchased from Sigma. An Amplex™ Red Hydrogen Peroxide/Peroxidase Assay Kit (Invitrogen, Fisher Thermoscientific, Waltham, MA, USA) was used to measure the production of H2O2 (μM), according to manufacturer’s instructions. Readings were done using fluorometry, excitation 571 nm/emission 585 nm, at intervals of 0 h, 1 h, 2 h, 3 h, 4 h, 5 h, 6 h, and 24 h.
2.5.10. ELISA
Caspase 3, SOD 1(superoxide dismutase 1), TRAIL (TNF-related apoptosis-inducing ligand), VEGF (vascular endothelial growth factor) and soluble TNFα (tumor necrosis factor α), sICAM1 (soluble intercellular adhesion molecule-1), and ELISA immunoassay kits from R&D Systems, Inc. (Minneapolis, MN, USA) were used according to the manufacturer’s instructions; readings were taken at 450 nm with a correction wavelength at 540 nm, using an ELISA plate reader (Tecan).
2.5.11. Western Blot
Lysates (20 μg protein/lane) were separated by electrophoresis on SDS PAGE gels (BioRad) and transferred to polyvinylidene difluoride membranes (BioRad), using the Biorad Miniprotean system. Blots were blocked and then incubated with antibodies against NFkB, phospho- pNFkB p65 (Ser536) (93H1) (pNFkB), LC3B (microtubule-associated protein–light chain 3 beta MAP-LC3β) (Cell Signaling Technology, Inc., Danvers, MA, USA), HIF1α, tyrosinase, MITF (microphthalmia transcription factor), and Beclin 1 from Santa Cruz Biotechnology, Delaware Ave, Santa Cruz, CA, USA then further washed and incubated with corresponding secondary peroxidase-linked antibodies (Santa Cruz Biotechnology). For each co-culture, gels were run in parallel in identical conditions. Proteins were detected using a Supersignal West Femto Chemiluminescent substrate (Thermo Fisher Scientific, Rockford, IL, USA) and a Gel Doc Imaging system equipped with a XRS camera and Quantity One analysis software (Biorad). GAPDH (Trevigen Biotechnology) was used as a protein loading control. The image analysis of WB bands was conducted by densitometry; the results were normalized to GAPDH [19].
2.5.12. Statistical Analysis
The statistical difference between the treated and control groups was evaluated using a two-way ANOVA (significant values are presented in the Results and Discussion section) and Student’s t-test, followed by Bonferroni post-test (significant values are shown on the graphs). All values in the text and figures are expressed as the mean ± standard deviation, n = 3; the results were considered significant for p < 0.05. The statistical package used for the data analysis was Prism version 4.00 for Windows, GraphPad Software, San Diego, CA, USA.
3. Results and Discussion
Due to their photosensitizer properties and especially singlet oxygen generation, porphyrins can be used as a starting point for the synthesis of improved photosensitizers [21] or photo diagnosis based on their fluorescence emission [22]. We tested THPP-mediated PDT efficacy in cell killing, antiangiogenic effects, and the inhibition of pro-survival mechanisms in three different co-cultures of melanomas with endothelial cells. The melanoma cell lines were chosen to allow a comparative testing of the efficiency of PDT against some of the known resistance mechanisms according to the melanoma stage, species of origin, and constitutive pigmentation: WM35—a radial growth phase lightly pigmented human melanoma, M1-15—a human Caucasian pigmented, metastatic melanoma, and B16-F10—a highly pigmented metastatic murine melanoma.
3.1. THPP Photosensitizer Properties
Octanol–Water Partition Coefficient and Singlet Oxygen Quantum Yields for THPP
THPP octanol–water partition coefficient was 1.287. The THPP singlet oxygen quantum yield measurements of the photosensitizer efficacy in methanol and in water were identical at 0.556. THPP exhibited a high lipophilicity, favoring PS entry through cell membranes and localization into the mitochondria, lysosomes, and melanosomes [10]. THPP also showed an increased photosensitizer efficiency, measured by the singlet oxygen quantum yield that allows the generation of high amounts of ROS, especially singlet oxygen by type II reactions upon red light exposure, and in the presence of oxygen, which can damage the cellular membranes by oxidative stress and induce antitumor effects [23].
3.2. Biological Assays
3.2.1. Cytotoxicity and Photo-Toxicity Assessment
THPP was well tolerated by WM35 up to 100 μg/mL (Figure 1a). For M1-15 and B16-F10, THPP exhibited a higher dark toxicity concentration at 50 μg/mL (Figure 1b,c). THPP-mediated PDT induced a dose-related cytotoxicity (Figure 1a–c and Figure S3). In HUVEC monoculture, the photosensitizer dose up to 50 μg/mL exhibited no cytotoxic effect in the dark. The THPP dose of 20 μg/mL showed significant phototoxic effects (Supplementary Table S1) for all cell co-cultures (p < 0.0001). IC50, for the melanoma co-cultures upon exposure to THPP and irradiation, was WM35 = 18.91 μg/mL, for M1-15 = 14.19 μg/mL, and for B16-F10 = 32.009 μg/mL. For the HUVEC monocultures, the IC50 in the same conditions was 58.26 μg/mL. Phototoxic indexes show the increased toxicity of PDT in a concentration-dependent manner, compared to THPP alone (Supplementary Table S1). Irradiation induced no viability decreases.
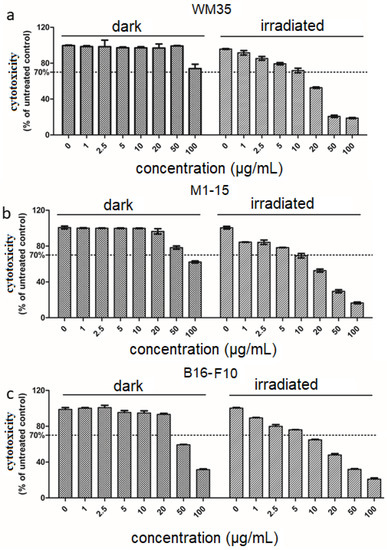
Figure 1.
Cytotoxicity assessment. Comparative cytotoxicity testing w/wo irradiation 100 mJ/cm2 of WM35 (a), M1-15 (b), and B16-F10 (c) co-cultures exposed to THPP (concentration range 2.5–100 μg/mL). Viability is expressed as % of untreated controls (mean ± SD, n = 3), toxicity limit is drawn at 70% of untreated control (right panels).
Overall, THPP exhibited no dark toxicity at phototoxic concentrations. Therefore, we studied comparatively the PDT effects by using the THPP concentration (15 μg/mL) for all co-cultures according to each cell type.
Previously, we found that the phototoxic THPP concentration in WM35 single melanoma culture was 5 μg/mL, with a similar cytotoxicity [10], which emphasizes the important role of the tumor stroma–endothelial cells as a defense mechanism. Although porphyrin absorbance has a lower peak at 660 nm [21], this is important for PDT since it avoids melanin absorbance, which is maximal around 335 nm. Others have used a higher PDT irradiation dose of 10 J/cm2 with blue light in the monolayer cultures of bladder cancer (5637), prostate cancer (LNCaP), and melanoma (A375), using PEG and metal-substituted porphyrins, and obtained a very weak response for melanoma cells [24]. In another study against melanoma, a blue light irradiation with an irradiation dose of 5 J/cm2, using as a photosensitizer a flavin mononucleotide, led to apoptosis in A375, Mel IL, and Mel Z cells [25].
Reporting all cytotoxicity readings to the untreated controls of each co-culture and HUVEC monoculture shows no significant effect of irradiation on the cells’ cytotoxicity in the absence of the photosensitizer. Therefore, the cytotoxic effect is not due to the proliferation of cells without irradiation compared to the irradiated ones, during the experiment, but rather due to the phototoxicity. Since data from the MTS are not enough to sustain the photo toxicity, we also quantified cell death by flowcytometry using annexin V/PI staining to assess the apoptosis/necrosis ratio.
3.2.2. Morphological Aspect and Cytoskeleton Alterations
Confocal microscopy images (Figure 2) present co-cultures with an orange/yellow color showing the co-localization of green, phalloidin-FITC, and red, PKH26, indicative of HUVECs, while melanoma cells are stained green. The controls show a normal myofilament network, with cell–cell interactions between HUVECs and melanoma cells visible in all groups. The PDT-induced cytoskeleton alterations of both melanoma and HUVECs, with severe actin filaments condensations, show a disrupted microtubule network, the retraction of dendrites, spherical-shaped cells, and the loss of cell adhesion, showing PDT efficacy against both tumor and vascular stroma cells.
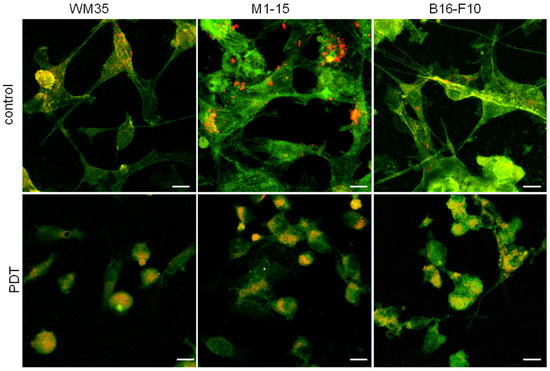
Figure 2.
Cytoskeleton morphology. Confocal microscopy images of WM35, M1-15, and B16-F10 cells co-cultured with HUVEC (PKH 26 positive) stained with phalloidin-FITC, control (upper panels), PDT-treated (THPP 15 μg/mL and irradiation 100 mJ/cm2—lower panels), original magnification 63×, bar = 20 μm.
3.2.3. Cell Death Mechanism
PDT-induced cell death in the human melanoma co-cultures occurred by increasing both apoptosis and necrosis (Figure 3). Furthermore, it decreased the mitochondrial potential and increased active caspase 3, the common pathway for apoptosis by the release of the apoptosome complex to initiate the cascade activation of caspases, leading to apoptotic death [2]. In WM35, PDT significantly induced cell death (43% of the total cell number) by early/late apoptosis and necrosis. In M1-15, PDT strongly increased early/late apoptosis and necrosis, and dead cells were found at 46% of the total cell number. Flowcytometric and photo-toxicity data are consistent with the PDT-induced increase in caspase 3 and decreased MMP compared to the controls. This is consistent with previous reports that showed that PDT induced apoptosis via the two major pathways: mitochondria-mediated or intrinsic pathway, and death receptor-mediated or extrinsic pathway [2].
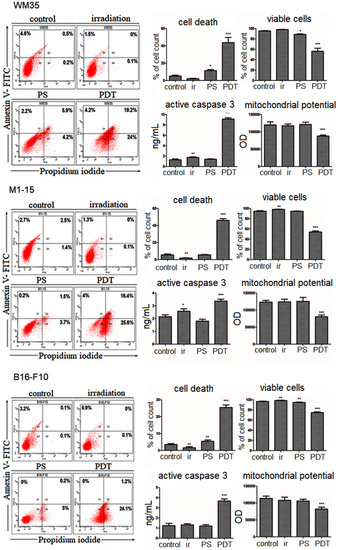
Figure 3.
Cell death induction. Comparative FACS analysis (left), quantitative FACS results (% of total cells counted)—viable cells annexin V (−)/PI (−)—Q3, early apoptotic cells annexin V(+)—Q1, necrotic cells PI (+)—Q4, late apoptosis annexin V (+)/PI (+)—Q2 quadrant, a minimum of 10,000 events were quantified for each lot. Active caspase 3 (ng/mL); mitochondrial potential (OD570 nm) (right) for WM35 (upper panel), M1-15 (middle panel), and B16-F10 (lower panel), * = p< 5.0 × 10⁻², ** = p < 1.0 × 10⁻², ***= p < 1.0 × 10⁻³, compared to controls. 1 = control, 2 = irradiated (100 mJ/cm2), 3 = THPP (15 μg/mL), 4 = PDT (THPP 15 μg/mL and irradiation 100 mJ/cm2) (left). Each bar represents mean ± standard deviation (n = 3).
In B16-F10 mouse-pigmented melanoma, the cell death mechanism was predominantly necrosis. This was reported in cases of high-dose PDT (either high PS or a high dose of light), or the PDT treatment of cells in cultures without confluence, using a cytotoxic light-dose exposure, or PS localization in the plasma membrane, leading to the rapid disruption of the membrane and the subsequent loss of ATP [26]. Membrane disintegration, even in the cases of necrotic cell death induced by PDT, also activates caspase 3, the final effector of the caspase’s pathway, leading to a subsequent mitochondrial destruction [21], which is consistent with our findings of increased caspase 3, and decreased MMP. For all cell lines, a two-way ANOVA showed a significant PDT effect on cell death induction, the caspase 3 level (p < 0.0001), and MMP decrease (p ≤ 0.0107).
3.2.4. Oxidative Stress Induction
Hydrogen peroxide. To quantify H2O2 production following PDT exposure, an Amplex red assay was chosen based on our previous experience [8,10] and data from the literature [27,28,29]. H2O2 production was measured starting immediately after PDT irradiation for a period of 24 h (Figure 4). PDT strongly increased H2O2 in human melanoma co-cultures, reaching its maximum in M1-15. The increase was less important in the mouse melanoma. The two-way ANOVA showed a significant PDT (p < 0.0001) and time (p < 0.0001) interaction with the H2O2 amount.
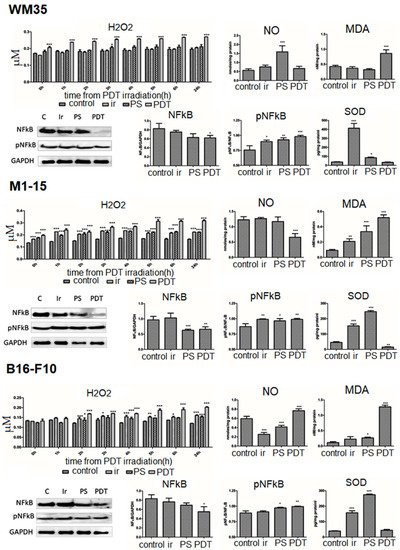
Figure 4.
Oxidative stress. H2O2 following PDT at different irradiation intervals (0 h–24 h). Nitric oxide (nM/mg protein) and malondialdehyde (nM/mg protein). Expression of NFkB and pNFkB. WB images, 1 = control, 2 = irradiated (100 mJ/cm2), 3 = THPP (15 μg/mL), 4 = PDT (THPP 15 μg/mL and irradiation 100 mJ/cm2) (left). Graphical representation of quantitative WB results (right): SOD1 (pg/mg protein) for WM35 (upper panel), M1-15 (middle panel), and B16-F10 (lower panel). Each bar represents mean ± SD, (n = 3). * = p < 5.0 × 10⁻², ** = p < 1.0 × 10⁻², *** = p < 1.0 × 10⁻³, compared to control.
In melanoma cells, the main sources of H2O2 are the reduction in superoxide anion by superoxide dismutase and melanin and/or melanogenesis. Eumelanin (o-diphenol) auto-oxidates even without light and releases superoxide anion. Once generated, hydrogen peroxide is quickly converted into water by catalases and peroxidases. In small amounts, H2O2 is involved in mitogenesis and cell growth regulation. However, upon PDT treatment, type I reactions can lead to high amounts of superoxide and hydroxyl radicals who are short lived, highly reactive oxygen species. The high amount of ROS is likely to overcome the antioxidant defense mechanisms of the cells, leading to the production of TNFα that leads to apoptosis. ROS can also directly stimulate C-Jun N-terminal kinase and caspase cascade, as reviewed in [5]. In B16-F10-pigmented melanoma, the H2O2 level was the smallest, probably because of the high levels of eumelanin pigment. The eumelanin actions on DNA and as oxygen radical scavenger leads to different effects. DNA exposure to eumelanin, due to slight melanosomal leakage, can induce DNA lesions by a Fenton-type reaction; the effect is higher than for pheomelanin. Furthermore, eumelanin binds to small DNA breaks and stops the access of repair enzymes to the site, which propagates mutations. However, in PDT, melanins destroy the singlet oxygen radicals induced by therapy in a dose-dependent manner. Moreover, singlet oxygen radicals reduce the DNA lesions generated by eumelanin [5]. Still, increased melanosomal breakage following PDT can lead to the spilling of toxic melanin intermediates in the cytosol, which enhances the killing efficacy [5,26].
Nitric oxide was increased by PDT only in B16-F10 mouse melanoma co-cultures and not in human (Figure 4), which suggests that nitrosative stress was more important in mouse melanoma. Additionally, NO is involved in neo-angiogenesis by promoting VEGF activation, further increasing endothelial cells proliferation, migration, and tube formation, which can lead to the unwanted side effects of the therapy [30]. Malondialdehyde, a marker of oxidative damage due to lipid peroxidation (Figure 4), was significantly increased by PDT in all co-cultures (p < 0.0001). Superoxide dismutase SOD1, involved in the antioxidant defense by reducing superoxide anion to H2O2, was only increased by irradiation and THPP (dark) and decreased by PDT significantly in M1-15 (p = 0.002).
The nuclear transcription factor kB is involved in the survival and antioxidant defense following oxidative stress exposure, including SOD transcription. PDT significantly decreased total NFkB (p < 0.0001), as seen in Figure 4, in all co-cultures, with an increased pNFkB/NFkB, activation ratio (p ≤ 0.022): WM35, 0.985, M1-15, 0.991, and B16-F10 0.994.
3.2.5. Melanogenesis
Melanogenesis is considered a protective mechanism against PDT. In WM35, lightly pigmented melanoma, and B16-F10, highly pigmented melanoma, PDT significantly increased the pigment content (Figure 5), p ≤ 0.0002, while it decreased tyrosinase, p < 0.0001. This effect can be explained by the oxidation of melanin precursors in the presence of ROS, favored by the destruction of melanosomes and/or the PS melanosomal localization and not by the novo melanin synthesis.
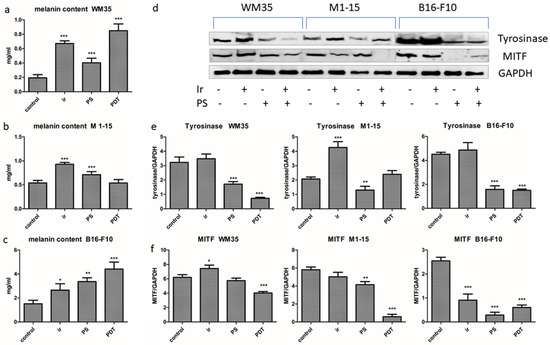
Figure 5.
Melanogenesis. Total melanin content (a) WM35, (b) M1-15, and (c) B16-F10 (d) Expression of tyrosinase and MITF, 1 = control, 2 = irradiated (100 mJ/cm2), 3 = THPP (15 μg/mL), 4 = PDT (THPP 15 μg/mL and irradiation 100 mJ/cm2). Graphical representation of quantitative WB results: tyrosinase (e), MITF (f). Each bar represents mean ± SD (n = 3). * = p < 5.0 × 10⁻², ** = p < 1.0 × 10⁻², *** = p < 1.0 × 10⁻³ compared to control.
The key enzyme of melanogenesis, tyrosinase, is highly sensitive to oxidative reactions and was probably destroyed by ROS induced by PDT. Therefore, PDT-induced melanogenesis exerted little or no protective antioxidant roles. In the M1-15 normally pigmented metastatic melanoma cell line, derived from Caucasian skin, there was no PDT effect on the melanin content or tyrosinase, which suggests that melanogenesis was not influenced by PDT, possibly because of the combination of eumelanin and pheomelanin, characteristic to this type of skin, which acted as a shield against the PDT destruction of melanosomes. The significant increase in melanogenesis by single light exposure in all the melanoma co-cultures was expected and is due to the physiological response of the pigment cells to any stressor, including red light. This effect has been previously reported in the skin of different phototypes following visible light with a wavelength of 400–700 nm, and it is one of the contributing factors to photoaging [31,32,33].
The microphthalmia transcription factor (MITF) is the key regulator of melanin synthesis, cell survival, proliferation, malignant transformation, and it is also involved in melanoma aggressiveness [34] and therapy resistance. The MITF (Figure 5) was strongly inhibited by PDT in all co-cultures, p ≤ 0.0002. Moreover, in PDT-treated cells, MITF inhibition correlated with low HIF1α (downstream target gene) and caspase 3 activation, leading to cell death [10,19], as previously shown in other melanoma experimental settings [35,36].
3.2.6. Inflammation
Inflammatory markers TNFα and sICAM1 were increased by PDT in all co-cultures (Figure 6), significantly for M1-15 and B16-F10, (p ≤ 0.0485). The effect of TNFα in melanoma therapy depends on its level. TNFα may lead to differentiation or apoptosis through ROS and caspase cascade activation, but it can also trigger therapy resistance through the activation of NFkB [26,37]. In the current study, PDT induced caspase activation by TNFα signaling, decreased NFkB, and promoted apoptosis. TNFα also induced the activation of NFkB, known as an an anti-apoptotic signal, but this effect was less important, probably because of the high amount of ROS together with the decreased antioxidant defense. Additionally, PDT-induced acute inflammation is likely to be caused by the expression of two transcription factors, nuclear factor kB (NFkB) and activator protein 1 (AP1) [5,26].
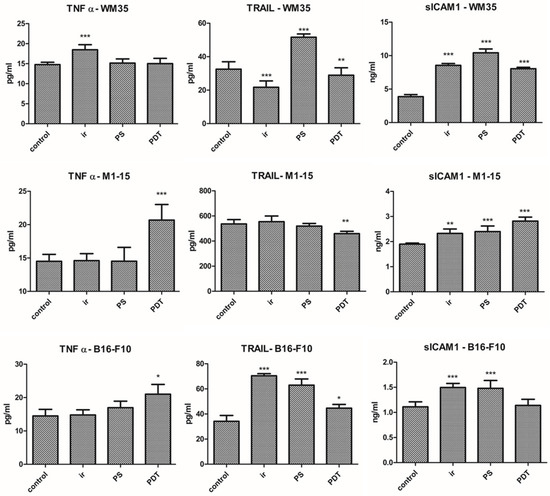
Figure 6.
Inflammation. ELISA measurement of TNF-α (pg/mL), TRAIL (pg/mL), and sICAM1 (ng/mL) for each co-culture; Each bar represents mean ± standard deviation (n = 3). * = p < 5.0 × 10⁻², ** = p < 1.0 × 10⁻², *** = p < 1.0 × 10⁻³, compared to control. 1 = control, 2 = irradiated (100 mJ/cm2), 3 = THPP (15 μg/mL), 4 = PDT (THPP 15 μg/mL and irradiation 100 mJ/cm2).
TRAIL (Figure 6A–C) was only increased in the mouse melanoma (p ≤ 0.043, two-way ANOVA). TRAIL increase supports the major pathway of apoptosis, the TRAIL-induced caspase 8 activation, consistent with the FACS results and also with the smaller decrease in MMP [38,39]. APO2/TRAIL was previously involved in hypericin PDT-induced apoptosis in Jurkat cells or Pc4PDT in A431 epidermoid carcinoma cells, possibly by the sensitization of the cells to TRAIL-induced apoptosis [26]. In HUVECs, the level of the inflammatory markers (sICAM, TNFα, and TRAIL) was increased by PDT (Supplementary Figure S4), only significant for TRAIL, which shows that endothelial cells were a source of inflammatory cytokines responsible for the induction of apoptosis by TNFα signaling and TRAIL and trigger leukocyte adhesion, leading to a local antitumor immune response.
In previous studies, PDT induced acute inflammation and leukocytes accumulation, especially neutrophils, into the treated tumors. Increased IL1 and TNFα stimulate neutrophilia, which increases the chances to obtain the cure by triggering an immune response. TNFα is secreted by resident macrophages, stromal cells, and tumor cells under oxidative stress and is responsible for proliferation, differentiation, and/or apoptosis [40].
sICAM1 was increased by PDT in all co-cultures, significant for WM35 and M1-15 (p ≤ 0.0033). The increased level of sICAM1 is important to further promote leukocyte adhesion by the lymphocyte function-associated antigen (LFA1) to endothelial cells in vivo [41]. This interaction between ICAM1 and LFA1 further facilitates leukocyte migration into the targeted tumor area, enhancing antitumor clearance and exposing hidden melanoma antigens to the leukocytes, a response potentiated by PDT-induced DAMPs [5,42].
3.2.7. Angiogenesis Markers
Tumor angiogenesis is responsible for tumor invasion and metastasis and therapy resistance. VEGF stimulates the formation of new branches for the tumor blood vessels, thus the inhibition of the VEGF/VEGFR pathway plays an important anti-angiogenic role [43]. HIF1α directly activates VEGF and VEGFR-1 transcription by binding to hypoxia-response elements (HREs), leading to the expression of hypoxia-response genes. The overexpression of HIF1α and VEGF leads to aggressive lesions and regulates endothelial and tumor cell function [44]. The contact co-culture employed is a simpler model without the elaborated 3D architecture of an in vivo tumor, but it contains interacting melanoma and endothelial cells, as encountered in a clinical scenario. Therefore, it can be used to quantify angiogenesis markers synthesized by the tumor and endothelial cells upon stimulation responsible for the growth of the tumor vasculature in vivo. HIF1α and VEGF levels were significantly decreased by PDT in all co-cultures (Figure 7), p < 0.0001. This is consistent with other reports on the co-cultures of HUVECs with human bladder carcinoma or glioma cells. In a prostate cancer model, PDT destroyed the barrier function of endothelial cells. Some tumor cell lines produce angiogenic factors that induce HUVEC proliferation and subsequently increase their sensitivity to PDT [45]. On an in vivo mouse melanoma model, the efficiency of vascular-targeted exceeded cellular-targeted PDT because of the severe vascular obstruction and subsequent inflammation, leading to an antitumor immune response [46].
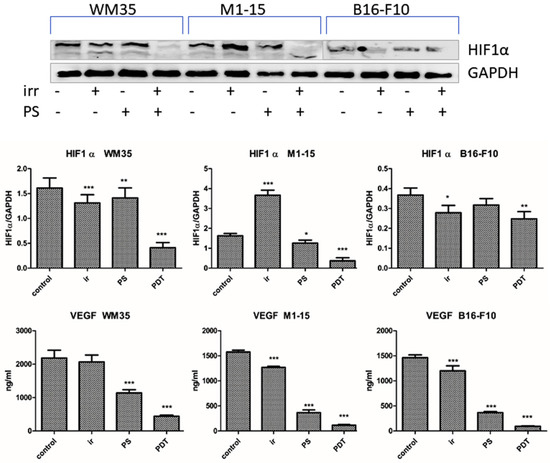
Figure 7.
Angiogenesis markers. HIF1α WB images: 1 = control, 2= irradiated control, 3= THPP, 4= PDT (upper panel). Graphical representation of quantitative WB results; VEGF (ng/mg protein). Each bar represents mean ± SD (n = 3) * = p < 5.0 × 10⁻², ** = p < 1.0 × 10⁻², *** = p < 1.0× 10⁻³ to control. 1 = control, 2 = irradiated (100 mJ/cm2), 3 = THPP (15 μg/mL), 4 = PDT (THPP 15 μg/mL and irradiation 100 mJ/cm2).
3.2.8. AP1 Transcription Factors
Transcription factors play an important role in the maintenance of cellular homeostasis by binding to DNA regulatory sequences. Activator Protein-1 (AP-1) has multiple roles in the proliferation, differentiation, survival, and apoptosis of cells. AP-1 is a dimeric complex that is composed of members of the JUN, FOS, or MAF protein families [47]. AP-1 transcription factors may be activated by different stimuli, such as inflammatory cytokines, stress inducers, or pathogens, leading to innate and adaptive immunity. AP1 is involved in melanoma progression and development. c-Jun, an AP1 family member, is highly expressed and active in melanoma and has mainly oncogenic functions. c-Jun protein is regulated and activated by mitogen-activated protein kinases (MAPKs) and other mechanisms, including ROS, miRNAs, and cytoskeleton [47]. The differentiation of the melanoma depends on the balance between the AP-1 transcription factors c-Jun, FRA2, FRA1, and c-FOS. The level of AP1 factors following PDT is depended on the cell type. C-Jun was decreased mostly in human melanomas, p < 0.0001. cFos was inhibited in B16-F10 murine melanoma and increased in human melanomas, while pc-Fos was significantly inhibited in all co-cultures, p≤ 0.011. The activity ratio, pc-Jun/c-Jun, was only increased in M1-15. The Pc-Fos/c-Fos ratio was decreased in all co-cultures (Figure 8). THPP-mediated PDT inhibited the activation of the AP-1 survival pathway in our experimental setting. Low doses of PDT can induce rescue responses in the treated cultures, such as the activation of the AP-1, NRF2, HIF1α, and NFkB, leading to the regulation of the gene expression, which enhances the cells’ ability to cope with ROS and to increase the antioxidant defense, leading to the survival of tumor cells [6,7]. AP-1 was reported to be up-regulated as an immediate stress response following PDT in HeLa cells treated with photofrin PDT [48], as a survival mechanism, triggered by the activation of the MAPK pathway through ROS generated by PDT. Therefore, the combination of local PDT that inhibits AP-1 with MAPK inhibition in such cases could be used to delay or even overcome the melanoma resistance to MAPK therapy [49] and increase therapy efficiency. Therefore, these data show that the PDT effectiveness against melanoma also relies on the inhibition of the pro-survival mechanisms triggered by the transcription factors such as AP-1, MITF, HIF1α, and NFkB.
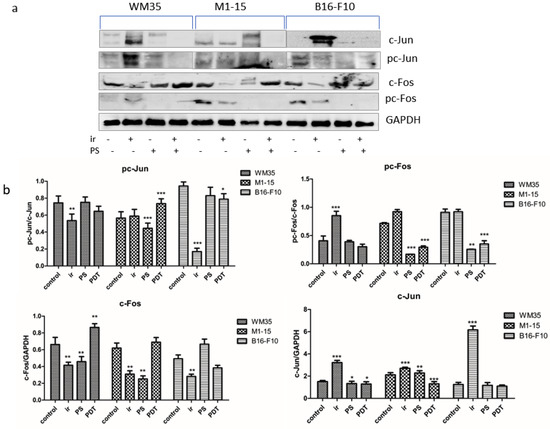
Figure 8.
AP1 transcription factors. (a) Expression of c-Jun, pc-Jun, c-Fos, and pc-Fos. 1 = control, 2= irradiated control, 3 = THPP, 4 = PDT. (b) Graphical representation of quantitative WB results. Each bar represents mean ± SD (n = 3). * = p < 5.0 × 10⁻², ** = p < 1.0 × 10⁻², *** = p < 1.0 × 10⁻³, compared to control. 1 = control, 2 = irradiated (100 mJ/cm2), 3 = THPP (15 μg/mL), 4 = PDT (THPP 15 μg/mL and irradiation 100 mJ/cm2).
3.2.9. Autophagy
Autophagy is an important cellular process that maintains homeostasis by recycling damaged proteins or organelles. Autophagy overactivation can lead to cell death. Canonical activation of the autophagy has six steps: induction, phagophore nucleation, phagophore expansion, autophagosome formation, lysosome fusion, and component degradation [50]. Beclin 1 increases the formation of PI3KC3eC1 that inhibits the PI3K/Akt pathway and mTOR activity, while LC3s (A, B, and C) are structural autophagosome proteins, important for autophagosome transport and fusion with the lysosomes. In our experimental setting, the beclin 1 level was significantly decreased by photodynamic therapy in all three cell lines compared to the control (p < 0.001), which can indicate autophagy inhibition (Figure 9), as reported by others [51]. To confirm this effect of the inhibition of the autophagic flux, we also performed the measurements of the LC3B isoform I and II [51,52]. LC3I is transformed to LC3II during autophagy. LC3B II migrates and becomes associated with the autophagosomes. The presence of the LC3B I and its conversion to LC3B II can be used as markers of autophagy [53]. As seen in Figure 9, the LC3B showed a different behavior in the three melanoma cell lines.
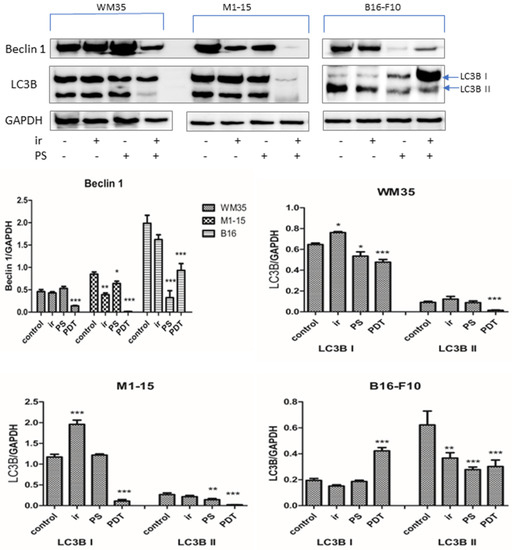
Figure 9.
Autophagy. Expression of LC3B I and II and beclin 1. 1 = control, 2 = irradiated (100 mJ/cm2), 3 = THPP (15 μg/mL), 4 = PDT (THPP 15 μg/mL and irradiation 100 mJ/cm2). Graphical representation of quantitative WB results. Each bar represents mean ± SD (n = 3). * = p < 5.0 × 10⁻², ** = p < 1.0 × 10⁻², *** = p < 1.0 × 10⁻³, compared to control.
In WM35 and M1-15, both LC3B I and II were inhibited by PDT (p < 0.001). These data, correlated with the beclin 1 lower levels, suggest that the autophagic flux was inhibited by PDT in WM35 and M1-15 lines. In B16-F10, the level of LC3B I was significantly increased, while LC3B II was decreased in the PDT group (p < 0.001). Although the level of beclin 1 was inhibited in B16-F10, the presence of LC3BI suggests that autophagy was initiated, but since this is a time-dependent mechanism [52], it is possible that the conversion of LC3B I in LC3B II was not yet realized. Beclin 1-enhanced levels are not mandatory for autophagy initiation [51]; therefore, this inhibition should correlate with other autophagy markers. Moreover, the initiation of the autophagy might explain the lower cell death induced in this type of melanoma.
In tumor cells, PDT-selective autophagy can lead to the inhibition of apoptosis, with tumor resistance or as a death induction mechanism in the case of extensive organelle damage or oxidative alterations affecting both the mitochondria and lysosomes reviewed in [54]. The mechanism of autophagy was triggered following 5-ALA PDT in colon Caco-2 and SW480 cancer cells by ROS-induced HIF1α, leading to the activation of the hypoxia response element (HRE), which promotes the vacuole membrane protein 1 (VMP1), involved in the formation of autophagosomes and inhibited cell death. In glioblastoma U87 and LN18 cells, the initiation of the autophagy by NO and NFkB increased AKT/mTOR signaling-promoted resistance against 5-ALA PDT. In our experimental model, PDT inhibited HIF1α, NO, and NFkB, which correlated with the inhibition of autophagy in the case of WM35 and M1-15 and the initiation of autophagy in the case of B16-F10. Therefore, WM35 and M1-15 cells lines were not able to use autophagy as a cytoprotective mechanism against THPP-mediated phototoxicity, as reviewed in [54].
The main PDT anti-tumor mechanism is the direct cell killing induced by the generation of reactive oxygen species, following the activation of intracellular THPP upon red light irradiation. Besides the directly induced apoptosis and/or necrosis, the melanoma cells pro-survival mechanisms, triggered by transcription factors such as MITF, AP1, NFkB, and HIF1α, are also inhibited, which ensures a better PDT efficacy (Figure 10).
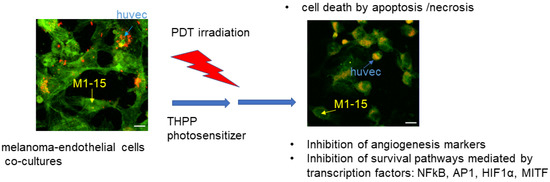
Figure 10.
Diagram of the main PDT mechanisms in the current study. Melanoma (WM35, human, M1-15, human, B16-F10, murine) and endothelial cells (HUVEC, human) co-cultures were established, then subjected to PDT mediated by THPP as photosensitizer. The main mechanisms of cell killing were apoptosis and necrosis. PDT efficacy was enhanced by the inhibition of the pro-survival mechanisms, mediated by transcription factors such as NFkB, AP1, HIF1α, and MITF.
4. Conclusions
PDT represents a promising alternative palliative treatment for advanced melanoma patients, mainly due to its minimal invasive character and few side effects. This study shows that anti-melanoma PDT effects, mediated by THPP, were cell type-specific and were exerted by different mechanisms of action, such as the induction of cell death through oxidative stress damage, enhanced pro-inflammatory markers, inhibition of angiogenesis, and autophagy. THPP efficiency as a photosensitizer is due to its physico-chemical properties, such as a high lipophilicity, high singlet oxygen quantum yield, its intracellular location, and the light activation at higher wavelengths. These allow THPP to enter the membranes, avoid the melanin absorbance peak of the PDT irradiation, and to generate a high level of ROS, leading to both tumor and endothelial cell death.
PDT-activated mechanisms involved in the survival and resistance to therapy, such as transcription factors AP-1, NFkB, HIF1α, and MITF, were also inhibited, leading to a sustainable therapeutic outcome. Although constitutive pigmentation reduced the efficacy of PDT in cell killing in B16-F10 murine melanoma, melanogenesis was inhibited and had no protective role against PDT. As such, THPP proved to be an efficient photosensitizer against these experimental models of melanoma in vitro.
Supplementary Materials
The following supporting information can be downloaded at: https://www.mdpi.com/article/10.3390/pr11030917/s1, Figure S1: Chemical structure of THPP. Characterization of THPP; Figure S2: LED lamp emission spectrum; Figure S3: THPP cytotoxicity in HUVEC monocultures. Comparative cytotoxicity testing w/wo irradiation 100 mJ/cm2 and 150 mJ/cm2 of HUVEC monocultures exposed to THPP (concentration range 0–100 μg/ml). Viability is expressed as % of untreated controls (mean ± SD, n = 3), toxicity limit is drawn at 70% of untreated control; Figure S4: Inflammatory markers in HUVEC monoculture. ELISA measurement of sICAM1(ng/mL), TNF-α (pg/mL), TRAIL (pg/mL); Each bar represents mean ± standard deviation (n = 3). *** = p < 1.0 × 10⁻³, compared to control. 1 = control, 2 = irradiated (100 mJ/cm2), 3 = THPP (15 μg/mL), 4 = PDT (THPP 15 μg/mL and irradiation 100 mJ/cm2); Table S1. Phototoxic indexes calculated for the melanoma co-cultures, following exposure to THPP alone in different concentrations and, respectively THPP mediated PDT, irradiation dose 100 mJ/cm2, data are presented as media ± SD, n = 3, for each THPP concentration [55,56].
Author Contributions
Conceptualization, I.B., S.D., R.M.I. and C.I; methodology, I.B., F.T., C.I., M.C., A.G.F., D.E.O. and R.M.D.; software, I.B., F.T. and C.I.; validation, A.G.F. and R.M.I.; formal analysis, I.B., M.C. and A.C.S.-B.; investigation, D.E.O., I.B. and D.H.; resources, I.B.; data curation, S.D. and I.B.; writing—original draft preparation, I.B., S.D. and D.E.O.; writing—review and editing, I.B. and R.M.I.; visualization, D.E.O.; supervision, I.B.; project administration, I.B.; funding acquisition, I.B. All authors have read and agreed to the published version of the manuscript.
Funding
This research was funded by the CNCS—UEFISCDI, project number PN-III-P1-1.1-TE-2021-0498, within PNCDI III, granted by the Romanian Ministry of Research, Innovation, and Digitization.
Data Availability Statement
Data are contained within the article or Supplementary Materials. The data presented in this study are available in Appendix A.
Conflicts of Interest
The authors declare no conflict of interest.


References
- Kwiatkowski, S.; Knap, B.; Przystupski, D.; Knap, B.; Przystupski, D.; Saczko, J.; Kędzierska, E.; Knap-Czop, K.; Kotlinska, J.; Michel, O.; et al. Photodynamic therapy—Mechanisms, photosensitizers and combinations. Biomed. Pharmacother. 2018, 106, 1098–1107. [Google Scholar] [CrossRef]
- Baldea, I.; Filip, A.G. Photodynamic therapy in melanoma-an update. J. Physiol. Pharmacol. 2012, 63, 109–118. [Google Scholar]
- Dickson, P.V.; Gershenwald, J.E. Staging and Prognosis of Cutaneous Melanoma. Surg. Oncol. Clin. N. Am. 2011, 20, 1–17. [Google Scholar] [CrossRef]
- Huang, Y.Y.; Vecchio, D.; Avci, P.; Yin, R.; Garcia-Diaz, M.; Hamblin, M.R. Melanoma resistance to photodynamic therapy: New insights. Biol. Chem. 2013, 394, 239–250. [Google Scholar] [CrossRef]
- Baldea, I.; Giurgiu, L.; Teacoe, I.D.; Olteanu, D.E.; Olteanu, F.C.; Clichici, S.; Filip, G.A. Photodynamic Therapy in Melanoma—Where do we Stand? Curr. Med. Chem. 2018, 25, 5540–5563. [Google Scholar] [CrossRef]
- De Klerk, D.J.; de Keijzer, M.J.; Dias, L.M.; Heemskerk, J.; de Haan, L.R.; Kleijn, T.G.; Franki, L.P.; Heger, M. Strategies for improving photodynamic therapy through pharmacological modulation of the immediate early stress response. In Photodynamic Therapy. Methods in Molecular Biology; Broekgaarden, M., Zhang, H., Korbelik, M., Hamblin, M.R., Heger, M., Eds.; Humana: New York, NY, USA, 2022; Volume 2451, pp. 405–480. [Google Scholar]
- Broekgaarden, M.; Weijer, R.; van Gulik, T.M.; Hamblin, M.R.; Heger, M. Tumor cell survival pathways activated by photodynamic therapy: A molecular basis for pharmacological inhibition strategies. Cancer Metastasis Rev. 2015, 34, 643–690. [Google Scholar] [CrossRef]
- Baldea, I.; Olteanu, D.E.; Bolfa, P.; Tabaran, F.; Ion, R.M.; Filip, G.A. Melanogenesis and DNA damage following photodynamic therapy in melanoma with two meso-substituted porphyrins. J. Photochem. Photobiol. 2016, 161, 402–410. [Google Scholar] [CrossRef]
- Lindsey, J.S.; Hsu, H.C.; Schreiman, I.C. Synthesis of tetraphenylporphyrins under very mild conditions. Tetrahedron. Lett. 1986, 27, 4969–4970. [Google Scholar] [CrossRef]
- Baldea, I.; Olteanu, D.E.; Bolfa, P.; Ion, R.M.; Decea, N.; Cenariu, M.; Banciu, M.; Sesarman, A.V.; Filip, A.G. Efficiency of photodynamic therapy on WM35 melanoma with new synthetic porphyrins: Role of chemical structure, intracellular targeting and antioxidant defense. J. Photochem. Photobiol. B Biol. 2015, 151, 142–152. [Google Scholar] [CrossRef]
- Leo, A.; Hansch, C.; Elkins, D. Partition coefficients and their uses. Chem. Rev. 1971, 71, 525–616. [Google Scholar] [CrossRef]
- Scalise, I.; Durantini, E.N. Photodynamic effect of metallo 5-(4-carboxyphenyl)-10,15,20-tris(4-methylphenyl) porphyrins in biomimetic AOT reverse micelles containing urease. J. Photochem. Photobiol. A Chem. 2004, 162, 105–113. [Google Scholar] [CrossRef]
- Banfi, S.; Caruso, E.; Buccafurni, L.; Battini, V.; Zazzaron, S.; Barbieri, P.; Orlandi, V. Antibacterial activity of tetraaryl-porphyrin photosensitizers: An in vitro study on Gram negative and Gram positive bacteria. J. Photochem. Photobiol. B Biology 2006, 85, 28–38. [Google Scholar] [CrossRef]
- Spiller, W.; Kliesch, H.; Wohrle, D.; Hackbarth, S.; Röder, B.; Schnurpfeil, G. Singlet oxygen quantum yields of different photosensitizers in polar solvents and micellar solutions. J. Porphyr. Phthalocyanines 1998, 2, 145–158. [Google Scholar] [CrossRef]
- Pineiro, M.; Carvalho, A.L.; Pereira, M.M.; Gonsalves, A.D.A.R.; Arnaut, L.G.; Formosinho, S.J. Photoacoustic measurements of porphyrin triplet-state quantum yields and singlet-oxygen efficiencies. Chem. Eur. J. 1998, 4, 2299. [Google Scholar] [CrossRef]
- Foletto, P.; Correa, F.; Dornelles, L.; Iglesias, B.A.; da Silveira, C.H.; Nogara, P.A.; de Rocha, J.B.T.; Faustino, M.A.F.; Rodrigues, O.E.D. A New Protocol for the Synthesis of New Thioaryl-Porphyrins Derived from 5,10,15,20-Tetrakis(pentafluorophenyl)porphyrin: Photophysical Evaluation and DNA-Binding Interactive Studies. Molecules 2018, 23, 2588. [Google Scholar] [CrossRef]
- Viecelli, V.; Chaves, O.A.; Araki, K.; Martins, P.R.; Iglesias, B.A. Synthesis, Characterization, Spectroelectrochemical, Photophysical and HSA-Binding Properties of Novel and Versatile meso-Tetra(4-pyridylvinylphenyl)porphyrins Coordinated to Ruthenium(II)-Polypyridyl Derivatives. J. Braz. Chem. Soc. 2020, 31, 2282–2298. [Google Scholar] [CrossRef]
- Hegyesi, H.; Somlai, B.; Varga, V.L.; Toth, G.; Kovacs, P.; Molnar, E.L.; Laszlov, V.; Karpati, S.; Rivera, E.; Falus, A.; et al. Suppression of melanoma cell proliferation by histidine decarboxylase specific antisense oligonucleotides. J. Invest. Dermatol. 2001, 117, 151–153. [Google Scholar] [CrossRef]
- Tudor, D.; Nenu, I.; Filip, G.A.; Olteanu, D.; Cenariu, M.; Tabaran, F.; Ion, R.M.; Gligor, L.; Baldea, I. Combined regimen of photodynamic therapy mediated by Gallium phthalocyanine chloride and Metformin enhances anti-melanoma efficacy. PLoS One 2017, 12, e0173241. [Google Scholar] [CrossRef]
- Ohkura, T.; Yamashita, K.; Mishima, Y.; Kobata, A. Purification of hamster melanoma tyrosinases and structural studies of their asparagine-linked sugar chains. Arch. Biochem. Biophys. 1984, 235, 63–77. [Google Scholar] [CrossRef]
- Tsolekile, N.; Ncapayi, V.; Parani, S.; Sakho, E.; Matoetoe, M.; Songca, S.; Oluwafemi, O. Synthesis of fluorescent CuInS2/ZnS quantum dots—Porphyrin conjugates for photodynamic therapy. MRS Commun. 2018, 8, 398–403. [Google Scholar] [CrossRef]
- Kenneth, K.N.; Lovell, J.F.; Vedadi, A.; Hajian, T.; Zheng, G. Self-Assembled Porphyrin Nanodiscs with Structure-Dependent Activation for Phototherapy and Photodiagnostic Applications. ACS Nano 2013, 7, 3484–3490. [Google Scholar]
- Salas-García, I.; Fanjul-Vélez, F.; Arce-Diego, J.L. Photosensitizer absorption coefficient modeling and necrosis prediction during photodynamic therapy. J. Photochem. Photobiol. B Biology. 2012, 114, 79–86. [Google Scholar] [CrossRef]
- Lazewski, D.; Kucinska, M.; Potapskiy, E.; Kuzminska, J.; Tezyk, A.; Popenda, L.; Jurga, S.; Teuberst, A.; Gdaniec, Z.; Kujawsky, J.; et al. Novel Short PEG Chain-Substituted Porphyrins: Synthesis, Photochemistry, and In Vitro Photodynamic Activity against Cancer Cells. Int. J. Mol. Sci. 2022, 23, 10029. [Google Scholar] [CrossRef]
- Akasov, R.A.; Sholina, N.V.; Khochenkov, D.A.; Alova, A.V.; Gorelkin, P.V.; Erofeev, A.S.; Generalova, A.N.; Khaydukov, E.V. Photodynamic therapy of melanoma by blue-light photoactivation of flavin mononucleotide. Sci. Rep. 2019, 9, 9679. [Google Scholar] [CrossRef]
- Mroz, P.; Yaroslavsky, A.; Kharkwal, G.B.; Hamblin, M.R. Cell death pathways in photodynamic therapy of cancer. Cancers 2011, 3, 2516–2539. [Google Scholar] [CrossRef]
- Summers, F.A.; Zhao, B.; Ganini, D.; Mason, R.P. Photooxidation of amplex red to resorufin: Implications of exposing the amplex red assay to light. Methods Enzymol. 2013, 526, 1–17. [Google Scholar]
- Karakuzu, O.; Cruz, M.R.; Liu, Y.; Garsin, D.A. Amplex Red Assay for Measuring Hydrogen Peroxide Production from Caenorhabditis elegans. Bio-Protocol 2019, 5, e3409. [Google Scholar] [CrossRef]
- Mishin, V.; Gray, J.P.; Heck, D.E.; Laskin, D.L.; Laskin, J.D. Application of the Amplex red/horseradish peroxidase assay to measure hydrogen peroxide generation by recombinant microsomal enzymes. Free. Radic. Biol. Med. 2010, 48, 1485–1491. [Google Scholar] [CrossRef]
- Barui, A.K.; Nethi, S.K.; Patra, C.R. Investigation of the role of nitric oxide driven angiogenesis by zinc oxide nanoflowers. J. Mater. Chem. B 2017, 5, 3391–3403. [Google Scholar] [CrossRef]
- Campiche, R.; Curpen, S.J.; Lutchmanen-Kolanthan, V.; Gougeon, S.; Cherel, M.; Laurent, G.; Gempeler, M.; Schuetz, R. Pigmentation effects of blue light irradiation on skin and how to protect against them. Int. J. Cosmet. Sci. 2020, 42, 399–406. [Google Scholar] [CrossRef]
- Austin, E.; Geisler, A.N.; Nguyen, J.; Kohli, I.; Hamzavi, I.; Lim, H.W.; Jagdeo, J. Visible light. Part I: Properties and cutaneous effects of visible light. J. Am. Acad. Dermatol. 2021, 84, 1219–1231. [Google Scholar] [CrossRef]
- Maddodi, N.; Jayanthy, A.; Setaluri, V. Shining light on skin pigmentation: The darker and the brighter side of effects of UV radiation. Photochem. Photobiol. 2012, 88, 1075–1082. [Google Scholar] [CrossRef]
- Liu, J.J.; Fisher, D.E. Lighting a path to pigmentation: Mechanisms of MITF induction by UV. Pigment. Cell Meloma. Res. 2010, 23, 741–745. [Google Scholar] [CrossRef]
- Sim, D.Y.; Sohng, J.K.; Jung, H.J. Anticancer activity of 7,8-dihydroxyflavone in melanoma cells via downregulation of α-MSH/cAMP/MITF pathway. Oncol. Rep. 2016, 36, 528–534. [Google Scholar] [CrossRef]
- Chen, Y.-S.; Lee, S.-M.; Lin, C.-C.; Liu, C.-Y. Hispolon Decreases Melanin Production and Induces Apoptosis in Melanoma Cells through the Downregulation of Tyrosinase and Microphthalmia-Associated Transcription Factor (MITF) Expressions and the Activation of Caspase-3, -8 and -9. Int. J. Mol. Sci. 2014, 15, 1201–1215. [Google Scholar] [CrossRef]
- Schlatter, R.; Schmich, K.; Lutz, A.; Trefzger, J.; Sawodny, O.; Ederer, M.; Merfort, I. Modeling the TNFα-induced apoptosis pathway in hepatocytes. PLoS ONE 2011, 6, e18646. [Google Scholar] [CrossRef]
- Marini, P.; Schmid, A.; Jendrossek, V.; Faltin, H.; Daniel, P.T.; Budach, W.; Belka, C. Irradiation specifically sensitises solid tumour cell lines to TRAIL mediated apoptosis. BMC Cancer 2005, 5, 5. [Google Scholar] [CrossRef]
- Thorburn, A. Pathway of the Month. Tumor Necrosis Factor-Related Apoptosis-Inducing Ligand (TRAIL) Pathway Signaling. J. Thorac. Oncol. 2007, 2, 461–465. [Google Scholar] [CrossRef]
- Bhuvaneswari, R.; Gan, Y.Y.; Lucky, S.S.; Chin, W.W.; Ali, S.M.; Soo, K.C.; Olivo, M. Molecular profiling of angiogenesis in hypericin mediated photodynamic therapy. Mol. Cancer 2008, 7, 56. [Google Scholar] [CrossRef]
- Witkowska, A.M.; Borawska, M.H. Soluble intercellular adhesion molecule-1 (sICAM-1): An overview. Eur. Cytokine Netw. 2004, 15, 91–98. [Google Scholar]
- Zheng, Y.; Yin, G.; Le, V.; Zhang, A.; Chen, S.; Liang, X.; Liu, J. Photodynamic-therapy Activates Immune Response by disrupting Immunity Homeostasis of Tumor Cells, which Generates Vaccine for Cancer Therapy. Int. J. Biol. Sci. 2016, 12, 120–132. [Google Scholar] [CrossRef]
- Zhao, Y.; Adjei, A. Targeting Angiogenesis in cancer therapy: Moving beyond vascular endothelial growth factor. Oncologist 2015, 20, 660–673. [Google Scholar] [CrossRef]
- Otrock, Z.; Hatoum, H.; Awada, A.; Ishak, R.; Shamseddine, A. Hypoxia-inducible factor in cancer angiogenesis: Structure, regulation and clinical perspectives. Crit. Rev. Oncol. Hematol. 2009, 70, 93–102. [Google Scholar] [CrossRef]
- Yang, Z.; Lu, X.; Frazier, D.L.; Panjehpour, M.; Breider, M.A. Tumor cell-enhanced sensitivity of vascular endothelial cells to photodynamic therapy. Lasers Surg. Med. 1994, 15, 342–350. [Google Scholar] [CrossRef]
- Chen, B.; Pogue, B.W.; Hoopes, P.J.; Hasan, T. Vascular and cellular targeting for photodynamic therapy. Crit. Rev. Eukaryot. Gene Expr. 2006, 16, 279–305. [Google Scholar] [CrossRef]
- Kappelmann, M.; Bosserhoff, A.; Kuphal, S. AP-1/c-Jun transcription factors: Regulation and function in malignant melanoma. Eur. J. Cell. Biol. 2014, 93, 76–81. [Google Scholar] [CrossRef]
- Kick, G.; Messer, G.; Plewig, G.; Kind, P.; Goetz, A.E. Strong and prolonged induction of c-jun and c-fos proto-oncogenes by photodynamic therapy. Br. J. Cancer 1996, 74, 30–36. [Google Scholar] [CrossRef]
- Gerosa, L.; Chidley, C.; Fröhlich, F.; Sanchez, G.; Lim, S.K.; Muhlich, J.; Chen, J.-Y.; Vallabhaneni, S.; Baker, G.J.; Schapiro, D.; et al. Receptor-Driven ERK Pulses Reconfigure MAPK Signaling and Enable Persistence of Drug-Adapted BRAF-Mutant Melanoma Cells. Cell Syst. 2020, 11, 478–494. [Google Scholar] [CrossRef]
- Baldea, I.; Olteanu, D.; Filip, G.A.; Pogacean, F.; Coros, M.; Suciu, M.; Tripon, S.C.; Cenariu, M.; Magerusan, L.; Stefan van-Staden, R.L.; et al. Cytotoxicity mechanisms of nitrogen-doped graphene obtained by electrochemical exfoliation of graphite rods, on human endothelial and colon cancer cells. Carbon 2020, 158, 267–281. [Google Scholar] [CrossRef]
- Zhu, H.; Wu, H.; Liu, X.; Li, B.; Chen, Y.; Ren, X.; Liu, C.-G.; Yang, J.-M. Regulation of autophagy by a beclin 1-targeted microRNA, miR-30a, in cancer cells. Autophagy 2009, 5, 816–823. [Google Scholar] [CrossRef]
- Meijer, A.J. Autophagy research: Lessons from metabolism. Autophagy 2009, 5, 3–5. [Google Scholar] [CrossRef]
- Schmitt, D.; Bozkurt, S.; Henning-Domres, P.; Huesmann, H.; Eimer, S.; Bindila, L.; Behrends, C.; Boyle, E.; Wilfling, F.; Tascher, G.; et al. Lipid and protein content profiling of isolated native autophagic vesicles. EMBO Rep. 2022, 23, e53065. [Google Scholar] [CrossRef]
- Martins, W.K.; Belotto, R.; Maryana, N.S.; Grasso, D.; Suriani, M.D.; Lavor, T.S.; Itri, R.; Baptista, M.S.; Tsubone, T.M. Autophagy Regulation and Photodynamic Therapy: Insights to Improve Outcomes of Cancer Treatment. Front Oncol. 2021, 10, 610472. [Google Scholar] [CrossRef]
- Lim, C.K.; Li, F.M.; Peters, T.J. High-Performance Liquid Chromatography of Porphyrins. J. Chromatogr. 1988, 429, 123–153. [Google Scholar] [CrossRef]
- Lim, C.K.; Rideout, J.M.; Wright, D.J. Separation of Porphyrin Isomers by High-Performance Liquid Chromatography. Biochem. J. 1983, 211, 435–438. [Google Scholar] [CrossRef]


Disclaimer/Publisher’s Note: The statements, opinions and data contained in all publications are solely those of the individual author(s) and contributor(s) and not of MDPI and/or the editor(s). MDPI and/or the editor(s) disclaim responsibility for any injury to people or property resulting from any ideas, methods, instructions or products referred to in the content. |
© 2023 by the authors. Licensee MDPI, Basel, Switzerland. This article is an open access article distributed under the terms and conditions of the Creative Commons Attribution (CC BY) license (https://creativecommons.org/licenses/by/4.0/).