Article

An Integrated Fuzzy DEMATEL and Fuzzy TOPSIS Method for Analyzing Smart Manufacturing Technologies

by
Fawaz M. Abdullah
*,
Abdulrahman M. Al-Ahmari
and
Saqib Anwar
Industrial Engineering Department, College of Engineering, King Saud University, P.O. Box 800, Riyadh 11421, Saudi Arabia
*
Author to whom correspondence should be addressed.
Processes 2023, 11(3), 906; https://doi.org/10.3390/pr11030906
Submission received: 26 February 2023 / Revised: 12 March 2023 / Accepted: 14 March 2023 / Published: 16 March 2023
(This article belongs to the Special Issue Digitalized Industrial Production Systems and Industry 4.0, Volume II)

Abstract

:
I4.0 promotes a future in which highly individualized goods are mass produced at a competitive price through autonomous, responsive manufacturing. In order to attain market competitiveness, organizations require proper integration of I4.0 technologies and manufacturing strategy outputs (MSOs). Implementing such a comprehensive integration relies on carefully selecting I4.0 technologies to meet industrial requirements. There is little clarity on the impact of I4.0 technologies on MSOs, and the literature provides little attention to this topic. This research investigates the influence of I4.0 technologies on MSOs by combining reliable MCDM methods. This research uses a combination of fuzzy DEMATEL and fuzzy TOPSIS to evaluate the impact of I4.0 technologies on MSOs. The fuzzy theory is implemented in DEMATEL and TOPSIS to deal with the uncertainty and vagueness of human judgment. The FDEMATEL was utilized to identify interrelationships and determine criterion a’s weights, while the fuzzy TOPSIS approach was employed to rank the I4.0 technologies. According to the study’s findings, cost is the most critical factor determining MSOs’ market competitiveness, followed by flexibility and performance. On the other hand, additive manufacturing (AM) is the best I4.0 technology for competing in the global market. The results present an evaluation model for analyzing the relative important weight of multiple factors on MSOs. They can also assist managers in concentrating on the most influential factors and selecting the proper I4.0 Technology to preserve competitiveness.

1. Introduction

Today’s manufacturers are challenged with an ever-increasing demand for product diversity and unpredictable market requirements. In order to keep up with the ever-changing market, boost product quality, and maximize efficiency, manufacturers must embrace novel techniques [1]. There has recently been a collaboration between international organizations in order to develop the smart manufacturing [2]; with enhanced technology for sensing, and decision-making, autonomous manufacturing activities can be performed to meet customer demands [3]. Smart manufacturing uses product lifetime data to improve all aspects of manufacturing. Hence, I4.0 is a breakthrough wave that meets customer needs efficiently. Designers describe this “flexible integration of the global value chain”—making customer-requested products efficient [4,5]. Its goal is to create cost-effective, flexible workflows that deliver high-quality, personalized products at low unit costs.
Cost-efficient, intelligent, effective, customized, and configurable products are possible with I4.0. Automation and data exchange help I4.0 digitalize manufacturing [6]. Cyber-physical systems (CPS) are emphasized for their potential to integrate machines, factories, and business processes and for their distinctive features, such as autonomous information sharing, activity triggering, decision-making, and independent control [7]. With CPS and the IoT, intelligent devices are constantly interacting and communicating with one another, bridging the gap between the digital/virtual and real/physical worlds [8]. I4.0 improves industrial capability by making it easier to produce the appropriate products of the best quality, with fast delivery, at a low price, while keeping the environment safe [9]. It is feasible to make things and machines smarter by enabling them to connect with and learn from one another thanks to quicker computers, intelligent devices, and more inexpensive [10].
A manufacturing strategy (MS) is a long-term plan for using the resources of the manufacturing system to achieve the company’s goals [11]. A manufacturing strategy is an approach to production that aims to maximize performance while striking a balance between different performance objectives. All manufacturing policies should be developed in tandem with or in support of the company strategy, which should be a priority for the highest levels of management [12]. These days, a company’s manufacturing capabilities are one of its most distinguishing features in the marketplace [13]. Therefore, businesses must develop their production plans. To increase manufacturing production, it is necessary to establish a connection between manufacturing goals and business goals [14]. In order to increase output and performance as a whole, I4.0 and MSOs need to be properly aligned.
To help businesses compete in today’s global economy, this research developed a hybrid MCDM model for ranking I4.0 technologies. FDEMATEL analyzes the interrelationships and feedback between the criteria under uncertainty and calculates weights. Thus, FTOPSIS is used to rank the I4.0 technologies. It is widely known that the conventional production system cannot preserve the business’s competitive edge due to insufficient and predetermined assets, fixed routes, a lack of communication, autonomous management, and fragmented data. Business is faced with new challenges caused by globalization, including a more complex and competitive market, trading environments, and unpredictable and hazardous. In order to maintain a competitive edge, businesses must invest in I4.0 technologies that affect MSOs. Deep digitalization integration with the broader economy has emerged as a crucial method for enhancing industrial production’s competitiveness and quality growth [15,16]. The research contributes to identifying and classifying MSOs relevant to I4.0 technologies through a review of pertinent literature and the opinions of experts in the field. The proposed method investigated the effects of I4.0 technologies on MSOs, allowing managers to make more informed decisions and enhance their market competitiveness.
The outline of this study is as follows: The literature review is addressed in Section 2. In Section 3, the authors discuss the methodology. Section 4 presents the findings and discusses them. Discussion of implications in Section 5. Finally, the conclusion and future study are provided.

2. Literature Review

Smart manufacturing, defined as I4.0′s key pillar, incorporates various technologies and digitally changes businesses to reach market competency, as shown in Figure 1. The manufacturing and development of new items have become increasingly complex and complicated. While there are numerous modifications and differences in customer needs, the system must be highly flexible to create various products on a similar system [17]. In the twenty-first century, manufacturers face new challenges brought on by globalization, such as unexpected market shifts. The new emerging production paradigm is called personalization or personalized production, and it is motivated by consumers’ desire to have input into and ownership over product design [18]. A dedicated production line, a flexible manufacturing system, and a reconfigurable manufacturing system are all parts of the industry 4.0 production system [19]. In order to boost overall production and performance, I4.0 and MSOs need to be properly aligned. According to the reported studies [14,20,21,22,23,24,25,26,27], the I4.0 technologies are shown in Figure 2 and described in our previously published paper [25].
An organization’s manufacturing strategy is its long-term plan for employing its manufacturing system’s resources in service of its overarching business strategy and achieving its objectives [11]. It is also known as a framework aims to improve a business’s ability to compete in its industry by ensuring its manufacturing resources are designed, managed, and developed to provide a balanced set of performance characteristics [28]. Manufacturing strategies assist businesses in developing a well-organized manufacturing structure [29]. A manufacturing firm’s productivity and ability to distinguish itself from the competition are both improved by a well-organized structure. Strategically, it becomes a factor in the competition for such businesses, as it helps them differentiate themselves from their competitors [13]. In the literature, MSOs are also known as competitive priorities [23,30]. Competitive priorities motivate the entire company to gain an advantage over its rivals. The description of MSOs is shown in Table 1.
Numerous studies have clarified the significance of integrating I4.0 technologies to improve MSOs. May and Kiritsis [31] used I4.0 technologies to achieve error-free assembly lines, boosting productivity, quality, customer satisfaction, profitability, and long-term viability in the manufacturing sector. Tortorella and Fettermann [32] employed I4.0 technologies, including big data, IoT, etc., to boost MSOs quality and performance. Ghobakhloo [21] built a balancing framework serves as a jumping-off point for researchers and industry professionals to develop a comprehensive strategy for an easy transition from traditional manufacturing to I4.0, resulting in improved performance across the board. Ghobakhloo and Fathi [33] utilized I4.0 technologies to demonstrate how SME manufacturers may optimize their information technology investment to create lean, digitalized production procedures that boost their long-term competitiveness and performance. Tortorella and Giglio et al. [34] used I4.0 technologies to increase operational efficiency in Brazil’s lean production (LP) system.
As the manufacturing process becomes more complex, manufacturers are greatly concerned about making good decisions. Therefore, in a fuzzy environment, MCDM techniques can significantly decrease the problem’s complexity [35,36,37]. Commonly, researchers use the DEMATEL to determine if there is a link between the variables. This approach assists in creating a structural model to analyze how various factors interact in extended and comprehensive studies [38]. These factors are graded based on the type of relationship they reflect and the degree of their interdependence. This method uses matrices to convert interdependencies into a group of causes and effects and impact relationship diagrams to identify the influential factors of a complex structural system. DEMATEL can help identify real solutions, specific problems, clusters of complex issues, and weight calculations based on interdependencies [39,40].
DEMATEL demonstrates graphically and statistically the relevance and intensity of relationships [41]. It represents and quantifies the degree to which complex system elements are interdependent [42]. Crisp values frequently indicate human judgments for determining the interaction between components when DEMATEL is applied. In contrast, in the real world, exact values are often inadequate [43]. Fuzzy logic is necessary because people’s preferences are typically ambiguous and difficult to quantify with precise numbers. This research employs fuzzy set theory and the DEMATEL technique to build a structural model of the interaction between several criteria [44]. In 1965, Lotfi A. Zadeh established the discipline of fuzzy logic to examine the ways in which humans deal with ambiguity and uncertainty when making decisions. Several judgements are brought on by limits and ambiguous, uncertain events, as is evident from an evaluation of decision-making issues in real-world transactions [45]. It is argued that converting linguistic notions into fuzzily defined numbers is better than combining distinct individual or group perspectives, conceptions, or judgments. The fuzzy DEMATEL method necessitates the construction of a causality map, as well as the gathering of impact and causality indicators for each factor. The technique creates the causal diagram and categorizes factors based on their distances from the element’s center and their degrees of cause and effect (into cause groups or effect groups). In the end, it presents several suggestions for further research and managerial implications. Last but not least, it highlights key elements that facilitate more effective problem-solving [46].
The TOPSIS ranking approach is well-known for its ability to rank alternatives in descending order of importance. According to TOPSIS, the optimal decision is the one that is most similar to the optimal positive solution and most different from the optimal negative solution. As a result, the optimal solution is one that maximizes benefits while minimizing costs. This means the worst possible values for each criterion may be found in the negative ideal solution, while the best possible values can be found in the perfect solution [47]. One of TOPSIS’s main advantages is that it ranks alternatives by their influence using unlimited data for each indication [48]. Dos Santos et al. [49] proposed that TOPSIS be used with other MCDM methods to provide more efficient and flexible problem-solving. MCDM methods have been used more frequently in recent research, individually or in combination with other MCDM approaches. In recent studies, hybridizations of MCDM approaches, such as DEMATEL and TOPSIS, have been observed [50,51,52,53,54]: DEMATEL, TOPSIS, ANP [55,56,57], AHP-BWM [58], and DEMATEL, AHP and TOPSIS [59,60,61]. The literature review revealed that no prior studies had presented a hybrid integrated fuzzy DEMATEL-TOPSIS to investigate how I4.0 technologies can affect MSOs.

3. Research Methodology

This section demonstrates a hybrid MCDM method to help decision makers evaluate and rank the impact of I4.0 technologies on MSOs. Figure 3 shows the I4.0 technologies and MSOs evaluation network. This study’s experts were chosen according to their expertise and experience [62]. According to [63], The minimum required of experience for an acceptable expert is ten years, either in academia, industry, or both. The majority of the selected manufacturing firms were active participants in I4.0. Research participants include top-level executives, general managers, department heads, specialist engineers, academics, and professionals working in manufacturing strategies related to industrial organizations, with an emphasis on MSOs. Specialists need in-depth knowledge of the manufacturing process, focusing on smart manufacturing techniques.
Experts are also expected to have experience with I4.0 technologies, either from a theoretical or practical perspective. Their responsibilities may have included market strategy and operations. As a result, they have a deep understanding of production methods. Experts in the field of academia were similarly selected among professors and PhDs, who have contributed to scholarly journals with works on industry 4.0.
A personal interview was conducted with an expert explaining the research and an online interview with those unable to attend in person. Initial participants were contacted via email to confirm their participation and explain the study’s goals. Most experts responded positively. Unfortunately, only 14 of the planned professional respondents filled out the surveys in their entirety. Therefore, the selected academic experts significantly contributed significantly to this sector.

Proposed Model

In order to attain market competitiveness, a hybrid MCDM for ranking I4.0 technologies is developed. It can be accomplished using the following phases.
  • Phase 1. Constricting the MCDM model
Figure 4 illustrates the phases of the evaluation model designed for the impact of I4.0 technologies on MSOs’ evaluation networks. In the first phase, researchers reviewed the literature related to this topic and documented their findings; we focused on the I4.0 concept and its associated technologies and manufacturing strategies. We reviewed past works on I4.0 technologies and conducted interviews with experts. With the experts’ agreement, a primary network was established. The evaluation’s scope was determined and then a framework was built for this network.
  • Phase 2. Fuzzy DEMATEL Method
Several types of research have effectively used the DEMATEL method to evaluate the factors about knowledge and expert practices in the context of MCDM issues. The FDEMATEL was used to find interrelationships and establish the weights for criteria. The three numbers (l, m, r) represent a triangular fuzzy number, l for the most pessimistic, and r for the most optimistic. Equation (2) explains the triangle fuzzy number membership function.
Z k = C 1 C 2 C n [ [ 0 , 0 , 0 ] x k 12 x k 21 [ 0 , 0 , 0 ] x k 1 n x k 2 n x k n 1 x k n 2 [ 0 , 0 , 0 ] ]
μ N   ( x ) = { 0 , x < l x l m l   , l x m r x l m , m x r 0 , x > r
where l represents the fuzzy left score, r is the fuzzy right score, and m is the fuzzy center score of the triangle. The steps of the fuzzy DEMATEL approach are as follows [27,54,55]:
Step 1. Create a fuzzy scale, decision goals, and criteria (C, Q, D, F, P I);
Step 2. Choose experts with relevant knowledge and experience to compare pairwise effects;
Step 3. Create a semantic evaluation form that categorizes the degree of influence between various factors into the five categories listed in Table 2. The form needs to be simple to read and understand;
Step 4. Obtain the initial direct influence matrix. The interpretation of the semantic assessment table by experts should be used to generate a direct effect matrix;
Step 5. In order to account for uncertainty in human judgments, convert the direct impact from step three into fuzzy triangular values, as shown in Table 2;
Step 6. Create fuzzy direct-relation matrices  Z K    by having evaluators create fuzzy pairwise impact correlations between components in a n x n matrix, where k is the number of experts;
Step 7. Once the numbers are defuzzed using the CSCF method, the overall score can be determined by taking the weighted average of the left and right scores of the membership function. This approach is the most effective in the literature for producing consistent outcomes [65,66]. The CFCS method determines the maximum and minimum fuzzy values within a fuzzy number range. The overall score is defined as a weighted average based on membership functions. Each population score results in a fresh beginning influence matrix. Listed below are the detailed procedures:
Normalize the fuzzy triangular numbers, where 0 ≤   x i j  ≤ 1:
x l k i j = l k i j m i n l k i j Δ m i n m a x  
x m k i j = m k i j m i n l k i j Δ m i n m a x  
x r k i j = r k i j m i n l k i j Δ m i n m a x  
Δ m i n m a x = m a x r k i j m i n l k i j
Calculate the left and right normalized scores:
x l s k i j = x m k i j ( 1 + x m k i j x l k i j )
x r s k i j = x r k i j ( 1 + x r k i j x m k i j )
Obtain the crisp values:
x k i j = x l s k i j ( 1 x l s k i j   ) + x r s k i j x r s k i j ( 1 x l k i j + x r s k i j )
Create the total normalized crisp values of the expert, k:
z k i j = m i n l k i j + x k i j Δ m i n m a x
Collect the crisp normalized values for each factor to construct the direct relationship matrix:
z i j = Z 1 i j + Z 2 i j + + Z n i j n
The initial direct influence matrix is utilized to generate a standardized direct influence matrix, where    X = [ x i j ] n n , and 0 ≤   x i j  ≤ 1. The calculation is as follows:
X = s Z
s = 1 max 1 i n j = n m z i j , i , j = 1 , 2 , ,   n .
Compute the influence matrix  T = [ t i j ] n n . The factors  t i j  display the indirect influence between factors i and j. The influence matrix T reflects the entirety of the impact relationship between items. The matrix is computed as follows:
T = lim m ( X + X 2 + X 3 X m ) = X ( 1 X ) 1
Using the following formulas, calculate the degree of each factor’s influence, influenced, center, and cause degree:   D i    Represents the degree to which one factor influences another factor in MSOs.
The   influence   degree :   D i = j = 1 n t i j
The affected degree  R j : How much one factor affects another among a set of MSOs.
The   affected   degree :   R j = i = 1 n t i j
The center degree  ( R j D i ) , indicates the relative importance of factors within the MSOs.
T h e   c e n t e r   d e g r e e = { ( R j + D i ) | i = j }
For the cause degree,
When  R j + D i    Is positive, the factor belongs to the cause group.
When  R j D i    is negative, the factor belongs to the effect group.
T h e   c a u s e   d e g r e e = { ( R j D i ) | i = j }
Step 8. Estimate the relative weights of each criterion by using Equation (19).
w i = R j + D i i = 1 n R j + D i
  • Fuzzy TOPSIS method
Chen [67] created the fuzzy TOPSIS method for solving uncertain MCDM problems. Decision makers  D r ( r   =   1 ,   ,   k )  estimate criteria weights and alternative evaluations using linguistic data. Thus,  W r j    represents the importance of the  j t h  criterion,  C j  (j = 1,…, m), outlined by the  r t h  decision maker. Similarly,  W r j    represents the score of the  i t h    I4.0 technology (alternatives),  A i  (i = 1, 2, …, n), regarding criterion j, as indicated by the  r t h  decider. The fuzzy triangular numbers required by fuzzy TOPSIS are presented in Table 3. Under these assumptions, the procedure includes the following [68,69,70]:
Step 1. As shown by Equations (20) and (21), aggregate the relative significances and evaluations of alternatives provided by k decision makers.
W j = 1 k [ W j 1 + W j 2 + + W j k ]  
x j = 1 k [ x j 1 + x j 2 + + x j k ]
Step 2. Use Equations (22) and (23) to combine the criteria and alternatives in the fuzzy decision matrix (W).
D = [ . . x 11 x 12 . x 1 m x n 1 x n 2 x nm ]
W j = [ W 1   + W 2 + + W m ]
Step 3. The fuzzy decision matrix can be normalized via a linear-scale transformation (D). The Equations (24)–(26) provide the normalized fuzzy decision matrix R.
R = [ r i j ] m   X   n
r i j = ( l i j u j +   , m i j u j + , u i j u j +   )   and   u j + =   m a x i   u i j ( benefit   criteria )
r i j = ( l j u i j   , l j m i j , l j l i j   )   and   l j =   m a x i   l i j ( cos t   criteria )
Step 4. Multiply the relative importance of each criterion results to the weighted normalized decision matrix V W j , according to the factors of the normalized fuzzy decision matrix,  r i j ,  as shown in the following Equation (27).
V = [ v i j ] m × n
where  v i j  is provided by Equation (28).
v i j = x i j × w i j
Step 5. Determine the fuzzy positive ideal solution (FPIS,  A + ) and fuzzy negative ideal solution (FNIS,  A ) using Equations (29) and (30).
A + = { v 1 + , v j + , , v m + }
A = { v 1 , v j , , v m }
Step 6. Compute the distances  d j +  and  d j  with equations for each possible option (31) and (32).
d j + = j = 1 n d v ( v i j , v j + )
d j = j = 1 n d v ( v i j , v j )
where d is the vertex-based distance between two fuzzy values. This can be demonstrated using the Equation (33).
d ( x , z ) = 1 3 [ ( l x l z ) 2 + ( m m z ) 2 + ( u x u z ) 2 ]
Step 7. Applying Equation (34), determine the closeness coefficient  C C i .
C C i = d j + d j + + d j
Step 8. Determine the decreasing order of the alternatives based on the closeness coefficient,   C C i . The optimal option is the one that is closest to the FPIS and farthest from the FNIS.

4. Results and Discussions

4.1. FDEMATEL Calculations

Experts were provided a questionnaire to determine how each pair of criteria related. “How much influence does each component on the left has on the factor on the right?” was asked for each option. As shown in Table 2, respondents rated their level of satisfaction on a scale from one to five. Table 4 displays the fuzzy triangular numbers of a single expert generated by translating linguistic data to a fuzzy linguistic scale based on the results from the experts. Based on the fuzzy evaluation, the original direct relation matrix is used to compute the crisp value of MSO criteria. As indicated in Table 5, the total relation matrix can be obtained. The impact relation among factors is shown in Table 6. The final results of the DEMATEL analysis are obtained, as shown in Table 7. Figure 5 illustrates the interdependence and relationship of MSOs. As shown in Table 7, the six outputs can be categorized by their respective causes and effects, and previous studies support this finding [26].

4.2. Fuzzy TOPSIS Method

This part discusses how TOPSIS can be used to rank I4.0 technologies. Thus, the factors that most contribute to the overall differentiation of each technology can be identified, establishing a foundation for the development and implementation of effective improvement strategies. Due to space limitations in this study, Table 8 displays a sample of the collected data from one of the experts used to evaluate the alternatives in this study. Both positive and negative, fuzzy ideal solutions are illustrated in Table 9 and Table 10. Consequently, the distances  d j +  and  d j  for each choice and the closeness coefficient  C C i  for I4.0 technologies are displayed in Table 11. Figure 6 shows the closeness coefficients  C C i  as well as the final ranking of I4.0 technologies.
Figure 6 depicts the ranking of I4.0 technologies and their respective closeness coefficients. Using Equation (34), these values were calculated. With a score of 0.714.4, AM outperformed all other Technologies in terms of market competitiveness. Frequently, additive manufacturing is seen as the most essential pillar of the I4.0 transition. This conclusion is supported by value and prior research. The capabilities of conventional production technology physically constrain intelligent factories. Since I4.0 requires mass customization, nontraditional production techniques must be developed [71].
Consequently, studies have shown that additive manufacturing is an essential component of I4.0 [71,72]. AM has become an important technology for making customized items due to its capacity to construct complicated objects with enhanced features (new materials, shapes). Due to its superior product quality, AM is applied in various areas, including aerospace and manufacturing [72]. The second technology is cyber-physical systems with 0.6283. Other technologies’ rankings are shown in Figure 6.
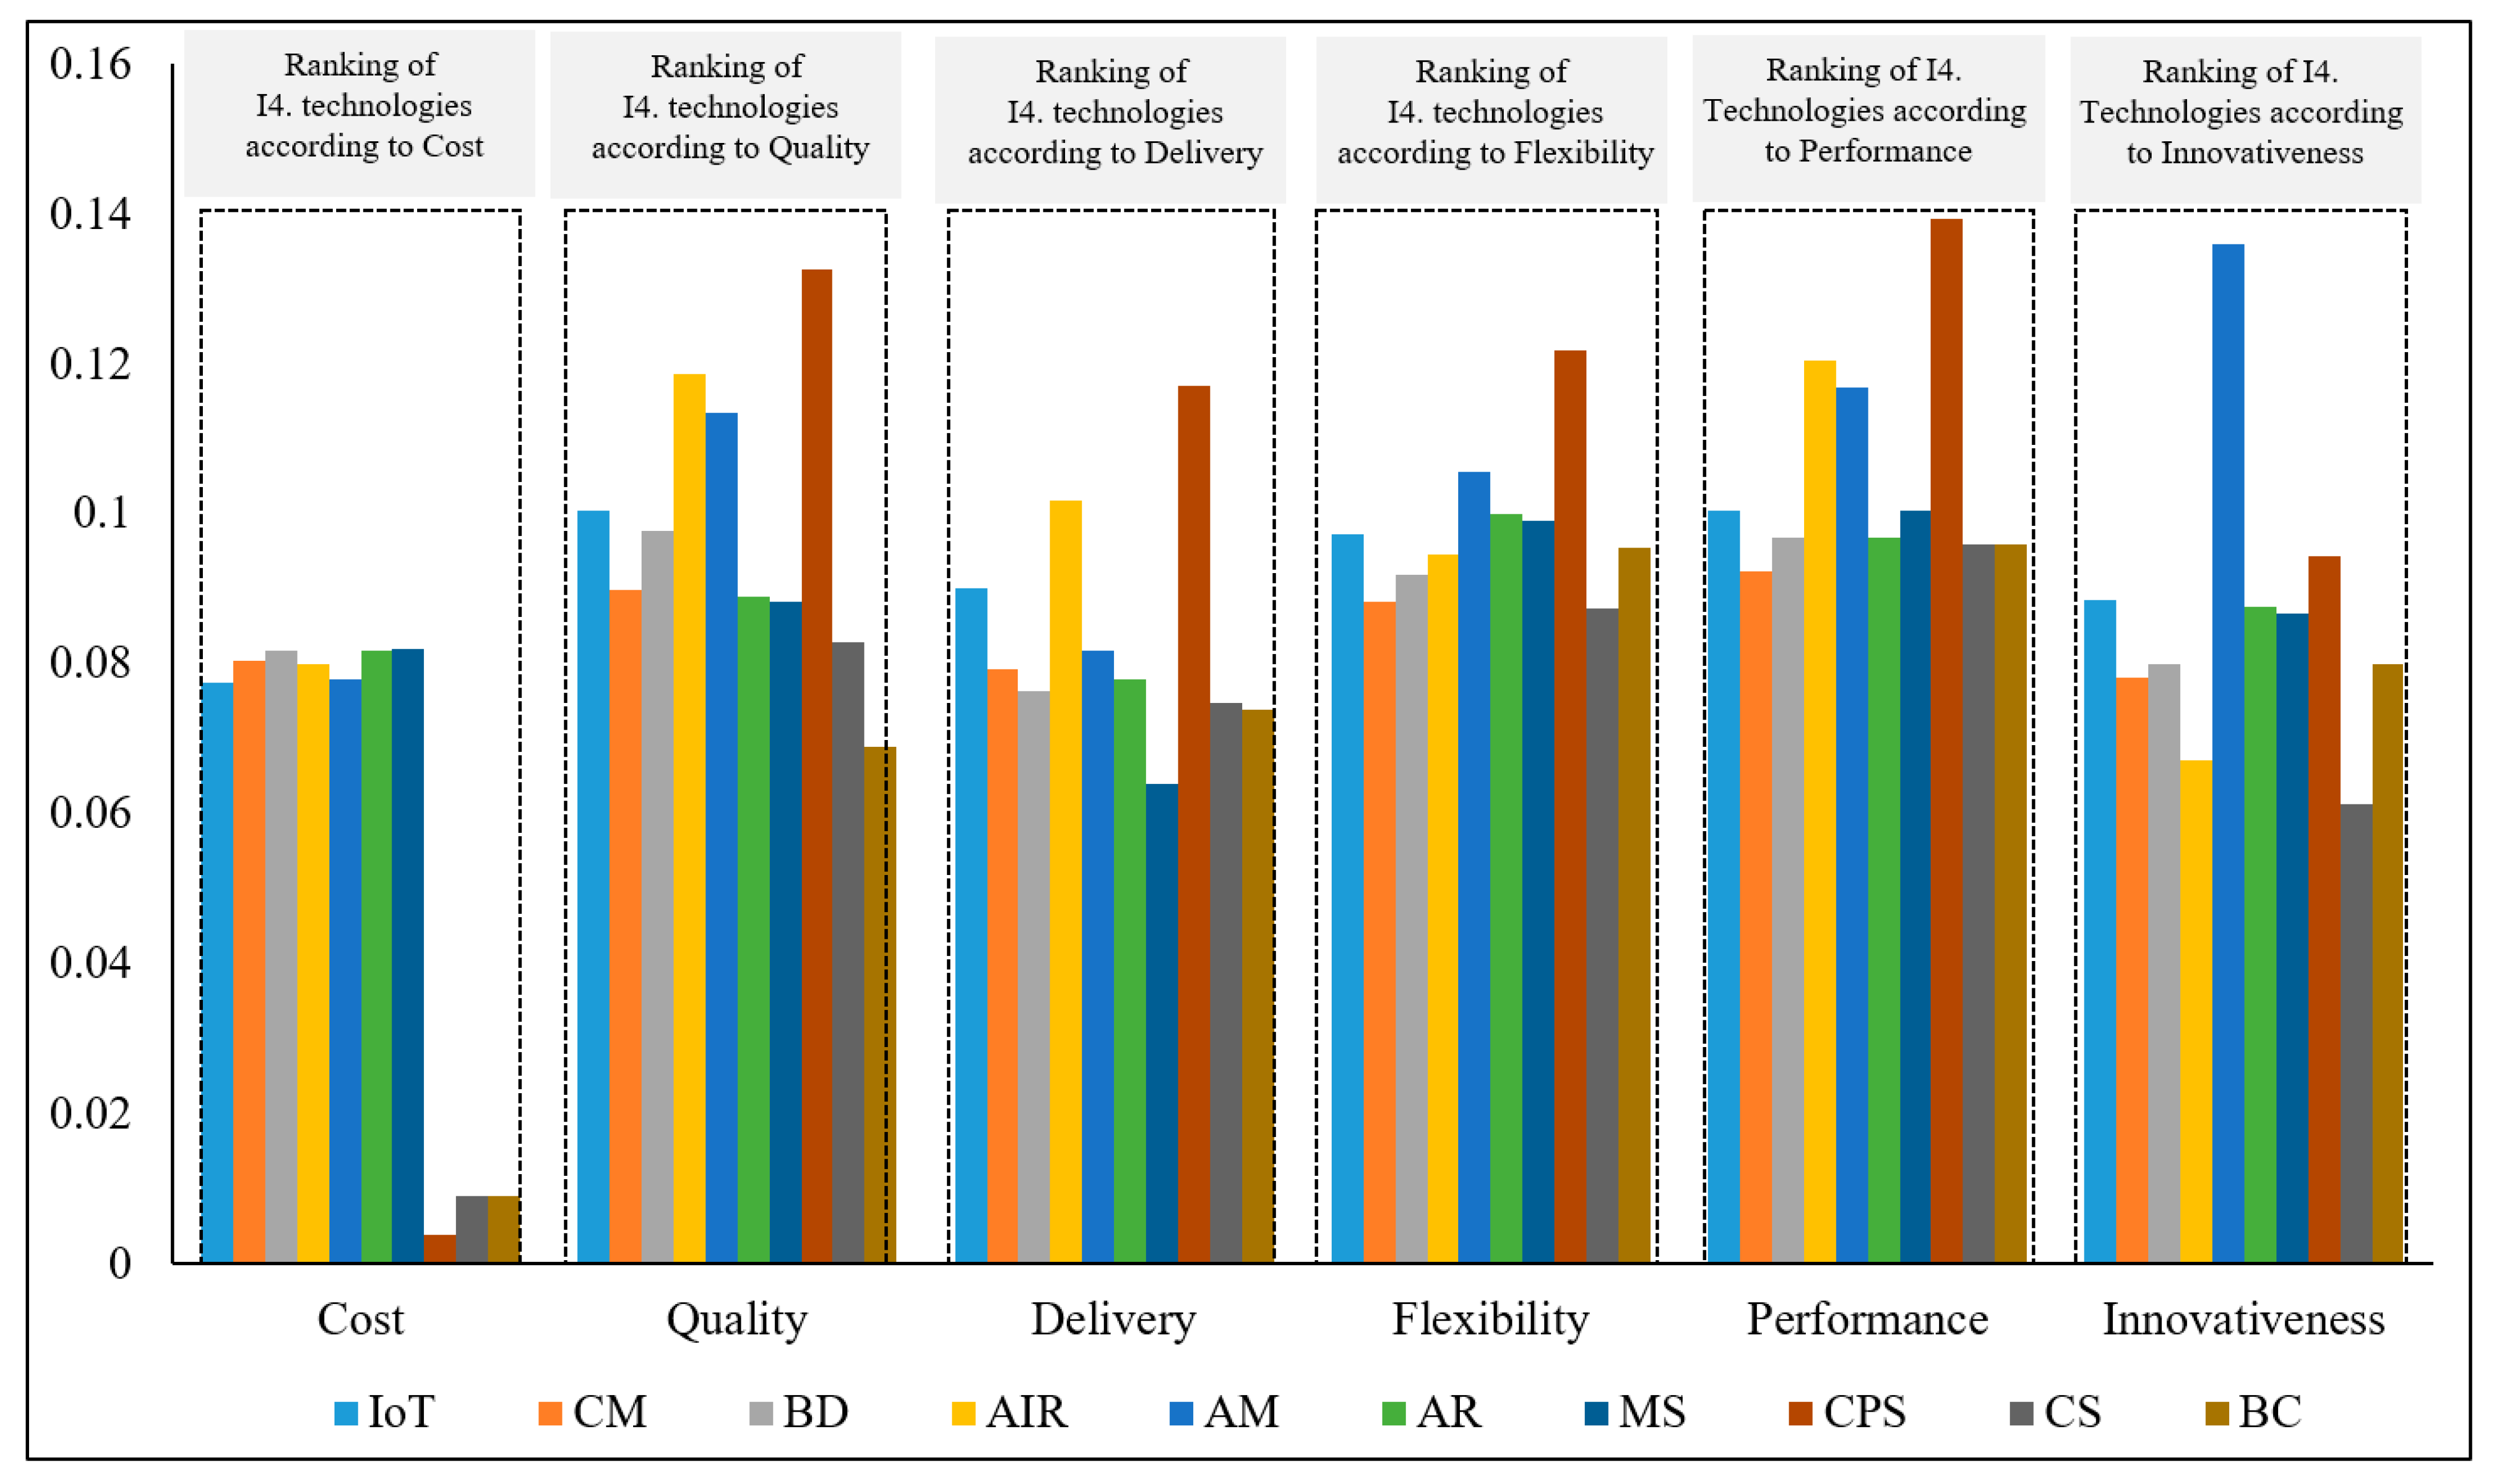
  • The ranking of I4.0 technologies according to each MSOs
To evaluate the I4.0 technologies by each MSO, a weighted normalized average fuzzy decision matrix is used. The results of this ranking are displayed in Figure 7. It shows the relative relationships and the differentiation indices for each MSO’s consolidated findings. The ranking of other I4.0 technologies according to each MSOs is shown in Figure 7. Table 12 demonstrates that the MS technology has the highest total score of 0.10874 out of all the I4.0 technologies concerning cost. This is followed by BD, CM, and AIR, each with scores of 0.10823, 0.10645, and 0.10606, respectively. Consequently, Table 12 reveals that various I4.0 technologies appear moderately or less critical in reducing costs.
The comparison of prior research on the ranking and selection for I4.0 technologies is summarized in Table 13. It indicates that they utilize a different approach for evaluating the influence of I4.0 Technologies on MSOs. The rankings and selection of I4.0 technologies in order to decrease cost, improve flexibility, improve performance, and improve innovativeness are the same. Due to the uncertainty and vagueness of human judgment, there is a small difference in the ranking and selection of I4.0 technologies on quality and delivery, which was not considered in the previously reported study.

5. Implications

Researchers have placed a substantial emphasis on MSO-related I4.0 technologies in recent years. Unfortunately, a well-structured approach is currently lacking to help businesses evaluate and choose the most suitable I4.0 technologies. The purpose of this study is to rank different I4.0 technologies using a hybrid fuzzy MCDM approach and assess their potential and influence on MSOs.
This model provides insightful information to decision makers, practitioners, cluster managers, and smart manufacturing researchers. An important contribution to this field is identifying how I4.0 technologies affect MSOs. As the adoption of smart manufacturing methods develops, firms focus on the manufacturing systems’ characteristics influenced by technology improvements. I4.0 technologies are the essential enablers required to create smart manufacturing systems. However, the degree to which and the specific technologies chosen for this purpose depends on the organization’s strategic decisions regarding the desired level of smartness. The level of smartness describes the organization’s readiness to deploy smart manufacturing for a specific process, manufacturing asset, and facility [73]. In each category, I4.0 technologies must be aligned with long-term strategic objectives to improve manufacturing performance [74,75].
To gain a better understanding of factors affecting MSOs’ adoption of I4.0 technologies, FDEMATEL was utilized to study root cause-and-effect relationships of factors affecting MSOs’ I4.0 adoption [64]. By identifying MSO receivers and dispatchers, the FDEMATEL results support the efficient development and implementation of long-term plans. It has also been used to determine the relative importance of MSO factors. Fuzzy TOPSIS was also utilized to prioritize the alternatives. MSOs are ranked based on a system’s structure and the significant factors that influence it, allowing researchers and manufacturers to understand how I4.0 technologies are ranked.
Based on practical management implications, this report provides managers with critical insights for improving MSOs’ utilization of I4.0 technologies. In order to be competitive in the market and receive useful feedback, managers should prioritize the right I4.0 technologies in their production plans, as shown in this study. This ranking of Technology leads to enhance performance and competition. According to the ranking, organizations may benefit from integrating these technologies into their already-established, well-designed procedures [76]. This study also shows that industrial companies are increasingly recognizing the importance of implementing I4.0 technologies to remain competitive or perhaps boost their market share.

6. Conclusions

This research aims to determine the impact of I4.0 technologies on MSOs. Using a hybrid MCDM approach, the I4.0 technologies are ranked. The contribution of this research is tremendous from both a practical and theoretical perspective. Identifying I4.0 technologies and MSOs contributes to a better understanding of the fourth industrial revolution. Quantitative research into the effects of I4.0 technologies on MSOs was conducted, strengthening the understanding of their interdependence. This research contributed theoretical considerations for future empirical studies of the connection between I4.0 and MSOs, specifically as it relates to MSOs’ efforts to enhance their performance in order to increase their market competitiveness. According to the study’s findings, manufacturers can improve their worldwide competitiveness by adopting I4.0 technologies. The article offers a unique perspective on how MSOs should prioritize I4.0 technologies. By providing a ranking, this article assists businesses to recognize the value in integrating these technologies into their existing, well-thought-out procedures. As a result of this competitiveness was increased and performance was enhanced. Moreover, this research enables firms to shift from conventional to smart manufacturing, demonstrating how these technologies can play a crucial part in gaining a competitive advantage for a business.
The results indicated that cost (C) was the most influential factor, followed by flexibility (F) and performance(P). Other criteria are often of moderate significance to MSOs when adopting I4.0 technologies. Additive manufacturing is the most effective I4.0 technology for competing in the global market, according to the research. Following that are AIR and CPS. Other I4.0 technologies are less important to MSOs for implementation.
In addition to these contributions and findings, this study has a few limitations that will be addressed in future research as follows:
  • It is also possible to evaluate the impact of I4.0 technologies on MSOs using multi-criteria methods such as VIKOR, ELECTRE, GRA, SAW, etc.;
  • So far, no significant case studies or empirical research have been conducted to determine how MSOs are affected by I4.0 technologies. So, an empirical study can be conducted in the future;
  • As an extension of this research, several I4.0 technologies, such as digital twins and others, may be analyzed to enhance manufacturing;
  • The initial criteria were established by identifying six MSOs and ten I4.0 technologies. Broader criteria set may have been applied by examining additional criteria and technologies.

Author Contributions

F.M.A.: Conceptualization, Methodology, Visualization, Investigation, and writing—original draft, writing—review, and editing. A.M.A.-A.: Conceptualization, Investigation, and Funding acquisition. S.A.: Resources, Investigation, writing—review and editing. All authors have read and agreed to the published version of the manuscript.

Funding

The authors extend their appreciation to the Deputyship for Research & Innovation, Ministry of Education in Saudi Arabia for funding this research work through the project no. (IFKSURG-2-764).

Institutional Review Board Statement

Not applicable.

Informed Consent Statement

Not applicable.

Data Availability Statement

All the data are available in the manuscript.

Conflicts of Interest

The authors declare no conflict of interest.

References

  1. Wang, L.; Shih, A.J. Challenges in smart manufacturing. J. Manuf. Syst. 2016, 2, 1. [Google Scholar] [CrossRef]
  2. Li, L. China’s manufacturing locus in 2025: With a comparison of “Made-in-China 2025” and “Industry 4.0”. Technol. Forecast. Soc. Chang. 2018, 135, 66–74. [Google Scholar] [CrossRef]
  3. Lu, Y.; Morris, K.C.; Frechette, S. Current standards landscape for smart manufacturing systems. Natl. Inst. Stand. Technol. NISTIR 2016, 8107. [Google Scholar] [CrossRef]
  4. Sony, M. Industry 4.0 and lean management: A proposed integration model and research propositions. Prod. Manuf. Res. 2018, 6, 416–432. [Google Scholar] [CrossRef] [Green Version]
  5. Wang, S.; Wan, J.; Li, D.; Zhang, C. Implementing smart factory of industrie 4.0: An outlook. Int. J. Distrib. Sens. Netw. 2016, 12, 3159805. [Google Scholar] [CrossRef] [Green Version]
  6. Sung, T.K. Industry 4.0: A Korea perspective. Technol. Forecast. Soc. Chang. 2018, 132, 40–45. [Google Scholar] [CrossRef]
  7. Henning, K.; Wolfgang, W.; Johannes, H. Recommendations for Implementing the Strategic Initiative INDUSTRIE 4.0; Final Report of the Industrie 4.0 Working Group; Industrie 4.0 Working Group; Forschungsunion: Berlin, Germany, 2013; Volume 4, p. 82. [Google Scholar]
  8. Öberg, C.; Graham, G. How smart cities will change supply chain management: A technical viewpoint. Prod. Plan. Control. 2016, 27, 529–538. [Google Scholar] [CrossRef] [Green Version]
  9. Gunasekaran, A.; Subramanian, N.; Ngai, W.T.E. Quality Management in the 21st Century Enterprises: Research Pathway towards Industry 4.0. Int. J. Prod. Econ. 2019, 207, 125–129. [Google Scholar] [CrossRef]
  10. Vaidya, S.; Ambad, P.; Bhosle, S. Industry 4.0—A glimpse. Procedia Manuf. 2018, 20, 233–238. [Google Scholar] [CrossRef]
  11. Cimorelli, S.; Chandler, G. Handbook of Manufacturing Engineering; Walker, J.M., Ed.; Marcel Dekker: New York, NY, USA, 1996. [Google Scholar]
  12. Badurdeen, F.; Jawahir, I.S. Strategies for value creation through sustainable manufacturing. Procedia Manuf. 2017, 8, 20–27. [Google Scholar] [CrossRef]
  13. ElMaraghy, H.; Schuh, G.; ElMaraghy, W.; Piller, F.; Schönsleben, P.; Tseng, M.; Bernard, A. Product variety management. Cirp Ann. 2013, 62, 629–652. [Google Scholar] [CrossRef]
  14. Dohale, V.; Gunasekaran, A.; Akarte, M.M.; Verma, P. 52 Years of manufacturing strategy: An evolutionary review of literature (1969–2021). Int. J. Prod. Res. 2022, 60, 569–594. [Google Scholar] [CrossRef]
  15. Yin, S.; Zhang, N.; Ullah, K.; Gao, S. Enhancing Digital Innovation for the Sustainable Transformation of Manufacturing Industry: A Pressure-State-Response System Framework to Perceptions of Digital Green Innovation and Its Performance for Green and Intelligent Manufacturing. Systems 2022, 10, 72. [Google Scholar] [CrossRef]
  16. Hund, A.; Wagner, H.-T.; Beimborn, D.; Weitzel, T. Digital innovation: Review and novel perspective. J. Strateg. Inf. Syst. 2021, 30, 101695. [Google Scholar] [CrossRef]
  17. Nouvel, F.; Berthelot, F.; Houzet, D. A Flexible system level design methodology targeting run-time reconfigurable FPGAs. EURASIP J. Embed. Syst. 2008, 2008, 793919. [Google Scholar]
  18. Vickers, N.J. Animal communication: When I’m calling you, will you answer too? Curr. Biol. 2017, 27, R713–R715. [Google Scholar] [CrossRef]
  19. Rahman, A.A.A. Revolution of production system for the Industry 4.0. In Mass Production Processes; IntechOpen: London, UK, 2020. [Google Scholar]
  20. Alcácer, V.; Cruz-Machado, V. Scanning the industry 4.0: A literature review on technologies for manufacturing systems. Eng. Sci. Technol. Int. J. 2019, 22, 899–919. [Google Scholar] [CrossRef]
  21. Ghobakhloo, M. The future of manufacturing industry: A strategic roadmap toward Industry 4.0. J. Manuf. Technol. Manag. 2018, 29, 910–936. [Google Scholar] [CrossRef] [Green Version]
  22. Ko, M.; Kim, C.; Lee, S.; Cho, Y. An assessment of smart factories in Korea: An exploratory empirical investigation. Appl. Sci. 2020, 10, 7486. [Google Scholar] [CrossRef]
  23. Parhi, S.; Joshi, K.; Akarte, M. Smart manufacturing: A framework for managing performance. Int. J. Comput. Integr. Manuf. 2021, 34, 227–256. [Google Scholar] [CrossRef]
  24. Abdullah, F.M.; Al-Ahmari, A.M.; Anwar, S. Analyzing Interdependencies among Influencing Factors in Smart Manufacturing. Sustainability 2023, 15, 3864. [Google Scholar] [CrossRef]
  25. Abdullah, F.M.; Saleh, M.; Al-Ahmari, A.M.; Anwar, S. The Impact of Industry 4.0 Technologies on Manufacturing Strategies: Proposition of Technology-Integrated Selection. IEEE Access 2022, 10, 21574–21583. [Google Scholar] [CrossRef]
  26. Abdullah, F.M.; Al-Ahmari, A.M.; Anwar, S. Exploring Key Decisive Factors in Manufacturing Strategies in the Adoption of Industry 4.0 by Using the Fuzzy DEMATEL Method. Processes 2022, 10, 987. [Google Scholar] [CrossRef]
  27. Abdullah, F.M.; Al-Ahmari, A.M.; Anwar, S. A Hybrid Fuzzy Multi-Criteria Decision-Making Model for Evaluating the Influence of Industry 4.0 Technologies on Manufacturing Strategies. Machines 2023, 11, 310. [Google Scholar] [CrossRef]
  28. Corrêa, H.L. Agile Manufacturing as the 21” Century Strategy for Improving Manufacturing. In Agile Manufacturing: The 21st Century Competitive Strategy; São Paulo, Brazil, 2001; p. 3. [Google Scholar]
  29. Miltenburg, J. Setting manufacturing strategy for a factory-within-a-factory. Int. J. Prod. Econ. 2008, 113, 307–323. [Google Scholar] [CrossRef]
  30. Miltenburg, J. Setting manufacturing strategy for a company’s international manufacturing network. Int. J. Prod. Res. 2009, 47, 6179–6203. [Google Scholar] [CrossRef]
  31. May, G.; Kiritsis, D. Zero Defect Manufacturing Strategies and Platform for Smart Factories of Industry 4.0. In Proceedings of the International Conference on the Industry 4.0 Model for Advanced Manufacturing, Belgrade, Serbia, 3–6 June 2019; pp. 142–152. [Google Scholar]
  32. Tortorella, G.L.; Fettermann, D. Implementation of Industry 4.0 and lean production in Brazilian manufacturing companies. Int. J. Prod. Res. 2018, 56, 2975–2987. [Google Scholar] [CrossRef]
  33. Ghobakhloo, M.; Fathi, M. Corporate survival in Industry 4.0 era: The enabling role of lean-digitized manufacturing. J. Manuf. Technol. Manag. 2019, 31, 1–30. [Google Scholar] [CrossRef]
  34. Tortorella, G.L.; Giglio, R.; van Dun, D.H. Industry 4.0 adoption as a moderator of the impact of lean production practices on operational performance improvement. Int. J. Oper. Prod. Manag. 2019, 39, 860–886. [Google Scholar] [CrossRef]
  35. Govindan, K.; Kannan, D.; Mathiyazhagan, K.; Jabbour, A.B.L.D.S.; Jabbour, C.J.C. Analysing green supply chain management practices in Brazil’s electrical/electronics industry using interpretive structural modelling. Int. J. Environ. Stud. 2013, 70, 477–493. [Google Scholar] [CrossRef]
  36. Wu, C.; Barnes, D. An integrated model for green partner selection and supply chain construction. J. Clean. Prod. 2016, 112, 2114–2132. [Google Scholar] [CrossRef] [Green Version]
  37. Kannan, D.; Khodaverdi, R.; Olfat, L.; Jafarian, A.; Diabat, A. Integrated fuzzy multi criteria decision making method and multi-objective programming approach for supplier selection and order allocation in a green supply chain. J. Clean. Prod. 2013, 47, 355–367. [Google Scholar] [CrossRef]
  38. Wu, G.-C.; Ding, J.-H.; Chen, P.-S. The effects of GSCM drivers and institutional pressures on GSCM practices in Taiwan’s textile and apparel industry. Int. J. Prod. Econ. 2012, 135, 618–636. [Google Scholar] [CrossRef]
  39. Huang, C.-Y.; Shyu, J.Z.; Tzeng, G.-H. Reconfiguring the innovation policy portfolios for Taiwan’s SIP Mall industry. Technovation 2007, 27, 744–765. [Google Scholar] [CrossRef]
  40. Tzeng, G.-H.; Chiang, C.-H.; Li, C.-W. Evaluating intertwined effects in e-learning programs: A novel hybrid MCDM model based on factor analysis and DEMATEL. Expert Syst. Appl. 2007, 32, 1028–1044. [Google Scholar] [CrossRef]
  41. Manafzadeh, E.; Ramezani, A. Identifying and prioritizing the effect of marketing mix from the customer’s perspective (4C) on the competitiveness of insurance companies using DEMATEL technique: A case study of Tehran Insurance Companies. Mark. Brand. Res. 2016, 3, 86–96. [Google Scholar] [CrossRef] [Green Version]
  42. Lee, Y.C.; Hsieh, Y.F.; Guo, Y.B. Construct DTPB model by using DEMATEL: A study of a university library website. Program 2013, 47, 155–169. [Google Scholar] [CrossRef]
  43. Devadoss, A.V.; Felix, A. A Fuzzy DEMATEL approach to study cause and effect relationship of youth violence. Int. J. Comput. Algorithm 2013, 2, 363–372. [Google Scholar]
  44. Altuntas, S.; Yilmaz, M.K. Fuzzy DEMATEL method to evaluate the dimensions of marketing resources: An application in SMEs. J. Bus. Econ. Manag. 2016, 17, 347–364. [Google Scholar] [CrossRef] [Green Version]
  45. Zadeh, L.A.; Klir, G.J.; Yuan, B. Fuzzy Sets, Fuzzy Logic, and Fuzzy Systems: Selected Papers; World Scientific: Singapore, 1996; Volume 6. [Google Scholar]
  46. Ocampo, L.A.; Tan, T.A.G.; Sia, L.A. Using fuzzy DEMATEL in modeling the causal relationships of the antecedents of organizational citizenship behavior (OCB) in the hospitality industry: A case study in the Philippines. J. Hosp. Tour. Manag. 2018, 34, 11–29. [Google Scholar] [CrossRef]
  47. Beikkhakhian, Y.; Javanmardi, M.; Karbasian, M.; Khayambashi, B. The application of ISM model in evaluating agile suppliers selection criteria and ranking suppliers using fuzzy TOPSIS-AHP methods. Expert Syst. Appl. 2015, 42, 6224–6236. [Google Scholar] [CrossRef]
  48. Onat, N.C.; Gumus, S.; Kucukvar, M.; Tatari, O. Application of the TOPSIS and intuitionistic fuzzy set approaches for ranking the life cycle sustainability performance of alternative vehicle technologies. Sustain. Prod. Consum. 2016, 6, 12–25. [Google Scholar] [CrossRef]
  49. Dos Santos, B.M.; Godoy, L.P.; Campos, L.M. Performance evaluation of green suppliers using entropy-TOPSIS-F. J. Clean. Prod. 2019, 207, 498–509. [Google Scholar] [CrossRef]
  50. Sangaiah, A.K.; Subramaniam, P.R.; Zheng, X. A combined fuzzy DEMATEL and fuzzy TOPSIS approach for evaluating GSD project outcome factors. Neural Comput. Appl. 2015, 26, 1025–1040. [Google Scholar] [CrossRef]
  51. Sangaiah, A.K.; Thangavelu, A.K. An exploration of FMCDM approach for evaluating the outcome/success of GSD projects. Cent. Eur. J. Eng. 2013, 3, 419–435. [Google Scholar] [CrossRef] [Green Version]
  52. Gopal, J.; Sangaiah, A.K.; Basu, A.; Gao, X.Z. Integration of fuzzy DEMATEL and FMCDM approach for evaluating knowledge transfer effectiveness with reference to GSD project outcome. Int. J. Mach. Learn. Cybern. 2018, 9, 225–241. [Google Scholar] [CrossRef]
  53. Baykasoğlu, A.; Kaplanoğlu, V.; Durmuşoğlu, Z.D.; Şahin, C. Integrating fuzzy DEMATEL and fuzzy hierarchical TOPSIS methods for truck selection. Expert Syst. Appl. 2013, 40, 899–907. [Google Scholar] [CrossRef]
  54. Bao, Y.; Zhang, X.; Zhou, T.; Chen, Z.; Ming, X. Application of Industrial Internet for Equipment Asset Management in Social Digitalization Platform Based on System Engineering Using Fuzzy DEMATEL-TOPSIS. Machines 2022, 10, 1137. [Google Scholar] [CrossRef]
  55. Chen, J.-K.; Chen, I.-S. Using a novel conjunctive MCDM approach based on DEMATEL, fuzzy ANP, and TOPSIS as an innovation support system for Taiwanese higher education. Expert Syst. Appl. 2010, 37, 1981–1990. [Google Scholar] [CrossRef]
  56. Ocampo, L.; Deiparine, C.B.; Go, A.L. Mapping strategy to best practices for sustainable food manufacturing using fuzzy DEMATEL-ANP-TOPSIS. Eng. Manag. J. 2020, 32, 130–150. [Google Scholar] [CrossRef]
  57. Wu, L.-C.; Chang, K.-L.; Liao, S.-K. A hybrid MCDM model to select optimal hosts of variety shows in the social media era. Symmetry 2020, 12, 125. [Google Scholar] [CrossRef] [Green Version]
  58. Bathrinath, S.; Dhanasekar, M.; Dhanorvignesh, B.; Kamaldeen, Z.; Santhi, B.; Bhalaji, R.; Koppiahraj, K. Modeling sustainability risks in sugar industry using AHP-BWM. Mater. Today Proc. 2022, 50, 1397–1404. [Google Scholar] [CrossRef]
  59. Sathyan, R.; Parthiban, P.; Dhanalakshmi, R.; Sachin, M. An integrated Fuzzy MCDM approach for modelling and prioritising the enablers of responsiveness in automotive supply chain using Fuzzy DEMATEL, Fuzzy AHP and Fuzzy TOPSIS. Soft Comput. 2023, 27, 257–277. [Google Scholar] [CrossRef]
  60. Petrovic, I.; Kankaras, M. A hybridized IT2FS-DEMATEL-AHP-TOPSIS multicriteria decision making approach: Case study of selection and evaluation of criteria for determination of air traffic control radar position. Decis. Mak. Appl. Manag. Eng. 2020, 3, 146–164. [Google Scholar] [CrossRef]
  61. Agrawal, V.; Seth, N.; Dixit, J.K. A combined AHP–TOPSIS–DEMATEL approach for evaluating success factors of e-service quality: An experience from Indian banking industry. Electron. Commer. Res. 2022, 22, 715–747. [Google Scholar] [CrossRef]
  62. Tortorella, G.L.; Pradhan, N.; Macias de Anda, E.; Trevino Martinez, S.; Sawhney, R.; Kumar, M. Designing lean value streams in the fourth industrial revolution era: Proposition of technology-integrated guidelines. Int. J. Prod. Res. 2020, 58, 5020–5033. [Google Scholar] [CrossRef]
  63. Baker, J.; Lovell, K.; Harris, N. How expert are the experts? An exploration of the concept of ‘expert’ within Delphi panel techniques. Nurse Res. 2006, 14, 59–70. [Google Scholar] [CrossRef] [Green Version]
  64. Lin, R.-J. Using fuzzy DEMATEL to evaluate the green supply chain management practices. J. Clean. Prod. 2013, 40, 32–39. [Google Scholar] [CrossRef]
  65. Vinodh, S.; Devadasan, S.; Vasudeva Reddy, B.; Ravichand, K. Agility index measurement using multi-grade fuzzy approach integrated in a 20 criteria agile model. Int. J. Prod. Res. 2010, 48, 7159–7176. [Google Scholar] [CrossRef]
  66. Opricovic, S.; Tzeng, G.-H. Defuzzification within a multicriteria decision model. Int. J. Uncertain. Fuzziness Knowl.-Based Syst. 2003, 11, 635–652. [Google Scholar] [CrossRef]
  67. Chen, C.-T. Extensions of the TOPSIS for group decision-making under fuzzy environment. Fuzzy Sets Syst. 2000, 114, 1–9. [Google Scholar] [CrossRef]
  68. Jumarni, R.F.; Zamri, N. An integration of fuzzy TOPSIS and fuzzy logic for multi-criteria decision making problems. Int. J. Eng. Technol. 2018, 7, 102–106. [Google Scholar] [CrossRef] [Green Version]
  69. Basahel, A.; Taylan, O. Using fuzzy AHP and fuzzy TOPSIS approaches for assessing safety conditions at worksites in construction industry. Int. J. Saf. Secur. Eng. 2016, 6, 728–745. [Google Scholar] [CrossRef]
  70. Carnero, M.C. Developing a fuzzy TOPSIS model combining MACBETH and fuzzy shannon entropy to select a gamification App. Mathematics 2021, 9, 1034. [Google Scholar] [CrossRef]
  71. Dilberoglu, U.M.; Gharehpapagh, B.; Yaman, U.; Dolen, M. The role of additive manufacturing in the era of industry 4.0. Procedia Manuf. 2017, 11, 545–554. [Google Scholar] [CrossRef]
  72. Zawadzki, P.; Żywicki, K. Smart product design and production control for effective mass customization in the Industry 4.0 concept. Manag. Prod. Eng. Rev. 2016, 7, 105–112. [Google Scholar] [CrossRef]
  73. Lu, Y. Industry 4.0: A survey on technologies, applications and open research issues. J. Ind. Inf. Integr. 2017, 6, 1–10. [Google Scholar] [CrossRef]
  74. Zhang, X.; Peek, W.A.; Pikas, B.; Lee, T. The transformation and upgrading of the Chinese manufacturing industry: Based on “German Industry 4.0”. J. Appl. Bus. Econ. 2016, 18, 97–105. [Google Scholar]
  75. Kulkarni, S.; Verma, P.; Mukundan, R. Assessing manufacturing strategy definitions utilising text-mining. Int. J. Prod. Res. 2019, 57, 4519–4546. [Google Scholar] [CrossRef]
  76. Rossini, M.; Costa, F.; Tortorella, G.L.; Portioli-Staudacher, A. The interrelation between Industry 4.0 and lean production: An empirical study on European manufacturers. Int. J. Adv. Manuf. Technol. 2019, 102, 3963–3976. [Google Scholar] [CrossRef]
Figure 1. Smart manufacturing framework.
Processes 11 00906 g001
Figure 2. Industry 4.0 Technologies.
Processes 11 00906 g002
Figure 3. I4.0 technologies on MSOs evaluation network.
Processes 11 00906 g003
Figure 4. A hybrid MCDM evaluation model.
Processes 11 00906 g004
Figure 5. Interrelationships among MSOs.
Processes 11 00906 g005
Figure 6. I4.0 technologies ranking.
Processes 11 00906 g006
Figure 7. The ranking of I4.0 technologies according to MSOs.
Processes 11 00906 g007
Table 1. Manufacturing strategies outputs [23,30].
CriteriaDescription
CostMaintaining market-competitive rates while reducing total costs.
QualityMaintaining a high degree of customer satisfaction while establishing and maintaining rigorous standards, quality control, and management procedures.
DeliveryThe time between receiving an order and delivering it to the customer.
FlexibilityAbility to offer customized products and services and raise or reduce the number of existing products to respond quickly to customer demands.
PerformanceProduct features and their ability to achieve things other products cannot.
InnovativenessQuickly introducing new products or redesigning current ones.
Table 2. Fuzzy triangular numbers used in FDEMATEL [24,64].
Linguistic TermsSymbolFuzzy Triangular Numbers
No impactNO(0.00,0.10,0.30)
Very low impactVL(0.10,0.30,0.50)
Low impactL(0.30,0.50,0.70)
High impactH(0.50,0.70,0.90)
Very high impactVH(0.70,0.90,1.00)
Table 3. Fuzzy TOPSIS scale.
The Extent of the InfluenceFuzzy Triangular Number
Very high impact (VH)7.00 9.00 9.00
High impact (H)5.00 7.00 9.00
Medium impact (M)3.00 5.00 7.00
Low impact (L)1.00 3.00 5.00
Very Low impact (VL)1.00 1.00 3.00
Table 4. Fuzzy direct-influence matrix.
MSOsCQDFPI
C1110.50.70.90.50.70.90.10.30.50.30.50.70.50.70.9
Q0.70.9111100.10.300.10.30.50.70.90.10.30.5
D0.50.70.900.10.31110.50.70.90.30.50.700.10.3
F0.30.50.70.10.30.50.70.911110.50.70.90.30.50.7
P0.50.70.90.50.70.90.30.50.70.10.30.51110.30.50.7
I0.50.70.90.30.50.70.30.50.70.50.70.90.70.91111
Table 5. The total relation matrix.
CQDFPI
C2.0292331.7955131.6179311.6946321.7644291.658888
Q1.7357881.6785831.3370941.4550121.601321.387805
D1.5147061.2636461.3884541.3719731.233731.150883
F1.8416841.6654351.58551.7793871.6957421.576388
P1.8337821.7032861.4304951.5987281.7877551.531724
I1.7427211.5499351.357261.6002361.5782451.612278
The threshold is 1.5.
Table 6. The impact relation among factors.
CQDFPI
C2.0292331.7955131.6179311.6946321.7644291.658888
Q1.7357881.678583001.601320
D1.51470600000
F1.8416841.6654351.58551.7793871.6957421.576388
P1.8337821.70328601.5987281.7877551.531724
I1.7427211.54993501.6002361.5782451.612278
Table 7. Final results of DEMATEL analysis.
RDR+DR−DDispatcherReceiverWeightsRank
C10.5610.7021.26−0.14 R0.185991
Q9.209.6618.85−0.46 R0.164934
D7.928.7216.64−0.79 R0.145586
F10.149.5019.640.64D 0.171862
P9.899.6619.550.22D 0.171013
I9.448.9218.360.52D 0.160625
Table 8. An example of collected data.
MSOsIoTCMBDAIRAMARMSCPSCSBC
CHMMHHLLHLM
QMLHVHHMMVHLM
DVHMLHLLMHLM
FHMLMVHHHHLM
PHMHHMLHVHHH
ILLLLVHMMHVLL
Table 9. Distance from fuzzy positive ideal solution (FPIS).
MSOsIoTCMBDAIRAMARMSCPSCSBC
C0.008040.003000.000670.003500.007120.000670.000000.106090.098190.09819
Q0.044450.052900.046050.021380.024370.053820.054770.000000.060930.06659
D0.038510.046700.050080.020320.044410.048340.055150.000000.051900.05283
F0.030090.042410.037170.033490.022930.027100.028040.000000.043760.03232
P0.049780.057800.053030.024530.027900.053030.049780.000000.053930.05393
I0.058290.071870.069480.073610.000000.059340.060400.051520.081900.06948
  d j + 0.229160.274670.256480.176830.126740.242300.248150.157610.390610.37334
Table 10. Distance from fuzzy negative ideal solution (FNIS).
MSOsIoTCMBDAIRAMARMSCPSCSBC
C0.10480.10550.10600.10540.10490.10600.10610.00000.00800.0080
Q0.03940.02600.03570.05310.04590.02520.02440.06660.02140.0000
D0.03370.02090.01910.03950.02300.01980.00130.05600.01870.0187
F0.01730.00160.00790.01260.03150.02210.02050.04380.00000.0142
P0.01410.00000.00780.03450.02990.00780.01410.05780.00630.0063
I0.03360.02240.02370.01030.08190.03240.03130.04220.00000.0237
  d j 0.242860.176420.200180.255430.317070.213250.197670.266360.054360.07085
Table 11. Fuzzy TOPSIS final result.
I4.0 T.FPIS ( d i + )   FNIS   ( d i )   C C i Rank
IoT0.2290.2430.51454
CM0.2750.1760.39118
BD0.2560.2000.43847
AIR0.1770.2550.59093
AM0.1270.3170.71441
AR0.2420.2130.46815
MS0.2480.1980.44346
CPS0.1580.2660.62832
CS0.3910.0540.122210
BC0.3730.0710.15959
Table 12. The weighted normalized average fuzzy decision matrix.
MSOsIoTCMBDAIRAMARMSCPSCSBC
Cost0.102590.106450.108230.106060.103290.108230.108740.005240.011920.01192
Quality0.119350.106900.116240.141150.134920.105860.104820.157760.098600.08199
Delivery0.066850.058850.056560.075420.060560.057700.047420.086840.055420.05485
Flexibility0.092420.083780.087240.089830.100190.095010.094140.115740.082920.09069
Performance0.080980.074410.078060.097030.094110.078060.080980.112350.077330.07733
Innovativeness0.081550.072140.073710.061950.125460.080770.079980.087040.056460.07371
Table 13. Comparisons between previous results and current findings considering I4.0 technologies selections.
Research FindingsPrevious Study [25]Technology Guideline Selection
Method UsedA Hybrid MCDMZ-Score
Data CollectionExpert OpinionsExpert Opinions
CostMSMSFirst
BDBDSecond
QualityCPSAIRFirst
AIRBDSecond
DeliveryCPSBDFirst
AIRIoTSecond
FlexibilityAMAMFirst
CPSCPSSecond
PerformanceCPSCPSFirst
AIRAIRSecond
InnovativenessAMAMFirst
CPSCPSSecond
Disclaimer/Publisher’s Note: The statements, opinions and data contained in all publications are solely those of the individual author(s) and contributor(s) and not of MDPI and/or the editor(s). MDPI and/or the editor(s) disclaim responsibility for any injury to people or property resulting from any ideas, methods, instructions or products referred to in the content.

