Abstract
During current times, it is acknowledged that there is the often presence of extreme meteorological phenomena including floods and landslides, due to heavy rains, large wildfires, due to heat or droughts, permafrost melting, etc. At this stage, the world admits that anthropic activities have an important impact on these phenomena and considers that greenhouse gases are at the core of this climate change. The most common greenhouse gasses have general formulae COX and/or NOX, and they are released during different energy generating/conversion processes such as electric energy generation from fossil fuels or mechanical energy obtained from by-products of fossil fuels. Once acknowledged, the world’s countries have developed long-term strategies to eliminate gradually the release of these gases directly into Earth’s atmosphere. E.g., the EU aims to be climate-neutral by 2050; i.e., its economy will have net-zero greenhouse gas emissions. For this to happen, different effective methodologies have been drafted and implemented with underground gas storage in hydrocarbon depleted geological formations and/or saline aquifers being ones of significance when it comes to electric energy generation from fossil fuels in controlled spaces. The paper presents the simulation of capturing and injecting of these greenhouse gases through injection wells in neighboring depleted natural gas reservoirs using commercial numerical simulators for the Iernut natural gas (CH4) burning power plant which is one of Romania’s most important gas plants. Within this simulation study, the total CO2 quantity that can be stored via the proposed carbon capture and sequestration study and the proportion of each of the three CO2 storage mechanisms involved in the process (physical trapping, hydrodynamic trapping, and geochemical trapping) were determined and presented. Even though previous local studies investigated the potential of CO2 storage and sequestration into the Romanian underground reservoirs, none of it considered using the depleted hydrocarbon reservoirs surrounding the Iernut power plant for this process.
1. Introduction
The concept of clean energy becomes more popular by the day. The same goes for the countries and national or international energy companies which state that they aim to be climate-neutral by 2050. Now, still, these companies and countries are relying considerably on hydrocarbon fuels and, considering the future demand expectations, these fuels are not to stop from being produced as the knowledge acquired in the past 175 years cannot simply be let go. The transition to climate-neutral societies will interfere with industries, mobility, buildings, agriculture, and forestry.
A climate-neutral society is one in which greenhouse gases and/or noxes are not being released directly in Earth’s atmosphere. A greenhouse gas is a gas that absorbs and emits radiant energy within the thermal infrared range. Greenhouse gases cause the greenhouse effect on planets. The primary greenhouse gases in Earth’s atmosphere are water vapor (H2O), carbon dioxide (CO2), methane (CH4), nitrous oxide (N2O), and ozone (O3). Without greenhouse gases, the average temperature of Earth’s surface would be about −18 °C (0 °F), rather than the present average of 15 °C (59 °F). The atmospheres of Venus, Mars, and Titan also contain greenhouse gases. Nitrogen oxides (NOx) act as indirect greenhouse gases by producing the tropospheric greenhouse gas ‘ozone’ via photochemical reactions in the atmosphere.
Out of the Cox and Nox families of gases, the most important one causing our planet’s climate change is CO2 [1,2,3,4,5].
Before capturing and storing CO2, it is important to assess its sources. The attractiveness of a CO2 source for capture depends on its volume, concentration, partial pressure, integrated system aspects, and its vicinity to a suitable reservoir. Emissions of CO2 arise from several sources, mainly fossil fuels combustion in the power generation, industrial, residential, and transport sectors. In the power generating and industrial sectors, many sources have large emission volumes that make them more amenable to the addition of CO2 capture technology. Large numbers of small point sources and mobile sources, in the case of transport, characterize the other sectors, making them less amenable for capture at present; however, important progress is being made in the case of usage of electrical vehicles and their required power batteries. Over 7500 large CO2 emission sources (above 0.1 MtCO2/year—Megatons CO2/year) have been identified geographically around the world [6].
As for the other countries of the world, Romania is making the transition toward an economy with lower emissions of greenhouse gasses through building and reconditioning power plants based on natural gasses burning, a process which, indeed, generates less CO2; however, it still generates some. The next step would be to capture these flue gasses released in these plants and to inject them for storing in nearby geological formations. This process can also be applied for the coal burning power plants. Romania’s targets on capturing and storing CO2 as regulated by the EU are for 2020–0 MtCO2/year, for 2030–36 MtCO2/year, for 2050–72 MtCO2/year. For a sense of comparison of the afore mentioned targets, back in the year 2017, Romania was within the top 10 greenhouse gas emitters at the EU level with a total production of equivalent 113.796 MtCO2/year, whereas the no. 1 emitter was Germany with a total of equivalent 906.611 MtCO2/year. The total greenhouse gas emissions at the EU level for the same year was of equivalent 4323.163 MtCO2/year [7].
The effectiveness of geological storage depends on a combination of physical and geochemical trapping mechanisms as presented in Figure 1. Efficient underground storage sites are considered those where CO2 is trapped permanently under thick, impermeable caprocks, or it is converted to solid minerals, or it is adsorbed on the surfaces of coal micropores or through a combination of physical and chemical trapping mechanisms.
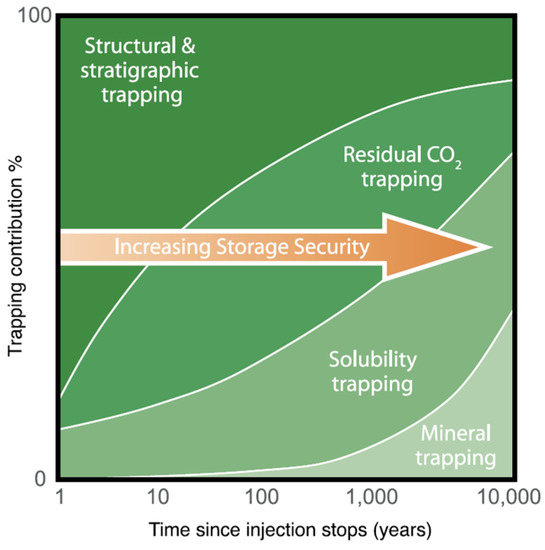
Figure 1.
Underground CO2 storage mechanisms and security [6].
Structural and stratigraphic trapping refers to the physical containment of the injected CO2 in the porous permeable geological formations enclosed by the sealing cap rocks, faults, pinch outs, etc. Before injection of CO2 in it, these sedimentary tanks would be saturated with saline waters or hydrocarbons. Some hydrocarbon reservoirs would have been produced already, as in the case of our example. Residual CO2 trapping occurs due to the migration of CO2 in the reservoir from the injection point to other gravitationally attractive points of the 3D space. Whilst this occurs, some CO2 molecules would remain behind trapped due to molecular and capillary forces. Solubility trapping happens since CO2 dissolves in formation water. The primary benefit of solubility trapping is that once CO2 is dissolved, it no longer exists as a separate phase, hence eliminating the buoyant forces that drive it upwards. Ionic species will be formed as some small amounts of surrounding rock dissolves causing a pH rise. Finally, some fraction may be converted to stable carbonate minerals; mineral trapping occurs. This is a slow process, however, of a permanent nature.
Underground accumulation and storage of carbon dioxide through its injection in deep geological formations uses technologies that have been developed for and applied by the oil and gas industry. Computer simulation programs were modified and adapted to successfully model all trapping mechanisms presented in Figure 1 for underground storage of CO2 [6].
Onwards, CO2 capture and storage for Romania’s Iernut fossil fuel, natural gas burning, power plant is going to be case studied.
2. Geographical and Geological Settings
Iernut natural gas power plant is situated at the heart of Romania, in the middle of Transylvania, 30 km West from the city of Târgu Mureș and is undergoing now through a major upgrading process (Figure 2). Iernut has been originally built and upgraded to benefit of the dry gas produced from the numerous reservoirs from the Transylvanian Basin.
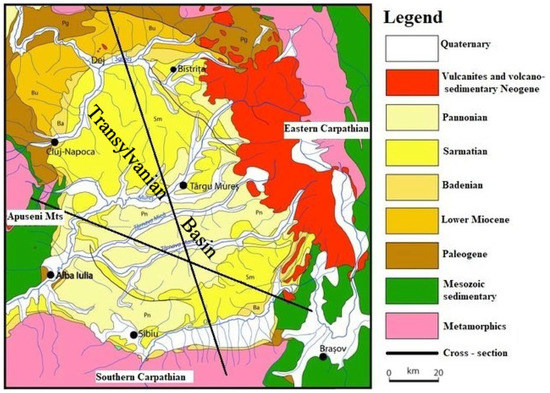
Figure 2.
Geological map of the Transylvanian Basin. After [8] modified.
The main key points for which the upgrade was instated considered efficiency optimization; combined cycle power plants are known to have a 55–57% efficiency range, 15–20 more efficiency percentage points than the existing power plant which is being categorized in the 35–39% efficiency range, has flexibility in operation with less greenhouse gasses being released, and minimizes associated costs with electric power generation which are also associated to hydrocarbon gas consumption. The new combined cycle power plant will have an installed power of maximum 430 MW and a gross electrical efficiency at nominal load of at least 56%.
Combined cycle power plants represent the cleaner and more efficient existent technology to generate electricity from fossil fuels and produce approximately half of the greenhouse gasses emissions when compared to a similar size capacity coal burning plant. Moreover, when it comes to protecting the environment, the sulphides in natural gas are insignificant, just as the dust emissions are while burning it. However, even if the operation of the new power plant will be made in accordance with the BAT requirements regarding the greenhouse emissions for combustion installations, the following emissions will still be in place: maximum NOx emissions: 50 mg/Nmc (reduced NOx emissions to approx. 25% of the level of the current Iernut set up), maximum CO emissions: 100 g/Nmc; CO2 specific emission (tCO2/MWh product) will decrease to 0.360, below the threshold value of 0.374 set by BREF-BAT [9,10].
Hence, even though there are compliants, to align to the EU’s vision aiming to be climate-neutral by 2050, these emissions should be captured and injected in the nearby depleted and/or abandoned dry gas reservoirs which already benefit from some infrastructure, such as wells, surface networks, and facilities including compressor stations. Essentially, considering that greenhouse gasses are quite corrosive, some investments in equipment upgrade will need to be conducted. The Transylvanian Basin is developed in the internal zone of Carpathian Orogen covering around 20,000 sq km and, in the maximum subsidence areas, is made up of a thick sedimentary suite around 6000 m. The current geologic-tectonic setting has resulted due tectonic movements in Styric phases (late Burdigalian-Badenian). The sedimentary suite of the Transylvanian Basin is represented by Badenian, Sarmatian, and Pliocene deposits and lies unconformably over the basement consisting of crystalline, Mesozoic, Paleogene, and Lower Miocene rocks (Figure 3). The basin is characterized by large areas of lifting and descending, in their turn made up of numerous and complicated plastic deformation elements affected by faults with different significance and importance. Salt movement due to remarkable plasticity favored the salt diapirism in all its forms. The tectonic effect of salt movement decreases progressively from Badenian until the Pliocene, suggesting that salt movement and the formation process of the folds had a lasting character (continuity) with some intensification in the orogenetic phases. Salt deposits in the Transylvanian Depression describe a whole range of diapir folds. In the basin center, there are crypto-diapirs and on the borders of the basin occurring salt-cored folds. During the Buglovian and Sarmatian time, the domes in the forming process have generally maintained a position higher than the surrounding areas and functioned as a controlling zone for hydrocarbons formed in the adjacent synclines [11,12].
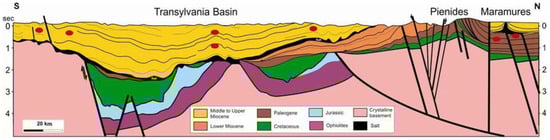
Figure 3.
North–South Geological cross-section through Transylvanian Basin [11].
The Transylvanian Basin Is a biogenic gas province and represents a post-Cenomanian sedimentary basin developed on top of the Middle Cretaceous basement nappes (internal Carpathians). The exploration activities of the gas-bearing formations started more than 100 years ago, and over 70 gas fields stored in structural traps, frequently salt-cored folds, were discovered in the basin, and cumulative gas production exceeded 30 trillion cubic feet (TCF). The gas accumulations related to the middle Miocene to Pliocene formations (as reservoir rocks) and the deep marine middle Miocene shales (as source rocks) confirm the favorable conditions of the genesis, accumulation, and preservation of biogenic gas in the Transylvanian Basin [11,12].
Iernut power plant is located in the central part of the Transylvanian Basin. In this area, according to Romania’s National Agency for Minerals and Resources, a series of nearby mature dry gas fields, which have potentially some depleted geological formations are: Iernut (exploitation agreement 711/2017), Lechința (exploitation agreement 1597/2004) located approximatively 4 km away from Iernut, Cucerdea Sud (exploitation agreement 711/2017) located approximatively 8 km away from Iernut, and Laslau Mare (exploitation agreement 1597/2004) located approximatively 20 km SE from Iernut [13].
Laslau Mare is a mature dry gas field which is going to be used for further analysis as an analogue field in our study. The sedimentation in the Laslau Mare area was deep marine in Badenian, going to turbiditic-marine in Lower Sarmatian (Buglovian) to shallow marine in Upper Sarmatian. Hence, the lower formations (Badenian) are very tight siltstones with higher shale content and low porosity-permeability pairs. The shallow layers are characterized by channels and smaller homogenous property distributions. The range of average reservoir permeability is from 0.01 mD in the deeper formations to 4 mD in the upper ones [14]. From practice, the porosity associated with these permeabilities ranges from 7–10% to 17–20%.
The total energy produced by Iernut power plant in 2018 was 1,165,189 MWh and in 2019 was 590,129 MWh. From these two years we are going to consider for further analysis the year 2018, and this production had an efficiency of average 37%. If we extrapolate this production to the average efficiency of the new plant, 56%, then a hypothetic future yearly average energy production rate will have a value of 1,763,529 MWh. Hence, the total hypothetic future yearly produced CO2 of the upgraded Iernut Power Plant will be 634,871 tCO2 [9].
CO2’s density at 1.01325 bar and 15 °C is 1.873 kg/m3. If we use this value to convert the total mass of CO2, the total yearly volume of produced CO2 by the Iernut power plant will be 338,959,423 m3. Dividing this value to the number of days in one year, 365, the daily flow rate of produced CO2 will be 928,656 m3/d [15].
Burning 1 m3 of natural gas produces 42.3 mol or 1.86 kg of CO2, i.e., 0.993 m3 at standard conditions. Hence, the hypothetic average flowrate of natural gas burnt at Iernut to will be 935,202 m3/d. That represents roughly the production of two medium size gas fields producing from the Transylvanian Basin [16].
3. Materials and Methods
Synthetic datasets with realistic inputs were used for this case study. These reflect valid models of the subsurface using average parameters identified and presented in the previous chapter for the reservoirs neighboring the Iernut power plant. Porous media specific homogenous reservoir properties were distributed in the 3D space.
The composition of the injection greenhouse gases is limited to CO2. Additionally, it is considered that the injection takes place in depleted dry gas reservoirs, and the composition of this dry gas is made of 100% CH4 or methane. The produced dry gas from the average Romanian reservoir contains up to 99% CH4; hence, the previous statement is a safe one under given circumstances.
ECLIPSE is a commercial reservoir simulator that was used for carrying over the work. Petrel is a commercial pre/post processor and was used to generate input and analyses of results for/from the ECLIPSE simulator. ECLIPSE was run in GASWAT mode with the SOLID option switched on. The GASWAT option provides a method of modeling gas phase/aqueous phase equilibriums using an equation of state. The Peng–Robinson equation of state is modified following the suggestions of Soreide and Whitson to obtain accurate gas solubilities in the aqueous phase. The GASWAT option is two-phase only. By using it, the gas and water phases are implicitly requested. The temperature of the reservoir may vary with depth, and this is reflected in the equation of state treatment, in which temperature coefficients are stored to be combined with the temperature of each cell. A global salinity value can be entered to correct the default equation of state modifications for brine concentration. Note that the default density and viscosity calculations for water with solutes may be replaced by Ezrokhi’s method [17]. The ECLIPSE GASWAT simulator can be complemented with the SOLID option to allow specific components to remain in solid phase throughout the simulation or to become dissolved into fluid components via chemical reactions. With these modes on, solids can also be deposited in the formation and can reduce the pore volume available for flow, i.e., hinder injectivity or productivity of wells. This is a phenomenon which is modeled with the help of chemical reactions and permeability multipliers [17,18].
The water vapor phase equilibrium coefficients at different temperatures required in the GASWAT mode are determined based on Soreide’s and Whitson’s modifications of the Peng–Robinson equation of state and accounts for hydrocarbons, CO2, N2, and H2S with pure water and NaCl brine fluid phase equilibria [19,20]. For example, CH4, CO2, and H2O can switch between liquid state, corresponding to the reservoir brine, and vapor states.
The reservoir simulation model was initialized reflecting a certain amount of hydrocarbon gas initially in place, then, using the existing drilled wells, produced to a current state which reflects average recovery factors of 75–80%. The initial reservoir pressure was calculated using the normal hydrostatic gradient of 10.516 kPa/m [21].
For this paper, it was considered that all the required surface facilities including laid pipelines and compressor stations were part of an equivalent parallel study, and the required conclusions were drawn there; hence, all the facilities required for the operational input are considered to be implemented at this stage. All wells drilled and produced in the normal hydrocarbon exploitation phase were converted to injectors as appropriately and recompleted as such to withstand the required compositional and operational requirements.
The reservoir model considered for the Iernut CO2 injection is an EW rising faulted monocline with currently 21 vertical wells. These wells have produced dry gas from this field since 1960, and they are being converted to CO2 injectors in 2023. The initial gas water contact is 2700 m (Figure 4).
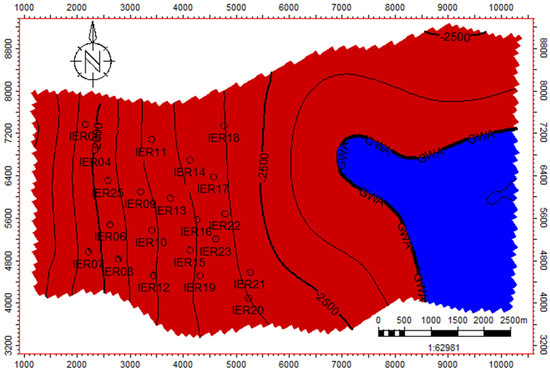
Figure 4.
Mid reservoir surface map with wells and contact locations.
This is a homogenous sandstone reservoir with an average reservoir porosity of 15%, average reservoir horizontal permeability of 4 mD, average reservoir vertical permeability of 0.4 mD, and average irreducible water saturation of 23%. The initial reservoir pressure found was as per the normal gradient, 266 bar measured at a datum depth of 2700 m. The reservoir top depth is 1546 m, and the reservoir bottom depth is 2960 m. The static model has cells of 100 m × 100 m with vertical resolution of approx. 5 m in the middle of the reservoir and 25 m towards the upper and lower extremities.
A compositional fluid model consisting of components H2O, CO2, and C1 (CH4) is exported from the fluid modeling software package. This model is complemented with the following components gradually to account for the different significant physico-chemical phenomena occurring throughout the life cycle of the project during the hydrocarbon production exploitation stage continued by the CO2 injection case. In GASWAT mode, H2O as a component corresponds to sweet water; hence, no salts are considered as dissolved. In GASWAT mode, a salinity can be defined to account for the salts dissolved in H2O via SALINITY keyword. In our example, the salinity of the reservoir water is 35,000 ppm. Whilst the GASWAT mode accounts for the accurate gas solubilities in the aqueous phase as functions of the salinity of the reservoir water up to a certain threshold, unfortunately, the aqueous phase density and viscosity will not be determined as functions of salinity as well. This is a known limitation of the modified Peng–Robinson equation of state following the suggestions of Soreide and Whitson; hence, ECLIPSE ran in GASWAT mode. To obtain realistic solubility behaviors above the afore mentioned threshold, the aqueous phase density and viscosity need to be tuned to realistic values using Ezrokhi temperature coefficients for each component. If necessary, to further improve the solubility match, A-coefficient terms for water component can be modified using the keyword AQCOEF. Hence, the components mentioned in the fluid model above need to be complemented with a NaCl component. Once this was completed, at this stage, the simulation accounts for the structural and stratigraphic trapping, residual CO2 trapping, and solubility trapping, as per Figure 1.
The last trapping mechanism that our simulation needed to reflect was the mineral trapping. This was possible after switching on the SOLID option together with chemical reactions. As an example, for this to happen, the fluid model has the following components added: Mg2SiO4, Mg silicate, MgCO3, Mg carbonate, Mg3Si4O10(OH)2, talc.
The reaction considered is:
0.8 Mg2SiO4 + 0.2 H2O + CO2 → MgCO3 + 0.2 Mg3Si4O10(OH)2
Magnesium silicate reacts (solid) with water and CO2 (fluids) to form magnesium carbonate (solid) and talc (solid).
For the reaction to occur in the simulation, a reaction rate needed to be specified as input. Additionally, an initial solid concentration was requested to be provided. In this case, it will be the concentration of Mg2SiO4, Mg silicate. Reasonable realistic assumptions as per industry were made for these parameters.
The initial state of the reservoir is reflected in Figure 5 with volumes in place of 83 Bscm for gas (Figure 6 top right—dotted black curve), 175 MMscm for water, and 6 MMscm of solid available for chemical reactions.
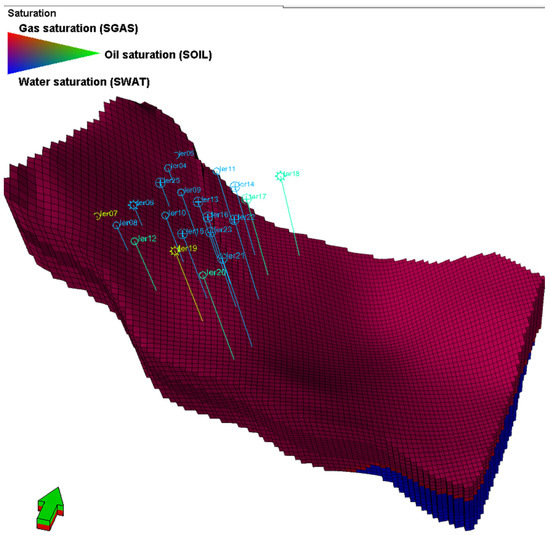
Figure 5.
3D outline of the homogenous reservoir’s ternary saturation display.
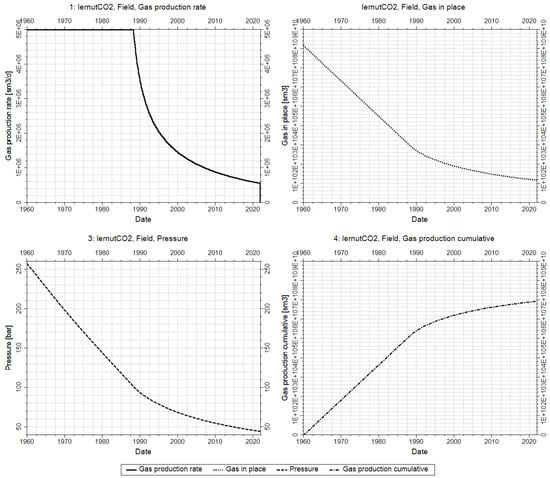
Figure 6.
Depletion stage of the reservoir through 21 wells between 1960 and 2022.
As in Figure 6, the field is put in production in 1960 through the 21 wells, and its production plateau is set at 5 MMscm/d. The field gas production rate is presented in black continuous curve in Figure 6 top left. The field is kept in production until 1 January 2022. Throughout this time, the reservoir pressure decreases from the initial average reservoir pressure of 257 bar to 44 bar (Figure 6 bottom left—dashed black curve) after a total of 69 Bscm of gas were produced (Figure 6 bottom right—dashed dotted black curve). Since the wells are significantly above the gas water contact, no significant water production is observed throughout the simulation runtime.
In the circumstances of using real reservoir data, at this stage of the process, a thorough calibration procedure would be in place. This is done to make sure that all the inputs in the model by all the team members, geophysicists, petrophysicists, geologists, and reservoir engineers, are validated before the next prediction stage.
For the prediction stage, which is the injection stage of the project, the same well count is considered in place. As found in the introduction chapter, an approximate daily volume of 1 MMscm of CO2 is injected through the 21 wells. The bottom hole pressure injection limit is considered 100 bar with an injection time of 20 years until 1 January 2060. For the analysis of the chemical reaction trapping mechanism outcomes, the simulation was continued for 140 years more, until 1 January 2200.
4. Results
Figure 7 shows the results of the CO2 injection cycle following that of the hydrocarbon production cycle. Since the reservoir in which the injection takes place has significant physical storage space, given the number of injection wells, the required daily amount is injected without any challenges. The field gas production and injection rates are presented in black continuous and double dotted dashed black curve in Figure 6 top left. Moreover, the reservoir pressure at the end of the injection is considerably lower than the initial reservoir pressure, confirming the fact that there is plenty storage capacity left in the tank The reservoir pressure profile tends to equilibrate in time after the end of the injection period whilst the distribution of CO2 continues to level throughout the reservoir; solubility and reactions continue to occur (Figure 6 bottom left—dashed black curve in conjunction with Figure 7). The dynamic of the gas in place is presented in Figure 6 top right—dotted black curve. Moreover, the gas injection cumulative (dashed double dotted curve) is presented in conjunction with the gas production cumulative (dashed dotted curve) in the Figure 6, bottom right.
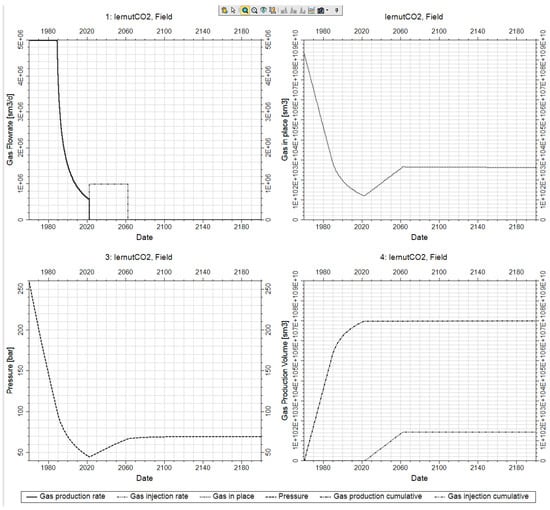
Figure 7.
Dry gas production/CO2 injection stages followed by monitoring (1960–2022–2060–2200).
In Figure 8, the most important results of the study are presented. On its left, the dynamic of the total amount of substance of CO2 is presented via a continuous black curve and labeled as Component in place. On the same plot, the individual amounts trapped by the different mechanisms can be represented to understand which is the most important trapping mechanism. As expected, the most significant trapping mechanism is the stratigraphic and structural, and it is quantifiable through the CO2 component mobile in the gas label having its dynamic presented via the black dotted dashed curve. This is followed by the residual CO2 trapping quantifiable through the CO2 component trapped in the gas label having its dynamic presented via the dotted black line and by the solubility trapping quantifiable through the CO2 component dissolved in water label having its dynamic presented via the dashed black line.
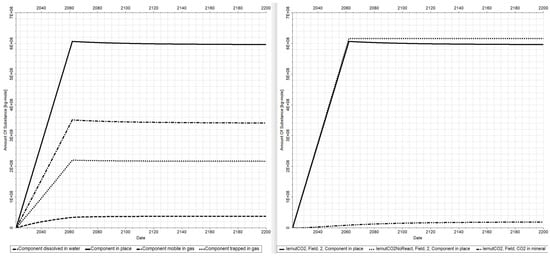
Figure 8.
CO2 trapped in the reservoir—total and by individual mechanisms (left); in mineral (right).
In Figure 8, right, the total CO2 component in place is presented for the same scenario as in the left in which chemical reactions are on (continuous black curves) along with the scenario in which the chemical reaction is switched off (dotted black curve). The difference between the two scenarios is also shown (double dotted dashed line), and this represents the total CO2 trapped in mineral. By conducting this differential analysis, we can state exactly how much CO2 will go into the solid minerals.
N.B.: The case in which chemical reactions are on is the case closer to reality.
As per this hypothetical study, if the Iernut power plant were to capture its CO2 resulting from electric energy generation from dry gas burning and inject it in the sounding depleted reservoirs, the generated energy will be clean.
The total CO2 quantity that will be stored via this proposed carbon capture, and the sequestration study for the Iernut power plant in its surrounding depleted gas reservoirs is approximately 6 × 10⁸ kg-mole or 26.46 MtCO2.
This amount is made of 3.5 × 10⁸ kg-mole or 15.50 MtCO2 sequestrated via physical trapping (stratigraphic and structural), 2.1 × 10⁸ kg-mole or 9.46 MtCO2 sequestrated via hydrodynamic trapping, and approximately 3.4 × 10⁷ kg-mole or 1.50 MtCO2 sequestrated via geochemical trapping. By the year 2200, the amount of CO2 trapped into solid minerals will be 2.0 × 10⁷ kg-mole or 0.88 MtCO2 (Figure 8).
5. Discussion
Romania has a significant potential to store CO2 both in deep saline aquifers and in depleted oil and gas reservoirs. Geological formations suitable for safe CO2 storage are widely distributed in all major geological units, either platform or orogenic units [22].
The CO2 storage mechanisms in geological formations considered in our study, and their approximate percentual contributions in the carbon capture and sequestration of Iernut’s emissions are:
- Physical trapping: stratigraphic and structural—59%.
- Hydrodynamic trapping: residual CO2 bound at molecular level—36%.
- Geochemical trapping: solubility and chemical reactions—5%.
Physical sequestration of CO2 via either structural and/or stratigraphic traps which are widely distributed in the hydrocarbon reservoirs represents the most important CO2 storage mechanism, and this is confirmed by our simulation study. Considering that CO2 storage capacity and sequestration mainly depend on the reservoirs’ pore volume and permeabilities, a high degree of geological knowledge of the reservoirs formations is required. CO2 sequestration through this physical trapping mechanism is highly dependent on caprock sealing capacity, making this a great challenge for site selection at times. This is not the case for all the Iernut power plant neighboring depleted gas reservoirs mentioned in Section 2, as a big majority of the reservoirs in the Transylvanian Basin have strong thick sealing caprocks. It can be observed that the quantity of CO2 stored due to this process decreases slightly since CO2 migrates in the reservoir. This migration process allows CO2 to encounter more reservoir water and minerals enabling the third trapping mechanism.
The second mechanism considered in the study was hydrodynamic trapping related to the residual CO2 bound at molecular level. The CO2 volumes injected into the reservoir will displaces the brine and/or the gas remained in the pore spaces. In the periods of the stopping injections (maintenance, breakdowns, etc.), because of the difference in density between the CO2 and the brine, the CO2 migrates up and the brine flows down. In this process, the brine displaces CO2, which leads to a significant saturation of CO2 that becomes trapped in small groups of pores and once disconnected is trapped as an immobile phase. It is obvious that the capillary trapping mechanism has an important influence on the CO2 migration and distribution, affecting the efficiency of the other trapping mechanisms. [23] However, due to slowly development/movement of the CO2 capillary process and to the short periods of time in which the CO2 injection will be stopped during the operation of the Iernut gas plant, we consider that the influence on the assessment of the CO2 storage capacity is second most important after physical trapping. (Figure 8 left).
The third CO2 storage mechanism is the geochemical trapping which can be further subdivided into trapping due to fluids solubility and trapping due to chemical reactions.
Regarding the first one, the CO2 solubility in the brine/water, this phenomenon depends on the salinity, the pressure, and the temperature. Certainly, this trapping mechanism has an important influence on the CO2 migration and distribution, influencing the efficiency of the other trapping mechanisms and the assessment of the CO2 storage capacity. However, this CO2 trapping mechanism evolves extremely slowly since the molecular diffusion coefficient is very small [23]. Due to the very long period of the CO2 dissolution process in the brine, we observe from our study that the influence of this mechanism is smaller than the first two (Figure 8 left).
The second one, CO2 storage mechanism of geochemical nature or mineral trapping (also known as mineral carbonation), assumed that the injected CO2 into reservoir is trapped into thermodynamically stable minerals (mostly Ca-Mg-Fe carbonates) by means of inorganic reactions developed in situ between CO2 and alkaline-silicate minerals (Mg, Ca or Fe-rich silicates). The process depends on the structure, mineralogy, and hydrogeology of the various reservoirs. Additionally, the minerals’ reaction rate in CO2-water systems depends on the temperature, pressure, pH of the solutions, and the concentrations of the mineral species [23,24]. The reaction rates are usually very slow, and the CO2 trapping by mineral carbonation mechanism is the least significant on the impact of the CO2 storage capacity as it has been found in our analysis (Figure 8 right).
In the latest years in Romania were prepared several studies regarding the potential of CO2 storage/sequestration both in deep saline aquifers and in depleted oil and gas fields, most of them assessing the potential of CO2 storage/sequestration at the regional scale/at the level of major geological units/basins. In the Transylvanian Basin, the deep saline aquifers revealed a CO2 storage capacity of 8.80 Gt (gigatons), and the depleted gas fields revealed a CO2 storage capacity of 2.30 Gt [22]. Additionally, the potential of CO2 storage/sequestration has been assessed on several oil and gas fields in the South Romania belonging to the Getic Basin (Bradu-Albota, Silistea, Babeni, Balteni, Bibesti, Bulbuceni), the Moesian Platform (Bradesti, Samnic-Ghercesti, Plopu, Oprisenesti, Bordei Verde Est, Liscoteanca, Jugureanu-Odaieni, etc.), or to the Pannonian Basin (Turnu, Satchinez, Calacea). However, for the gas fields mentioned in our paper (Iernut, Lechința, Cucerdea Sud, or Laslau Mare) there were not made the assessment of the potential of CO2 storage/sequestration. Therefore, from this point of view our paper is a step forward in this direction. We choose the Laslau Mare gas field as an analogue to simulate the carbon capturing and sequestration, CCS, process because the geologic–physical model of its gas reservoirs had a high degree of knowledge; hence, geological research and exploration works are no longer necessary.
6. Conclusions
This theoretical study has presented using reservoir simulation how CO2 co-generated by the Iernut gas burning Romanian power plant can be successfully captured and disposed through injection wells using underground storage in existing neighboring dry gas sedimentary reservoirs. The CO2 storage mechanisms in geological formations reflected by the study are:
- Physical trapping: stratigraphic and structural.
- Hydrodynamic trapping: residual CO2 bound at molecular level.
- Geochemical trapping: solubility and chemical reactions.
As per our findings, the total CO2 quantity that will be stored via this proposed carbon capture and sequestration study in the Iernut’s surrounding depleted gas fields is approximately 26.46 MtCO2.
This amount can be broken into 15.50 MtCO2 (59%) sequestrated via physical trapping (stratigraphic and structural), 9.46 MtCO2 (36%) sequestrated via hydrodynamic trapping, and approximately 1.50 MtCO2 (5%) sequestrated via geochemical trapping.
Even though previous local studies have investigated the assessment of CCS into Romanian underground reservoirs being either saline aquifers or depleted hydrocarbon reservoirs, none of them took into consideration using the depleted hydrocarbon reservoirs surrounding the Iernut power plant for this process, i.e., Iernut, Lechinta, Cucerdea Sud.
Our paper is a step forward in this direction after choosing the Laslau Mare gas field as an analogue to simulate the CCS process because the geologic–physical model of its gas reservoirs had a high degree of knowledge; hence, geological research after exploration was available and complemented the other physical models used in our study.
With the help of this process, the energy generated using fossil fuels at the Iernut power plant will be a clean energy; hence, the impact on the environment and climate will be zero (0), in alignment with European Union’s long-term objectives. The existing acquired data and infrastructure on the identified neighboring reservoirs significantly lower the uncertainty associated along with the investments required for the underground storage project.
Author Contributions
Conceptualization, L.N.D., S.S., I.G., I.P., G.B. and C.E.; methodology, L.N.D. and S.S.; software, L.N.D.; validation, L.N.D., S.S., I.G., I.P., G.B. and C.E., formal analysis, L.N.D., S.S., I.G., I.P., G.B. and C.E.; investigation, L.N.D., S.S., I.G., I.P., G.B. and C.E.; resources, L.N.D., S.S., I.G., I.P., G.B. and C.E.; data curation, L.N.D., S.S., I.G., I.P., G.B. and C.E.; writing—original draft preparation, L.N.D. and S.S.; writing—review and editing, L.N.D., S.S. and G.B.; visualization, L.N.D., S.S., I.G., I.P., G.B. and C.E.; supervision, L.N.D., S.S., I.G., I.P., G.B. and C.E.; project administration, L.N.D., S.S., I.G., I.P., G.B. and C.E.; funding acquisition, L.N.D., S.S., I.G., I.P., G.B. and C.E. All authors have read and agreed to the published version of the manuscript.
Funding
This research received no external funding.
Institutional Review Board Statement
Not applicable.
Informed Consent Statement
Not applicable.
Data Availability Statement
Not applicable.
Conflicts of Interest
The authors declare no conflict of interest.
References
- European Commission. Available online: https://ec.europa.eu/clima/policies/strategies/2050_en (accessed on 20 May 2020).
- Shell. Available online: https://www.shell.com/sustainability/environment/climate-change.html (accessed on 15 May 2020).
- BP. Available online: https://www.bp.com/en/global/corporate/sustainability/climate-change/reducing-emissions-in-our-operations.html (accessed on 15 May 2020).
- Greenhouse Gas. Available online: http://www.ghgonline.org/othernox.htm (accessed on 20 May 2020).
- Available online: https://en.wikipedia.org/wiki/Greenhouse_gas (accessed on 20 May 2020).
- Metz, B.; Davidson, O.; de Coninck, H.; Loos, M.; Meyer, L. IPCC Special Report on Carbon Dioxide Capture and Storage; Cambridge University Press: Cambridge, UK, 2005; pp. 77–101, 208. [Google Scholar]
- European Parliament. Available online: https://www.europarl.europa.eu/portal/en (accessed on 20 May 2020).
- Coman, A.; Manea, E.F.; Cioflan, C.O.; Radulian, M. Interpreting the fundamental frequency of resonance for Transylvanian Basin. Rom. J. Phys. 2020, 65, 809. [Google Scholar]
- ROMGAZ S.A. Available online: www.romgaz.ro (accessed on 22 May 2020).
- European Environment Agency. Available online: https://www.eea.europa.eu/themes/air/links/guidance-and-tools/eu-best-available-technology-reference (accessed on 20 May 2020).
- Krezsek, C. Petroleum Systems of Romania, Search and Discovery Article #10349. AAPG European Region Newsletter, June 2011. [Google Scholar]
- Branoiu, G. General Framework of Exploration-Production Activities in Romania; Editura Universităţii Petrol-Gaze din Ploieşti: Ploiești, Romania, 2019. [Google Scholar]
- Agenția Națională Pentru Resurse Minerale. Available online: http://www.namr.ro/wp-content/uploads/2021/09/Acorduri-dezvoltare-exploatare_site_spt2021.pdf (accessed on 27 February 2023).
- Cavalarro, B.; Stefanescu, D.P.; Fava, G.N. Remediation of Long-Term Production Deferrals from Formation Damage in a Depleted Transylvanian Sandstone Reservoir; SPE 168197. In Proceedings of the SPE International Symposium and Exhibition on Formation Damage Control, Lafayette, LA, USA, 26–28 February 2014. [Google Scholar]
- Peace Software. Available online: https://www.peacesoftware.de/einigewerte/calc_co2.php7 (accessed on 27 May 2020).
- University of Waterloo. Available online: https://uwaterloo.ca/chem13news/sites/ca.chem13news/files/uploads/files/pages16_17_351.pdf (accessed on 22 May 2020).
- Schlumberger. ECLIPSE Technical Description 2020.1. Available online: http://www.ipt.ntnu.no/~kleppe/TPG4150/EclipseReferenceManual.pdf (accessed on 18 December 2022).
- Dumitrache, L.; Nistor, I.; Suditu, S.; Badea, A. Simulating Salt Precipitation in Dry Gas Reservoirs Using ECLIPSE Thermal CO2STORE. Rev. Chim. 2018, 69, 251–254. [Google Scholar] [CrossRef]
- Dumitrache, L.; Nistor, I.; Suditu, S.; Badea, A. Determining Water Vapour Phase Equilibrium Coefficients at Different Temperatures for Gas Wells. Rev. Chim. 2017, 68, 2776–2782. [Google Scholar] [CrossRef]
- Soreide, I.; Whitson, C.H. Peng-Robinson predictions for hydrocarbons, CO2, N2, and H2S with pure water and NaCl brine. Fluid Phase Equilibria 1992, 77, 217–240. [Google Scholar] [CrossRef]
- Schlumberger. Available online: https://www.glossary.oilfield.slb.com/en/Terms/p/pressure_gradient.aspx (accessed on 27 May 2020).
- Sava, C.S.; Constantin, C.; Anghel, S.; Proca, A.; Tomescu, C.; Dudu, A.; Samoila, I. State of the CCS Activities in Romania; AAPG Search and Discovery Article #90103 ©2010. In Proceedings of the AAPG Hedberg Conference, Vancouver, BC, Canada, 16–19 August 2009. [Google Scholar]
- Zhang, D.; Song, J. Mechanisms for Geological Carbon Sequestration. Procedia IUTAM 2014, 10, 319–327. [Google Scholar] [CrossRef]
- Sanna, A.; Uibu, M.; Caramanna, G.; Kuusik, R.; Maroto-Valer, M.M. A Review of Mineral Carbonation Technologies to Sequester CO2. Chem. Soc. Rev. 2014, 43, 8049. [Google Scholar] [CrossRef] [PubMed]
Disclaimer/Publisher’s Note: The statements, opinions and data contained in all publications are solely those of the individual author(s) and contributor(s) and not of MDPI and/or the editor(s). MDPI and/or the editor(s) disclaim responsibility for any injury to people or property resulting from any ideas, methods, instructions or products referred to in the content. |
© 2023 by the authors. Licensee MDPI, Basel, Switzerland. This article is an open access article distributed under the terms and conditions of the Creative Commons Attribution (CC BY) license (https://creativecommons.org/licenses/by/4.0/).