Article

A Semi-Analytical Model for Gas–Water Two-Phase Productivity Prediction of Carbonate Gas Reservoirs

1
State Key Laboratory of Coal Resources and Safe Mining, China University of Mining and Technology, Xuzhou 221116, China
2
School of Mining, China University of Mining and Technology, Xuzhou 221116, China
*
Author to whom correspondence should be addressed.
Processes 2023, 11(2), 591; https://doi.org/10.3390/pr11020591
Submission received: 8 January 2023 / Revised: 2 February 2023 / Accepted: 14 February 2023 / Published: 15 February 2023
(This article belongs to the Special Issue Advances in Enhancing Unconventional Oil/Gas Recovery)

Abstract

:
The productivity prediction of gas wells in carbonate gas reservoirs is greatly affected by the characteristics of gas–water two-phase flow and fracture seepage parameters. Compared with numerical simulation, the productivity prediction based on the analytical model is fast and widely used, but the traditional analytical model is fairly simplified while dealing with the nonlinear problem of the two-phase seepage equation, leading to a large discrepancy in the results of dynamic analysis. To solve this problem, this paper considers the characteristics of gas–water two-phase flow in the reservoir and fracture, uses the dual-medium model to characterize the stress sensitivity of the fracture and reservoir, and establishes a gas–water two-phase productivity prediction model for carbonate gas reservoirs. Combining the flowing material balance equation with the Newton iteration method, the nonlinear parameters of the percolation model are updated step by step with the use of average formation pressure, and the gas–water two-phase model is linearized through successive iterations to obtain the semi-analytical solution of the model. The accuracy of the model was verified using a comparison with the results of commercial numerical simulation software and field application, the gas–water two-phase productivity prediction curve was obtained, and the influence of sensitive parameters on productivity was analyzed. The results show that: (1) the semi-analytical solution method can efficiently deal with the gas–water two-phase nonlinear seepage problem and obtain the productivity prediction curve of carbonate gas wells rapidly and (2) the water production of the carbonate gas reservoir seriously affects the productivity of gas wells. During the development process, the production pressure difference should be reasonably controlled to reduce the negative impact of stress sensitivity on productivity performance.

1. Introduction

A carbonate gas reservoir is rich in natural fractures and shares the feature of strong stress sensitivity. The reservoirs essentially have high water saturation; therefore, water production has a prominent role in limiting gas-well production [1,2,3]. The productivity prediction is greatly affected by the characteristics of gas–water two-phase flow as well as the fracture seepage parameters. At present, the gas–water two-phase productivity prediction methods of carbonate gas wells mainly include analytical methods and numerical simulation methods [4,5,6]. The analytical method is usually based on the steady-state seepage theory. The equation is linearized by introducing the gas–water two-phase pseudo pressure, and the productivity equation of water-producing gas wells is derived using the conformal transformation and potential superposition principle to convert the water production into gas production for evaluation [7,8,9]. The numerical simulation method can explicitly characterize the artificial fracture parameters and deal with multiphase fluid flow problems, but the process of model establishment and solution is complex [10,11,12]. For carbonate gas reservoirs, the development process falls in the unsteady flow stage for a long time, and the productivity equation established on the basis of steady-state seepage theory cannot reflect the production process of the gas reservoir [13,14,15]. In addition, the analytical method usually only introduces two-phase pseudo pressure to simplify the equation when dealing with the nonlinear problem of the gas–water two-phase seepage equation [16,17,18] and ignores the influence of nonlinear seepage parameters, and, in addition, the calculation results have large errors. The pre-treatment process of the numerical simulation method is complex. In order to obtain high simulation accuracy, it is necessary to densify the grid of cracks, resulting in a large number of grids. When dealing with thousands of case studies, the computational cost for numerical simulation is unfavorable.
In this paper, a gas–water two-phase productivity prediction model for carbonate gas reservoirs is established based on the dual medium unsteady crossflow model, and an efficient solution method is proposed to handle the nonlinear seepage problem caused by gas–water two-phase flow. First, the seepage equation is normalized by introducing two-phase pseudo pressure and pseudo time, and the analytical solution is obtained using Laplace transform and other methods. Then, combined with the flow material balance and Newton iteration method, the nonlinear seepage parameters of the model are updated using the average formation pressure and saturation at each timestep, and the linearization of the seepage model is gradually realized, so as to obtain the semi-analytical solution of the model. The accuracy of the model is verified using a comparison with commercial numerical simulation software, and the influence of key seepage parameters of fractures and reservoirs on productivity prediction is analyzed. Then, the productivity prediction and analysis of field wells are carried out.

2. Establishment of Model

2.1. Physical Model

The dual-medium unsteady crossflow model [19,20] is used to characterize the fractured porous carbonate reservoir. The fluid flow in the carbonate reservoir is in line with the dual-porosity and single permeability flow characteristics, as shown in Figure 1. The model assumes that the natural fractures are directly connected with the wellbore, and the fluid only flows into the production wellbore through the fractures, and the fluid in the matrix continuously flows to the fractures to provide an energy supply. Considering that gas and water are produced at the same time, gas–water two-phase flow takes place at both the matrix and fractures, where isothermal Darcy flow is applied. The assumptions of other physical models are: (1) the thickness of the production layer is fully opened, and the fluid flows into the wellbore radially; (2) considering the permeability loss of natural fractures caused by stress sensitivity; (3) compared with gas phase, the compressibility of formation water is small and can be ignored; and (4) the effects of gravity and capillary force are not considered.

2.2. Mathematical Model

Based on the assumption of the physical model, seepage mathematical models are established for natural fractures and matrix systems, respectively. For the convenience of derivation, pseudo pressure and pseudo time are introduced as:
ψ = 2 0 p p μ g Z d p
t a = 0 t μ gi c ti μ g ( p ^ ) c t ( p ^ ) d t
where p is the formation pressure, MPa; ψ is the formation pseudo pressure, MPa2/(mPa · s); Ct is the comprehensive compression coefficient, 1/MPa; Z is the gas deviation factor, m3/m3; μg is the gas viscosity, mPa · s; T is the time, h; ta is the pseudo time; and p ^ is the average formation pressure.
The gas phase flow equation adopts pseudo pressure and pseudo time treatments, and the gas phase seepage control equation of the fracture system under the radial cylindrical coordinates is:
1 r r ( r ψ f r ) 3 k m k rgm k f k rgf r 1 ( ψ m r m ) | r m = r 1 = 1 η gf ψ f t
1 η gf = ϕ f 0.0864 k f k rgf 1 μ g ( p ^ ) B g ( p ^ ) ( S g B g 2 d B g d ψ f )
where ηgf is the gas transmission factor in the fracture, m2/s.
The initial conditions are:
ψ f | t = 0 = ψ m | t = 0 = ψ i
The internal boundary conditions are:
lim r r w ψ f = ψ wf
The outer boundary conditions are:
ψ f r | r = r e = 0
The gas phase seepage control equation of the matrix system in radial spherical coordinates is:
1 r m 2 r m [ r m 2 ψ m r m ] = 1 η gm ψ m t
1 η gm = ϕ m 0.0864 k m k rgm 1 μ g ( p ^ ) B g ( p ^ ) ( S g B g 2 d B g d ψ m )
where ηgm is the gas transmission factor in the matrix, m2/s.
The initial conditions are:
ψ f | t = 0 = ψ m | t = 0 = ψ i
The internal boundary conditions are:
ψ m r m | r m = 0 = 0
The outer boundary connection conditions are:
ψ m ( r m , t ) | r m = r 1 = ψ f
where, ψf is the pseudo pressure of the natural fracture system, MPa2/(mPa · s); ψm is the pseudo pressure of the matrix system, MPa2/(mPa · s); ψ is the original formation pseudo pressure, MPa2/(mPa · s); ψwf is the pseudo bottom hole flow pressure, MPa2/(mPa · s); Kf is the natural fracture permeability, mD; Km is matrix permeability, mD; Krgf is the relative permeability of the gas phase in the fracture system; Krgm is the relative permeability of the gas phase in the matrix system; Bg is the gas volume coefficient, m3/m3; Sg is the gas saturation; r is the radial distance, m; rm is the distance from the inner diameter of the matrix block, m; r1 is the width of the matrix block, m; and re is the outer boundary distance, m.
The water phase flow equation is treated in real-time, and the control equation of water phase seepage of the fracture system under radial cylindrical coordinates is:
1 r r ( r p f r ) 3 k m k rwm k f k rwf r 1 ( p m r m ) | r m = r 1 = 1 η wf p f t
1 η wf = ϕ f 0.0864 k f k rwf 1 μ w ( p ^ ) B w ( p ^ ) ( S w B w 2 d B w d p f )
where ηwf is the water transmission factor in fracture, m2/s.
The initial conditions are:
p f | t = 0 = p m | t = 0 = p i
The internal boundary conditions are:
lim r r w p f = p wf
The outer boundary conditions are:
p f r | r = r e = 0
The gas phase seepage control equation of the matrix system in radial spherical coordinates is:
1 r m 2 r m [ r m 2 p m r m ] = 1 η wm p m t
1 η wm = ϕ m 0.0864 k m k rwm 1 μ w ( p ^ ) B w ( p ^ ) ( S w B w 2 d B w d p m )
where ηwm is the water transmission factor in the matrix, m2/s.
The initial conditions are:
p f | t = 0 = p m | t = 0 = p i
The internal boundary conditions are:
p m r m | r m = 0 = 0
The outer boundary connection conditions are:
p m ( r m , t ) | r m = r 1 = p f
where pf is the natural fracture system pressure, MPa; pm is the matrix system pressure, MPa; pi is the original formation pressure, MPa; pwf is bottom hole flow pressure, MPa; Krwf is the relative permeability of the water phase in the fracture system; Krwm is the relative permeability of the water phase in the matrix system; μw is the viscosity of formation water, mPa · s; Bw is the volume coefficient of formation water, m3/m3; and Sw is water the saturation.
Comparing Formulas (3) and (13), it can be found that the relative permeability in the seepage equation is a function of water saturation, and the gas physical property parameter is a function of pressure, which leads to the strong nonlinearity of the seepage equation, so it cannot be directly solved. In order to obtain the solution of the model, the prediction years are divided into multiple periods in this paper. The parameters related to saturation are treated explicitly, the saturation is considered as a fixed value at a specific period, and the parameters related to pressure are treated implicitly with pseudo pressure. The nonlinear parameters of the model are updated step by step using the average pressure and average saturation of the gas reservoir, and a gas–water two-phase production solution is obtained using iterative calculation. In the next section, the specific solution process of the gas–water two-phase flow model for carbonate gas wells is elaborated.

3. Semi-Analytical Solution of the Gas–Water Two-Phase Productivity Prediction

The entire production time is divided into multiple time steps. In each time step, parameters related to pressure (μg, Bg) and the saturation-related parameters (krgm, krwm, krgf, krwf) are updated and replaced with the average pressure and average saturation within the production range, respectively. Therefore, the nonlinear parameters in the above formula can be treated as fixed values in each time step. After dealing with the nonlinear seepage problem, the gas and water phase production in each time step can be obtained by solving the equation directly.

3.1. Solution of the Gas Phase Flow Equation

Similar to the solution process of the single-phase model, the gas phase seepage equation of the fracture system is first transformed using the Laplace transform.
The gas phase seepage control equation of the fracture system in radial cylindrical coordinates is:
2 Δ ψ ¯ f r 2 + 1 r Δ ψ ¯ f r 3 k m k rgm k f k rgf r 1 ( Δ ψ ¯ m r m ) | r m = r 1 = 1 η gf u Δ ψ ¯ f
where u is the Laplace operator.
The initial conditions are:
Δ ψ ¯ f | t = 0 = Δ ψ ¯ m | t = 0 = 0
The internal boundary conditions are:
lim r r w Δ ψ ¯ f = 1 u Δ ψ wf
The outer boundary conditions are:
Δ ψ ¯ f r | r = r e = 0
The gas phase seepage control equation of the matrix system in radial spherical coordinates is:
2 Δ ψ ¯ m r m 2 + 2 r m Δ ψ ¯ m r m = 1 η gm u Δ ψ ¯ m
The initial conditions are:
Δ ψ ¯ f | t = 0 = Δ ψ ¯ m | t = 0 = 0
The internal boundary conditions are:
Δ ψ ¯ m r m | r m = 0 = 0
The outer boundary conditions are:
Δ ψ ¯ m ( r m , t ) | r m = r 1 = Δ ψ ¯ f
Next, solve the partial differential equation of the matrix system under its definite solution condition. The general solution of Equation (27) is:
Δ ψ ¯ m = A m e σ m r m + B m e σ m r m r m
σ m = u η gm
Then, substitute the general solution Equation (31) into the definite solution condition Equations (29) and (30) to obtain:
A m = 1 e σ m e σ m Δ ψ ¯ f
B m = 1 e σ m e σ m Δ ψ ¯ f
Therefore, the solution of Equation (31) is:
Δ ψ ¯ m = Δ ψ ¯ f r m e σ m r m e σ m r m e σ m e σ m
Take the derivative of rm in Equation (35) to obtain:
Δ ψ ¯ m r m | r m = r 1 = Δ ψ ¯ f r 1 2 ( σ m r 1 1 ) e σ m r 1 + ( σ m r 1 + 1 ) e σ m r 1 e σ m e σ m
Substituting Equation (36) into the seepage Equation (23) of the fracture system obtains:
2 Δ ψ ¯ f r 2 + 1 r Δ ψ ¯ f r f ( ξ ) Δ ψ ¯ f = 0
f ( ξ ) = 3 k m k rgm k f k rgf r 1 1 r 1 2 ( σ m r 1 1 ) e σ m r 1 + ( σ m r 1 + 1 ) e σ m r 1 e σ m e σ m + 1 η gf u
Equation (37) is the virtual argument Bessel equation, whose general solution is:
Δ ψ ¯ f = A I 0 ( r f ( ξ ) ) + B K 0 ( r f ( ξ ) )
d Δ ψ ¯ f d r = A f ( ξ ) I 1 ( r f ( ξ ) ) B f ( ξ ) K 1 ( r f ( ξ ) )
Then, substitute Equations (39) and (40) into Equation (25) for the inner boundary conditions and Equation (26) for the outer boundary conditions, respectively:
d Δ ψ ¯ f d r | r = r e = A f ( ξ ) I 1 ( r e f ( ξ ) ) B f ( ξ ) K 1 ( r e f ( ξ ) ) = 0
lim r r w Δ ψ ¯ f = A I 0 ( r w f ( ξ ) ) + B K 0 ( r w f ( ξ ) ) = 1 u Δ ψ wf
Simultaneous type (39) and type (40):
A = Δ ψ wf u K 1 ( r e f ( ξ ) ) I 0 ( r w f ( ξ ) ) K 1 ( r e f ( ξ ) ) + I 1 ( r e f ( ξ ) ) K 0 ( r w f ( ξ ) )
B = Δ ψ wf u I 1 ( r e f ( ξ ) ) I 0 ( r w f ( ξ ) ) K 1 ( r e f ( ξ ) ) + I 1 ( r e f ( ξ ) ) K 0 ( r w f ( ξ ) )
Substituting Equation (41) and Equation (42) into Equation (39), we obtain:
Δ ψ ¯ f = Δ ψ wf u K 1 ( r e f ( ξ ) ) α I 0 ( r f ( ξ ) ) + Δ ψ wf u I 1 ( r e f ( ξ ) ) α K 0 ( r f ( ξ ) )
Δ ψ ¯ f r = Δ ψ wf u K 1 ( r e f ( ξ ) ) α f ( ξ ) I 1 ( r f ( ξ ) ) Δ ψ wf u I 1 ( r e f ( ξ ) ) α f ( ξ ) K 1 ( r f ( ξ ) )
The expression of gas production by a single well is:
q ¯ gf = 2 π k f k rgf h r w Δ ψ ¯ f r | r r w
Combined with Formula (44), the solution of the gas phase production is:
q ¯ gf = 2 π k f k rgf h r w Δ ψ wf u f ( ξ ) [ K 1 ( r e f ( ξ ) ) I 1 ( r w f ( ξ ) ) I 0 ( r w f ( ξ ) ) I 1 ( r e f ( ξ ) ) K 1 ( r w f ( ξ ) ) I 0 ( r w f ( ξ ) ) K 1 ( r e f ( ξ ) ) I 1 ( r e f ( ξ ) ) + K 0 ( r w f ( ξ ) ) I 0 ( r w f ( ξ ) ) ]
The gas phase production solution in Equation (46) is obtained in Laplace space, and the solution in real space can be obtained using the numerical inversion of Stehfest [21].

3.2. Solution of the Aqueous Phase Flow Equation

The Laplace transformation about dimensionless time is adopted for the water phase seepage equation, which is similar to the solution process for the gas phase seepage model.
The control equation of the water phase seepage of the fracture system in radial cylindrical coordinates is:
2 Δ p ¯ f r 2 + 1 r Δ p ¯ f r 3 k m k rwm k f k rwf r 1 ( Δ p ¯ m r m ) | r m = r 1 = 1 η wf u Δ p ¯ f
The initial conditions are:
Δ p ¯ f | t = 0 = Δ p ¯ m | t = 0 = 0
The internal boundary conditions are:
lim r r w Δ p ¯ f = 1 u Δ p wf
The outer boundary conditions are:
Δ p ¯ f r | r = r e = 0
The seepage control equation of the matrix system in radial spherical coordinates is:
2 Δ p ¯ m r m 2 + 2 r m Δ p ¯ m r m = 1 η wm u Δ p ¯ m
The initial conditions are:
Δ p ¯ f | t = 0 = Δ p ¯ m | t = 0 = 0
The internal boundary conditions are:
Δ p ¯ m r m | r m = 0 = 0
The outer boundary conditions are:
Δ p ¯ m ( r m , t ) | r m = r 1 = Δ p ¯ f
Next, solve the partial differential equation of the matrix system under its definite solution condition. The general solution of Equation (51) is:
Δ p ¯ m = C m e β m r m + D m e β m r m r m
β m = u η wm
Substitute the general solution Equation (55) into the definite solution condition Equations (53) and (54) to obtain:
C m = 1 e β m e β m Δ p ¯ f
D m = 1 e β m e β m Δ p ¯ f
Therefore, the solution of Equation (55) is:
Δ p ¯ m = Δ p ¯ f r m e β m r m e β m r m e β m e β m
Take the derivative of rm in Equation (59) to obtain:
Δ p ¯ m r m | r m = r 1 = Δ p ¯ f r 1 2 ( β m r 1 1 ) e β m r 1 + ( β m r 1 + 1 ) e β m r 1 e β m e β m
Substituting Equation (60) into the seepage Equation (47) of fracture system gives:
2 Δ p ¯ f r 2 + 1 r Δ p ¯ f r f ( ζ ) Δ p ¯ f = 0
f ( ζ ) = 3 k m k rwm k f k rwf r 1 1 r 1 2 ( β m r 1 1 ) e β m r 1 + ( β m r 1 + 1 ) e β m r 1 e β m e β m + 1 η wf u
Equation (61) is the virtual argument Bessel equation, whose general solution is:
Δ p ¯ f = C I 0 ( r f ( ζ ) ) + D K 0 ( r f ( ζ ) )
d Δ p ¯ f d r = C f ( ζ ) I 1 ( r f ( ζ ) ) D f ( ζ ) K 1 ( r f ( ζ ) )
Substituting Equations (63) and (64) into Equation (49) for the inner boundary conditions and Equation (50) for the outer boundary conditions, respectively, gives:
d Δ p ¯ f d r | r = r e = C f ( ζ ) I 1 ( r e f ( ζ ) ) D f ( ζ ) K 1 ( r e f ( ζ ) ) = 0
lim r r w Δ p ¯ f = C I 0 ( r w f ( ζ ) ) + D K 0 ( r w f ( ζ ) ) = 1 u Δ p wf
Simultaneous (63) and (64):
C = Δ p wf u K 1 ( r e f ( ζ ) ) I 0 ( r w f ( ζ ) ) K 1 ( r e f ( ζ ) ) + I 1 ( r e f ( ζ ) ) K 0 ( r w f ( ζ ) )
D = Δ p wf u I 1 ( r e f ( ζ ) ) I 0 ( r w f ( ζ ) ) K 1 ( r e f ( ζ ) ) + I 1 ( r e f ( ζ ) ) K 0 ( r w f ( ζ ) )
Equation (65) and Equation (66) are then substituted into Equation (63) to obtain:
Δ p ¯ f = Δ p wf u K 1 ( r e f ( ζ ) ) χ I 0 ( r f ( ζ ) ) + Δ ψ wf u I 1 ( r e f ( ζ ) ) χ K 0 ( r f ( ζ ) )
Δ p ¯ f r = Δ p wf u K 1 ( r e f ( ζ ) ) χ f ( ζ ) I 1 ( r f ( ζ ) ) Δ p wf u I 1 ( r e f ( ζ ) ) χ f ( ζ ) K 1 ( r f ( ζ ) )
The water yield expression of a single well is:
q ¯ wf = 2 π k f k rwf h r w Δ p ¯ f r | r r w
Combined with Formula (70), the solution of the aqueous phase yield is:
q ¯ wf = 2 π k f k rwf h r w Δ p wf u f ( ζ ) [ K 1 ( r e f ( ζ ) ) I 1 ( r w f ( ζ ) ) I 0 ( r w f ( ζ ) ) I 1 ( r e f ( ζ ) ) K 1 ( r w f ( ζ ) ) I 0 ( r w f ( ζ ) ) K 1 ( r e f ( ζ ) ) I 1 ( r e f ( ζ ) ) + K 0 ( r w f ( ζ ) ) I 0 ( r w f ( ζ ) ) ]
The gas–water two-phase production solution in Equations (46) and (72) is obtained in Laplace space, and the solution in real space can be obtained using the numerical inversion of Stehfest [21].
There are still parameters related to pressure and saturation in Equations (46) and (72). In addition, Equation (73) gives the permeability expression considering stress sensitivity. In this paper, all stress sensitivity terms are integrated into the transmissivity coefficient as a function of average formation pressure [22,23,24]. In the process of solving the model, the average formation pressure and saturation within the production range are used to update the nonlinear parameters in each time step, and the solution of the model is obtained with step-by-step iteration, while the average formation pressure and average saturation are calculated using the flow material balance method.
k f = k fi e γ ( p i p ^ )
where kfi is the initial fracture permeability, mD and γ is permeability modulus, MPa−1.

3.3. Establishment of the Fluid Mass Balance Equation

The gas phase mass balance equation is:
S ^ g B ^ g = S gi B gi 0 t q g d t π r inv 2 h ϕ m
where, S gi represents the initial gas saturation; S ^ g is the average gas saturation; B gi represents the initial gas volume coefficient; B ^ g is the average gas volume coefficient; r inv is the utilization range, m; ϕ m is the matrix porosity, h is the effective reservoir thickness, m; and Qg is the daily gas production, 104 m3/d.
The formula for calculating the detection radius of a dual-medium reservoir is [25,26,27]:
r inv = 0.03248 k m ϕ m μ gi c ti t
The water phase material balance equation is:
S ^ w B ^ w = S wi B wi 0 t q w d t π r inv 2 h ϕ m
where S wi represents the initial water saturation, decimal; S ^ w represents average water saturation, decimal; and Qw is the daily water yield, m3/d.
Gas–water two-phase saturation satisfies the following relationship:
S ^ w + S ^ g = 1
Formulas (74), (76) and (77) are used to construct the average pressure function, including:
f ( p ^ ) = 1 B ^ g + ( B ^ w B ^ g ) E F
E = S wi B wi 0 t q w d t π r inv 2 h ϕ m
F = S gi B gi 0 t q g d t π r inv 2 h ϕ m
The derivation of Equation (78) yields:
f ( p ^ ) = 1 B ^ g 2 d B g d p + A 1 ( 1 B ^ g d B w d p + B w B ^ g 2 d B g d p )
The average pressure Newton iteration scheme is constructed from Equation (81), including:
p ^ k + 1 = p ^ k ω f ( p ^ k ) f ( p ^ k )
where k represents the last time step; k + 1 represents the current time step; and ω is the iteration factor.
The average pressure is obtained with Newton iteration, and then the average saturation can be calculated by substituting Equation (74) or Equation (76). The average pressure and saturation within the production range are used to update the nonlinear parameters in each time step, and the solution of the gas–water two-phase seepage model of carbonate gas wells can be obtained using step-by-step iterative calculation, and then the gas–water two-phase productivity curve can be programmed to predict the gas water production performance.

4. Dynamic Analysis of Gas–Water Two-Phase Production

4.1. Model Validation

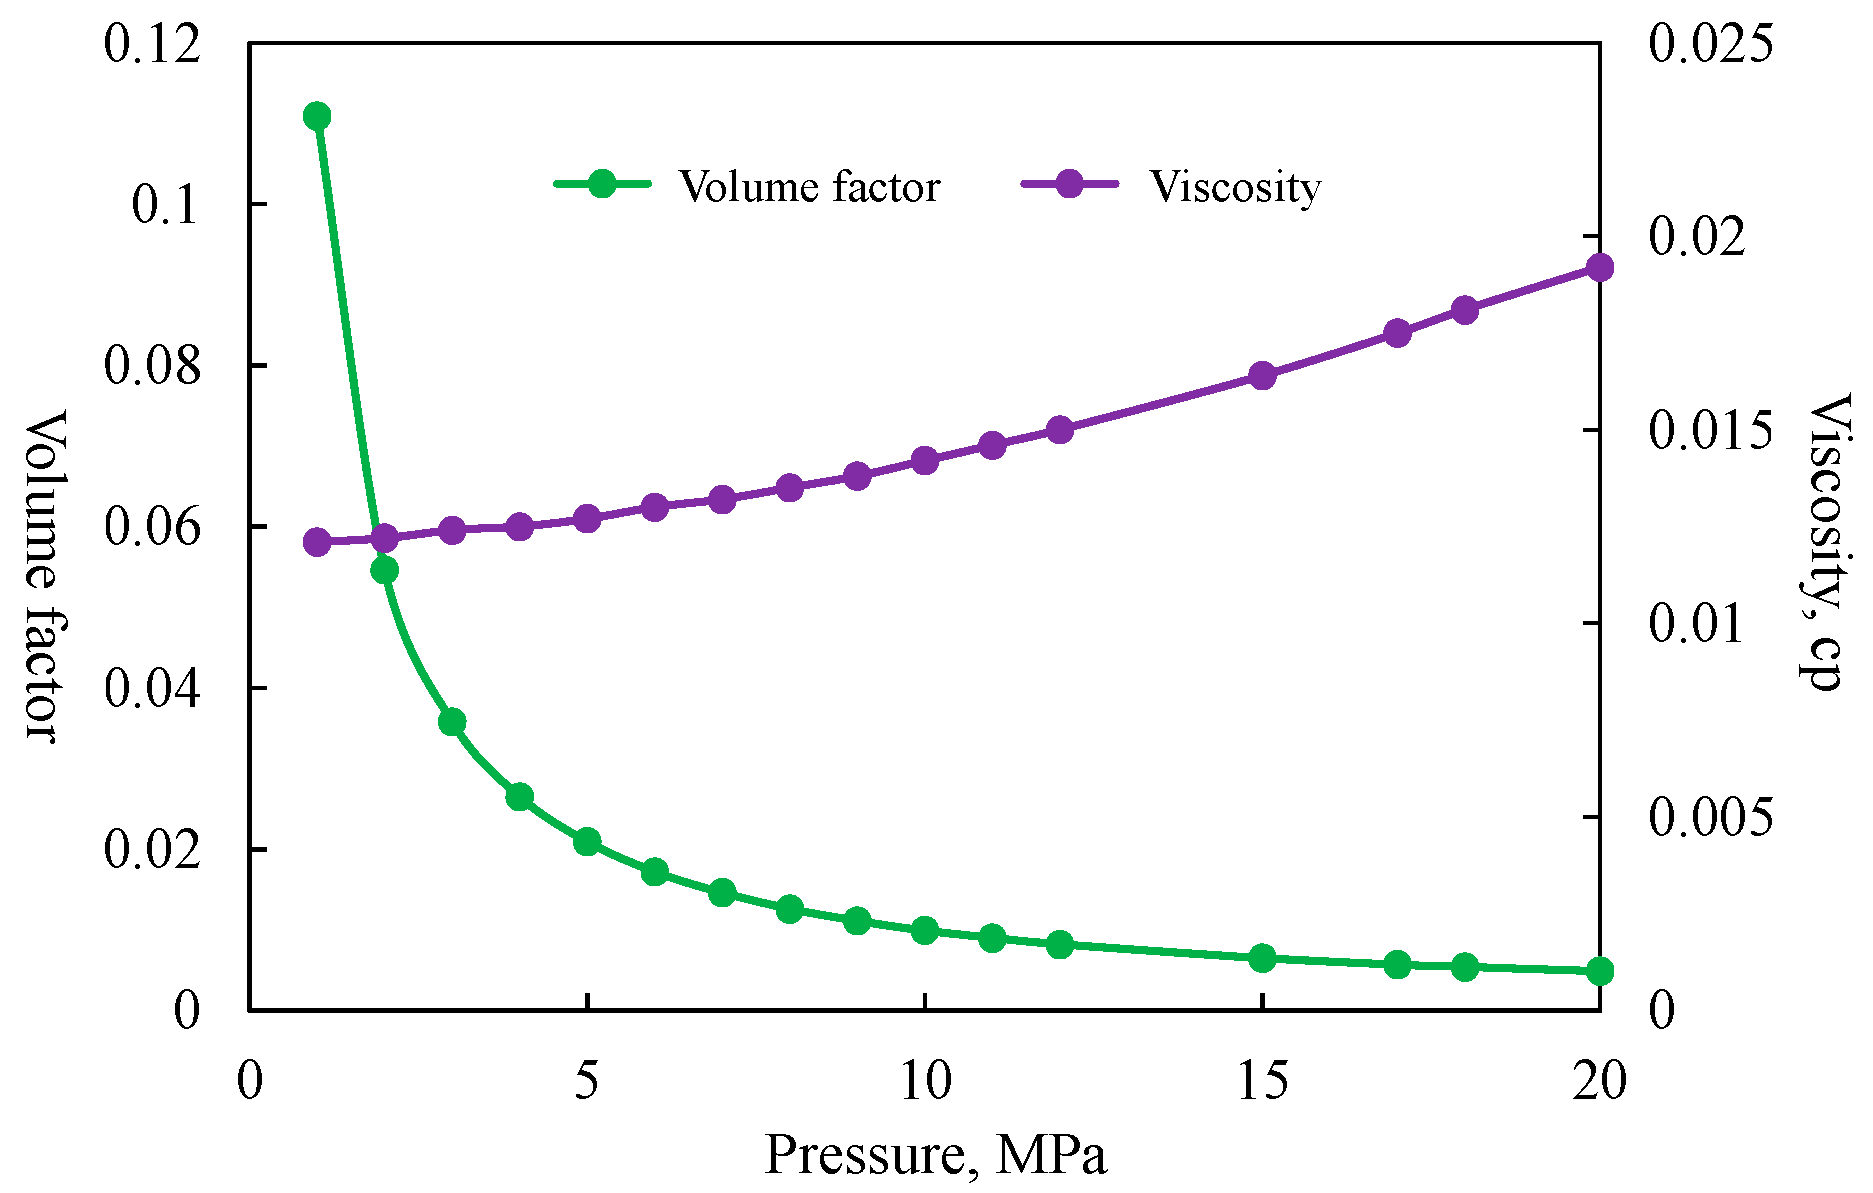
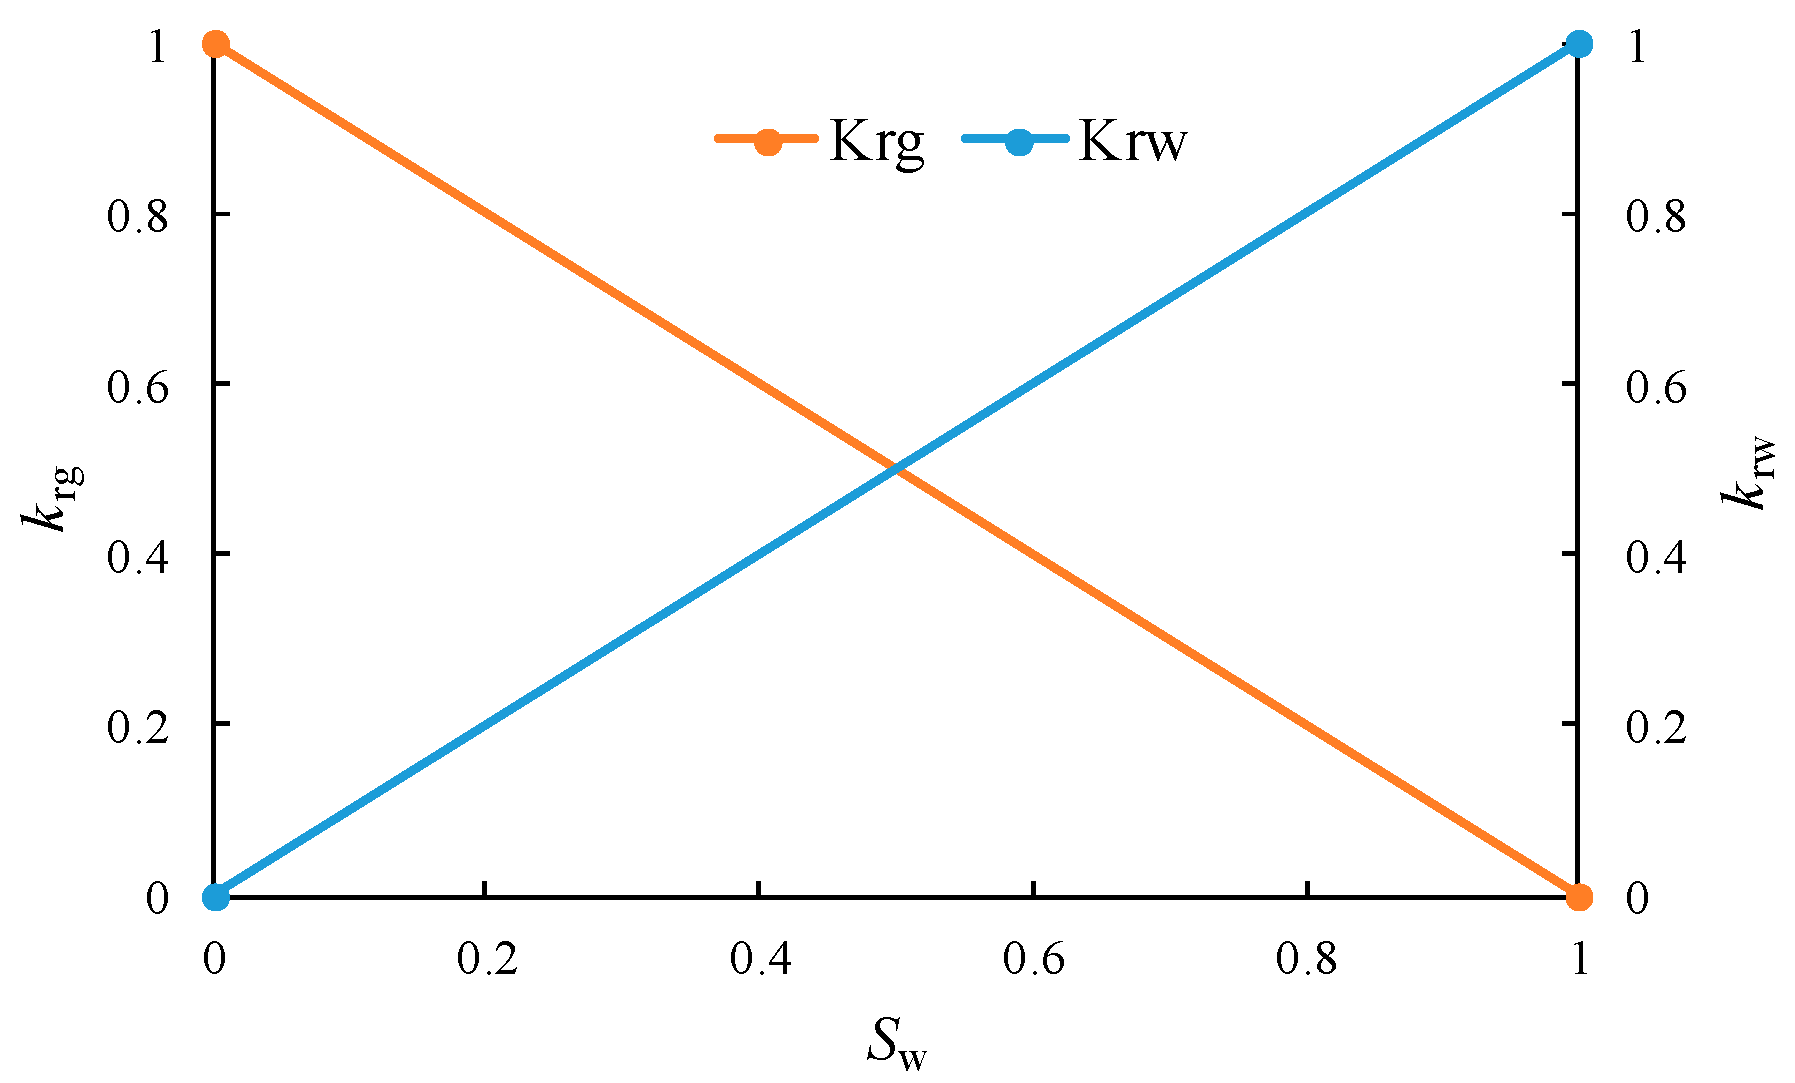
In order to verify the accuracy of the proposed semi-analytical model, this paper compares the calculation results with the commercial numerical simulation software Eclipse. First, a numerical model corresponding to the physical model in this paper is established: a straight well in the center of the carbonate dual-medium reservoir is used to produce at a fixed bottom flowing pressure. In this example, both the matrix and fracture system consider gas–water two-phase flow, that is, gas–water two-phase flow occurs at the beginning of production. The relationship curve of gas high-pressure physical parameters used in the model is shown in Figure 2. Table 1 shows the basic parameters used by the two methods, and Figure 3 shows the gas–water two-phase relative permeability curve in natural fractures [14].
The comparison results of the semi-analytical model and Eclipse in this paper are shown in Figure 4. It can be seen that the output curves obtained using the two methods are somewhat different in the early production period, and the results are basically the same in the later period. Under the same reservoir and fracture parameters, the productivity of the gas–water two-phase flow is significantly lower than that of the single-phase flow. This is mainly because in the early stage of production, the pressure and saturation near the well vary greatly, and production is very sensitive to the parameters related to pressure and saturation. In the semi-analytical model, pseudo pressure is used to implicitly process some parameters related to pressure, but the parameters related to saturation are treated explicitly, so the early error of the single-phase seepage model is not obvious, while the early error of the two-phase flow model is obvious. However, the average relative error calculated is less than 10%, which is within the allowable error range of the project, indicating that the semi-analytical model proposed in this paper can be used for production data analysis and prediction. Compared with the numerical simulation method, the semi-analytical method proposed in this paper has faster calculation speed and is more conducive to the application of large-scale case analysis in mines.

4.2. Analysis of Factors Affecting Production Dynamics

Based on the semi-analytical model, this paper focuses on the influence of the stress sensitivity coefficient, fracture porosity, and outer boundary distance on the productivity of carbonate gas wells. The basic input parameters of the model are collected in Table 2.
Figure 5 shows the influence of fracture porosity on production performance. It can be seen from Figure 5 that the greater the fracture porosity, the slower the decline rate in the gas–water two-phase production. In addition, the fracture porosity has a greater impact on the early and middle production stages, but less impact on the late stage. This is mainly because the fracture porosity reflects the fluid storage capacity in the fracture system. The larger the fracture porosity, the stronger the reservoir capacity. When the fracture porosity is large, production can be maintained with a small production decline under the production condition of constant bottom hole flow pressure. In addition, in the late production period, the supply capacity of the matrix to fractures plays a leading role, so the fracture porosity has little impact on the late production period.
Figure 6 shows the influence of the permeability modulus on production performance. The permeability modulus reflects the strength of stress sensitivity. It can be found that the permeability stress sensitivity of natural fractures affects the whole production process, especially in the early and middle production stages, and has little impact on the later production stages. In addition, with the increase in the permeability modulus, the position of the gas–water production curve moves downward. This is mainly because the strong stress sensitivity leads to the serious loss of fracture permeability and the increase in fluid seepage resistance, and more gas cannot be recovered, which ultimately leads to the reduction in gas production and the slowing down of the production decline trend.
Figure 7 shows the influence of the outer boundary distance on the production dynamics. It can be seen that the smaller the distance from the outer boundary, the lower the position of the gas and water production curve, and the faster the production decline. In addition, the distance from the outer boundary has a greater impact on the early and middle production stages but less impact on the late stage. The size of the outer boundary distance reflects the time of the boundary reaction. The greater the outer boundary distance, the later the boundary reaction time. When the outer boundary distance is larger, the production can be maintained with a small production decline under the production condition of constant bottom hole flowing pressure.

4.3. Case Analysis

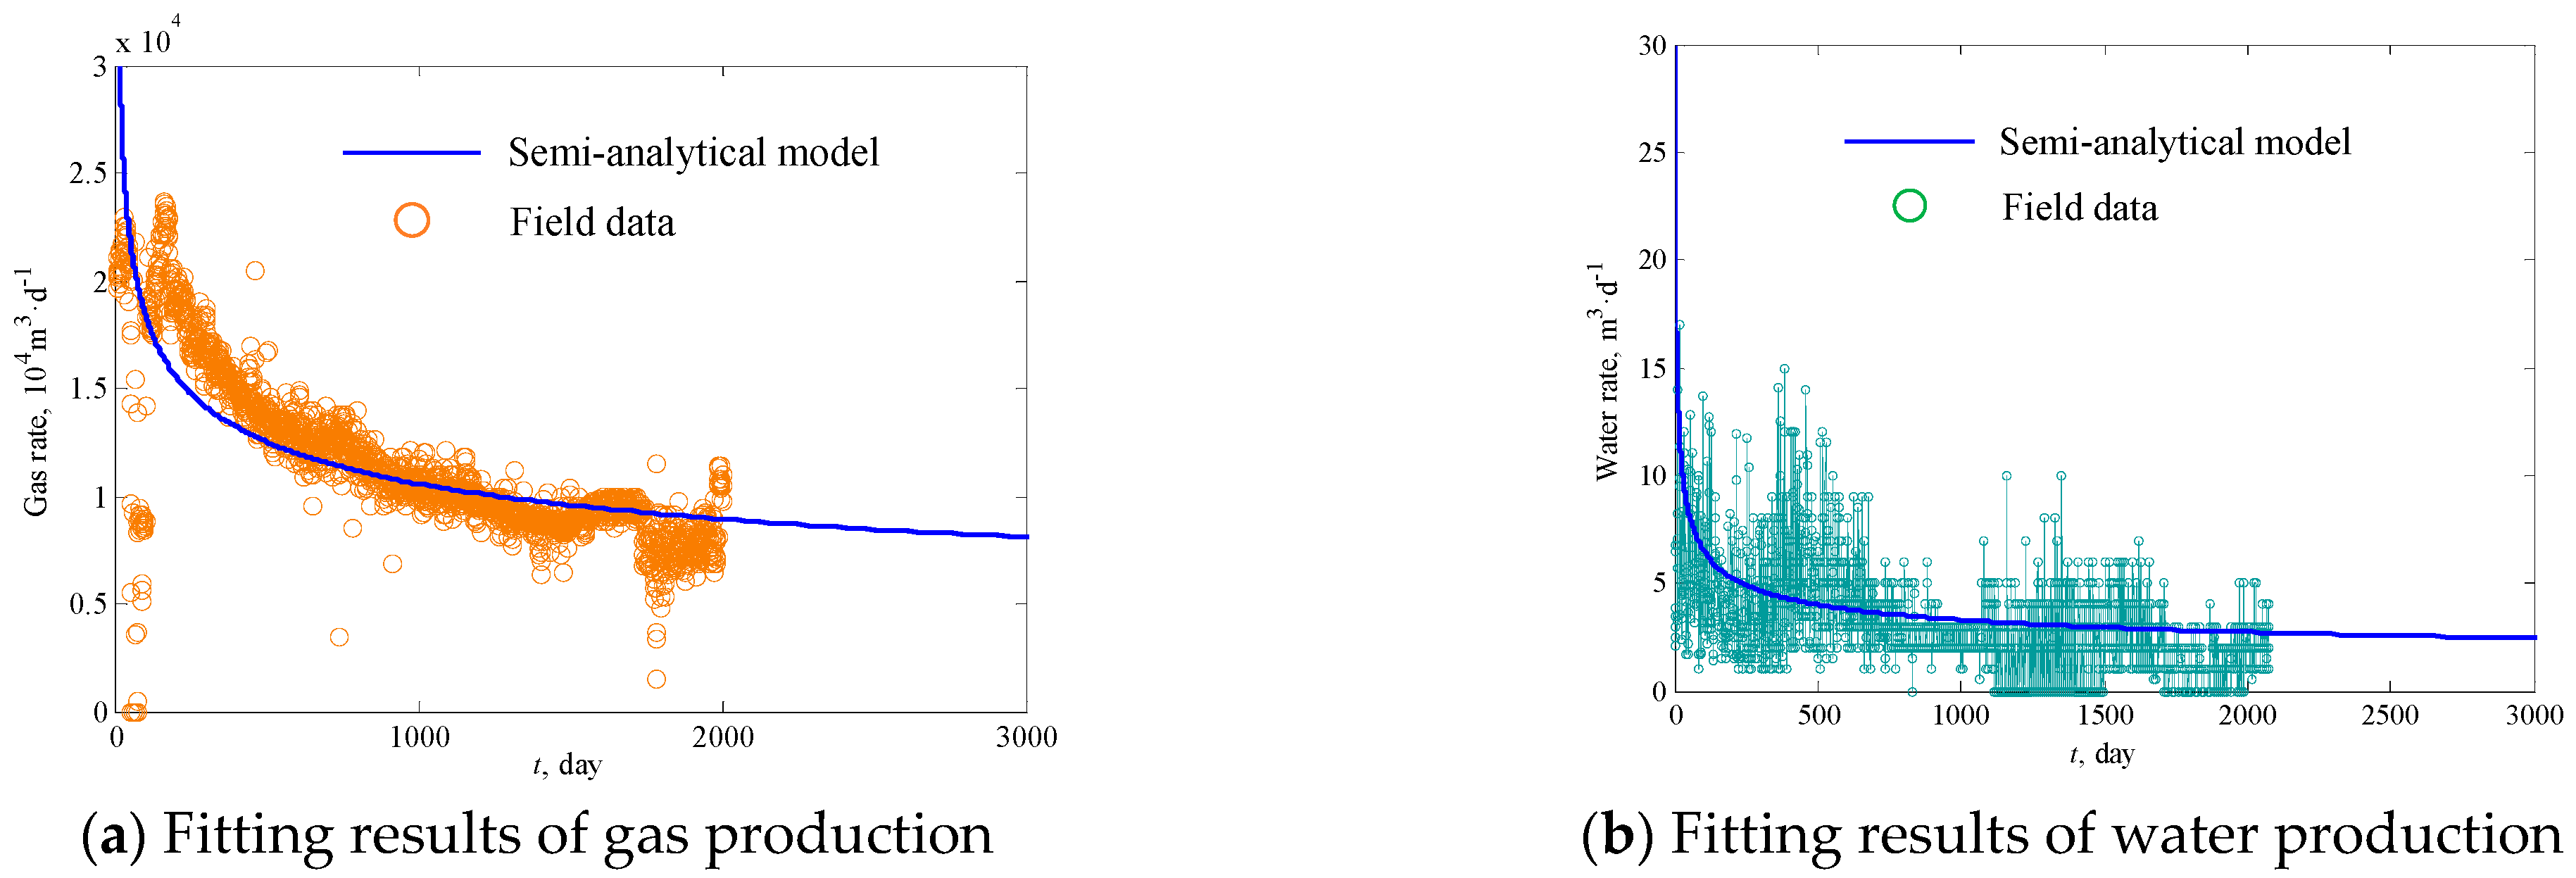
This paper takes a water-producing carbonate gas well in a basin as an example to illustrate the application effect of the model. The well was put into production in May 2018, and the initial water saturation of the reservoir was about 65%. As of April 2022, the cumulative gas production was 3543 × 104 m3, the cumulative water production was 3866 m3, the daily gas production was 9557 m3/d, and the daily water production was 1.25 m3/d. The basic data of the well are shown in Table 2. The PVT curve of gas and the gas–water relative permeability curve are shown in Figure 2 and Figure 3, respectively. The semi-analytical model proposed in this paper is used to fit and interpret the gas–water two-phase production data of the well, as shown in Figure 8. It can be seen that the fitting effect of the theoretical curve and the measured curve is good. Although there is a certain deviation in the fitting result, it is within the allowable range of engineering error. The fitting interpretation results of this well are summarized in Table 3, where the interpreted fracture porosity is 0.02, the outer boundary distance is 495 m, and the reservoir stress sensitivity coefficient is 0.035 MPa−1, which are consistent with the actual gas reservoir. The production of the well is predicted, and the gas production in 30 years is 7870 × 104 m3, and the produced water is 8.21 × 10⁴ m3.

5. Conclusions

In this paper, a productivity model considering complex fractures, the stress sensitivity effect, and the gas–water two-phase flow characteristics of the reservoir are established, and a semi-analytical solution method for the model is established by incorporating the flow material balance method. The productivity prediction of gas–water two-phase flow in carbonate gas wells can be realized. Main conclusions are now summarized:
(1)
The average pressure and average saturation of the reservoir are calculated using the flow material balance method, and the nonlinear parameters in the seepage model are updated step by step, which can deal with the gas–water two-phase nonlinear seepage problem with higher accuracy.
(2)
Validation work using the numerical model and field application showed that the semi-analytical method proposed in this paper has high prediction accuracy and can be used to predict the gas–water two-phase production of carbonate gas wells.
(3)
Fracture and key percolation parameters of the reservoir play important roles in gas–water two-phase production performance. Since the water production of carbonate gas reservoirs dramatically affects the productivity of a gas well, under the same reservoir and fracture parameters, the productivity with gas–water two-phase flow is significantly lower than that of single-phase flow.
(4)
The stress sensitivity of fractures affects the productivity of carbonate gas wells. In the production process, it is necessary to control the production pressure difference carefully to inhibit the negative impact of the stress sensitivity effect.

Author Contributions

Software and investigation, D.C.; supervision, Z.S. All authors have read and agreed to the published version of the manuscript.

Funding

The authors acknowledge financial support from the National Natural Science Foundation Projects of China (No. 51604261 and No. 52104099) and the Natural Science Foundation Projects of Jiangsu Province (No. BK20210508).

Institutional Review Board Statement

On behalf of all the co-authors, the corresponding author states that there are no ethical statements contained in the manuscripts.

Data Availability Statement

Data will be available on request.

Acknowledgments

The authors acknowledge financial support from the National Natural Science Foundation Projects of China (No. 51604261 and No. 52104099) and the Natural Science Foundation Projects of Jiangsu Province (No. BK20210508). We also acknowledge China University of Mining & Technology for the permission to publish this work.

Conflicts of Interest

The authors declare no conflict of interest.

References

  1. Wu, Y.; Cheng, L.; Huang, S.; Fang, S.; Jia, P.; Wang, S. A semianalytical model for simulating fluid flow in naturally fractured reservoirs with non-homogeneous vugs and fractures. SPE J. 2019, 24, 334–348. [Google Scholar] [CrossRef]
  2. Jones, F.O. A Laboratory Study of the Effects of Confining Pressure on Fracture Flow and Storage Capacity in Carbonate Rocks. Soc. Pet. Eng. 1975, 27, 21–27. [Google Scholar]
  3. Duan, Y.; Meng, Y.; Luo, P.; Su, W. Stress Sensitivity of Naturally Fractured-porous Reservoir with Dual-porosity. In SPE International Oil and Gas Conference and Exhibition in China; OnePetro: Beijing, China, 1998. [Google Scholar]
  4. Ayala, L.F.; Kouassi, J.P. The similarity theory applied to the analysis of two-phase flow in gas-condensate reservoirs. Energy Fuels 2007, 21, 1592–1600. [Google Scholar] [CrossRef]
  5. Sheng, G.; Zhao, H.; Su, Y.; Javadpour, F.; Wang, C.; Zhou, Y.; Liu, J.; Wang, H. An analytical model to couple gas storage and transport capacity in organic matter with noncircular pores. Fuel 2020, 268, 117288. [Google Scholar] [CrossRef]
  6. Sheng, G.; Su, Y.; Wang, W. A new fractal approach for describing induced-fracture porosity/permeability/ compressibility in stimulated unconventional reservoirs. J. Pet. Sci. Eng. 2019, 179, 855–866. [Google Scholar] [CrossRef]
  7. Wang, S.; Cheng, L.; Huang, S.; Xue, Y.; Bai, M.; Wu, Y.; Wang, J. A semi-analytical method for modeling two-phase flow behavior in fractured carbonate oil reservoirs. J. Energy Resour. Technol. 2019, 141, 072902. [Google Scholar] [CrossRef]
  8. O’Sullivan, M.J. A similarity method for geothermal well test analysis. Water Resour. Res. 1981, 17, 390–398. [Google Scholar] [CrossRef]
  9. Pruess, K.; Narasimhan, T.N. Practical method for modeling fluid and heat flow in fractured porous media. Soc. Pet. Eng. J. 1985, 25, 14–26. [Google Scholar] [CrossRef] [Green Version]
  10. Qu, M.; Hou, J.; Zhao, F.; Song, Z.; Ma, S.; Wang, Q.; Li, M.; Yang, M. 3-D visual experiments on fluid flow behavior of water flooding and gas flooding in fractured-vuggy carbonate reservoir. In Proceedings of the Paper SPE-187273-MS Presented at SPE Annual Technical Conference and Exhibition, San Antonio, TX, USA, 9–11 October 2017. [Google Scholar]
  11. Jia, P.; Cheng, L.; Huang, S.; Xue, Y.; Clarkson, C.R.; Williams-Kovacs, J.D.; Wang, S.; Wang, D. Dynamic coupling of analytical linear flow solution and numerical fracture model for simulating early-time flowback of fractured tight oil wells (planar fracture and complex fracture network). J. Pet. Sci. Eng. 2019, 177, 1–23. [Google Scholar] [CrossRef]
  12. Matthai, S.K.; Mezentsev, A.A.; Belayneh, M. Finite element-node-centered finite-volume two-phase-flow experiments with fractured rock represented by unstructured hybrid-element meshes. SPE Reserv. Eval. Eng. 2007, 10, 740–756. [Google Scholar] [CrossRef]
  13. Wu, Y.S.; Li, J.; Ding, D.Y.; Wang, C.; Di, Y. A Generalized Framework Model for Simulation of Gas Production in Unconventional Gas Reservoirs. SPE J. 2014, 19, 845–857. [Google Scholar] [CrossRef]
  14. Wu, Y.; Cheng, L.; Huang, S.; Jia, P. A green element method-based discrete fracture model for simulation of the transient flow in heterogeneous fractured porous media. Adv. Water Resour. 2020, 136, 103489. [Google Scholar] [CrossRef]
  15. Xu, Y.; Sheng, G.; Zhao, H.; Hui, Y.; Zhou, Y.; Ma, J.; Rao, X.; Zhong, X.; Gong, J. A new approach for gas-water flow simulation in multi-fractured horizontal wells of shale gas reservoirs. J. Pet. Sci. Eng. 2021, 199, 108292. [Google Scholar] [CrossRef]
  16. Wu, Y.; Cheng, L.; Ma, L.; Huang, S.; Fang, S.; Killough, J.E.; Jia, P.; Wang, S. Transient two-phase flow model for production prediction of tight gas wells with fracturing fluid-induced formation damage. J. Pet. Sci. Eng. 2021, 199, 108351. [Google Scholar] [CrossRef]
  17. De Swaan, A.O. Analytical solution for determining naturally fractured reservoir properties by well testing. SPE J. 1976, 16, 117–122. [Google Scholar]
  18. Sun, Z.; Li, X.; Liu, W.; Zhang, T.; He, M.; Nasrabadi, H. Molecular Dynamics of Methane Flow Behavior through Realistic Organic Nanopores under Geologic Shale Condition: Pore size and Kerogen Types. Chem. Eng. J. 2020, 398, 124341. [Google Scholar] [CrossRef]
  19. Zhou, W.; Banerjee, R.; Poe, B.; Spath, J.; Thambynayagam, M. Semi-analytical production simulation of complex hydraulic fracture networks. SPE J. 2014, 19, 6–18. [Google Scholar] [CrossRef]
  20. Jia, P.; Cheng, L.; Huang, S.; Liu, H. Transient behavior of complex fracture networks. J. Pet. Sci. Eng. 2015, 132, 1–17. [Google Scholar] [CrossRef]
  21. Stehfest, H. Numerical Inversion of Laplace Transforms. ACM Commun. 1970, 13, 47–49. [Google Scholar] [CrossRef]
  22. Clarkson, C.R.; Qanbari, F. A semi-analytical forecasting method for unconventional gas and light oil wells: A hybrid approach for addressing the limitations of existing empirical and analytical methods. SPE Reserv. Eval. Eng. 2014, 18, 260–263. [Google Scholar]
  23. Sun, Z.; Huang, B.; Liu, Y.; Jiang, Y.; Zhang, Z.; Hou, M.; Li, Y. Gas-phase production equation for CBM reservoirs: Interaction between hydraulic fracturing and coal orthotropic feature. J. Pet. Sci. Eng. 2022, 213, 110428. [Google Scholar] [CrossRef]
  24. Sun, Z.; Wang, S.; Xiong, H.; Wu, K.; Shi, J. Optimal nanocone geometry for water flow. AIChE J. 2022, 68, e17543. [Google Scholar] [CrossRef]
  25. Wattenbarger, R.A.; El-Banbi, A.H.; Villegas, M.E.; Maggard, J.B. Production analysis of linear flow into fractured tight gas wells. Gas Field 1998. [Google Scholar]
  26. Clarkson, C.R.; Qanbari, F. History-matching and forecasting tight gas condensate and oil wells using the dynamic drainage area concept. In Proceedings of the SPE/CSUR Unconventional Resources Conference, Calgary, AB, Canada, 20–22 October 2015; Society of Petroleum Engineers: Calgary, AB, Canada, 2015. [Google Scholar]
  27. Wang, S.; Cheng, L.; Xue, Y.; Huang, S.; Wu, Y.; Jia, P.; Sun, Z. A semi-analytical method for simulating two-phase flow performance of horizontal volatile oil wells in fractured carbonate reservoirs. Energies 2018, 11, 2700. [Google Scholar] [CrossRef]
Figure 1. Schematic diagram of the well model in a fractured carbonate gas reservoir.
Processes 11 00591 g001
Figure 2. Schematic of the gas PVT properties.
Processes 11 00591 g002
Figure 3. Relative permeability of the natural fracture system.
Processes 11 00591 g003
Figure 4. Comparison of production performance from the semi-analytical method and numerical simulation method.
Processes 11 00591 g004
Figure 5. Effects of fracture porosity on the gas and water production rates.
Processes 11 00591 g005
Figure 6. Effects of the stress sensitivity of the fracture on the gas and water production rates.
Processes 11 00591 g006
Figure 7. Effects of the radial distance of the external boundary on the gas and water production rates.
Processes 11 00591 g007
Figure 8. Interpretation and prediction of the production decline in the example wells.
Processes 11 00591 g008
Table 1. Input parameters for model validation.
ParameterValueParameterValue
Reservoir temperature, K373 KOriginal formation pressure, MPa22
Fracture permeability, mD50Reservoir radius, m500
Bottom hole flow pressure, MPa6Initial gas saturation, %65
Compressibility coefficient of rock, MPa−11 × 10−4Permeability modulus, MPa−10.02
Matrix porosity, %9Matrix permeability, mD0.025
Effective thickness of reservoir, m29Wellbore radius, m0.07
Table 2. Range of values for sensitive parameters.
ParameterValue
Permeability modulus, MPa−10.01, 0.05, 0.1
Fracture porosity, %0.1, 1, 5
Outer boundary distance, m400, 500, 600
Table 3. Matching Interpretation Results of Example Wells.
ParameterValue
Fracture porosity0.02
Permeability modulus, MPa−10.035
Outer boundary distance, m495
Disclaimer/Publisher’s Note: The statements, opinions and data contained in all publications are solely those of the individual author(s) and contributor(s) and not of MDPI and/or the editor(s). MDPI and/or the editor(s) disclaim responsibility for any injury to people or property resulting from any ideas, methods, instructions or products referred to in the content.