Article

In Silico Prediction, Characterization and Molecular Docking Studies on New Benzamide Derivatives

1
Department of Pharmaceutical Chemistry, Faculty of Pharmacy, “Carol Davila” University of Medicine and Pharmacy, Traian Vuia no.6, 020956 Bucharest, Romania
2
National Institute of Chemical-Pharmaceutical Research & Development, Vitan Av. 112, 031299 Bucharest, Romania
3
Department of Anatomy, Animal Physiology and Biophysics, Faculty of Biology, University of Bucharest, 91–95 Splaiul Independentei, 050095 Bucharest, Romania
4
Department of Automatic Control and Systems Engineering, Politehnica University of Bucharest, 313 Splaiul Independentei, 060042 Bucharest, Romania
*
Author to whom correspondence should be addressed.
Processes 2023, 11(2), 479; https://doi.org/10.3390/pr11020479
Submission received: 27 December 2022 / Revised: 22 January 2023 / Accepted: 2 February 2023 / Published: 5 February 2023
(This article belongs to the Special Issue Pharmaceutical Development and Bioavailability Analysis)

Abstract

:
Recent research papers have confirmed the prevalence of microorganisms resistant to numerous antimicrobial agents, leading to spreading infections, extended hospitalizations, and increased mortality rates. The amplifying factors stimulate the need to discover new molecules able to cut off the developing resistance of pathogens against medicines. The current study presents a molecular docking procedure applied on 15 new pyridine–thiourea derivatives in order to test their activities against S. aureus and E. coli. The protein crystal structures were obtained from the Protein Data Bank (PDB). Processes such as geometry optimization, molecular properties (log P, polarizability, E HOMO, E LUMO, area and volume of the molecules, and ovality), drug-likeness, pharmacokinetic and pharmacogenomic profiles, and molecular docking studies are discussed in the present research. The approach involved the determination of the molecular properties for each chemical structure by using the Spartan 14 software, followed by the evaluation of their binding affinity through a specific docking score with the aid of the CLC Drug Discovery Workbench. Each studied compound established hydrogen bonds with the selected receptors, leading to suitable docking scores and increasing the chances of the compound being considered for further investigation.

1. Introduction

New pharmaceutical drugs were intended to be developed in recent years due to the wide and growing resistance to existing and overused medicines [1]. Among them, a significant number of compounds with pyridine scaffolds have been synthesized [2,3,4,5,6]. Pyridine and its derivatives are considered resourceful scaffolds when considering the formulation of a library of compounds, as pyridine and dihydropyridine are present in many natural products such as alkaloids, vitamins (e.g., vitamin B6), and coenzymes (e.g., NAD, NADP) [7,8].
The scientific literature and governmental entities have provided actual evidence of the prevalence of pyridines as valuable structural units [3,9,10,11]. According to the US Food and Drug Administration (FDA) database, up to 18% of approved heterocyclic drugs are represented by pyridines or pyridine derivatives. With regard to the type of substituted pyridine moiety, there is published evidence that the majority of derivatives are monosubstituted, registering a percentage of 60%, followed by di- (22%), tri- (12%), and tetrasubstituted (6%) chemical structures [7].
Pyridine derivatives, the most notable chemical heterocycles, have been explored for their broad spectrum of pharmacological properties in different biological areas. Some examples of therapeutic areas and indications include infections [12,13], nervous system pathologies [8,14], oncology [15,16,17,18], and inflammations [19,20,21,22,23,24,25,26,27,28,29]. In an attempt to develop new therapeutical agents with a higher potency and better toxicity profiles, agents coupling pyridine and urea functionalities have been synthesized [30].
In the present study, a synthetic strategy was developed involving two scaffolds, namely thiourea and pyridine moieties. The aim of the current research was to develop new analogues of a known chemical template, resulting in pharmaceutical leads as chemical products.
The current research covers a library of 15 compounds evaluated by the determination of a series of molecular descriptors, interconnected in order to elucidate and predict their behavior within the human body based on the chemical structure of the scaffold.
Moreover, in order to estimate the reactivity and stability of the molecules, the reactivity descriptors were evaluated by conceptual density functional theory (DFT). The energy of the highest occupied molecular orbitals (HOMO) is related to the reactivity of the molecule when considering the reactions with electrophiles. On the other hand, the low energy of the lowest unoccupied molecular orbitals (LUMO) is necessary when a reaction with nucleophiles is considered [31].
For investigating the reactivity of the site and the relative polarity of the molecules, the molecular electrostatic potential (MEP) [32] was evaluated by using the DFT B3LYP method with the basis set 6-31G*.
In addition, based on our expertise in the prediction of molecular mechanisms of new drugs, antimicrobial bioinformatic tools were used to predict the drug-like, absorption, distribution, metabolism, and elimination (ADME) profiles of the studied compounds [33], with an emphasis on predicting the toxicity profiles of compounds.
Molecular docking studies were selected as a method of bioinformatic modeling to predict the interaction between the studied molecules and a receptor, or the potential generation of stable adducts with an optimized docking conformation [34]. The computational model generated different docking simulations, evaluated by a docking score. Essentially, the information collected through the docking technique after obtaining the optimized docked conformers was used to predict the binding energy, along with the stability of the conformers [35]. The library of studied molecules (ligands) was optimized to be placed into a favorable and specific binding site on the target receptors of proteins. The simulation approaches were carried out by selecting the target proteins DNA gyrase B of S. aureus and DNA gyrase B of E. coli. The complementarity between the receptors and ligands was estimated and the orientation was optimized, returning a score that suggested a suitable affinity of the studied molecules for the proposed target proteins, as well as a stable complex characterized by its specificity and efficiency [36,37,38].

2. Materials and Methods

2.1. Molecular Properties

The properties related to absorption, distribution, metabolism, elimination, and toxicology (ADMET) can be quantitatively predicted through in silico computational approaches. Progress has been made using molecular modeling techniques, which are important for examining the quantitative structure activity relationship (QSAR—reliable statistical models, intended to describe the behavior of a chemical compound in the internal medium of the human body). QSAR models have been used to identify relationships between the physico-chemical properties of the molecules and their biological activities.
For the designed compounds, the molecular properties were determined through the use of a Spartan 14 (developed by Wavefunction, Inc.) analysis, based on the density functional algorithm for equilibrium energy in the ground state (DFT B3LYP method, basis set 6-31G*). CPK models generate a 3D conformation and, through a series of Van der Waals radii, the free surface area and volume of the atoms are calculated. Spartan 14 provides the quantities serving the QSAR description.
The molecular descriptors related to Lipinski’s rule of five were calculated by using the Spartan 14 Wavefunction Calculation Tools. In the present study, the XLOGP3-AA method was used for the calculation of the octanol–water partition coefficient (log P).
In addition, the most important graphic models used to contribute to details about electron density and chemical reactivity are displayed, namely: a frontier molecular orbital (FMO) energy diagram, an electrostatic potential map (describing the charge distribution and predicting the sites of electrophilic addition), a local ionization potential map (providing information related to the energy of electron removal—ionization), and a |LUMO| map (index of nucleophilic addition and the absolute value of the lowest unoccupied molecular orbital on the electron density).
Derived parameters were also calculated: the energy band gap (∆E), ionization potential (I), electron affinity (A), chemical hardness (ƞ), chemical softness (S), electronegativity (χ), chemical potential (µ), and electrophilicity index (ψ).

2.2. Molecular Docking

The CLC Drug Discovery Workbench (QIAGEN Aarhus, Silkeborgvej 2, Prismet 8000, Aarhus C, Denmark) software was used for docking purposes.
The docking protocol has been shown in previous studies [39].
In the docking process, the ligands (1a1o) were placed on the surface of the target protein, into the predictable binding site. An MMFF94 force field was utilized in order to generate the 3D structure on import. The optimized ligand was obtained by conformation changes and geometry optimization with the MMFF94 force field. The protein–ligand interaction was measured through a docking score. The ligand binding mode was searched in the binding site (the binding site is represented by a green sphere radius that covers all ligands docked on the receptor protein).
The receptor protein was imported from PDB, and the binding site and binding pockets were set up. The binding pockets were intended to guide the docking simulation. The co-crystallized natural ligands were extracted and docked in the active binding site for the validation of the method.
The docking parameters, specifically the score along with the hydrogen bonds established with the amino acids in the interaction group, were obtained; the results were interpreted in relation to the affinities, the prediction of bonding models, and the orientation of the developed compound in the suitable active site of the receptor protein.

2.3. Molecule Preparation for ADME-Tox Features

A simplified molecular input line entry (SMILES) file of compounds 1a1o was obtained by using the Molecular Operating Environment (MOE) software [40]. These files were used for further bioinformatic and cheminformatic analyses.

2.4. Assessment of Drug- and Lead-Likeness Features

To evaluate the features of drug- and lead-likeness, the chemical compounds 1a1o were evaluated using a few medicinal chemistry rules: Lipinski, Ghose, Veber, and Egan, using the SwissADME web service [41].

2.5. Computational Pharmacokinetic and Pharmacogenomic Profiles

The SMILES files of molecules 1a1o were uploaded into the pkCSM database [42] to examine the ADMET properties. The human intestinal absorption (in %) was quantified, together with the BBB permeability, AMES toxicity, inhibitory activity on hERG I and II, and hepatotoxicity of the compounds. The pharmacogenomic profile extracted from the pkCSM webserver was used to predict the capacity of the compounds to be substrates or inhibitors of CYP2D6, CYP3A4, CYP1A2, CYP2C19, and CYP2C9.

3. Results

3.1. Compound Selection

A versatile library of 15 thiourea- and/or pyridine-based chemical compounds (referred to as structure 1a--1o, Table 1), which differed from other functional groups, were evaluated regarding their quantitative structure–activity relationship (QSAR) applications. In the table hereafter, the structures chemically derived from 2-((4-ethylphenoxy) methyl)-N-(heteroarylcarbamothioyl)benzamides are represented.
The limiting factor was represented by the development and selection of the most promising compounds. By utilizing in silico procedures, such as molecular docking software and programs that generate molecular properties for the evaluated agents, the time effectiveness and procedure of blocking agents with lower possibilities of interacting with the receptors were assessed.

3.2. Ligand Preparation

3.2.1. Geometry Optimization of the Ligands

The density functional theory (DFT) was used in the current study for the selected compounds in order to determine their chemical mechanisms and molecular properties. In this scope, firstly, the 3D structures were generated; then, their geometry was optimized through energy minimization. The outcome is represented by the most stable conformers (Figure 1a,b).

3.2.2. In Silico Exploration of Molecular Properties

In order to understand the molecular structures and functions of the molecules, a series of physical parameters were calculated. The tables hereafter (Table 2 and Table 3) provide information regarding the molecular properties, including area, volume, polar surface area (PSA), ovality, log P, polarizability, and the energy of the frontier molecular orbitals (FMOs)—the highest occupied molecular orbital (HOMO) and lowest unoccupied molecular orbital (LUMO)—as well as their derived parameters: the energy gap (∆E), ionization potential (I), electron affinity (A), chemical hardness (ƞ), chemical softness (S), electronegativity (χ), chemical potential (µ), and electrophilicity index (ψ). The calculus of the mentioned parameters is described in the legend of Table 2 and Table 3.
The calculation was carried out by using isolated molecules, in gas, at the equilibrium geometry in the ground state for the lowest energy conformer, characterized by a minimum energy in all dimensions (Spartan 14 Wavefunction analysis, based on the density functional algorithm, for the equilibrium energy in the ground state (DFT B3LYP method, basis set 6-31G*)).
The presented in silico models were developed with the rationale of reducing the expensive and time–consuming resources required in the laborious process of the development of new chemical structures. The computational models were able to detect the molecules with the highest potential activities, thus avoiding the synthesis of the chemicals with inconsistent ADMET profiles in the next stages of research [43].
The octanol–water partition coefficient (log P) represents a prevalent path for determining the lipophilic nature of a compound. The log P is calculated as the logarithmic form of the ratio between the concentration of the solute in the organic phase (octanoic phase) and its concentration in the aqueous phase. Log P is extremely useful in the early stages of the development processes, as the lipophilicity reveals to what extent the molecule penetrates the biological membranes and distributes in the biological system. Log P can be linked to properties such as the absorption, distribution, penetration of the central nervous system, and excretion (ADME) [44,45,46].
The partition coefficient is a preferred feature for describing the solubility of a molecule, its protein binding, how long the chemical is stored in the fat tissue, and if there are environmental risks in agricultural domains [47,48]. In Lipinski’s rule of five, log P is one of the descriptors that estimate the drug likeness of the chemical candidates, along with the molecular weight and the number of H-bond acceptors and donors for the appropriate ADME [49]. According to Lipinski’s rule, log P should not exceed values higher than 5, so as to make the drug suitable for oral administration.
As mentioned before, for a molecule to have blood–brain barrier (BBB) permeability, it should be characterized by lipophilicity. The scientific literature provides an example of built-up permeability through the BBB, namely the enhanced lipophile character from morphine to heroin. The acetylation of 3- and 6-hydroxy groups on the morphine structure, with a log P of 0.99, results in a heroin compound, rising the log P to 2.3. The alteration increases the lipophilicity of the final molecule, facilitating the penetration through the BBB [49].
On the contrary, although drug candidates require lipophilic properties for good penetration of the lipid bilayer of cellular membranes, log P values over 3 are an attribute of lipophilicity, raising concerns about toxic events such as hepatotoxicity [50]. Pharmacokinetic parameters are considered, as the plasma distribution decreases with the growth of protein binding in the serum and plasma clearance, leading to decreases in the plasma area under the curve (AUC). Protein binding may increase the size of the molecule, leading to the incapacity of BBB permeability [49].
The absorption and the transport of a studied molecule can be predicted based on a polar surface area (PSA) calculation, where the maximum values should be limited to 120 Å for efficient and proper cell permeability [51]. The set limit is sustained even in a study that takes into account 45 chemical compounds [52]. The molecules are analyzed for oral absorption and brain barrier permeability. A linear dependency was discovered between the polar surface area and the penetration of the molecule through the brain barrier, with further confirmation that the penetration is diminished when the PSA increases.
This particular property should be considered on the outset of the screening process, especially for molecules intended for oral use and those targeted for brain penetration [49,53].
Another descriptor of molecules is represented by ovality. The ovality is a means of expressing to what extent the molecule deviates from the ideal spherical shape. A value of 1.0 represents a spherical model, and values greater than 1.0 indicate a deviation [39].
Of significant importance is the energy difference between the highest occupied orbital and the lowest unoccupied orbital, referred to as the HOMO–LUMO gap (∆E). For instance, high values of ∆E are correlated with a high energy needed for electrons to skip from an occupied orbital to an unoccupied orbital. Consequently, the smaller the HOMO–LUMO gap, the higher the chemical reactivity of the molecule. On the contrary, the chemical reactivity is lowered by the increasing of the HOMO–LUMO gap [39,54,55].
The energy band gap (∆E = ǀEHOMO − ELUMOǀ) is large for hard molecules and small for soft molecules. As softness is a measure of chemical reactivity, a soft molecule is considered more reactive [56,57,58]. As described in Table 3, the electron affinity and ionization energy are derived from EHOMO and ELUMO.
A molecule is more reactive when the energy band gap is smaller and the softness is larger. Judging by the calculated values for the energy band gap and softness, the reactivity of the chemicals reduces in the following order: 1d > 1n > 1i > 1a > 1l > 1j > 1k > 1g > 1m > 1o > 1h > 1c > 1b > 1e > 1f (Figure 2). On the other hand, the stability of the molecules is indicated by an increased ∆E. Consequently, the stability of the entities is the reverse of reactivity, and the stability of the studied compounds increases as follows: 1d < 1n < 1i < 1a < 1l < 1j < 1k < 1g < 1m < 1o < 1h < 1c < 1b < 1e < 1f (Figure 3).
The compound 1d stands out from the series, being characterized by the highest reactivity (∆E = 2.2798) and the lowest stability (S = 0.4386) among the tested entities. The values obtained after carrying out the calculations proved to be similar except for the compound 1d; the relative standard deviations calculated for the energy band gap and chemical softness values were 3.15% (standard deviation = 0.114) and 3.23% (standard deviation = 0.009), respectively, meaning that the obtained data was tightly clustered around the mean.
The most reactive compound in the series (1d) was differentiated through a methyl radical in the ortho position on the pyridine ring. On the other hand, the most stable molecule (1f) contained the methyl radical in the para position. It may not be the substituent itself that has any stabilizing effect, but rather its position on the pyridine ring.

3.2.3. Quantum Chemical Calculations—Graphical Models

Important graphic quantities such as the electrostatic potential map, the local ionization potential map, and the LUMO map obtained from the quantum chemical calculations were displayed through the Spartan 14 software.
The LUMO map is an index for nucleophilic addition, and is an indicator of the absolute value derived from the lowest unoccupied molecular orbital on the electron density surface. The absolute values are marked by colors (Figure 4). The LUMO map has its utility in pointing to where a nucleophilic attack would occur with a high probability. As noticed, the molecule 1d is mapped in red; it was characterized by an enhanced stabilization, correlated with a reduced HOMO–LUMO gap.
The molecular electrostatic potential (MEP) was calculated to investigate the chemical reactivity of the studied compounds. The MEP is especially important for the identification of the reactive sites of nucleophilic or electrophilic attack in hydrogen-bonding interactions [59]. An electrostatic potential map shows hydrophilic regions in red (negative potential) and blue (positive potential) and hydrophobic regions in green (Figure 5). For all compounds, the maxima of the negative regions are localized on the O21 atoms, and the maxima of the positive regions are localized on N17 atoms.
A local ionization potential map is considered another index of electrophilic addition, showing the energy of electron removal—ionization—on the electronic density. The local ionization map is the result of the overlay of the energy of electron removal (ionization) on the electron density and can also indicate an electrophilic addition (Figure 6).

3.2.4. Drug-Likeness, Pharmacokinetic, and Pharmacogenomic Profiles of 1a1o Compounds

In the early stages of development, the “drugability” of new entities is constantly sought in order minimize the consumption of resources and time. The suitable oral bioavailability of studied molecules is evaluated through theoretical mathematical models; among them, a highly used predictor is represented by Lipinski’s rule of five [60].
The rule of five is used to evaluate if a molecule has suitable properties to be considered as a potential active pharmaceutical ingredient with oral administration [49].
In conformity with Lipinski’s rule, a rational drug design for a lead chemical candidate with potential oral absorption and high permeation should be characterized by: a molecular mass less than 500 Da, a number of H-bond acceptors less than 10, a number of H-bond donors less than 5, and a partition coefficient (log P) not greater than 5 (or Mlog P > 4.15) [49,61].
As the literature states [49], the violation of two or more properties in the rule of five could classify the evaluated compound as a non-oral delivery route drug. Lipinski’s rule sets the possibility and advantage to remove from the study the compounds that are not of interest in the developing research.
As identified in the table above (Table 4), five of the studied compounds followed the rule of five (1a, 1b, 1c, 1e, and 1f). The mentioned compounds can be distinguished by respecting the partition coefficient limits (log P < 5). The compound 1a contained a thiazole radical attached to the thiourea moiety and the compounds 1b and 1c held a pyridine radical on the thiourea moiety; on the other hand, the chemicals 1e and 1f were designed with a methyl radical on the pyridine nucleus, in the ortho- and para- positions with respect to the thiourea moiety. It was noticed that the position of the methyl radical on the pyridine moiety influenced the compound’s lipophilicity (the chemical structure of 1d, log P = 6.03). Besides, the Cl- and Br- radicals, set on the pyridine nucleus, determined the increase in the partition coefficient; specifically, the compounds were more lipophilic. To illustrate by example, the structure 1o, which includes two bromine atoms on the pyridine moiety, imprinted the highest lipophilic character in the evaluated series (log P = 7.04), followed by 1m, which was configured with two chloride atoms in the same positions. Along with the violation of Lipinski’s rule regarding lipophilicity, the compound 1o also had a molecular mass greater than 500 Da (549.28 Da).
The results generated from the medicinal chemistry filtering (Lipinski, Ghose, Veber, and Egan) are showed in Table 5.
Our results show that compounds 1a1n complied with the drug-likeness rules, indicating that these compounds have a possible drug effect and good bioavailability, except for compound 1o (see Table 5).
Furthermore, the ADME-Tox predictable properties of the compounds 1a1n were evaluated (Table 6) with an emphasis on (i) intestinal absorption, (ii) BBB permeability, and (iii) items of toxicity, expressed as AMES, hepatotoxicity, cardiotoxicity, and skin sensitization.
The results revealed that all compounds exhibited excellent intestinal absorption (from values of 91.829 for 1c to 88.364 for 1m). For the BBB permeability, it was noticed that the complexes had good recorded BBB permeability values (log BBB varied from −0.124 to 0.033). In this study, great importance was given to predicting the toxicity of compounds. The results revealed that none of the compounds exhibited AMES, cardiotoxicity, or skin sensitization. Furthermore, compounds 1b1f, 1h, and 1l appeared to induce hepatotoxicity.
Therefore, a pharmacogenomic profile of the active compounds was generated (Table 7). The results regarding metabolic pathways showed that all compounds had interactions with CYP3A4, CYP2C19, and CYP2C9, but not with CYP2D6.

3.3. Molecular Docking Studies and Predictive Ligand–Receptor Interactions

The molecular docking studies were carried out by using the CLC Drug Discovery Workbench software. A docking software can be considered a virtual lab. Molecular docking gives insight into atomic levels in order to analyze the target protein and the way the ligand binds to the active site. The model offers details with respect to the interacting groups, potential hydrogen bonds, and bond lengths, and eventually, the docking score is calculated. The ligands 1a1o were positioned on the surface of a specific protein (target), namely DNA gyrase subunits from Staphylococcus aureus and Escherichia coli. The target proteins (receptors) were imported from the Protein Data Bank (PDB), specifically PDB ID 2XCS [62] and 4 DUH [63], respectively.

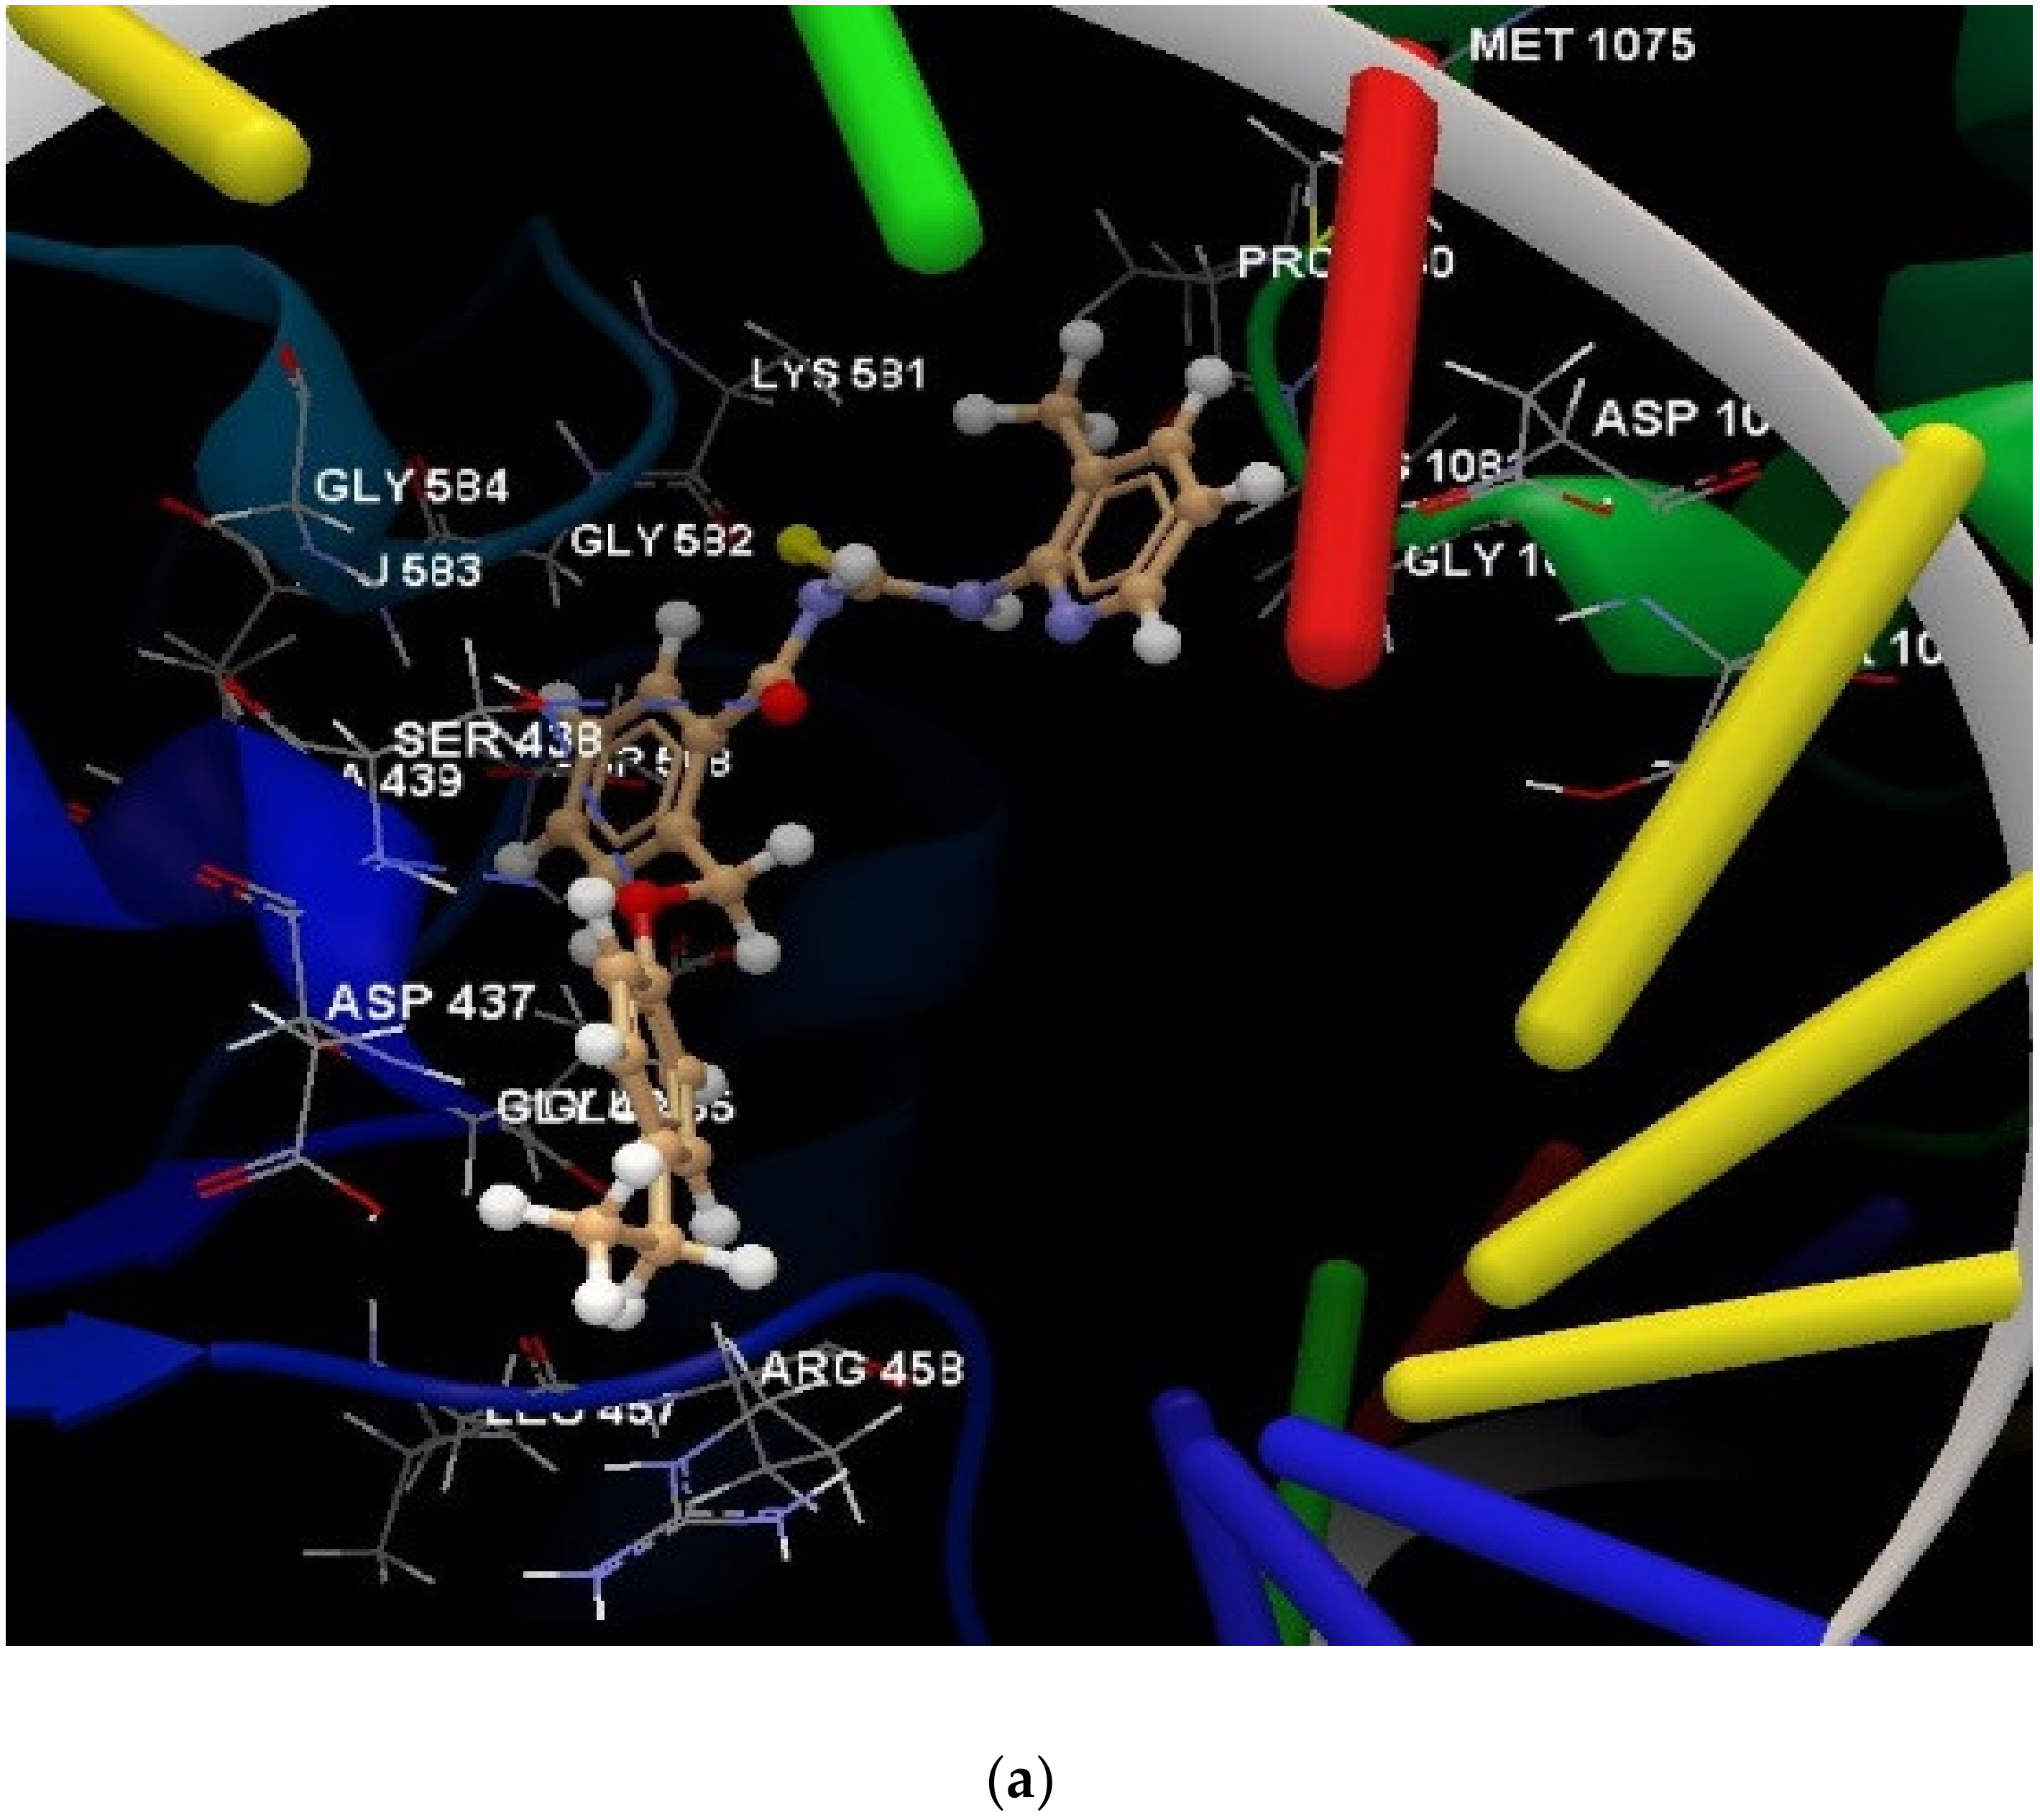
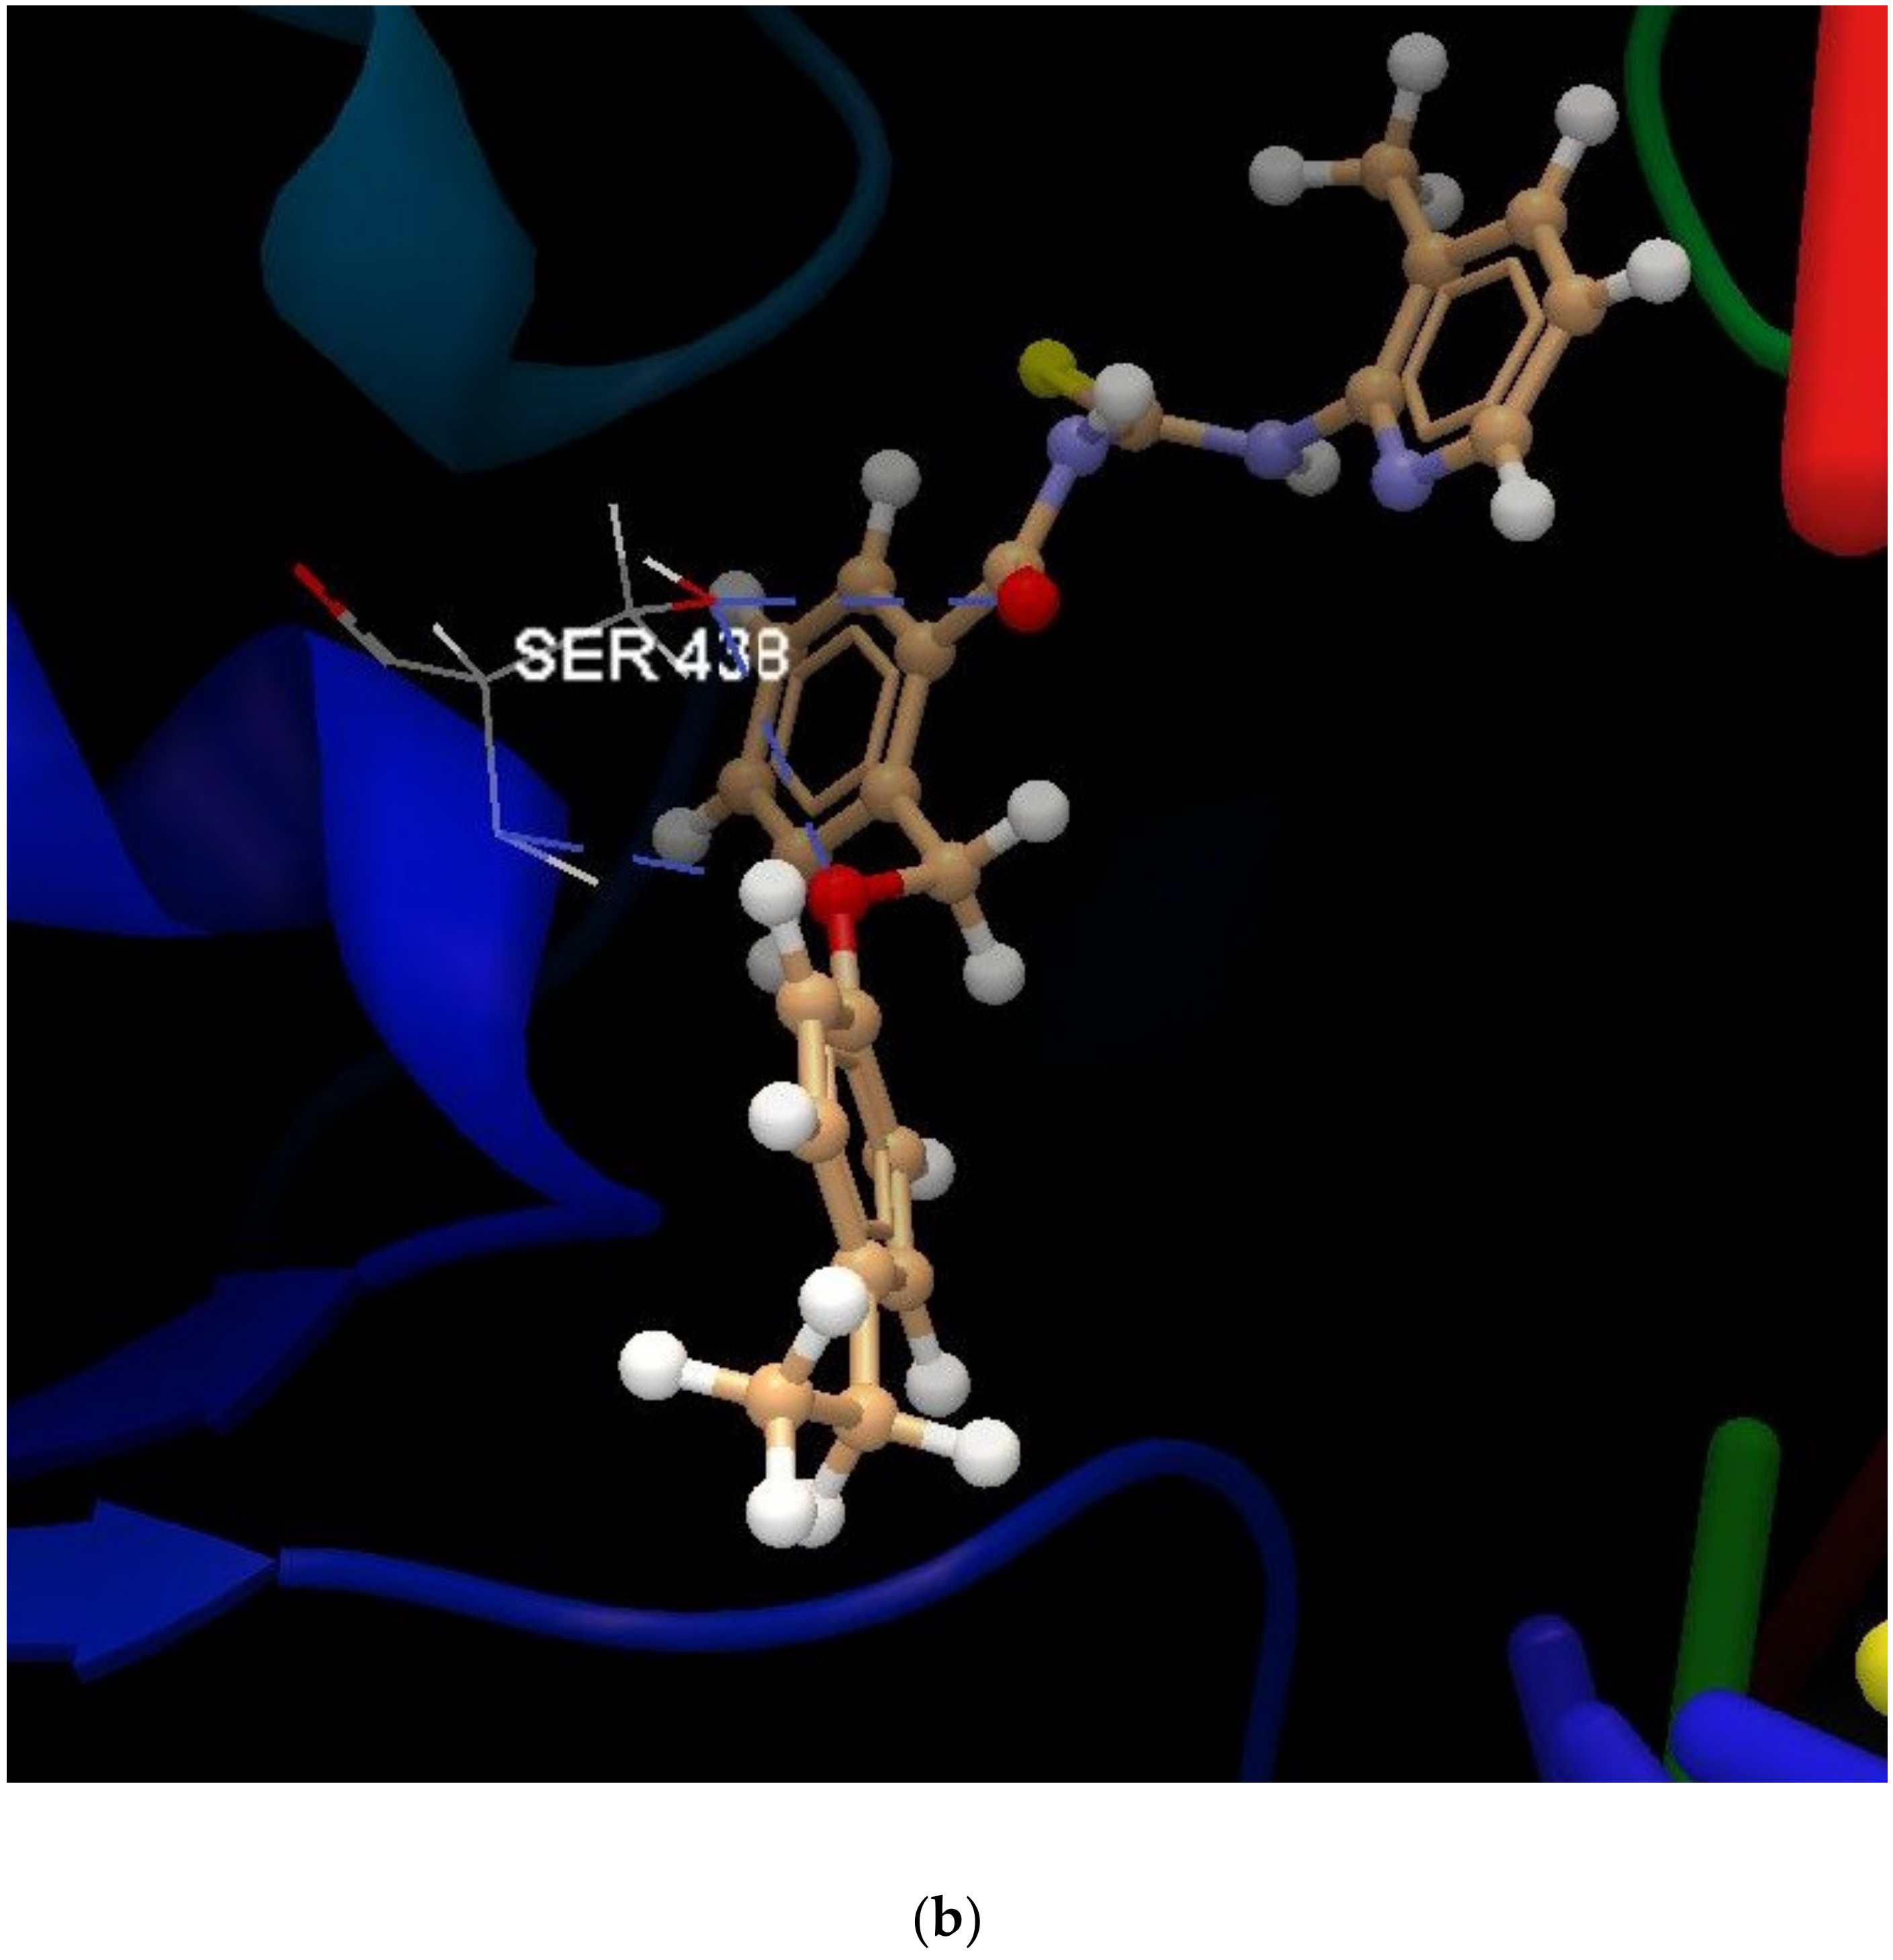
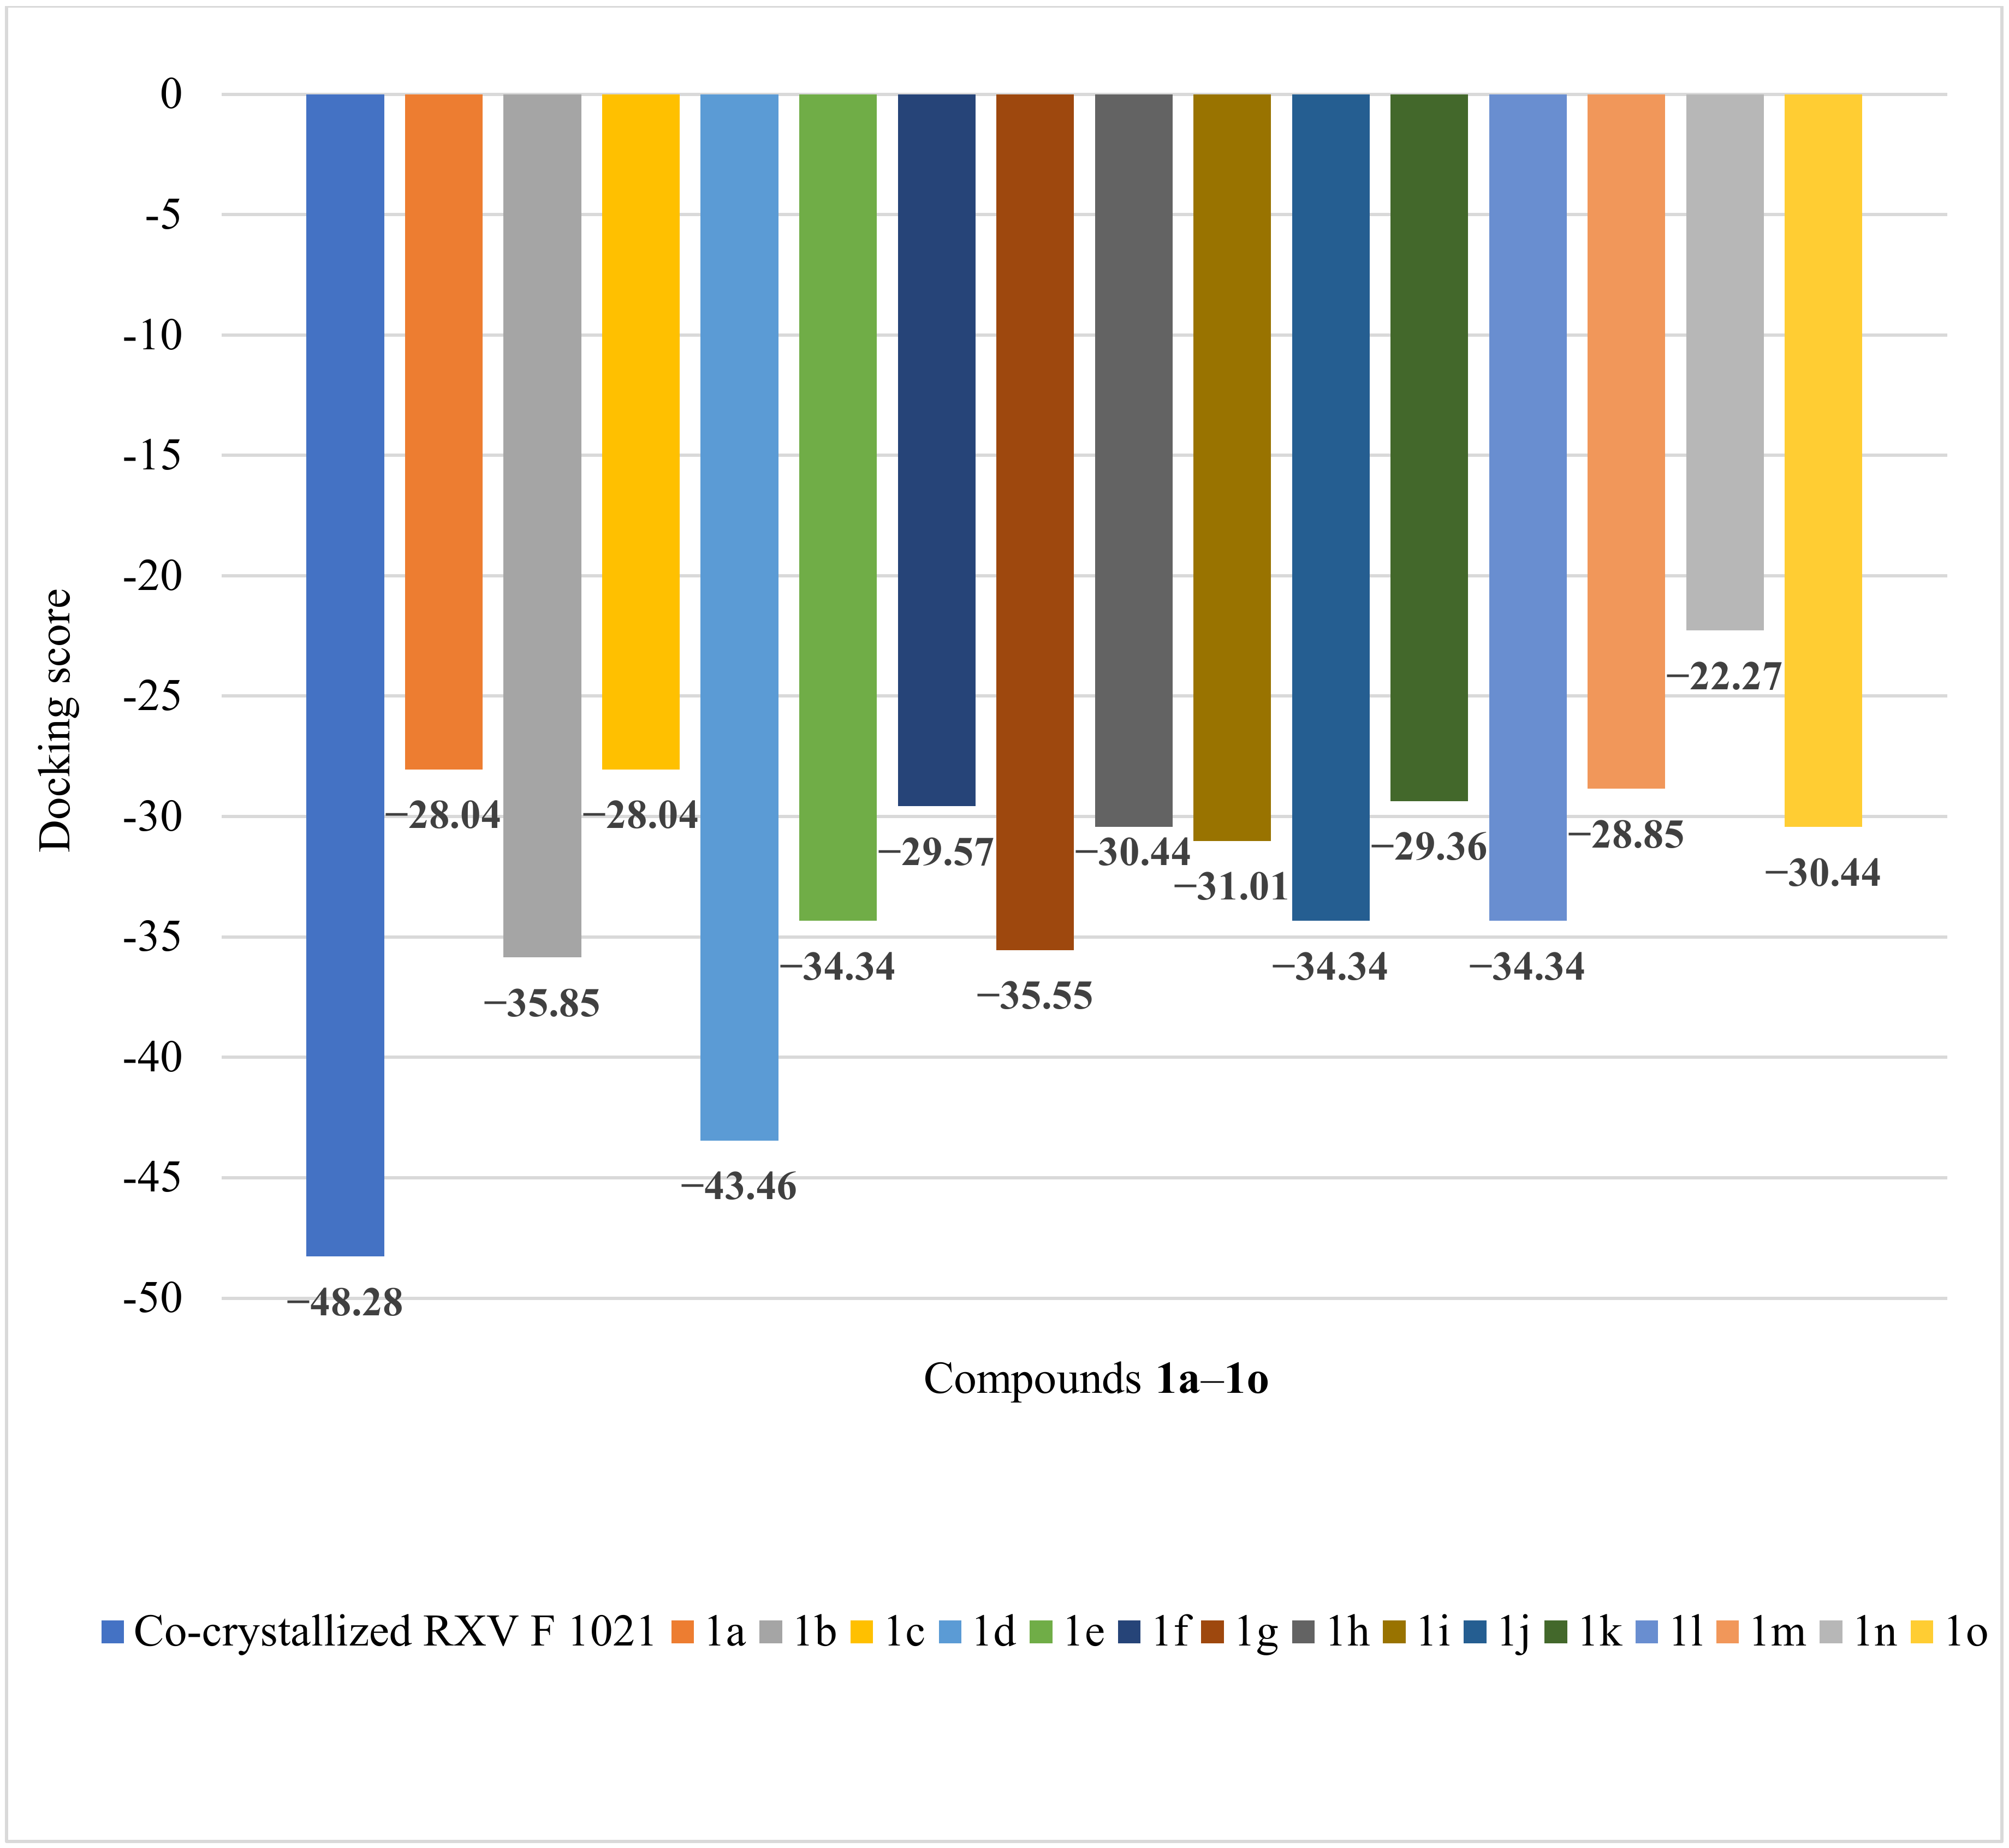
3.3.1. Molecular Docking of the Ligands into S. aureus DNA Gyrase Active Site

The compounds established hydrogen bonds with the DNA gyrase B of S. aureus; the protein–ligand interactions returned a docking score, highlighting a promising interaction between the ligands and receptors. The generated results for the studied compounds are listed in Table 8. Moreover, the information regarding the co-crystallized natural ligand is also enclosed in Table 8, in order to correlate the similarities between the new outcomes and the results due to co-crystallization.
For a comprehensive visualization of the interactions between each of the designed compounds and selected microbial agents, Figure 7a reveals the interaction group generated by the docking software. The hydrogen bonds present are also exemplified in Figure 7b attached.
Regarding the docking of ligands with DNA gyrase B from S. aureus, the highest docking score was obtained for the compound 1d (−43.46), with RMDS = 0.74 Å; the acquired value was quite close to the co-crystallized RXV docking score (−48.28), with RMDS = 1.29 Å (see Figure 8).

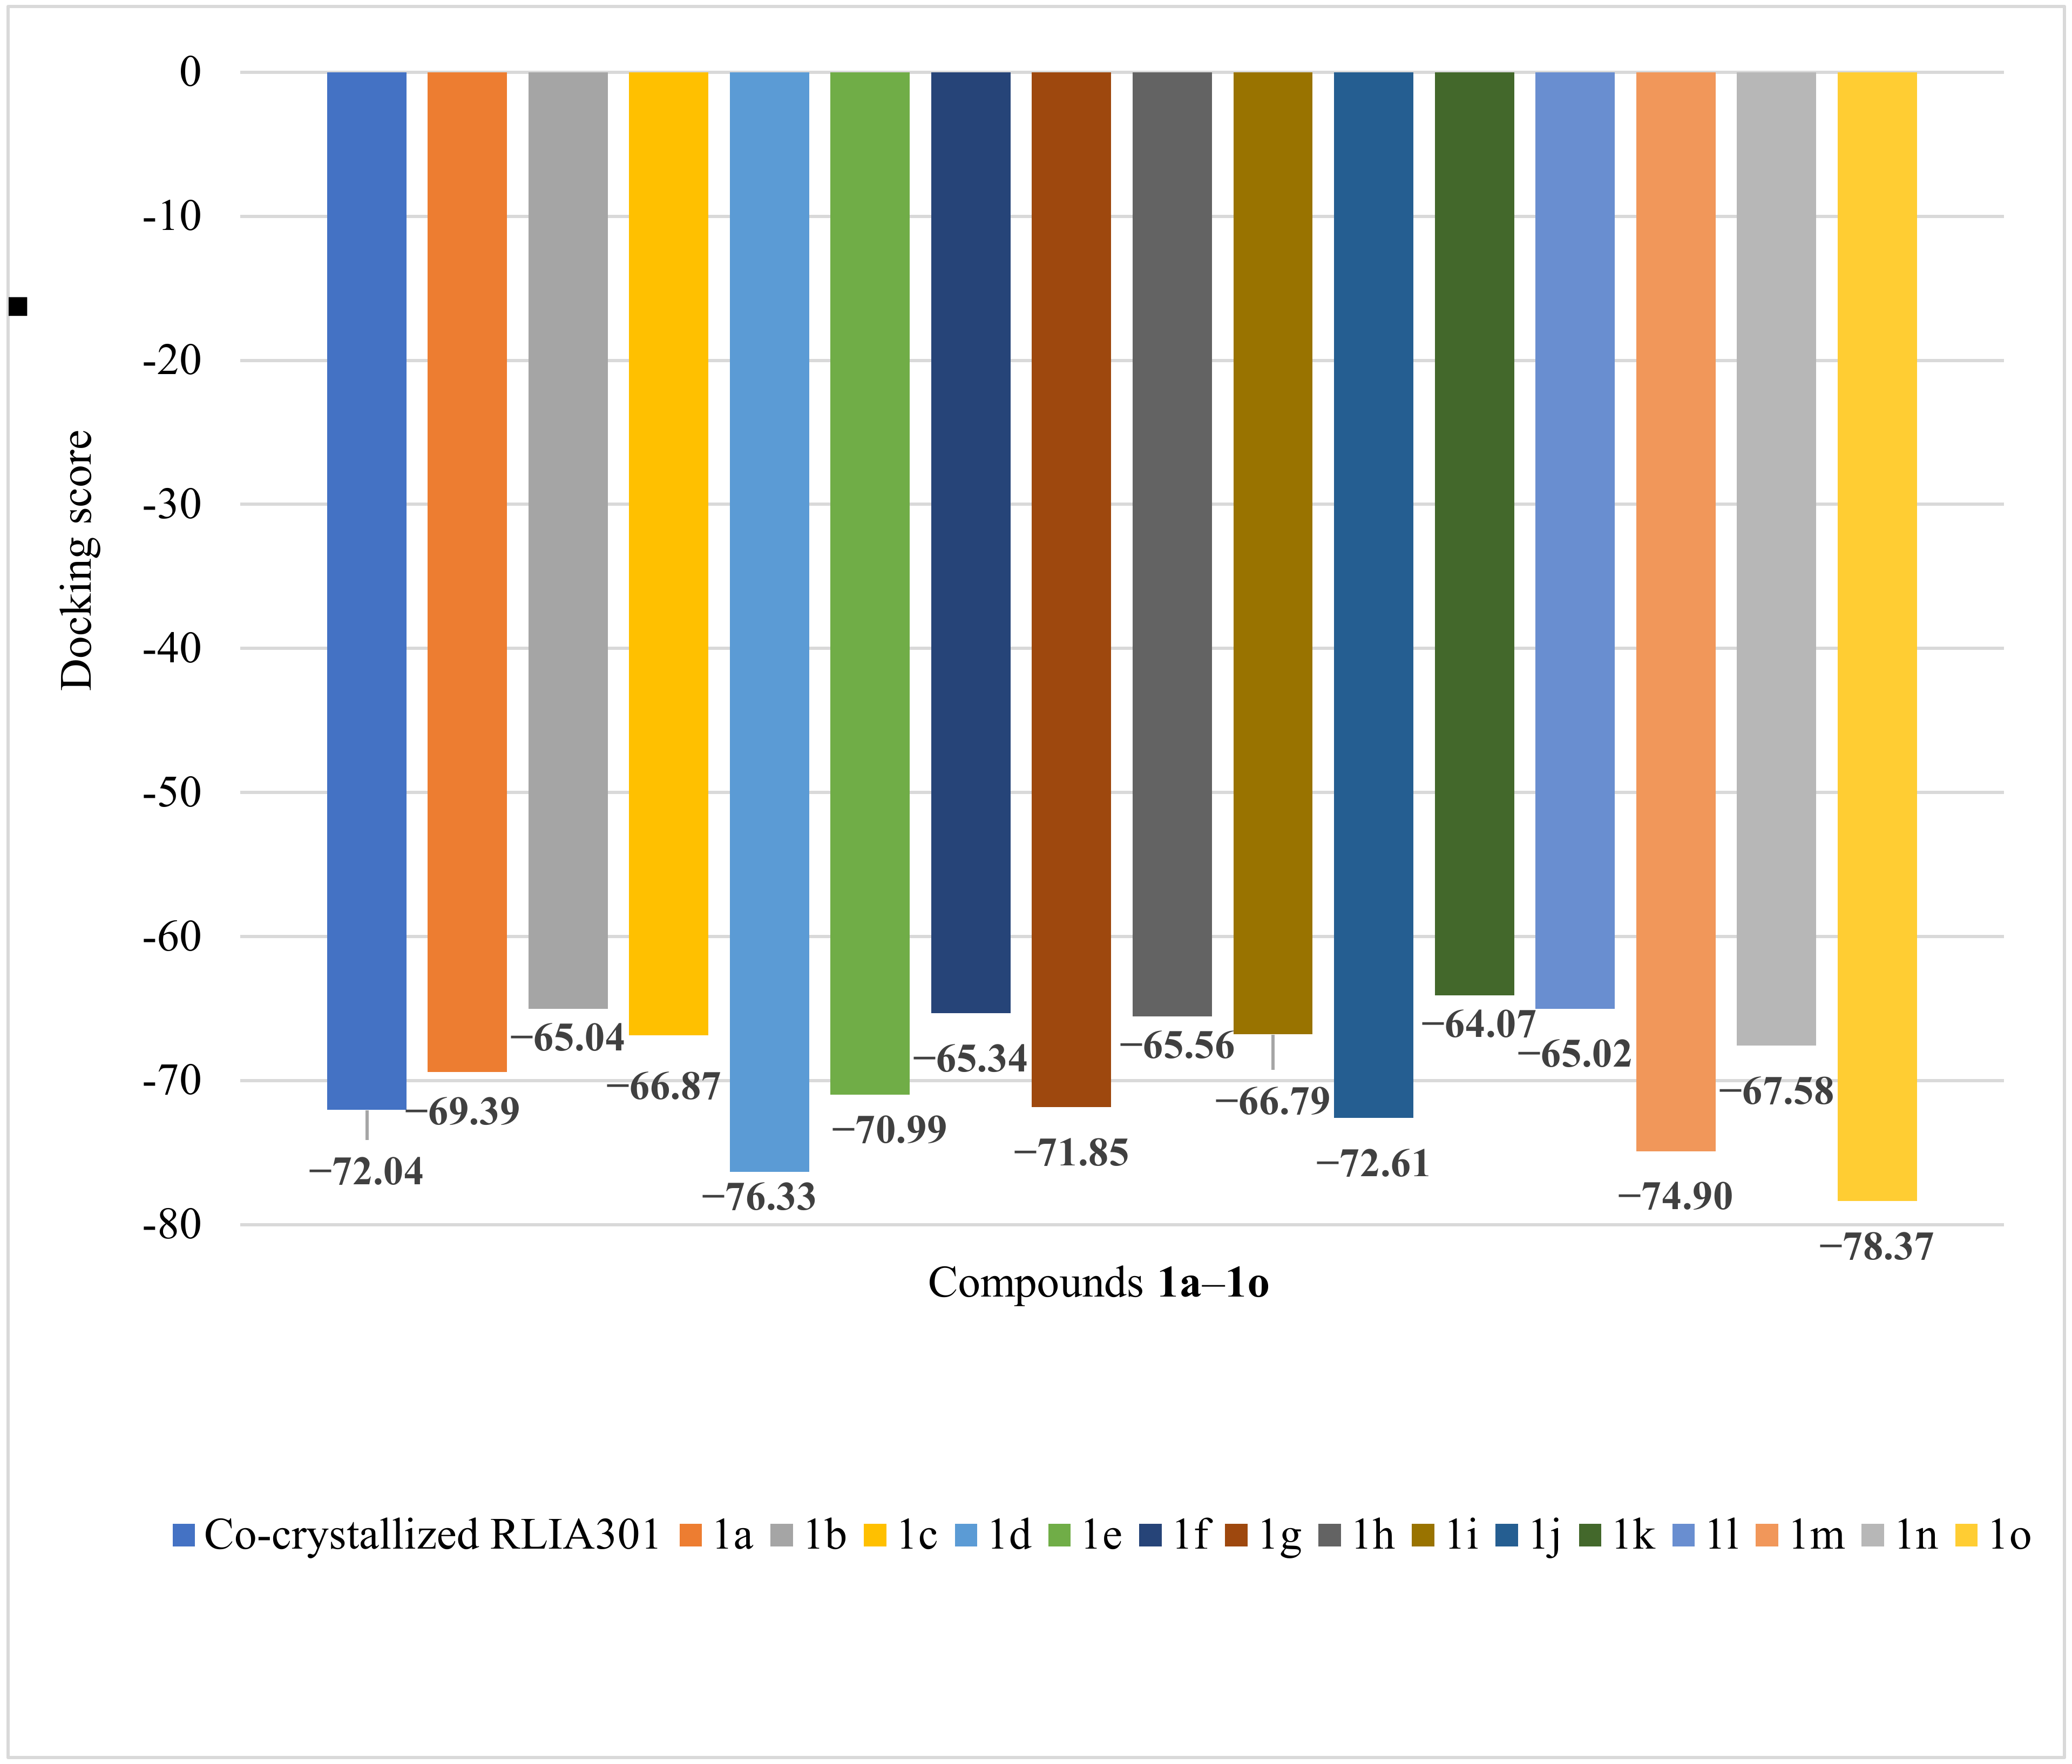
3.3.2. Molecular Docking of the Ligands with E. coli DNA Gyrase

The studied chemicals established hydrogen bonds with the DNA gyrase B of E. coli, returning docking scores that showed favorable interactions between the ligand and target receptor. The table hereafter (Table 9) specifically describes the interactions between compounds 1a1o and the DNA gyrase B of E. coli, along with the co-crystallized interaction group.
During the docking process of ligands in the active site of DNA gyrase B from E. coli, some clear similarities between the designed chemical compounds and the co-crystallized one have been highlighted. The following Figure 9 and Figure 10 and discussions underline the evidence that supports the favorable conformation of the most promising ligands in the active site of the receptor.
The co-crystallized RLIA 301 registered a docking score of −72.04 (see Figure 11). All the designed compounds generated docking scores between −64 and −78, fairly close to the score value of the co-crystallized natural ligand. The exposed proximities led to the consensus that the compounds could be considered drug development candidates against E. coli.

4. Discussion

4.1. Compound-Docking Outcomes Correlated with the S. aureus Co-Crystallized Interaction Group

The molecular docking study was intended to predict the complex formed between the ligand and the receptor. The ligand took suitable conformations in the active site of the receptor protein, forming hydrogen bonds with the rest of the amino acids of the selected receptor. The established conformation was then quantified in a docking score, describing the highest match of the studied molecule in the active site of the receptor [64].
In the present case, the docking scores varied in the range of (−43)–(−22), decreasing according to the sequence: 1d > 1b > 1f > 1e, 1j, 1l > 1i > 1h, 1o > 1f > 1k > 1m > 1a, 1c > 1n.
The compound 1d, revealing the highest docking score (−43.46), formed three hydrogen bonds with the amino acid scaffold SER 438. In the compilation of molecular properties and the drug-likeness features according to Lipinski, 1d had suitable properties for a potential active ingredient with oral administration.
As observed, identical scores were obtained for some of the compounds. The chemicals 1e, 1j, and 1l registered a docking score of −34.34. A common aspect among the mentioned compounds was represented by the hydrogen bonds established with the interaction group; specifically, each molecule formed hydrogen bonds with the amino acid moiety SER 438 (1e, 1j—three hydrogen bonds, 1l—two hydrogen bonds). Notably, each named structure differed through the radical designed on the pyridine scaffold (1e: -methyl, 1j: -chloride, 1l: -bromine).
The compounds 1h and 1o also returned the same docking score (−30.44). Both revealed a hydrogen bond with the amino acid moiety ASP 437. Structurally, the compounds differed by the halogen radical on the pyridine scaffold (1h: -chloride, io: -bromine).
In the same way, 1a and 1c registered a docking score of −28.04. While both formed hydrogen bonds with SER 438 and ASP 437, they differed through the thiazole (1a) and pyridine (1c) moieties attached to the 2-((4-ethylphenoxy) methyl)-N-(heteroarylcarbamothioyl) scaffold.
With respect to the number of formed hydrogen bonds, the compounds 1a and 1f established five hydrogen bonds with the interaction group, which represented the most numerous hydrogen bonds in the library of chemicals, although their docking scores were not close to the docking score of the co-crystallized natural ligands.

4.2. Compound-Docking Outcomes Correlated with the E. coli Co-Crystallized Interaction Group

From the data presented, the docking study revealed some similarities between the co-crystallized interaction group and the interactions of the compounds with the amino acids of 4DUH.
The co-crystallized natural ligand formed hydrogen bonds with the amino acid moieties ARG 136 (3.069 Å, 2.700 Å), ARG 76 (3.138 Å), GLY 101 (3.146 Å), and ASP 73 (1.822).
The compound 1c (docking score: −66.87) also formed hydrogen bonds with the amino acid moieties ARG 76 (2.878 Å) and GLY 101 (2.830 Å, 3.182 Å), similarly to the co-crystallized interaction group. Moreover, during the docking process, a resemblance was observed in the behavior of the compound 1n (docking score: −67.58), which formed a hydrogen bound with the same amino acid, GLY 101 (2.755 Å, 3.178 Å). The compound 1n, in particular, had two chloride atoms on the pyridine heterocycle, which was different from molecule 1c. The presence of Cl- radicals on the pyridine nucleus imprinted a lipophile character for the chemical among the series.
For the compounds 1o (−78.37) > 1d (−76.33) > 1m (−74.90) > 1j (−72.61) > 1g (−71.85) > 1e (−70.99), high values or values close to the docking score of the co-crystallized ligand were obtained. However, as determined by the molecular analysis, 1o registered two violations of Lipinski’s rule; namely, the molecular mass and the partition coefficient were out of the specified rule ranges. The characteristics did not encourage its evaluation as a potential active ingredient for oral administration.
The co-crystallized natural ligand established five hydrogen bonds with the interaction group. As for the evaluated compounds with multiple hydrogen bonds exposed, 1c formed four hydrogen bonds with the amino acid moieties in the interaction group (ASN 46, 3.058 Å; GLY 101, 3.182 Å, 2.830 Å; ARG 76, 2.878 Å), followed by 1d (ASN 46, 2.642 Å, 2.686 Å, 3.178 Å), 1k (ASN 46, 3.171 Å, 3.195 Å, 3.073 Å), and 1o (ASN 46, 3.113 Å, 2.900 Å, 3.135 Å), which revealed three hydrogen bonds each.

5. Conclusions

The evaluated candidates were exposed to in silico approaches—molecular docking studies and measurements of their QSAR properties—in order to correlate the drug design with their level of permeability. The chemical compounds 1c, 1d, and 1n stood out from the other compounds in the series through their favorable molecular properties, which make them suitable candidates for active ingredients with oral administration. Regarding the docking processes of the mentioned candidates in the active sites of S. aureus and E. coli, 1c and 1n presented the same interaction group affinities as the co-crystallized RLIA301 from 4DUH (E. coli), by creating hydrogen bonds with the same amino acid moieties and achieving promising docking scores. On the other hand, 1d reached the highest docking score in the docking studies for S. aureus and E. coli in the series. The results confirm the hypothesis that the studied molecules could be further considered for the synthesis and evaluation of their antimicrobial properties, as their docking scores suggest potential activity towards the investigated microbial strains.

Supplementary Materials

The following supporting information can be downloaded at: https://www.mdpi.com/article/10.3390/pr11020479/s1, Figure S1. The tube label representation of the optimized molecular structure for the designed chemical compounds 1a1o; Figure S2. The wire label representation of the optimized molecular structure for the designed chemical compounds 1a1o; Figure S3. LUMO map for the compounds 1a1o; Figure S4. Molecular electrostatic potential map (on the electronic density) for the compounds 1a1o; Figure S5. Local ionization potential map for the compounds 1a1o; Figures S6–S35. Graphic representations of intermolecular interactions between the ligand molecules docked with 2XCS (S. aureus DNA gyrase B, chain F) using CLC Drug Discovery Workbench Software, Figures S36–S65 Intermolecular interactions between the ligand molecules docked with 4DUH (E. coli DNA gyrase B, chain A) using CLC Drug Discovery Workbench Software.

Author Contributions

Conceptualization, C.L., R.R., L.P., S.A., and D.N.; methodology, C.L., R.R., L.P., S.A., and D.N.; validation, L.P., C.L., and R.R.; formal analysis, C.L. and L.P.; investigation, C.L., R.R., L.P., S.A., D.N., C.B., and C.S.; data curation, L.P. and S.A.; writing—original draft preparation, R.R.; writing—review and editing, R.R., L.P., D.N., S.A., and C.L.; visualization, C.L., L.P., S.A., and D.N.; supervision, C.L., L.P., S.A., and D.N. All authors have read and agreed to the published version of the manuscript.

Funding

Publication of this paper was supported by the University of Medicine and Pharmacy Carol Davila, through the institutional program Publish not Perish.

Data Availability Statement

Not applicable.

Conflicts of Interest

The authors declare no conflict of interest.

References

  1. Villamizar-Mogotocoro, A.-F.; Vargas-Méndez, L.Y.; Kouznetsov, V.V. Pyridine and quinoline molecules as crucial protagonists in the never-stopping discovery of new agents against tuberculosis. Eur. J. Pharm. Sci. 2020, 151, 105374. [Google Scholar] [CrossRef] [PubMed]
  2. Yerragunta, V.; Patil, P.; Anusha, V.; Kumaraswamy, T.; Suman, D.; Samhitha, T. Pyrimidine and its biological activity: A review. PharmaTutor 2013, 1, 39–44. [Google Scholar]
  3. Ran, K.; Zeng, J.; Wan, G.; He, X.; Feng, Z.; Xiang, W.; Wei, W.; Hu, X.; Wang, N.; Liu, Z.; et al. Design, Synthesis and Biological Evaluations of a Series of Pyrido[1,2-a]Pyrimidinone Derivatives as Novel Selective FGFR Inhibitors. Eur. J. Med. Chem. 2021, 220, 113499. [Google Scholar] [CrossRef] [PubMed]
  4. Jubete, G.; Puig de la Bellacasa, R.; Estrada-Tejedor, R.; Teixidó, J.; Borrell, J.I. Pyrido[2,3-d]pyrimidin-7(8H)-ones: Synthesis and biomedical applications. Molecules 2019, 24, 4161. [Google Scholar] [CrossRef] [PubMed]
  5. Neely, J.M.; Rovis, T. Pyridine Synthesis by [4 + 2] Cycloadditions of 1-Azadienes: Hetero-Diels Alder and Transition Metal-Catalysed Approaches. Org. Chem. Front. 2014, 1, 1010–1015. [Google Scholar] [CrossRef]
  6. Xu, D.; Sun, D.; Wang, W.; Peng, X.; Zhan, Z.; Ji, Y.; Shen, Y.; Geng, M.; Ai, J.; Duan, W. Discovery of Pyrrolo[2,3-d]Pyrimidine Derivatives as Potent Axl Inhibitors: Design, Synthesis and Biological Evaluation. Eur. J. Med. Chem. 2021, 220, 113497. [Google Scholar] [CrossRef]
  7. Ling, Y.; Hao, Z.Y.; Liang, D.; Zhang, C.L.; Liu, Y.F.; Wang, Y. The Expanding Role of Pyridine and Dihydropyridine Scaffolds in Drug Design. Drug. Des. Devel. Ther. 2021, 15, 4289–4338. [Google Scholar] [CrossRef]
  8. Lin, S.X.; Curtis, M.A.; Sperry, J. Pyridine Alkaloids with Activity in the Central Nervous System. Bioorg. Med. Chem. 2020, 28, 115820. [Google Scholar] [CrossRef]
  9. Comins, D.L.; Higuchi, K.; Young, D.W. Dihydropyridine Preparation and Application in the Synthesis of Pyridine Derivatives. Adv. Heterocycl. Chem. 2013, 110, 175–235. [Google Scholar] [CrossRef]
  10. Pollak, N.; Dölle, C.; Ziegler, M. The Power to Reduce: Pyridine Nucleotides–Small Molecules with a Multitude of Functions. Biochem. J. 2007, 402, 205–218. [Google Scholar] [CrossRef]
  11. Jian, Y.; Hulpia, F.; Risseeuw, M.D.P.; Forbes, H.E.; Munier-Lehmann, H.; Caljon, G.; Boshoff, H.I.M.; Van Calenbergh, S. Synthesis and Structure Activity Relationships of Cyanopyridone Based Anti-Tuberculosis Agents. Eur. J. Med. Chem. 2020, 201, 112450. [Google Scholar] [CrossRef] [PubMed]
  12. Marinescu, M.; Popa, C.V. Pyridine Compounds with Antimicrobial and Antiviral Activities. Int. J. M. Sci. 2022, 23, 5659. [Google Scholar] [CrossRef] [PubMed]
  13. Lapidot, I.; Albeck, A.; Gellerman, G.; Shatzmiller, S.; Grynszpan, F. 1,4-Dihydropyridine Cationic Peptidomimetics with Antibacterial Activity. Int. J. Pept. Res. Ther. 2015, 21, 243–247. [Google Scholar] [CrossRef]
  14. Klusa, V. Atypical 1,4-dihydropyridine derivatives, an approach to neuroprotection and memory enhancement. Pharmacol. Res. 2016, 113, 754–759. [Google Scholar] [CrossRef]
  15. Alrooqi, M.; Khan, S.; Alhumaydhi, F.A.; Asiri, S.A.; Alshamrani, M.; Mashraqi, M.M.; Alzamami, A.; Alshahrani, A.M.; Aldahish, A.A. A Therapeutic Journey of Pyridine-based Heterocyclic Compounds as Potent Anticancer Agents: A Review (From 2017 to 2021). Anticancer Agents Med. Chem. 2022, 22, 2775–2787. [Google Scholar] [CrossRef]
  16. Davari, A.S.; Abnous, K.; Mehri, S.; Ghandadi, M.; Hadizadeh, F. Synthesis and Biological Evaluation of Novel Pyridine Derivatives as Potential Anticancer Agents and Phosphodiesterase-3 Inhibitors. Bioorg. Chem. 2014, 57, 83–89. [Google Scholar] [CrossRef]
  17. Lu, T.; Goh, A.W.; Yu, M.; Adams, J.; Lam, F.; Teo, T.; Li, P.; Noll, B.; Zhong, L.; Diab, S.; et al. Discovery of (E)-3-((Styrylsulfonyl)Methyl)Pyridine and (E)-2-((Styrylsulfonyl)Methyl)Pyridine Derivatives as Anticancer Agents: Synthesis, Structure–Activity Relationships, and Biological Activities. J. Med. Chem. 2014, 57, 2275–2291. [Google Scholar] [CrossRef]
  18. Prachayasittikul, S.; Pingaew, R.; Worachartcheewan, A.; Sinthupoom, N.; Prachayasittikul, V.; Ruchirawat, S.; Prachayasittikul, V. Roles of Pyridine and Pyrimidine Derivatives as Privileged Scaffolds in Anticancer Agents. Mini. Rev. Med. Chem. 2017, 17, 869–901. [Google Scholar] [CrossRef]
  19. Fan, Z.; Shi, J.; Luo, N.; Ding, M.; Bao, X. Synthesis, Crystal Structure, and Agricultural Antimicrobial Evaluation of Novel Quinazoline Thioether Derivatives Incorporating the 1,2,4-Triazolo[4,3-a]Pyridine Moiety. J. Agric. Food Chem. 2019, 67, 11598–11606. [Google Scholar] [CrossRef]
  20. Bhila, V.G.; Patel, C.V.; Patel, N.H.; Brahmbhatt, D.I. One Pot Synthesis of Some Novel Coumarins Containing 5-(Substituted-2-Hydroxybenzoyl) Pyridine as a New Class of Antimicrobial and Antituberculosis Agents. Med. Chem. Res. 2013, 22, 4338–4346. [Google Scholar] [CrossRef]
  21. Laddha, S.S.; Bhatnagar, S.P. A New Therapeutic Approach in Parkinson’s Disease: Some Novel Quinazoline Derivatives as Dual Selective Phosphodiesterase 1 Inhibitors and Anti-Inflammatory Agents. Bioorg. Med. Chem. 2009, 17, 6796–6802. [Google Scholar] [CrossRef] [PubMed]
  22. Kumar, N.; Chauhan, A.; Drabu, S. Synthesis of Cyanopyridine and Pyrimidine Analogues as New Anti-Inflammatory and Antimicrobial Agents. Biomed. Pharmacother. 2011, 65, 375–380. [Google Scholar] [CrossRef] [PubMed]
  23. Thirumurugan, P.; Mahalaxmi, S.; Perumal, P.T. Synthesis and Anti-Inflammatory Activity of 3-Indolyl Pyridine Derivatives through One-Pot Multi Component Reaction. J. Chem. Sci. 2010, 122, 819–832. [Google Scholar] [CrossRef]
  24. Rakesh, K.P.; Gowda, D.C. Schiff’s Bases of Quinazolinone Derivatives: Synthesis and SAR Studies of a Novel Series of Potential Anti-Inflammatory and Antioxidants. Bioorg. Med. Chem. Lett. 2015, 25, 1072–1077. [Google Scholar] [CrossRef] [PubMed]
  25. Kamat, V.; Santosh, R.; Poojary, B.; Nayak, S.P.; Kumar, B.K.; Sankaranarayanan, M.; Faheem Khanapure, S.; Barretto, D.A.; Vootla, S.K. Pyridine- and Thiazole-Based Hydrazides with Promising Anti-inflammatory and Antimicrobial Activities along with Their In Silico Studies. ACS Omega 2020, 5, 25228–25239. [Google Scholar] [CrossRef]
  26. Salam Abdel, O.I.; Al-Omar, M.A.; Khalifa, N.M.; Amr Ael, G.; Abdallah, M.M. Analgesic and Anticonvulsant Activities of Some Newly Synthesized Trisubstituted Pyridine Derivatives. Z. Naturforsch. C. J. Biosci. 2013, 68, 264–268. [Google Scholar] [CrossRef]
  27. Helal, M.H.; El-Awdan, S.A.; Salem, M.A.; Abd-elaziz, T.A.; Moahamed, Y.A.; El-Sherif, A.A.; Mohamed, G.A.M. ynthesis, Biological Evaluation and Molecular Modeling of Novel Series of Pyridine Derivatives as Anticancer, Anti-Inflammatory and Analgesic Agents. Spectrochim. Acta A Mol. Biomol. Spectrosc. 2015, 135, 764–773. [Google Scholar] [CrossRef]
  28. Carty, T.J.; Marfat, A.; Moore, P.F.; Falkner, F.C.; Twomey, T.M.; Weissman, A. Ampiroxicam, an Anti-Inflammatory Agent Which Is a Prodrug of Piroxicam. Agents Actions 1993, 39, 157–165. [Google Scholar] [CrossRef]
  29. Berg, J.; Fellier, H.; Christoph, T.; Grarup, J.; Stimmeder, D. The Analgesic NSAID Lornoxicam Inhibits Cyclooxygenase (COX)-1/-2, Inducible Nitric Oxide Synthase (INOS), and the Formation of Interleukin (IL)-6 in Vitro. Inflamm. Res. 1999, 48, 369–379. [Google Scholar] [CrossRef]
  30. El-Naggar, M.; Almahli, H.; Ibrahim, H.; Eldehna, W.; Abdel-Aziz, H. Pyridine-Ureas as Potential Anticancer Agents: Synthesis and In Vitro Biological Evaluation. Molecules 2018, 23, 1459. [Google Scholar] [CrossRef]
  31. Usha, C.; Santhakumari, R.; Joseph, L.; Sajan, D.; Meenakshi, R.; Sinthiya, A. Growth and Combined Experimental and Quantum Chemical Study of Glycyl-L-Valine Crystal. Heliyon 2019, 5, e01574. [Google Scholar] [CrossRef] [PubMed] [Green Version]
  32. Scrocco, E.; Tomasi, J. Electronic Molecular Structure, Reactivity and Intermolecular Forces: An Euristic Interpretation by Means of Electrostatic Molecular Potentials. Adv. Quantum Chem. 1978, 11, 115–193. [Google Scholar] [CrossRef]
  33. Daina, A.; Michielin, O.; Zoete, V. SwissADME: A free web tool to evaluate pharmacokinetics, druglikeness and medicinal chemistry friendliness of small molecules. Sci. Rep. 2017, 7, 42717. [Google Scholar] [CrossRef] [PubMed]
  34. Dar, A.M.; Mir, S. Molecular Docking: Approaches, Types, Applications and Basic Challenges. J. Anal. Bioanal. Tech. 2017, 8, 356. [Google Scholar] [CrossRef]
  35. Agarwal, S.; Chadha, D.; Mehrotra, R. Molecular Modeling and Spectroscopic Studies of Semustine Binding with DNA and Its Comparison with Lomustine–DNA Adduct Formation. J. Biomol. Struct. Dyn. 2015, 33, 1653–1668. [Google Scholar] [CrossRef]
  36. Guedes, I.A.; de Magalhães, C.S.; Dardenne, L.E. Receptor–Ligand Molecular Docking. Biophys. Rev. 2014, 6, 75–87. [Google Scholar] [CrossRef]
  37. Rohs, R. Molecular Flexibility in Ab Initio Drug Docking to DNA: Binding-Site and Binding-Mode Transitions in All-Atom Monte Carlo Simulations. Nucleic Acids Res. 2005, 33, 7048–7057. [Google Scholar] [CrossRef]
  38. Cho, A.E.; Rinaldo, D. Extension of QM/MM Docking and Its Applications to Metalloproteins. J. Comput. Chem. 2009, 30, 2609–2616. [Google Scholar] [CrossRef]
  39. Limban, C.; Nuta, D.C.; Missir, A.V.; Roman, R.; Caproiu, M.T.; Dumitrascu, F.; Pintilie, L.; Stefaniu, A.; Chifiriuc, M.C.; Popa, M.; et al. Synthesis and Characterization of New Fluoro/Trifluoromethyl-Substituted Acylthiourea Derivatives with Promising Activity against Planktonic and Biofilm-Embedded Microbial Cells. Processes 2020, 8, 503. [Google Scholar] [CrossRef]
  40. Bordei Telehoiu, A.T.; Nuță, D.C.; Căproiu, M.T.; Dumitrascu, F.; Zarafu, I.; Ioniță, P.; Limban, C. Design, Synthesis and In Vitro Characterization of Novel Antimicrobial Agents Based on 6-Chloro-9H-carbazol Derivatives and 1,3,4-Oxadiazole Scaffolds. Molecules 2020, 25, 266. [Google Scholar] [CrossRef]
  41. Vlad, I.M.; Nuta, D.C.; Chirita, C.; Caproiu, M.T.; Draghici, C.; Dumitrascu, F.; Limban, C. In Silico and In Vitro Experimental Studies of New Dibenz[b,e]oxepin-11(6H)one O-(arylcarbamoyl)-oximes Designed as Potential Antimicrobial Agents. Molecules 2020, 25, 321. [Google Scholar] [CrossRef] [PubMed] [Green Version]
  42. pkCSM – Pharmacokinetics. Available online: https://biosig.lab.uq.edu.au/pkcsm/ (accessed on 11 November 2022).
  43. Verma, J.; Khedkar, V.M.; Coutinho, E.C. 3D-QSAR in drug design--a review. Curr. Top. Med. Chem. 2010, 10, 95–115. [Google Scholar] [CrossRef] [PubMed]
  44. Pal, D.; Mitra, S. A preliminary study on the in vitro antioxidant activity of the stems of O. vulgaris. J. Adv. Pharm. Tech. Res. 2010, 1, 268–272. [Google Scholar]
  45. Edwards, M.P.; Price, D.A. Role of Physicochemical Properties and Ligand Lipophilicity Efficiency in Addressing Drug Safety Risks. Annu. Rep. Med. Chem. 2010, 45, 380–391. [Google Scholar] [CrossRef]
  46. Saha, S.; Acharya, M. In silico ADME-toxicity profiling, prediction of bioactivity and CNS penetrating properties of some newer resveratrol analogues. J. PharmaSciTech 2014, 3, 98–105. [Google Scholar]
  47. Wang, S.; Chen, Z.; Tang, X.; Shi, L.; Zhang, L.; Yao, M. Rapid determination of partition coefficients of pharmaceuticals by phase distribution and microchip capillary electrophoresis with Octanol-Water Partition Constant 205 contactless conductivity detection. J. Sep. Sci. 2013, 36, 3615–3622. [Google Scholar] [CrossRef]
  48. Gałuszka, A.; Migaszewski, Z.; Namieśnik, J. The 12 Principles of Green Analytical Chemistry and the SIGNIFICANCE Mnemonic of Green Analytical Practices. TrAC-Trends Analyt. Chem 2012, 50, 78–84. [Google Scholar] [CrossRef]
  49. Lipinski, C.A.; Lombardo, F.; Dominy, B.W.; Feeney, P.J. Experimental and computational approaches to estimate solubility and permeability in drug discovery and development settings. Adv. Drug Deliv. Rev. 1997, 46, 3–26. [Google Scholar] [CrossRef]
  50. Hefler, J.; Marfil-Garza, B.A.; Pawlick, R.L.; Freed, D.H.; Karvellas, C.J.; Bigam, D.L.; Shapiro, A.M.J. Preclinical Models of Acute Liver Failure: A Comprehensive Review. PeerJ 2021, 9, e12579. [Google Scholar] [CrossRef]
  51. Hitchcock, S.A.; Pennington, L.D. Structure–Brain Exposure Relationships. J. Med. Chem. 2006, 49, 7559–7583. [Google Scholar] [CrossRef]
  52. Kelder, J.; Grootenhuis, P.D.J.; Bayada, D.M. Polar Molecular Surface as a Dominating Determinant for Oral Absorption and Brain Penetration of Drugs. Pharm. Res. 1999, 16, 1514–1519. [Google Scholar] [CrossRef]
  53. Palm, K.; Stenberg, P.; Luthman, K.; Artursson, P. Polar Molecular Surface Properties Predict the Intestinal Absorption of Drugs in Humans. Pharm. Res. 1997, 14, 568–571. [Google Scholar] [CrossRef]
  54. Mahdavifar, Z.; Haghbayan, M. Theoretical Investigation of Pristine and Functionalized AlN and SiC Single Walled Nanotubes as an Adsorption Candidate for Methane. Appl. Surf. Sci. 2012, 263, 553–562. [Google Scholar] [CrossRef]
  55. Li, G.; Chen, X.; Zhou, Z.; Wang, F.; Yang, H.; Yang, J.; Liu, D. Theoretical Insights into the Structural, Relative Stable, Electronic, and Gas Sensing Properties of PbnAun (n = 2–12) Clusters: A DFT Study. RSC Adv. 2017, 7, 45432–45441. [Google Scholar] [CrossRef]
  56. Suganthi, S.; Balu, P.; Sathyanarayanamoorthi, V.; Kannappan, V.; Kamil, M.G.M.; Kumar, R. Structural analysis and investigation of molecular properties of Cefpodoxime acid, a third generation antibiotic. J. Mol. Struct. 2016, 1108, 1–15. [Google Scholar] [CrossRef]
  57. Parr, R.G.; Donnelly, R.A.; Levy, M.; Palke, W.E. Electronegativity: The density functional viewpoint. J. Chem. Phys. 1978, 68, 3801. [Google Scholar] [CrossRef]
  58. Parr, R.G.; Pearson, R.G. Absolute hardness: Companion parameter to absolute electronegativity. J. Am. Chem. Soc. 1983, 105, 7512–7516. [Google Scholar] [CrossRef]
  59. Borah, B.; Devi, T.G. Molecular property analysis of the interacting state of L-Threonine and Metformin: An experimental and computational approach. J. Mol. Struct. 2020, 1221, 128819. [Google Scholar] [CrossRef]
  60. Petit, J.; Meurice, N.; Kaiser, C.; Maggiora, G. Softening the Rule of Five—Where to Draw the Line? Bioorg. Med. Chem. 2012, 20, 5343–5351. [Google Scholar] [CrossRef]
  61. Ivanović, V.; Rančić, M.; Arsić, B.; Pavlović, A. Lipinski’s rule of five, famous extensions and famous exceptions. Chem. Naissensis 2020, 3, 171–177. [Google Scholar]
  62. Bax, D.B.; Chan, P.F.; Eggleston, D.S.; Fosberry, A.; Gentry, D.R.; Gorrec, F.; Giordano, I.; Hann, M.; Hennessy, A.; Hibbs, M.; et al. Type IIA Topoisomerase Inhibition by a New Class of Antibacterial Agents. Nature 2010, 466, 935–940. [Google Scholar] [CrossRef] [PubMed]
  63. Brvar, M.; Perdih, A.; Renko, M.; Anderluh, G.; Turk, D.; Solmajer, T. Structure-Based Discovery of Substituted 4,5′-Bithiazoles as Novel DNA Gyrase Inhibitors. J. Med. Chem. 2012, 55, 6413–6426. [Google Scholar] [CrossRef] [PubMed]
  64. Meng, X.Y.; Zhang, H.X.; Mezei, M.; Cui, M. Molecular docking: A powerful approach for structure-based drug discovery. Curr. Comput. Aided Drug Des. 2011, 7, 146–157. [Google Scholar] [CrossRef] [PubMed]
Figure 1. (a) The ball and spoke representation of the 1d molecular structure. (b) The wire label representation of the 1d optimized molecular structure. By convention, the numbering of the atoms was assigned in accordance with Spartan 14 software. Supporting information with respect to the tube and wire label representation for every chemical compound included in the current study is provided in the Supplementary Materials, Figures S1a–o and S2a–o.
Processes 11 00479 g001
Figure 2. Graphic representation of energy band gap for the compounds 1a1o.
Processes 11 00479 g002
Figure 3. Graphic representation of chemical softness for the compounds 1a1o.
Processes 11 00479 g003
Figure 4. LUMO map for compound 1d. The red color or shades of red represent the minimum value of the LUMO (absolute values near zero), and the blue color is used for indicating the maximum absolute values. Supporting information with respect to the LUMO map representation for every chemical compound included in the current study is provided in the Supplementary Materials, Figure S3a–o.
Processes 11 00479 g004
Figure 5. Molecular electrostatic potential map (of the electronic density) for the compound 1d. A red color or shades of red mark a negative potential. On the other hand, shades of blue indicate a positive potential. Supporting information with respect to the molecular electrostatic potential map representation for every chemical compound included in the current study is provided in the Supplementary Materials, Figure S4a–o.
Processes 11 00479 g005
Figure 6. Local ionization potential map for the compound 1d. A red color or shades of red indicate areas where the ionization (the removal of an electron) is relatively easy; the effect is correlated with vulnerability to electrophilic attack. The regions in blue indicate the areas where the ionization is tough. In other words, red regions indicate a low ionization potential, while blue regions mark a high ionization potential. Supporting information with respect to the local ionization potential map representation for every chemical compound enclosed in the current study is provided in the Supplementary Materials, Figure S5a–o.
Processes 11 00479 g006
Figure 7. (a) The interaction group for ligand 1d, in the approach of predicting protein–ligand binding affinity. (b) Hydrogen bonds created between the ligand 1d and the amino acid SER 438 from the DNA gyrase subunit of S. aureus.
Processes 11 00479 g007aProcesses 11 00479 g007b
Figure 8. Docking score obtained for the docked compounds 1a1o and the target protein 2XCS.
Processes 11 00479 g008
Figure 9. (a) Interaction group of the ligand 1c. (b) Hydrogen bonds created between the ligand 1c and the amino acids ASN 46, GLY 101, and ARG 76.
Processes 11 00479 g009
Figure 10. (a) The interaction group for the ligand 1n. (b) Hydrogen bonds created between the ligand 1n and the amino acid GLY 101.
Processes 11 00479 g010
Figure 11. Docking score obtained for the docked compounds 1a1o and the target protein 4DUH.
Processes 11 00479 g011
Table 1. The chemical compounds 1a1o, considered in the present study.
The Compounds 1a–1o, Chemically Derived from 2-((4-ethylphenoxy) methyl)-N-(heteroarylcarbamothioyl)benzamides
Processes 11 00479 i001
Structure 1a
Formula: C20H19N3O2S2
Processes 11 00479 i002
Structure 1b
Formula: C22H21N3O2S
Processes 11 00479 i003
Structure 1c
Formula: C22H21N3O2S
Processes 11 00479 i004
Structure 1d
Formula: C23H23N3O2S
Processes 11 00479 i005
Structure 1e
Formula: C23H23N3O2S
Processes 11 00479 i006
Structure 1f
Formula: C23H23N3O2S
Processes 11 00479 i007
Structure 1g
Formula: C22H20ClN3O2S
Processes 11 00479 i008
Structure 1h
Formula: C22H20ClN3O2S
Processes 11 00479 i009
Structure 1i
Formula: C22H20ClN3O2S
Processes 11 00479 i010
Structure 1j
Formula: C22H20ClN3O2S
Processes 11 00479 i011
Structure 1k
Formula: C22H20BrN3O2S
Processes 11 00479 i012
Structure 1l
Formula: C22H20BrN3O2S
Processes 11 00479 i013
Structure 1m
Formula: C22H19Cl2N3O2S
Processes 11 00479 i014
Structure 1n
Formula: C22H19Cl2N3O2S
Processes 11 00479 i015
Structure 1o
Formula: C22H19Br2N3O2S
Table 2. Molecular properties with respect to designed chemical compounds, generated by Spartan 14 software.
CompoundMolecular Property Type
Area
(Å)
Volume
3)
PSA
2)
OvalityLog P *Polarizability
(10−30 m3)
Dipole
Moment
(Debye)
EHOMO (eV)ELUMO (eV)∆E 1 (eV)
1a411.29386.2244.5871.602.7771.874.44−5.5964−2.05753.5389
1b423.07400.5346.8351.612.2272.984.15−5.5989−1.85153.7474
1c422.59400.4646.7511.611.0672.982.34−5.6384−1.92943.7090
1d446.42422.8248.3601.642.3975.144.93−4.5358−2.2562.2798
1e442.95418.7546.9121.642.3974.454.48−5.5815−1.80403.7775
1f443.05418.8246.7771.642.3974.454.70−5.5835−1.79833.7852
1g438.80414.2146.8001.632.0874.122.43−5.6408−2.01753.6233
1h436.28413.8345.0591.621.9074.101.98−5.7575−2.07693.6806
1i438.01414.0046.7321.631.9074.135.11−5.6965−2.20763.4889
1j438.37414.1046.6891.631.7174.122.00−5.6844−2.08883.5956
1k443.41418.7046.7961.642.3574.482.41−5.6448−2.03133.6135
1l443.46418.6946.6511.643.3974.492.35−5.6510−2.05703.5940
1m454.83427.9647.4761.661.9575.234.17−5.6053−1.94843.6569
1n453.64427.5946.5791.652.5575.265.31−5.7401−2.37243.3677
1o464.05436.9547.4141.672.4975.954.08−5.6125−1.94843.6641
* Log P values were calculated based on the algorithm provided by Spartan 14 software using the method of Ghose, Pritchett, and Crippen. 1 ∆E (eV)—energy band gap = ǀEHOMO − ELUMOǀ.
Table 3. Molecular descriptors calculated based on data generated by Spartan 14 software.
CompoundIonization Potential 2Electron Affinity 3Chemical Hardness 4Chemical Softness 5Electronegativity 6Chemical
Potential 7
Electrophilicity Index 8
1a5.59642.05751.76950.28263.8270−3.82704.1384
1b5.59891.85151.87370.26693.7252−3.72523.7031
1c5.63841.92941.85450.26963.7839−3.78393.8603
1d4.53582.25601.13990.43863.3959−3.39595.0584
1e5.58151.80401.88880.26473.6928−3.69283.6099
1f5.58351.79831.89260.26423.6909−3.69093.5989
1g5.64082.01751.81170.27603.8292−3.82924.0467
1h5.75752.07691.84030.27173.9172−3.91724.1690
1i5.69652.20761.74450.28663.9521−3.95214.4767
1j5.68442.08881.79780.27813.8866−3.88664.2012
1k5.64482.03131.80680.27673.8381−3.83814.0766
1l5.65102.05701.79700.27823.8540−3.85404.1328
1m5.60531.94841.82850.27353.7769−3.77693.9007
1n5.74012.37241.68390.29694.0563−4.05634.8856
1o5.61251.94841.83210.27293.7805−3.78053.9005
2 Ionization potential (I = − EHOMO). 3 Electron affinity (A = − ELUMO). 4 Chemical hardness (ƞ = (IA)/2). 5 Chemical softness (S = 1/2ƞ). 6 Electronegativity (χ = (I + A)/2). 7 Chemical potential (µ = − (I + A)/2). 8 Electrophilicity index (ψ = µ2/2η).
Table 4. Lipinski’s rule of five applied for the designed chemical compounds 1a1o.
CompoundMolecular Mass
(<500 Da)
Log P *
(<5)
Number of
H-Bond Donors
(<5)
Number of
H-Bond Acceptors
(<10)
Number of
Violations of Rule of Five
1a397.514.79250
1b391.494.49250
1c391.494.15250
1d405.516.03251
1e405.514.85250
1f405.514.85250
1g425.935.11251
1h425.935.11251
1i425.935.11251
1j425.935.11251
1k470.385.18251
1l470.385.51251
1m460.386.92251
1n460.386.07251
1o549.287.04252
* Log P values were generated by using the XLOGP3-AA method.
Table 5. The drug-likeness features according to Lipinski, Veber, Ghose, and Egan rules.
CompoundLipinskiGhoseVeberEganBioavailability Score
1aYesYesYesYes0.55
1bYesYesYesYes0.55
1cYesYesYesYes0.55
1dYesYesYesYes0.55
1eYesYesYesYes0.55
1fYesYesYesYes0.55
1gYesYesYesYes0.55
1hYesYesYesYes0.55
1iYesYesYesYes0.55
1jYesYesYesYes0.55
1kYesYesYesYes0.55
1lYesYesYesYes0.55
1mYesYesYesYes0.55
1nYesYesYesYes0.55
1oNo; 2 violations: MW > 500, MLOGP > 4.15No; 2 violations: MW > 480, MR > 130YesYes0.17
Table 6. Computational pharmacokinetic and toxicity profiles for compounds.
CompoundsIntestinal Absorption %BBB
Permeability
AMEShERG I InhibitorHepatotoxicitySkin Sensitization
1a90.166−0.05nononono
1b91.808−0.124nonoyesno
1c91.829−0.005nonoyesno
1d91.373−0.089nonoyesno
1e91.447−0.068nonoyesno
1f91.484−0.073nonoyesno
1g90.375−0.083nononono
1h90.4780.033nonoyesno
1i90.3770.014nononono
1j90.282−0.008nononono
1k90.308−0.084nononono
1l90.29−0.016nonoyesno
1m88.3640.004nononono
1n88.753−0.013nononono
Table 7. The inhibitor/substrate features of natural compounds for CYP2D6, CYP3A4, CYP1A2, CYP2C19, and CYP2C9.
CompoundsCYP3A4
Substrate
CYP1A2 InhibitorCYP2C19 InhibitorCYP2C9 InhibitorCYP2D6
Substrate/Inhibitor
CYP3A4 Inhibitor
1ayesyesyesyesno/noyes
1byesyesyesyesno/noyes
1cyesyesyesyesno/noyes
1dyesyesyesyesno/noyes
1eyesyesyesyesno/noyes
1fyesyesyesyesno/noyes
1gyesnoyesyesno/noyes
1hyesnoyesyesno/noyes
1iyesnoyesyesno/noyes
1jyesnoyesyesno/noyes
1kyesnoyesyesno/noyes
1lyesnoyesyesno/noyes
1myesnoyesyesno/noyes
1nyesnoyesyesno/noyes
Table 8. List of intermolecular interactions between the ligand molecules docked with 2XCS (S. aureus DNA gyrase B, chain F) using CLC Drug Discovery Workbench Software.
CompoundScoreRMSD
(Å)
Interacting GroupHydrogen Bond *Bond
Length
(Å)
Co-crystallized
RXV F 1021
−48.281.29SER1084(B), ASP1083(B), MET1075(B), VAL1071(B), MET1121(B), GLY1072(B), ALA1068(B), ARG1069(B), ARG1122(D), MET1121(D), ALA1068(D), GLY1072(D), MET1075(D), VAL1071(D), ASP1083(D)N sp2 (N21)–O sp2
from ASP1083(B)
2.902
1a−28.040.98MET 586, GLU 585, GLY 584, ALA 439, SER 438, ASP 437, LEU 583, TIR 580, GLY 582, GLY 436, LYS 581, ASP 508, GLU 435, LEU 457, ARG 458, GLY 459, LYS 460, ILE 516
(see Figure S6 in Supplementary Materials)
O sp2 (O21)–O sp3
from SER 438
O sp2 (O21)–N sp2
from SER 438
O sp2 (O21)–N sp2
from ASP 437
N sp2 (N19)–O sp3
from ASP 437
N sp2 (N23)–O sp3
from ASP 437
(see Figure S7 in Supplementary Materials)
3.202

2.673

3.183

3.259

2.950


1b−35.850.54GLY 440, ASP 437, SER 438, GLY 584, ALA 439, LEU 583, GLY 436, GLY 582, ASP 508, GLU 435, LEU 457, ARG 458, GLY 459, LYS 460, ASP 512, ILE 516
(see Figure S8 in Supplementary Materials)
O sp3 (O7)–N sp2
from ASP 437
N sp3 (N17)–O sp2
from GLU 435
(see Figure S9 in Supplementary Materials)
3.136

3.086


1c−28.041.11ASP 437, SER 438, ALA 439, GLY 436, LEU 457, GLU 435, ASP 508, ARG 458, GLY 459, LYS 460
(see Figure S10 in Supplementary Materials)
N sp2 (N19)–O sp3
from SER 438
N sp3 (N17)–N sp2
from ASP 437
N sp3 (N17)–N sp2
from SER 438
(see Figure S11 in Supplementary Materials)
3.027

3.114

2.987


1d−43.460.74ASP 437, SER 438, GLY 436, LEU 457, ALA 439, GLY 584, LEU 583, GLU 435, GLY 582, LYS 581, ASP 508, PRO 1080, HYS 1081, MET 1075, GLY 1082, ASP 1083, SER 1084, ARG 458
(see Figure S12 in Supplementary Materials)
O sp3 (O7)–N sp2
from SER 438
O sp3 (O7)–O sp3
from SER 438
O sp2 (O21)–O sp3
from SER 438
(see Figure S13 in Supplementary Materials)
3.229

3.022

3.026


1e−34.340.64GLY 441, ASP 437, SER 438, ALA 439, GLY 436, LEU 457, GLU 435, ASP 508, ARG 458, GLY 459, LYS 460
(see Figure S14 in Supplementary Materials)
N sp2 (N19)–O sp3
from SER 438
N sp3 (N17)–O sp3
from SER 438
N sp3 (N17)–N sp2
from SER 438
(see Figure S15 in Supplementary Materials)
2.817

3.071

3.165


1f−29.570.52ASP 437, SER 438, ALA 439, GLY 436, LEU 457, GLU 435, ASP 508, ARG 458, GLY 459, LYS 460
(see Figure S16 in Supplementary Materials)
N sp2 (N23)–O sp3
from SER 438
N sp2 (N19)–O sp3
from SER 438
N sp3 (N17)–O sp3
from SER 438
N sp3 (N17)–N sp2
from SER 438
N sp3 (N17)–N sp2
from ASP 437
O sp2 (O21)–N sp2
from ASP 437
(see Figure S17 in Supplementary Materials)
3.023

2.599

3.108

2.786

3.196

3.150


1g−35.550.34ASP 437, SER 438, ALA 439, GLY 436, LEU 457, GLU 435, ASP 508, ARG 458, GLY 459, LYS 460
(see Figure S18 in Supplementary Materials)
O sp3 (O7)–N sp2
from SER 438
O sp3 (O7)–N sp2
from ASP 437
(see Figure S19 in Supplementary Materials)
3.091

3.140


1h−30.440.62GLY 440, ASP 437, SER 438, ALA 439, GLY 582, GLY 436, GLU 435, LEU 457, ARG 458, ASP 1083, GLY 1082, MET 1075, HYS 1081, PRO 1080, ASP 508
(see Figure S20 in Supplementary Materials)
O sp3 (O7)–N sp2
from ASP 437
(see Figure S21 in Supplementary Materials)
3.100


1i−31.011.31GLY 440, ASP 437, SER 438, GLY 584, ALA 439, LEU 583, ASP 508, GLY 582, GLY 436, GLU 435, LEU 457, ARG 458, GLY 459, LYS 460, ILE 461
(see Figure S22 in Supplementary Materials)
N sp2 (N19)–O sp3
from SER 438
N sp3 (N17)–O sp3
from SER 438
N sp3 (N17)–N sp2
from SER 438
N sp3 (N17)–N sp2
from ASP 437
(see Figure S23 in Supplementary Materials)
2.875

3.326

2.895

3.095


1j−34.340.24ASP 437, SER 438, ALA 439, GLY 584, LEU 583, GLY 436, LEU 457, GLU 435, ASP 508, ARG 458, GLY 459, LYS 460, ILE 461
(see Figure S24 in Supplementary Materials)
N sp2 (N19)–O sp3
from SER 438
N sp3 (N17)–O sp3
from SER 438
N sp3 (N17)–N sp2
from SER 438
(see Figure S25 in Supplementary Materials)
2.941

3.092

3.176


1k−29.361.31ASP 437, SER 438, GLY 584, ALA 439, GLU 585, LEU 583, GLY 582, GLY 436, LEU 457, GLU 435, LYS 581, ASP 508, ARG 458, GLY 459, LYS 460, ILE 516
(see Figure S26 in Supplementary Materials)
O sp2 (O21)–O sp3
from SER 438
O sp2 (O21)–N sp2
from SER 438
(see Figure S27 in Supplementary Materials)
2.824

3.359


1l−34.340.20ASP 437, SER 438, ALA 439, GLY 436, LUE 457, GLU 435, ASP 508, ARG 458, GLY 459, LYS 460
(see Figure S28 in Supplementary Materials)
N sp2 (N19)–O sp3
from SER 438
N sp3 (N17)–O sp3
from SER 438
O sp2 (O21)–N sp2
from ASP 437
O sp3 (O7)–N sp2
from GLY 459
(see Figure S29 in Supplementary Materials)
2.714

3.132

3.089

3.123


1m−28.851.67GLY 440, GLY 584, ALA 439, LEU 583, DER 438, ASP 437, GLY 582, GLY 436, LEU 457, GLU 435, ASP 508, ARG 458, GLY 459, LYS 460
(see Figure S30 in Supplementary Materials)
O sp3 (O7)–O sp3
from SER 438
O sp3 (O7)–N sp2
from SER 438
O sp3 (O7)–N sp2
from ASP 437
(see Figure S31 in Supplementary Materials)
3.329


2.996

3.204


1n−22.270.50GLY 440, ASP 437, SER 438, ALA 439, GLY 584, GLU 585, LEU 583, GLY 436, GLY 582, LYS 582, ASP 508, GLU 435, ARG 458, GLY 459, ILE 516
(see Figure S32 in Supplementary Materials)
O sp2 (O21)–O sp3
from SER 438
O sp2 (O21)–N sp2
from SER 438
O sp2 (O21)–N sp2
from ASP 437
(see Figure S33 in Supplementary Materials)
3.176

2.762

3.156


1o−30.441.87LEU 583, GLY 584, ALA 439, SER 438, ASP 437, GLY 436, ASP 508, GLU 435, LEU 457, ARG 459, GLY 459, LYS 460
(see Figure S34 in Supplementary Materials)
O sp3 (O7)–O sp3
from SER 438
O sp3 (O7)–N sp2
from SER 438
O sp3 (O7)–N sp2
from ASP 437
(see Figure S35 in Supplementary Materials)
3.229

2.950

3.252


* The numbering of atoms was generated by the Spartan 14 software. Figure 1a emphasizes the labeled compound 1d, suitable for a quantum mechanics calculation. Supporting information with respect to the tube and wire label representation for each chemical compound included in the current study is provided in the Supplementary Materials, Figures S1a–o and S2a–o.
Table 9. The list of intermolecular interactions between the ligand molecules docked with 4DUH (E. coli DNA gyrase B, chain A) using CLC Drug Discovery Workbench Software.
CompoundScoreRMSD
(Å)
Interacting GroupHydrogen BondBond
Length
(Å)
Co-crystallized
RLIA301
−72.040.08LYS 103:A, ALA 100:A, GLY 102:A, GLY 101:A, ILE 94:A, PRO 79:A, ILE 78:A, ARG 76:A, GLY 75:A, THR 165:A, ASP 73:A, GLN 72:A, VAL 71:A, VAL 167:A, GLU 50:A, ASN 46:A, VAL 120:A, VAL 43:A, ALA 47:AO sp2(O12)–N sp2 from ARG 136:A
O sp2 (O12)–N sp2 from ARG 136:A
O sp2 (O12)–N sp2 from ARG 76:A
N sp3 (N13)–O sp2 from GLY 101:A
H–O sp2 from ASP 73:A
3.069

2.700

3.138

3.146

1.822
1a−69.390.32VAL 118, GLY 117, HIS 99, PHE 104, ALA 100, GLY 119, VAL 120, ILE 94, LYS 103, GLY 101, GLY 102, VAL 43, ASN 46, VAL 167, VAL 71, ALA 47, THR 165, ASP 73, ILE 78, PRO 79, GLU 50, GLY 77, GLY 75, ARG 76, ARG 136
(see Figure S36 in Supplementary Materials)
N sp2 (N24)–N sp2 from LYS 103
(see Figure S37 in Supplementary Materials)
3.159


1b−65.040.19HIS 99, PHE 104, VAL 118, GLY 117, GLY 119, LIS 103, ALA 100, GLY 102, GLY 101, ILE 94, MET 95, VAL 120, GLU 42, ASN 46, VAL 43, ALA 47, GLU 50, VAL 167, ASP 73, GLY 75, THR 165, ARG 136, ARG 76, GY77, ILE 78, PRO 79
(see Figure S38 in Supplementary Materials)
N sp3 (N18)–N sp2 from ASN 46
(see Figure S39 in Supplementary Materials)
2.727


1c−66.870.58HYS 99, MET 95, GLY 119, VAL 120, PHE 104, ALA 100, ILE 94, GLY 101, LYS 103, GLY 102, ILE 78, PRO 79, GLY 77, ARG 76, ARG 136, VAL 43, VAL 44, VAL 71, VAL 167, LEU 132, ASN 46, MET 166, ALA 47 GLN 72, ASP 73, THR 165, GLU 50
(see Figure S40 in Supplementary Materials)
O sp3 (O8)–N sp2 from ASN 46
N sp3 (N18)–O sp2 from GLY 101
N sp3 (N22)–O sp2 from GLY 101
N sp2 (N26)–N sp2 from ARG 76
(see Figure S41 in Supplementary Materials)
3.058

3.182

2.830

2.878


1d−76.331.51GLY117, VAL 118, ASP105, PHE104, HIS 99, SER 121, VAL 120, LYS 103, ALA 100, GLY 102, GLY 101, ILE 94, GLU 42, VAL 44, VAL 43, ASN 46, ALA 47, VAL 71, GLY 50, GLN 72, ASP 73, VAL 167, MET 166, THR 165, ILE 78, GLY 77, ARG 76, ARG 136, PRO 79, GLY 119
(see Figure S42 in Supplementary Materials)
O sp2 (O21)–N sp2 from ASN 46
N sp3 (N19)–N sp2 from ASN 46
N sp2 (N23)–N sp2 from ASN 46
(see Figure S43 in Supplementary Materials)
2.642

2.686

3.178


1e−70.991.60VAL 97, SER 121, ILE 94, LEU 98, ALA 100, HIS 99, GLY 119, GLY 101, VAL 118, GLY 117, GLY 102, PHE 104, LIS 103, ASP 105, VAL 120, PRO 79, ILE 78, VAL 43, GLY 77, VAL 44, ASN 46, ALA 47, ARG 76, GLU 50, ASP 73, GLN 72, ARG 136, THR 165, VAL 71, MET 166, VAL 167
(see Figure S44 in Supplementary Materials)
N sp3 (N20)–O sp2 from ALA 100
(see Figure S45 in Supplementary Materials)
3.163


1f−65.340.10ASP 73, ALA 47, VAL 43, GLU 42, ASN 46, GLU 50, GLY 75, THR 165, ARG 76, GLY 77, ILE 78, ARG 136, PRO 79, GLY 117, VAL 118, GLY 119, VAL 120, LYS 103, PHE 104, ASP 105, HYS 99, ILE 94, GLY 101, GLY 102, ALA 100
(see Figure S46 in Supplementary Materials)
N sp3 (N18)–N sp2 from ASN 46
N sp2 (N24)–N sp2 from ASN 46
(see Figure S47 in Supplementary Materials)
3.305

3.205


1g−71.850.72HIS 99, PHE 104, VAL 118, GLY 117, GLY 119, ALA 100, VAL 120, GLU 42, LIS 103, GLY 102, GLY 101, ILE 94, VAL 43, ASN 46, VAL 167, ALA 47, GLU 50, ASP 73, GLY 75, THR 165, GLY 77, ARG 76, ARG 136, ILE 78, PRO 79
(see Figure S48 in Supplementary Materials)
N sp3 (N18)–N sp2 from ASN 46
(see Figure S49 in Supplementary Materials)
2.914


1h−65.560.44HIS 99, ALA 100, GLY 102, GLY 119, LYS 103, ILE 91, GLY 101, MET 95, VAL 120, VAL 43, ASN 46, VAL 44, ALA 47, GLU 50, VAL 71, VAL 167, MET 166, GLN 72, ASP 73, THR 165, GLY 77, ARG 76, ILE 78, PRO 79, ARG 136
(see Figure S50 in Supplementary Materials)
O sp3 (O8)–N sp2 from ASN 46
(see Figure S51 in Supplementary Materials)
3.072


1i−66.790.65ARG 136, PRO 79, ILE 78, ILE 94, MET 95, VAL 97, ALA 100, GLY 101, GLY 102, HIS 99, LYS 103, SER 121, GLY 77, THR 165, VAL 167, MET 166, GLY 164, GLY 119, GLY 75, VAL 118, GLU 50, ASN 46, ALA 47, GLU 42, VAL 71, VAL 43, ASP 73
(see Figure S52 in Supplementary Materials)
O sp2 (O22)–N sp3 from LYS 103
N sp3 (N18)–O sp2 from GLY 77
(see Figure S53 in Supplementary Materials)
3.298

3.396


1j−72.610.11VAL 118, GLY 117, HIS 99, PHE 104, GLY 119, GLU 42, VAL 120, ALA 100, ILE 94, GLY 101, GLY 102, LIS 103, VAL 167, VAL 43, ASN 46, GLU 50, ASP 73, THR 165, ILE 78, PRO 79, GLY 77, ARG 76, GLY 75, ARG 136, ALA 47
(see Figure S54 in Supplementary Materials)
N sp3 (N18)–N sp2 from ASN 46
(see Figure S55 in Supplementary Materials)
3.091


1k−64.070.70GLY 117, VAL 118, ASP 45, ASP 49, GLU 42, VAL 43, ASN 46, ALA 47, GLY 119, GLU 50, LYS 103, GLY 102, VAL 71, ASP 73, VAL 120, ALA 100, PRO 79, ILE 94, ILE 78, GLY 77, THR 165, MET 95, MET 166, VAL 167
(see Figure S56 in Supplementary Materials)
N sp3 (N18)–N sp2 from ASN 46
O sp2 (O22)–N sp2 from ASN 46
O sp3 (O8)–N sp2 from ASN 46
(see Figure S57 in Supplementary Materials)
3.171

3.195

3.073


1l−65.020.21HIS 99, VAL 118, GLY 117, PHE 104, ALA 100, GLY 119, VAL 120, GLU 42, ILE 94, GLY 101, GLY 102, LYS 103, VAL 43, VAL 44, ASN 46, ALA 47, PRO 79, ILE 78, GLU 50, VAL 167, VAL 71, MET 166, THR 165, ASP 73, GLY 77, ARG 76, ARG 136
(see Figure S58 in Supplementary Materials)
N sp3 (N20)–N sp2 from ALA 100
(see Figure S59 in Supplementary Materials)
3.353


1m−74.901.49GLY 117, VAL 118, GLY 119, VAL 120, SER 121, PHE 104, HIS 99, LEU 98, VAL 97, ALA 100, ILE 94, GLY 101, GLY 102, LIS 103, VAL 43, ASN 46, GLU 50, ASP 73, THR 165, GLY 75, ILE 78, GLY 77, ARG 76, ARG 136, PRO 79, ALA 47
(see Figure S60 in Supplementary Materials)
N sp3 (N20)–N sp2 from ASN 46
(see Figure S61 in Supplementary Materials)
3.082


1n−67.580.78HIS 99, PHE 104, ALA 100, GLY 119, SER 121, VAL 120, LYS 103, MET 95, ILE 94, GLY 101, GLY102, VAL 43, ASN 45, VAL 44, VAL 167, ALA 47, VAL 71, GLN 72, ASP 73, GLU 30, MET 166, THR 165, ILE 78, PRO 79, GLY 77, ARG 76, ARG 136
(see Figure S62 in Supplementary Materials)
N sp2 (N18)–O sp2 from GLY 101
N sp2 (N20)–O sp2 from GLY 101
(see Figure S63 in Supplementary Materials)
3.178

2.755


1o−78.371.10ASP 105, GLY 117, VAL 118, PHE 104, HIS 99, GLY 119, GLU 42, LYS 103, ALA 100, GLY 102, GLY 101, ILE 94, VAL 120, ASN 46, VAL 43, ALA 47, GLU 50, VAL 167, ASP 73, GLY 75, THR 165, ARG 76, GLY 77, ILE 78, PRO 79, ARG 136
(see Figure S64 in Supplementary Materials)
N sp3 (N17)–Nsp2 from ASN 46
N sp3 (N19)–N sp2 from ASN 46
N sp2 (N23)–N sp2 from ASN 46
(see Figure S65 in Supplementary Materials)
3.113

2.900

3.135


Disclaimer/Publisher’s Note: The statements, opinions and data contained in all publications are solely those of the individual author(s) and contributor(s) and not of MDPI and/or the editor(s). MDPI and/or the editor(s) disclaim responsibility for any injury to people or property resulting from any ideas, methods, instructions or products referred to in the content.

