Abstract
Quality control is considered a critical aspect of plastic materials in the injection molding process. Two types of deformations occur during the injection molding process, namely, volumetric shrinkage and warpage. This study aims to optimize the warpage of the polyethylene terephthalate preform (PET) used for the packing of carbonated drinks. PET warpage results in an uneven distribution of material over the wall surface of the preform and causes variation in wall thickness. During the filling operation of carbonated drinks, the preforms are subjected to high pressure at the points where the wall thickness is at a minimum, which induces a high-stress concentration. Under high pressure, the preforms are ruptured at the points where the warpage is at a maximum (stress concentration area), causing wastage of the beverage as well as the preform. In this study, the Taguchi method and analysis of variance (ANOVA) are used to determine the most significant parameters to induce warpage during the molding process. Then, we optimize the process parameters in order to reduce warpage through a numerical approach using SolidWorks Plastics. The result shows that the ambient temperature and melting temperature are the most critical parameters that contribute to the warpage, yielding 42.115% and 41.278%, respectively. Among the 6 parameters considered for this study, the pressure holding time contributes a minimum of 0.5961% to the yielding of the warpage. Overall, by optimizing the process parameters, warpage of the PET preform is minimized by 7.7202%, which helps to reduce wastage of the carbonated drink as well as the rejection rate of the preform during the filling operation. In a nutshell, the quality of the preform is improved.
1. Introduction
The plastics sector has greatly developed in recent years and provided viable alternatives to conventional materials, including glass, paper, metal, and ceramic. Since plastic materials are lightweight and chemically stable, they are employed to make useable items. During the last decade, global plastic demand has increased drastically from 204 million tons to 300 million tons annually [1,2]. Because they can be readily molded into a wide range of forms and sizes, plastic materials have a wide range of uses, particularly for packaging consumer goods, drinks, and other liquid goods, including oil, detergents, shampoo, and juices [3]. The studies in published literature show that injection molding technology is an economical and effective way to produce plastic commodities involving complex profiles [4]. The injection molding process includes three distinct stages: the filling, cooling, and ejection stages. In the first stage, the plastic melt is injected into the mold cavity at a predefined injection temperature. In the second stage, molten material is cooled and solidified to the desired shape of the mold cavity. In the final stage, the solidified part is ejected from the mold cavity [5,6]. Various techniques, including case-based reasoning and simulation, design of experiments (DOE), and online trial and error methods, are used to optimize the injection molding process [7]. These methods can be used to fabricate high-quality products with excellent aesthetic features.
The injection molding process parameters were traditionally optimized by the plastics sector using an online trial and error technique, but this method showed drawbacks of being exceedingly time-consuming, unreliable, and expensive [8,9]. Due to access to powerful computational tools, the plastic industry has moved away from the time-consuming traditional hit-and-trial approaches to the modern computational based solutions. Instead, computer-aided simulation analysis techniques optimize the injection molding process using simulation software such as C-MOLD, Moldex3D, and Moldflow [8]. The computer-based simulated approaches not only help to reduce the execution time, they also provide more interpretive results in the form of weld lines, air traps, stress concentration, cooling time, filling time of the mold cavity, and volumetric shrinkage as well as warpage [9]. The results also provide in-depth insight into the three stages of the injection molding process: filling, packing and cooling, and ejection. Analyzing the various results obtained from the simulation such as flow pattern, variation in velocity, and pressure contours in the form of visuals and numerical data provide an interpretation of the optimum process conditions [10].
Ozcelik et al. interfaced ANOVA, artificial neural network, and a genetic algorithm to optimize the warpage in the injection molding process. The minimum value for the warpage is identified with the help of a genetic algorithm whose results are validated with the experimental data [11]. This study introduced an effective use of a genetic algorithm to optimize the warpage. Yuehua Gao and Xicheng Wang conducted a study and proposed a kriging model for optimizing warpage in the injection molding process. The proposed method’s results show that it could effectively decrease the warpage deformations and that the injection time has an essential influence on the warpage in the chosen range [12]. Michal Stanek et al. optimized the injection molding process by identifying the ideal conditions for the process and observed the dimensions, shapes, and properties of the product in order to investigate the optimal injection pressure, packing pressure, and flow velocity by using the Moldflow Plastics Xpert (MPX) system and presented its usage for optimizing the injection molding process [13].
Rahman et al. investigated the hollow and solid structures of the window frame by employing Moldflow software. The comparative analysis showed that the hollow window frame design is more advantageous in terms of less material utilization and low operation cost in the production process [14]. Sin et al. conducted a study investigating the process conditions for polyvinyl alcohol (PVOH) by varying the starch polymer composition in the base material. In the study, two materials were analyzed by changing the ratio of the starch polymer, namely, PV55 and PV46. It was revealed that the volumetric shrinkage for the PV55 was higher than the PV46 material, while the pressure holding time for both materials was the same [15]. Oliaei et al. conducted research using the Autodesk Moldflow simulation to optimize the warpage and volumetric shrinkage in three diverse types of self-prepared biodegradable polymers, namely, polylactic acid, polylactic acid thermoplastic starch, and polylactic acid–thermoplastic polyurethane. Their research analyzed five different process parameters: melting temperature, mold temperature, packing time, packing pressure, and cooling temperature. They used the Taguchi L27 array to analyze the interactive behavior of the process conditions. They observed that polylactic acid–thermoplastic polyurethane demonstrates s high resistance to warpage and shrinkage [8]. Hakimian and Sulong used ‘Taguchi’s design for three different thermoplastic materials to investigate the warpage volumetric shrinkage of the small micro gears in the injection molding process by analyzing various process parameters. Their study revealed that packing pressure, injection pressure, cooling temperature, packing time, melting temperature, and mold temperature significantly affect the shrinkage and warpage for all tested materials [16]. Kamaruddin applied the Taguchi method to plastic tray manufacturing through the injection molding process composed of 75% polypropylene and 25% polyethylene to increase the quality of the output product. The results showed that lower melting temperature, lower holding time, and higher cooling time contribute to the best quality of the product [17]. The literature review shows that the warpage can be minimized by optimizing the injection molding process parameters but the Solid Works Plastics is not explored yet for the optimization of the injection molding process. The current study explores a new method for the optimization of the injection molding process parameters. Under the current study, the material used for the injection molding process is polyethylene terephthalate (PET).
PET is a thermoplastic polymer resin that belongs to the polyester family. PET is a polymerized compound (C10H8O4) [18,19] that exists in amorphous crystalline forms. PET has a wide range of applications; it is commonly used for clothing, producing packaging for food and beverages, and synthesis of engineering resins by combining them with glass fiber [20,21].
According to Sulyman et al., polyethylene terephthalate makes up 18% of the global polymers. A total of 60% of PET production is used in synthetic fibers and packing bottles [2]. According to the study, the opacity of PET depends on the size of its particles; when the particles are less than 500 nanometers, PET seems transparent, but when the particles are more significant than micrometers, PET appears opaque [22,23]. The most advantageous feature of PET is its ease of recycling and reuse (its resin identification code is 1) [24]. Compared with other packing materials such as paper, glass, and other resins, PET is the third most used polymer and is preferred by the food and packaging industries because it is hygienic, strong, and lightweight. It also has relatively good chemical, physical, and mechanical properties. [25,26]. PET is also a strong, stiff, colorless, semicrystalline polymer material that is ideal for use in the beverage sector. It is also lightweight, highly recyclable, safe for contact with food, and has gas barrier features [27]. In terms of chemical properties, it is resistant to oils, fats, weak acids, and alkaline solutions and sustains high energy radiations usually greater than 100 kJ/kg [28,29]. In terms of mechanical properties, PET demonstrates a higher tensile strength than ordinary polymers, and its toughness increases with the orientation of the crystals [30]. According to the Food and Drug Authority (FDA), PET is a non-toxic substance that has no hazardous effects on the food products being packaged in it. It is widely used in the food and beverage packing sector due to the FDA’s clearance of its safety for food goods [31].
The current study is focused on identifying the optimal process parameters for the injection molding process to optimize warpage with a new approach of Using Solid Works Plastics, the Taguchi method, and ANOVA to develop a solution to a real industrial problem. Under this study, 28 g of PET preform from the ECOPACK Limited Company is observed both experimentally and numerically to investigate the ideal process parameters in order to achieve good product quality and mitigate the wastage of beverage and the preform itself due to rupturing during the filling stage of the process. Warpage is responsible for the uneven distribution of wall thickness and induces stress concentration areas at the points where the wall thickness is smaller than 1.495 mm (65% of the wall thickness). Thus, warpage is responsible for the bursting phenomenon that can occur during the filling stage, which in turn results in wastage of the beverage and rejection of the preform. The aim of this study is to mitigate the rejection rate of the preform, reduce the wastage of the beverage, and provide another approach for the optimization of the injection molding process. Based on an extensive literature review, SolidWorks Plastic has not yet been explored for process parameter optimization of the injection molding process. Thus, this study deals with the description of Solid Works Plastic and its usage in the optimization of the injection molding process to contribute to optimizing the process parameters of the plastic industry.
2. Methodology
Warpage refers to the non-homogenous distribution of the plastic material on the wall of the molded part. Where the warpage occurs at a maximum, the wall thickness at that specific point is at a minimum. At the filling stage of the PET perform, the low wall thickness induces high-stress concentration areas, and a rupture of the preform could occur when these areas are subjected to high pressures during the filling stage. Although it is difficult to manufacture warpage-free molded components, it can be reduced by investigating the ideal process parameters.
2.1. Procedure
First, the dimensions of the 28 g preform are identified by using the Vernier caliper and screw gauge. In addition, the wall thickness at various points is measured accordingly to investigate the warpage in the molded part. The observed dimensions and wall thickness are compared with the standard dimensions of the PET preform. The observation shows that the maximum warpage of the molded part ranges from 1.4089–1.45309 mm at different points. SolidWorks 2016 Premium Package was employed to construct a three-dimensional (3D) model of the preform. From the process sheet provided by the ECOPACK Limited Company, (Hattar Industrial Estate, District Swabi, Khyber Pakhtunkhwa, Pakistan) the six most important parameters are selected that have a high impact on the warpage as discussed in the literature section. Based on these six parameters, the possible design of experiments (DOE) that are 36 = 729 is calculated at three different levels. By employing and setting the Taguchi array, the possible array setting for such a condition is an L27 array that easily accommodates six different parameters at three different levels and could appropriately predict the nature of the process and the importance of each parameter in the process. To set up the L27 Taguchi array, a powerful statistical tool, Minitab 19, is used with six factors at three different levels, as instructed by the process sheet obtained from the ECOPACK Limited Company, with 27 runs. SolidWorks Plastic Aid-In is utilized for numerical analysis of all 27 DOE’s to predict the corresponding value of each experiment. Each simulation for a specific DOE predicted the warpage value. Later, ANOVA is conducted to rank the parameters based on their importance in the process. The ANOVA analysis provided a clear image of the process and indicated that the major contributing factors for the warpage are ambient temperature and melting temperature and ranked all the remaining parameters based on their contribution. Moreover, a response optimizer is used to optimize the process parameters in order to mitigate the warpage in the process. Finally, regression analysis is carried out to predict the numerical model for the optimized warpage analysis. The schematic diagram for the current study is presented in Figure 1.
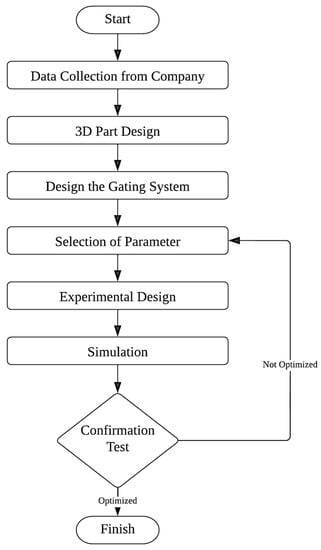
Figure 1.
Procedure and Methodology Adopted for the Study.
2.2. Modeling of PET Preform
The preform used by the ECOPACK Limited company has a weight 28 g and a volume of 17.01 cm3. The standard dimensions to achieve the exact weight and volume of the preform are shown in Figure 2a,b. The length of the preform is 100.6 mm, with an outer diameter of 24.81 mm, while the wall thickness is 2.47 mm.
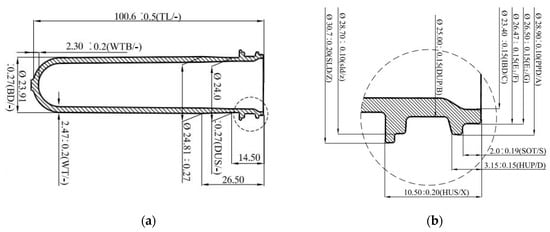
Figure 2.
(a) Standard dimensions of the 28 g preform; (b) minor details of the magnified region.
2.3. Three-Dimensional Modeling
Based on the standard dimensions to achieve the exact model, a three-dimensional model in Solid Works is created as shown in Figure 3. The volume of the 3D model is 17.01 cm3 and the weight of the preform is estimated by the software as 28 g. The material is set to PET Generic in the SolidWorks material library in order to define the material properties for the simulation, such as viscosity, density, thermal conductivity, Poisson’s ratio, thermal expansion coefficient, elastic modulus, and maximum shear stress. As the viscosity and density are not constant due to continuous temperature changes during the process (from injection to the cooling phase), all the relevant values of viscosity and density at different temperatures are defined accordingly. The properties of the PET Generic material are provided in Table 1.
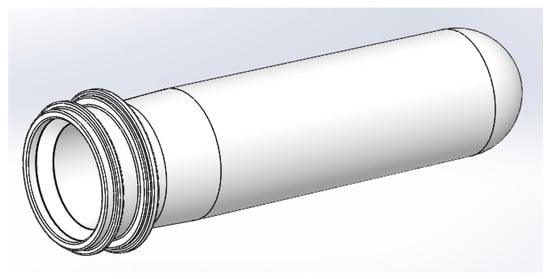
Figure 3.
Three-dimensional CAD Model for 28 g preform.

Table 1.
Properties of the PET Generic Material used for 3D Model Simulation.
2.4. Selection of Injection Molding Parameters at Three Levels
It can be seen from the PET material properties in Table 1 that the minimum temperature required to melt the PET is 265 °C, while the maximum temperature at which the PET completely melts is 290 °C. Similarly, in the process sheet, the melting temperature is taken at three different stages such as 280 °C, 285 °C, and 290 °C. The feasible space for the molding parameters is defined for all the remaining 5 parameters where the mold temperature ranges from 275–285 °C, injection pressure varies from 15.5–16.5 MPa, pressure holding time varies from 1.55–1.65 s, cooling time ranges from 1.5 to 2.5 s, and ambient temperature ranges from 25–30 °C. All the six parameters are taken at three different stages (minimum value, middle value, and maximum value of the range) for the PET material to observe its effect on the injection molding process. The parameters selected for the analysis and their levels are provided in Table 2.
Table 2.
Parameters and their levels.
The Taguchi method uses the level of data as shown in Table 2 and plots an orthogonal array of the possible outcome. In this study, since the parameters are six in number and are taken at three different levels, the total number of the possible experiments’ combination is 36 = 729 and the possible orthogonal array to accurately predict the effect of each parameter is the L27 array. The L27 orthogonal Taguchi array employed gave the most important combination of the six parameters in 27 experiment designs. Instead of running 729 combinations of experiments both numerically and experimentally, the Taguchi method reduced it to 27 possible experiments in order to predict the effect of each parameter on the warpage.
2.5. Simulations
An appropriate mesh size was adopted to mesh the preform. A tetrahedral mesh element is applied to the three-dimensional model of the preform. After the successful generation of the mesh, it was checked to ensure it was waterproof and had no bad elements in order to obtain accurate results. The mesh independence test is carried out before the simulations, as shown in Figure 4. The result illustrates that for grid numbers above 0.42118 million, the warpage remains constant, which is why the grid number of 0.42118 million elements was considered for this study. Therefore, the element size for all the simulations is kept at 0.42118 million. The total number of elements recorded is 421m180 elements.
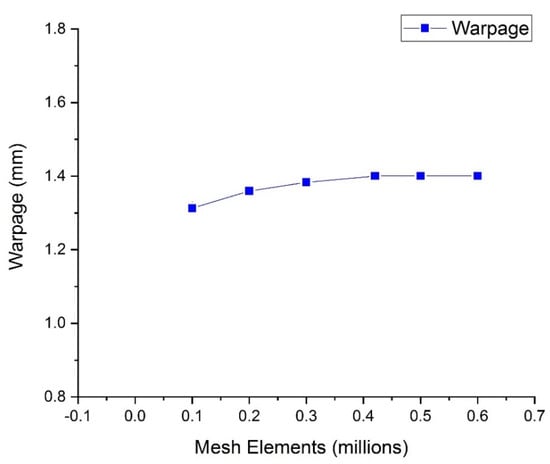
Figure 4.
Mesh independence Test.
The maximum aspect ratio is kept at less than 1. The mesh of the imported CAD model is established by ensuring that the model is closed and airtight without any holes or surface disengagement. In defining the boundary conditions, the mold wall temperature is considered the value of the mold temperature in each design of the experiment. The injection point is set at the bottom of the preform to ensure the continuous flow of the melted plastic into the cavity during the simulation. As there are no vents or air pockets in the cavity, the vents setting is not considered in this study. The wall thickness is set to 2.47 mm in all the designed experiments. The process parameters for each simulation are selected according to each experiment design in the Taguchi array, and the warpage value is predicted against each set of experiments. For the L27 Taguchi array, a total of 27 simulations were conducted. The mesh quality is presented in Figure 5.
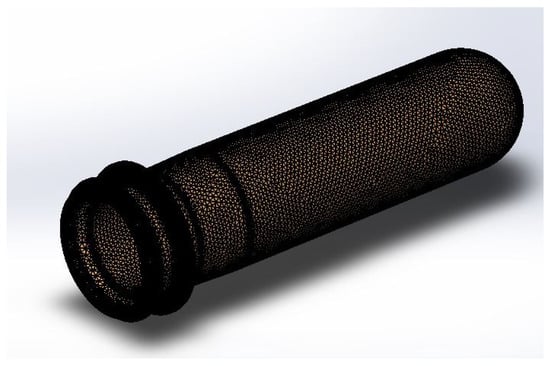
Figure 5.
Mesh Generated for the 28 g Preform.
2.6. Optimization
The designs of the experiments in the Taguchi array are analyzed by using signal-to-noise ratio (S/N) and ANOVA. The criterion for the signal-to-noise ratio (S/N) was set to smaller is better because the study aims to minimize the warpage. Based on the results of the S/N ratio and ANOVA, optimum process parameters for better accuracy are obtained and then verified experimentally. The simulated response value of warpage against each design of experiment in the Taguchi array is plotted accordingly as provided in Table 3. Later on, the regression model is developed to obtain the compensation factor for any set of process parameters.
Table 3.
Taguchi Array for Warpage Calculation.
3. Results and Discussions
In this study, the warpage in 28 g PET preform is optimized by ranking the process parameters based on their significance in the injection molding process using a statistical and numerical approach. The signal-to-noise ratio shows the ranking of each parameter, while the variance analysis calculates the actual percent contribution of each parameter in the process. Moreover, regression analysis is used to quantify an empirical model for the process to obtain the desired value of warpage for specific process parameters without going through tedious tasks of simulations and experimentations.
3.1. Signal-to-Noise Ratio (S/N)
The signal-to-noise ratio is used to investigate the sensitivity of the quality characteristic observed in a controlled manner. In the Taguchi array, the “signal” represents the desired effect for the output response (warpage), while the term “noise” represents the signal disturbance for the output response which shows the effects on the outcome by the external factors. The objective of any set of experiments is to identify the possible signal-to-noise ratio for the warpage. The aim of the study is to identify the possible value for the S/N ratio so that the signal is stronger than the random effects of the noise factors, in other words to obtain the minimum variance. To define the S/N ratio there are three types of quality characteristics, i.e., the lower the better, the higher the better, and the nominal the better. Since in this study the purpose is to minimize the warpage, the quality characteristic selected for the response of warpage is “the lower the better”. The S/N table ranking all the process parameters based on their level of inducing warpage is provided in Table 4. The ranking of the signal-to-noise ratio shows that ambient temperature is the most significant process parameter that contributes a maximum to induce warpage at the production facility followed by melting temperature, the mold temperature, injection pressure, and cooling time. Moreover, the S/N ratio shows that the pressure holding time has the lowest impact on the warpage creation of the PET preform. The delta in the response table shows the average value for a specific factor based on the difference between the highest and lowest values.
Table 4.
Response table for S/N ratio.
The S/N value can be calculated by using Equation (1), while the value of the mean square deviation (MSD) is calculated by Equation (2), where y denotes the value of the induced warpage. The value of n symbolizes the total number of experiments [8].
The ranking of each process condition is shown by a Pareto chart in Figure 6. The results of the Pareto chart and the signal-to-noise ratio in Table 4 agree with each other in terms of the ranking of the parameters. Moreover, the main effects plot for the signal-to-noise ratio based on the criterion that smaller is better is shown in Figure 7. The main effects plot determines the relative impact of a variety of inputs on the output of the warpage. In the analysis of variance, the main effects plot shows the mean outcome for each independent variable’s value, combining the effects of the other variables. The values in Figure 7 that are above the mean level of −2.90 are of importance to mitigate the warpage. Thus, it identifies each parameter at a specific level to achieve the optimum results for the warpage. The main effect plot shows picking a parameter at a specific level to achieve the minimum warpage goal in the process. The main effect plot chart determines the best possible combination of the process parameters at such levels to minimize the warpage. The best possible combination from the main effect plot to minimize the warpage is melting temperature, mold temperature, injection pressure, pressure holding time, cooling time, and ambient temperature at 280 °C, 275 °C, 15.5 MPa, 1.65 s, 1.5 s, and 35 °C, respectively. The trend of each parameter and its effect on the warpage is explained in Section 3.4 of the article.
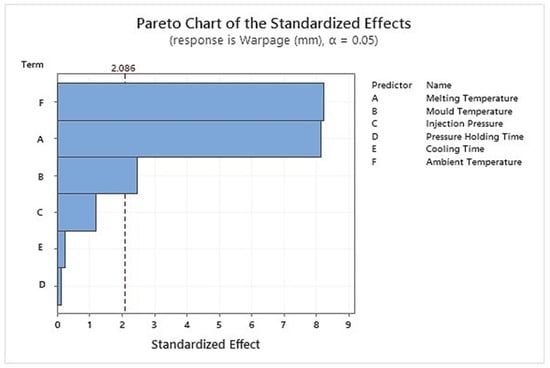
Figure 6.
Pareto Chart for Effects of Process Parameters on Warpage.
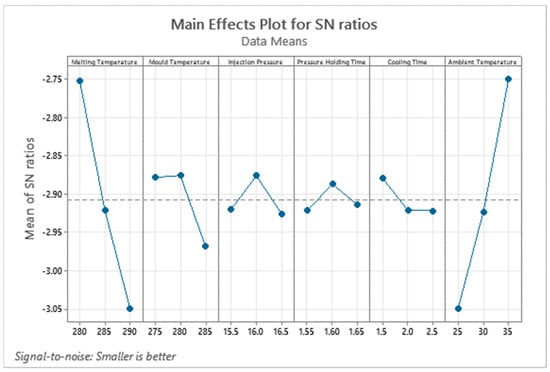
Figure 7.
Main effect plot for S/N ratio.
3.2. Regression Analysis
For this study, the empirical relation to estimate the warpage is established in terms of process parameters. By placing the desired values of the melting temperature, mold temperature, injection pressure, pressure holding time, cooling time, and ambient temperature in the established linear regression empirical equation, it yields the corresponding value of the induced warpage without running complex and tedious tasks of simulations or experimentations. The results of this empirical model equation are approximate. Since the p-value is a statistical test that determines the probability of extreme results of the statistical hypothesis, it shows whether or not there is statistically significant relationship between each predictor variable and the response variable (warpage). The most important values in a regression table are the regression coefficients and their corresponding p values. The regression table is shown in Table 5. It can be seen from the regression table that when the p value for a process condition ranges from 0 to 0.05, the process condition contributes higher to the yielding of warpage. The closer the p-value is to zero the more important the factor for the output response (warpage) is. The injection molding process showed that the p-value for the ambient and melting temperature are near zero. This shows that both factors affect the warpage, as tabulated in Table 5. The p-value for the mold temperature is less than 0.005 and lies at 0.023, which means that the mold temperature also affects the warpage. The p-value for the injection pressure, pressure holding time and cooling time are far greater than 0.05 so it has slight impact on the output warpage.
Warpage (mm) = −0.229 + 0.004772 (Melting Temperature) + 0.001449 (Mold Temperature)
+ 0.00083 (Injection Pressure) − 0.0136 (Pressure Holding Time)
+ 0.00711 (Cooling Time) − 0.004818 (Ambient Temperature)
+ 0.00083 (Injection Pressure) − 0.0136 (Pressure Holding Time)
+ 0.00711 (Cooling Time) − 0.004818 (Ambient Temperature)
Table 5.
Coefficient Table for Regression Analysis.
3.3. Analysis of Variance (ANOVA)
The ANOVA in this study is used to identify parameters that significantly affect the quality characteristics of the injection-molded preform. In addition, the contribution of each factor in inducing warpage is also identified. The variance analysis data as presented in Table 6 show the pooled ANOVA results. The F-ratios were obtained at a 95% confidence level. In the variance analysis method, the ratio of the adjusted SS value of each factor to the total sum of the adjusted SS value gives the percent contribution of each factor. Based on the ANOVA results from Table 6, the percent contribution of each factor is obtained and presented in Table 7. It can be seen from Table 7 that the most significant factor is the ambient temperature, which contributes 41.278% to the yielding of warpage while the melting temperature is the second most important factor that contributes almost 42.116% to the yielding of warpage. The percent contribution of mold temperature is 5.1628%, while that of injection pressure, cooling time, and pressure holding time is 1.3258%, 1.1976%, and 0.59678%, respectively. It can be seen from the analysis that the pressure holding time has the least effect on the yielding of warpage. Based on the analysis of variance, the percent contribution of each factor is given in Table 7.
Table 6.
Variance analysis.
Table 7.
Percent contribution of each process condition.
Furthermore, according to the statistical analysis of Minitab, the F-distribution statistic value is F = 3.37 at a confidence level of 95%. By referring to the variance analysis table it can be seen that for the ambient temperature the [Fstatistic = 67.60 > 3.37] and melting temperature whose [Fstatistic = 66.33 > 3.37] shows that both the factors are significant to the warpage defect. Similarly, the mold temperature, whose [Fstatistic = 6.11> 3.37] which is slightly higher than the F-distribution factor compared with the ambient temperature and melting temperature, has a slight impact on the warpage defect. For the cooling time, the [Fstatistic = 1.47 < 3.37] has no impact on the warpage defect in the process. Moreover, for the injection pressure, the [Fstatistic = 0.05 < 3.37] has a low impact on the warpage. In the variance table the lowest value for the F-distribution is the pressure holding time [Fstatistic = 0.02 < 3.37], which means that the pressure holding time in this study has the lowest impact on the warpage defect.
Table 7 shows the percent contribution of each factor; ambient temperature contributes the most to the warpage while the pressure holding time contributes the least to the warpage defect.
3.4. Warpage Optimization
Since the goal set for the warpage optimization is based on the signal-to-noise ratio being set to the smaller the better, this means that the smallest value of warpage is the most optimal. For warpage optimization, the response optimizer of the Taguchi design is used to minimize the warpage in the PET preform. The target value for the warpage minimization is set at 1.3452. The response optimizer solution produced encouraging results. The optimizer solution shows that if the process conditions are the same as predicted by the optimizer, then the warpage can significantly reduce from the practical value of 1.4556 mm (to almost 1.33803 mm) as shown in Table 8. This denotes an almost 7.7202% reduction in warpage. When preforms are put under high pressure, the rate at which bottling firms reject them may be decreased by reducing warpage because the reduction in warpage helps in the reduction in the stress concentration points. This also results in less material waste at the production plant. The optimized solution for the warpage reduction is given in Table 8 at a confidence level of 95%. The graphical representation of the optimized solution is given in Figure 8.
Table 8.
Optimized solution for warpage.
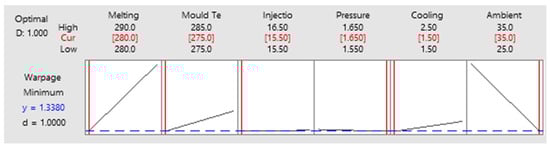
Figure 8.
Graphical representation of the optimized solution.
From Figure 8 it can be seen that as we increase the ambient temperature from 25 to 35 °C, the warpage decreases with the increase in ambient temperature. This is why the optimizer selected the upper level of ambient temperature for the minimization of warpage, i.e., 35 °C, as shown in Table 8. The trend for the melting temperature is in a reverse order because as the melting temperature increases the warpage increases, but as the melting temperature decreases the warpage decreases. This is why the optimizer chose the lower-level value of 280 °C in order to reduce the warpage. Similarly, the trend for the mold temperature is also in the reverse order; as the mold temperature decreases, the warpage defect decreases in the molded part. To obtain the minimum warpage, the ambient temperature should be further increased while the melting temperature and the mold temperature should be further reduced. The standardized residual plot for all the experiments conducted numerically is presented in Figure 9.
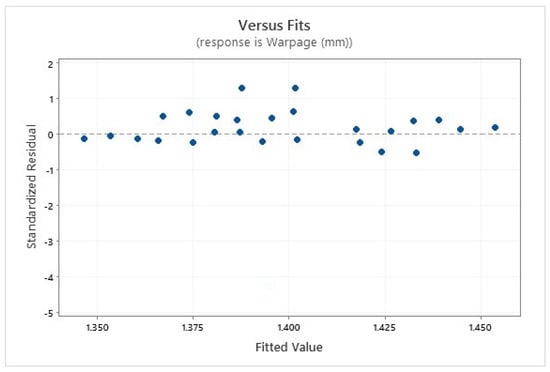
Figure 9.
Standard Residual Plot for Numerical Simulations.
3.5. Simulation Contours
The contours of the warpage and in-mold residual stress displacement are presented in Figure 10. Figure 10a contour shows the total average warpage induced in the x, y, and z-direction. While Figure 10b shows the in-mold residual stress displacement.
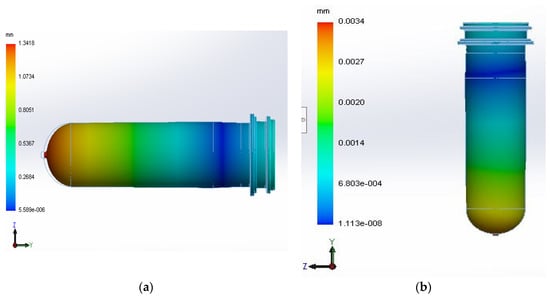
Figure 10.
(a) Warpage contours of PET preform. (b) In-mold residual stress displacement.
The material properties of the PET Generic material used to execute the simulation and obtain the optimum results are presented in Figure 11a and Figure 11b, respectively. Figure 11a shows a graph of the viscosity versus the shear rate, while Figure 11b shows a graph of the specific volume vs. temperature curves for the PET Generic material.
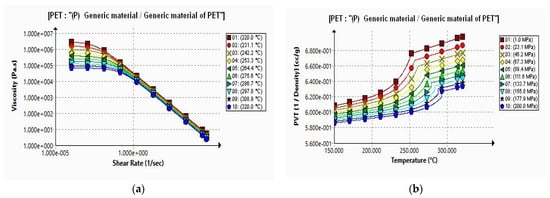
Figure 11.
(a) Viscosity v/s Shear Rate Curves. (b) Specific Volume v/s Temperature Curve.
3.6. Validation of the Results
For all the designs of experiments listed in Table 3, the simulation results were validated with the experimental results. Both the results show close agreement with each other with almost a slight deviation, as shown in Figure 12. The red dots show the experimental value against each experiment while the black dots show the simulated result for each experiment as shown in Table 3 of the orthogonal Taguchi array.
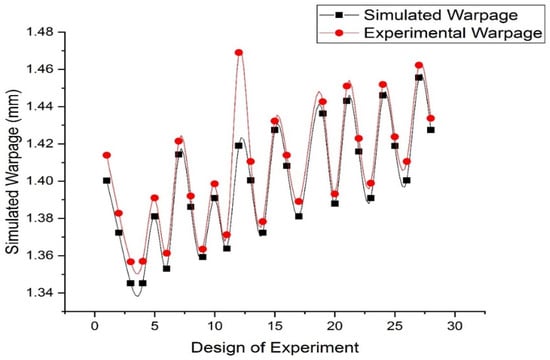
Figure 12.
Validation of Simulated Results with Experimental Results.
4. Conclusions
In this study, warpage optimization was conducted by optimizing the process parameters through statistical, numerical, and experimental-based approaches using the Taguchi method and the SolidWorks Plastics add-in. The results indicate that the ambient temperature is the most critical parameter and is ranked at the first level, followed by the melting temperature, compared with the other four parameters. Overall, the combined percent contribution of the ambient temperature and the melting temperature is almost 83.38%. The results show that the pressure holding time contributes the least to developing warpage. The results indicate that the warpage is reduced by almost 7.72% from 1.4556 mm to 1.33803 mm. In future, another study could be conducted to optimize the volumetric shrinkage of the preforms which could further lower the induction of the stress concentration areas and reduce the rejection rate of the preforms further.
The main conclusions of this study include:
- Ambient temperature is the most significant parameter in terms of warpage. The percent contribution of the ambient temperature to the warpage is approximately 42.116%.
- The melting temperature is the second most significant parameter contributing to the warpage, almost 41.278%.
- The mold temperature and injection pressure contribute to the yielding of warpage at 5.16% and 1.32%, respectively.
- The results show that the cooling time has less impact on the warpage and contributes only 1.19%. The pressure holding time has negligible impact on the warpage, and it contributes only 0.59% to the yielding of the warpage.
- The warpage of PET preform can drop by almost 7.7202% if optimized process parameters are followed. The warpage, under such conditions, can be limited to 1.33803 mm. This means the proposed simulation technique and the Taguchi method can be used efficiently to reduce the warpage in the injection molding processes.
- Warpage optimization decreases the waste of PET material in the production facility and the rejection rate of the PET preform in the bottling industry at higher pressures. The rejection rate of PET can be lowered by 4% if the suggested parameters are used.
- Volumetric shrinkage is another decisive parameter that could help mitigate the rejection rate of the preforms in the packing industry. It could be investigated in future study.
Author Contributions
Conceptualization, Y.C.; methodology, Y.C.; software and formal analysis, J.C. (Jinping Chen), J.C. (Jianfeng Cui) and Y.L.; writing—original draft, Y.C.; supervision, J.C. (Jinping Chen); writing—review and editing, J.C. (Jianfeng Cui) and Y.L. All authors have read and agreed to the published version of the manuscript.
Funding
This work was supported by the Key Scientific Research Project of Colleges and Universities in Henan Province, China (No: 23A460013), the Henan Province Science and Technology Project, China (No: 212102110218), the Teaching Research and Reform Fund for SDJU and Shanghai multidirectional forging Engineering Technology Research Center (grant number 20DZ2253200), the Shanghai Vocational Education Association (No.YB202207), the Aeronautical Science Foundation of China (No. 2015ZB55002), and the Natural Science Foundation of Henan Province (No. 182300410239).
Institutional Review Board Statement
Not applicable.
Informed Consent Statement
Not applicable.
Data Availability Statement
Not applicable.
Conflicts of Interest
The authors report no conflict of interest.
References
- Collard, F.; Gilbert, B.; Eppe, G.; Parmentier, E.; Das, K. Detection of anthropogenic particles in fish stomachs: An isolation method adapted to identification by Raman spectroscopy. Arch. Environ. Contam. Toxicol. 2015, 69, 331–339. [Google Scholar] [CrossRef] [PubMed]
- Sulyman, M.; Haponiuk, J.; Formela, K. Utilization of recycled polyethylene terephthalate (PET) in engineering materials: A review. Int. J. Environ. Sci. Dev. 2016, 7, 100. [Google Scholar] [CrossRef]
- Stevens, E.; Goldstein, N. How green are green plastics? Biocycle 2002, 43, 42–45. [Google Scholar]
- Chen, C.P.; Chuang, M.T.; Hsiao, Y.H.; Yang, Y.K.; Tsai, C.H. Simulation and experimental study in determining injection molding process parameters for thin-shell plastic parts via design of experiments analysis. Expert Syst. Appl. 2009, 36, 10752–10759. [Google Scholar] [CrossRef]
- Hassan, H.; Regnier, N.; Lebot, C.; Pujos, C.; Defaye, G. Effect of cooling system on the polymer temperature and solidification during injection molding. Appl. Therm. Eng. 2009, 29, 1786–1791. [Google Scholar] [CrossRef]
- Fu, J.; Ma, Y. A method to predict early-ejected plastic part air-cooling behavior towards quality mold design and less molding cycle time. Robot. Comput. Integr. Manuf. 2019, 56, 66–74. [Google Scholar] [CrossRef]
- Yeh, D.-Y.; Cheng, C.-H.; Hsiao, S.-C. Classification knowledge discovery in mold tooling test using decision tree algorithm. J. Intell. Manuf. 2011, 22, 585–595. [Google Scholar] [CrossRef]
- Oliaei, E.; Heidari, B.S.; Davachi, S.M.; Bahrami, M.; Davoodi, S.; Hejazi, I.; Seyfi, J. Warpage and shrinkage optimization of injection-molded plastic spoon parts for biodegradable polymers using Taguchi, ANOVA and artificial neural network methods. J. Mater. Sci. Technol. 2016, 32, 710–720. [Google Scholar] [CrossRef]
- Heidari, B.S.; Oliaei, E.; Shayesteh, H.; Davachi, S.M.; Hejazi, I.; Seyfi, J.; Bahrami, M.; Rashedi, H. Simulation of mechanical behavior and optimization of simulated injection molding process for PLA based antibacterial composite and nanocomposite bone screws using central composite design. J. Mech. Behav. Biomed. Mater. 2017, 65, 160–176. [Google Scholar] [CrossRef]
- Solanki, B.S.; Singh, H.; Sheorey, T. Modeling and analysis of cavity modification effect on quality of injection molded polymer gear. Int. J. Interact. Des. Manuf. 2022, 16, 1–18. [Google Scholar] [CrossRef]
- Ozcelik, B.; Erzurumlu, T. Comparison of the warpage optimization in the plastic injection molding using ANOVA, neural network model and genetic algorithm. J. Mater. Process. Technol. 2006, 171, 437–445. [Google Scholar] [CrossRef]
- Gao, Y.; Wang, X. An effective warpage optimization method in injection molding based on the Kriging model. Int. J. Adv. Manuf. Technol. 2008, 37, 953–960. [Google Scholar] [CrossRef]
- Stanek, M.; Manas, D.; Manas, M.; Suba, O. Optimization of injection molding process by MPX. In Proceedings of the 13th WSEAS International Conference on Automatic Control, Modelling & Simulation, Catania, Italy, 29–31 May 2011. [Google Scholar]
- Rahman, W.A.W.A.; Sin, L.T.; Rahmat, A.R. Injection moulding simulation analysis of natural fiber composite window frame. J. Mater. Process. Technol. 2008, 197, 22–30. [Google Scholar] [CrossRef]
- Sin, L.T.; Rahman, W.A.W.A.; Rahmat, A.R.; Tee, T.T.; Bee, S.T.; Chong-Yu, L. Computer aided injection moulding process analysis of polyvinyl alcohol–starch green biodegradable polymer compound. J. Manuf. Process. 2012, 14, 8–19. [Google Scholar] [CrossRef]
- Hakimian, E.; Sulong, A.B. Analysis of warpage and shrinkage properties of injection-molded micro gears polymer composites using numerical simulations assisted by the Taguchi method. Mater. Des. 2012, 42, 62–71. [Google Scholar] [CrossRef]
- Kamaruddin, S.; Khan, Z.A.; Foong, S. Application of Taguchi method in the optimization of injection moulding parameters for manufacturing products from plastic blend. Int. J. Eng. Technol. 2010, 2, 574. [Google Scholar] [CrossRef]
- Mandal, S.; Dey, A. PET chemistry. In Recycling of Polyethylene Terephthalate Bottles; Elsevier: Amsterdam, The Netherlands, 2019; pp. 1–22. [Google Scholar]
- Singh, A.; Banerjee, S.L.; Kumari, K.; Kundu, P.P. Recent Innovations in Chemical Recycling of Polyethylene Terephthalate Waste: A Circular Economy Approach Toward Sustainability. In Handbook of Solid Waste Management: Sustainability through Circular Economy; Springer: Cham, Switzerland, 2022; pp. 1149–1176. [Google Scholar]
- Ugoeze, K.C.; Amogu, E.O.; Oluigbo, K.E.; Nwachukwu, N. Environmental and public health impacts of plastic wastes due to healthcare and food products packages: A Review. J. Environ. Sci. Public Health 2021, 5, 1–31. [Google Scholar]
- Wang, L.; Wu, Z.; Cao, C. Technologies and fabrication of intelligent packaging for perishable products. Appl. Sci. 2019, 9, 4858. [Google Scholar] [CrossRef]
- Thiounn, T.; Smith, R.C. Advances and approaches for chemical recycling of plastic waste. J. Polym. Sci. 2020, 58, 1347–1364. [Google Scholar] [CrossRef]
- Taniguchi, I.; Yoshida, S.; Hiraga, K.; Miyamoto, K.; Kimura, Y.; Oda, K. Biodegradation of PET: Current status and application aspects. Acs Catal. 2019, 9, 4089–4105. [Google Scholar] [CrossRef]
- Matthews, M.J.; Shen, N.; Honig, J.; Bude, J.D.; Rubenchik, A.M. Phase modulation and morphological evolution associated with surface-bound particle ablation. JOSA B 2013, 30, 3233–3242. [Google Scholar] [CrossRef]
- Rubino, F.; Nisticò, A.; Tucci, F.; Carlone, P. Marine application of fiber reinforced composites: A review. J. Mar. Sci. Eng. 2020, 8, 26. [Google Scholar] [CrossRef]
- Nonato, R.C.; Bonse, B.C. A study of PP/PET composites: Factorial design, mechanical and thermal properties. Polym. Test. 2016, 56, 167–173. [Google Scholar] [CrossRef]
- Nisticò, R. Polyethylene terephthalate (PET) in the packaging industry. Polym. Test. 2020, 90, 106707. [Google Scholar] [CrossRef]
- Ellis, B.; Smith, R. Polymers: A Property Database; CRC Press: Boca Raton, FL, USA, 2008. [Google Scholar]
- Wróblewska-Krepsztul, J.; Rydzkowski, T.; Borowski, G.; Szczypiński, M.; Klepka, T.; Thakur, V.K. Recent progress in biodegradable polymers and nanocomposite-based packaging materials for sustainable environment. Int. J. Polym. Anal. Charact. 2018, 23, 383–395. [Google Scholar] [CrossRef]
- Rao, Y.; Greener, J.; Avila-Orta, C.A.; Hsiao, B.S.; Blanton, T.N. The relationship between microstructure and toughness of biaxially oriented semicrystalline polyester films. Polymer 2008, 49, 2507–2514. [Google Scholar] [CrossRef]
- Silvestre, C.; Duraccio, D.; Cimmino, S. Food packaging based on polymer nanomaterials. Prog. Polym. Sci. 2011, 36, 1766–1782. [Google Scholar]
Disclaimer/Publisher’s Note: The statements, opinions and data contained in all publications are solely those of the individual author(s) and contributor(s) and not of MDPI and/or the editor(s). MDPI and/or the editor(s) disclaim responsibility for any injury to people or property resulting from any ideas, methods, instructions or products referred to in the content. |
© 2023 by the authors. Licensee MDPI, Basel, Switzerland. This article is an open access article distributed under the terms and conditions of the Creative Commons Attribution (CC BY) license (https://creativecommons.org/licenses/by/4.0/).