1. Introduction
Climate change is unequivocal; human influence on the system is clear; GHG emissions are increasingly high because of economic and population growth [
1]. According to the International Energy Agency (IEA), the energy sector accounts for more than 80% of carbon dioxide (CO
2) emissions globally, while the electricity sector accounts for almost two-thirds of total growth [
2].
Against this background, within the framework of the Conference of the Parties (COP 21), held in Paris in 2015, several countries committed to significantly reducing their GHG emissions to keep a not increase the planet’s temperature above 2 °C [
3]. In addition, the United Nations 2030 Agenda for Sustainable Development and its Sustainable Development Goals (SDGs) call on countries to adopt urgent measures to combat climate change and its effects. Ensuring access to affordable, secure, sustainable, and modern energy is part of the SDGs and essential to eradicate poverty, protect the planet, and ensure prosperity [
4].
As part of efforts to regulate emissions of greenhouse gases and compounds, in 2012 the General Climate Change Law (GCCL) entered into force, to establish bases for Mexico to contribute to compliance with the Paris Agreement. The GCCL function is to regulate, promote, and incorporate adaptation and mitigation actions with a long-term approach, in addition to defining the obligations of the authorities and establishing institutional mechanisms to face climate change [
5].
These ambitious climate action goals were framed in the context of a reform of the Mexican energy sector. In 2013, the Energy Reform was approved to modernize and diversify the national economy [
6]. The overall objective of this reform was to provide a more sustainable, efficient, transparent, and productive energy sector, to increase the benefits obtained from the country’s resources while promoting the growth of low-carbon energy sources [
2]. These institutional changes created a new architecture for the organization of the Mexican electricity system where the public monopoly model opened private investment; specifically, the Federal Electricity Commission (FEC) ceased to have total control of the electricity sector, allowing competition in the generation and commercialization segments.
The National Electric System (NES) is a component of the energy sector that involves the generation, transmission, distribution, and commercialization of electricity. Today, the electricity industry is made up of various public and private actors involved in the process of generating electricity, although the transmission and distribution to the public consumer are activities reserved for the Mexican State. In addition, the NES is composed of four isolated electrical systems: the National Interconnected System, the Baja California Electrical System, the Baja California Sur Electrical System, and the Mulegé Electrical System. At the same time, it is composed of ten control regions, of which seven are interconnected.
In 2017, Mexico’s electricity system had an installed capacity of 75,865 MW, of which 70.5% corresponded to conventional power plants and 25.5% to power plants with clean technologies. In terms of current generation modalities, 57.2% of the installed capacity corresponds to the FEC power plants, 17.5% to Independent Energy Producers (IEP) plants, and the remaining 25.3% to private producers that contribute under self-sufficiency schemes, cogeneration, small production, export, own continuous uses, distributed generation, and non-interconnected rural systems [
7].
At the end of 2017, 329,162 GWh of electricity were generated, of which 78.9% were produced with conventional technologies and the remaining 21.1% with clean technologies. The FEC’s power plants generated 51.8% of electricity, IEP contributed 26.7% and the remaining 21.5% represents the production of individuals [
7].
Electricity generation was responsible for 25.9% of emissions nationwide [
8]; under this context, any effort to reduce emissions and mitigate climate change must include this sector. The GCCL establishes clean energy generation and greenhouse gas reduction goals to meet the Nationally Determined Contribution (NDC); this is an international commitment by Mexico to reduce greenhouse gases by 22% by 2030 from the baseline. In particular, the electricity generation sector could contribute 31% of emissions reduction.
The Mexican Energy Transition Law (ETL) establishes that participation of clean energies in the electricity generation matrix would be 35% in 2024 and 50% in 2050 so that electricity consumption would be satisfied through a portfolio of alternatives leading to a reduction in emissions. The ETL will promote energy efficiency and economic viability [
9]. Mexico has made these commitments that it will face moving towards a low-carbon economy; however, it is facing a challenging scenario that requires concrete actions.
Integrated planning of a country’s energy system is a crucial task to achieving sustainable development [
10]. The electricity system models are tools used by analysts to manage and plan the electrical system, commercialize electricity, and expand generation capacity. Modeling offers a tool to reach data-based decisions in conditions of uncertainty; however, developing countries face a lack of adequate data and a shortage of qualified human resources to perform the analysis [
11].
In this context, different investigations have addressed the energy transition and planning issues in Mexico. In 2001, Manzini et al. conducted a study to assess Mexico’s environmental future by 2025 in terms of GHG through three scenarios (oil products, natural gas, and renewable energies), using the Long-Range Energy Alternatives Planning tool. They predicted that in the scenario that prioritizes renewable energies, emissions are reduced by 32% compared to the scenario with petroleum-based fuels and 19% compared to the scenario where the use of natural gas predominates [
12].
Islas et al. carried out a cost-benefit analysis of three scenarios: base (using fuel oil), official (introducing natural gas), and transition (incorporating renewable energies). The study was carried out using varying fossil fuel prices and the evolution of investment costs due to technological change. In its conclusions, the viability of the transition scenario was ratified when the incorporation of technological changes is considered [
13].
Castrejón evaluated different technologies to mitigate GHG emissions in the NSS through two scenarios: the first one uses nuclear energy and fossil fuels with CO
2 capture and storage technologies, meanwhile, the second one uses renewable energy sources. In the first scenario, emissions were reduced, however, the risk from the use of nuclear energy and the dependence on fossil fuels must be considered. In the second scenario, an electricity sector with zero emissions and without dependence on fossil fuels was achieved, however, the large areas of land for solar and wind power plants must be contemplated, as well as the intermittency of renewable energies [
14].
Islas and Grande proposed a scenario for the NSS where renewable energies have a 57% share in the generation process in 2030, through the application of public policies for the incorporation of renewable energies [
15].
Sandoval made projections of electricity demand in the short, medium, and long term to meet energy needs and avoid future crises through Kaya’s Identity, an equation that shown the environmental impact of carbon emissions as a function of the product of population variation, Gross Domestic Product (GDP) per capita, the energy and carbon intensity [
16].
Vidal et al. proposed a methodology called the Minimum Total Mix Capacity (MTMC) to determine the optimal mix of renewable energies and fossil fuels of the NES, considering the intermittency of renewable energies and the growing demand for electrical energy. The results showed that it was possible to identify the optimal combination of biomass, wind, and solar energy to produce at least 35% of renewable energies, having a minimum total capacity to produce electricity [
17].
The International Renewable Energy Agency (IRENA) [
18] developed a global renewable energy roadmap called
REmap 2030. It demonstrated that renewable energy in the global energy mix can be doubled by 2030, realistically and cost-effectively. This study for Mexico estimated a portfolio of technological options to accelerate the deployment of renewable energy throughout the energy system. According to their results, half of the use of renewable energies will be used in the electricity sector. Wind and solar photovoltaic will account for 26% of total electricity generation in 2030.
Elizondo et al. in 2017 used the Mexico 2050 calculator to conduct an integrated assessment of energy planning and climate change mitigation in Mexico. Through four different long-term scenarios, they analyzed available options to ensure the country’s energy supply and reduce GHG emissions. The comparative evaluation showed that electricity generation from renewable energies contributes significantly to emissions reduction; although, it also highlights the importance of implementing energy efficiency and energy-saving policies [
19].
Vidal and Sheinbaum, in 2018, evaluated four optimal scenarios for the integration of renewable energies for electricity generation in Mexico for each target year to supply renewable energy to the total demand: 35% in 2024, 40% in 2030, and 50% to 75% in 2050. They also examined possible excess electricity production. Through the Energy PLAN model and the methodology of lower total capacity, a solution was obtained for each target year, it was also possible to know the capacity of combined cycles so that the system was self-sufficient [
20].
Sarmiento et al. [
21] used numerical techno-economic modeling to analyze the impact of national objectives of inclusion of renewable energies and climate change on the costs and structure of the Mexican energy system. They considered four scenarios by 2050: base, national targets, climate goals, and one hundred percent renewables. The results showed that the national objectives set are insufficient, so the goal for the incorporation of clean energy in electricity generation should increase to 80% by 2050.
Banacloche et al. [
22] evaluate the socio-economic and environmental impacts of green investments related to the deployment of renewable energy sources planned by the Government of Mexico and those proposed by IRENA. The objective is to achieve the country’s commitments to the Paris Agreement for the period 2018–2030 in terms of value aggregate, employment, materials, land use, water, and CO
2eq emissions. They emphasize that Mexico’s renewable energy policies on the road to Paris have less ambition than IRENA’s proposal. While the country has the political will to enact climate policies, the government’s structure is weak and the capacity to implement and enforce them is lacking. The authors conclude that to achieve the Paris Agreement, an increase in the deployment of renewable energy sources is a requirement.
Percino-Picazo et al. [
23] presented a comparative analysis of the energy reform that had been carried out in Mexico since 2013. They establish two periods to be evaluated, the reform progress period from 2013 to 2018 and the reform reversal period from 2018 to 2021. This research applies the textbook model for the restructuring of energy systems that have shown success stories in developing countries. They concluded that the reform included practices well accepted by the wholesale electricity markets, however, after five years, the reform was not mature enough, and a counter-reform was initiated by the energy sector at the time when the new administration started the actions.
Buira et al. [
24] use the deep decarbonization methodology to develop two analytical scenarios of economic development, service demand, technology deployment, and GHG emissions for Mexico up to 2050. In the first scenario, they analyze current policies, and in the second scenario, they aligned decarbonization pathways to comply with the Paris Agreement. With the first scenario, they conclude that Mexico’s current climate change policy places the country on an inconsistent development path, emphasizing the importance of investing in the electricity market to expand the generation capacity with renewable energies and quickly implement fleets of electric vehicles to meet the decarbonization goal.
This work shows, with specialized software (Low Emission Analysis Platform) LEAP, the calculation of six scenarios from data from 2013 to 2017 for the Mexican Electricity Sector. The analysis also shows two proposed National average electricity consumption for the population based on historic data and three probable population growths; these were never analyzed as the base for evaluation of the Energy Transition Law in 2050 as a function of minimum operation cost.
2. Materials and Methods
Due to the current situation, there is a need for a tool to allow flexible assessment of the evolution of the NES. The proposed Energy Model of the National Electric System for 2050 (NES-50) is structured in the Low Emissions Analysis Platform (
LEAP) program, a computational tool that allows the evaluation of various scenarios of energy policy, economic development, population growth, technological progress, and impact of GHG emissions [
25].
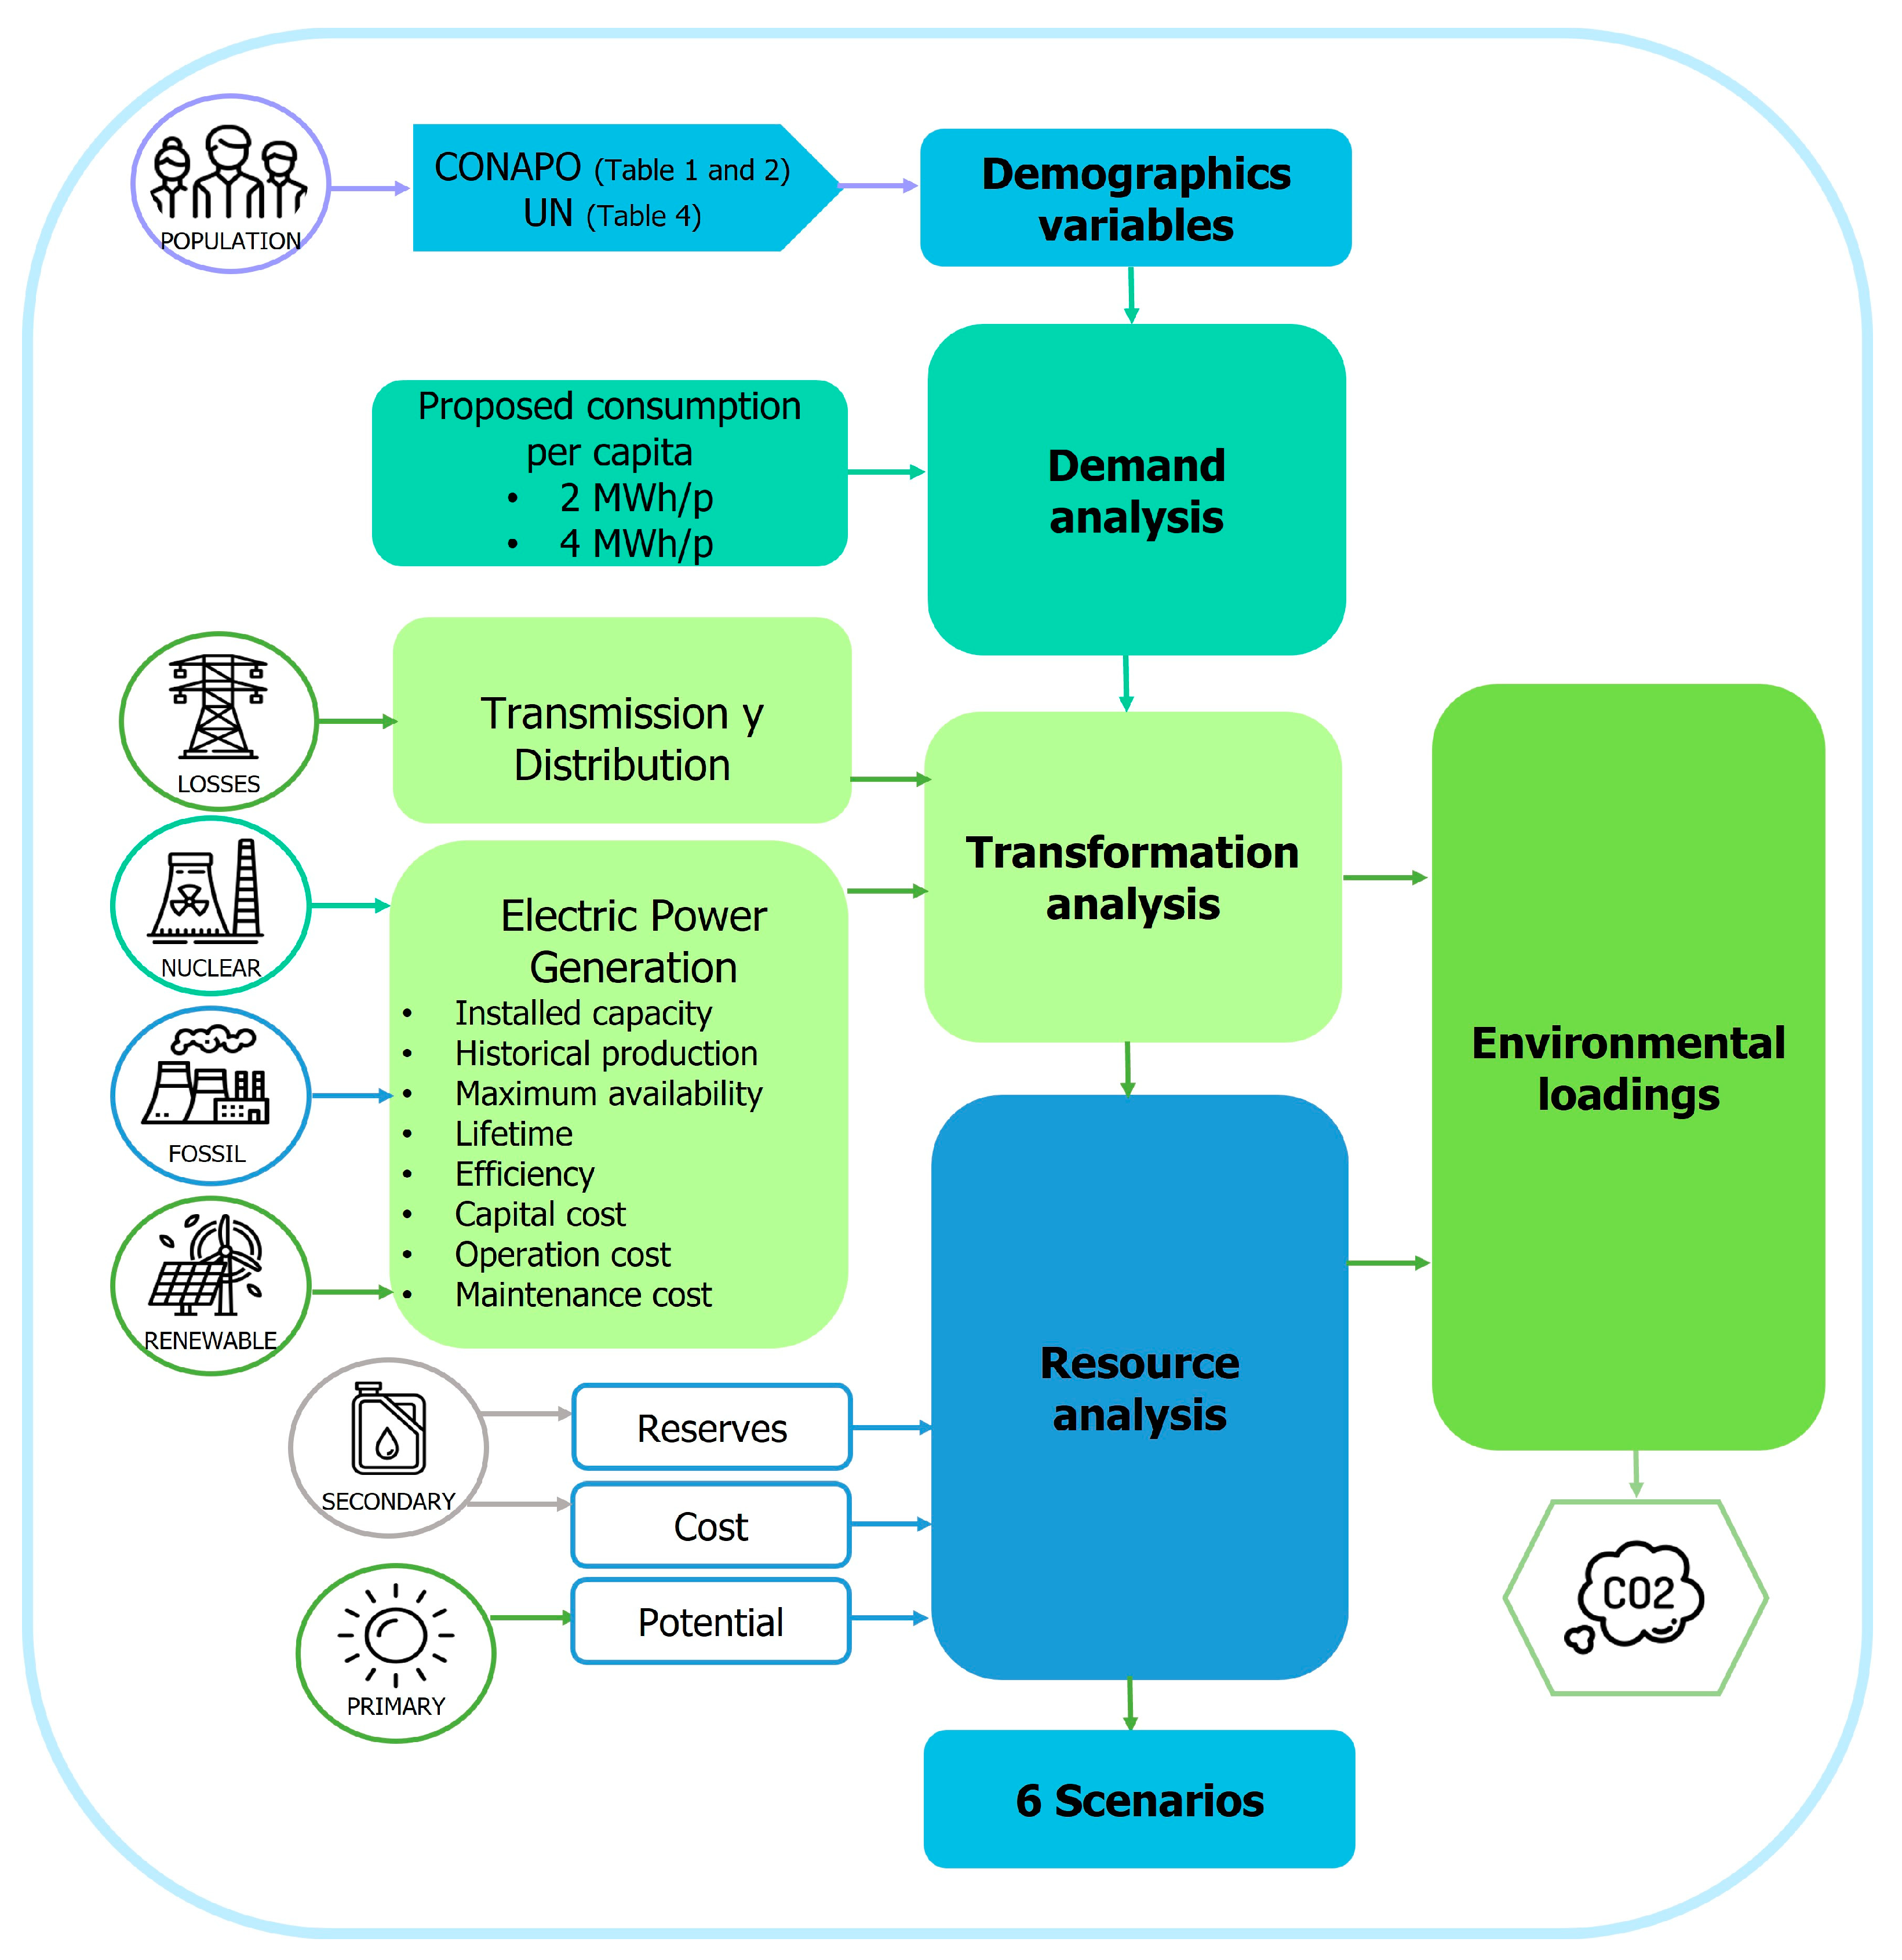
The NES-50 model represents the Mexican electricity system; its structure is formed by four main modules: demographic variables, demand analysis, transformation analysis, and resources analysis, as shown in
Figure 1. The model operates from the year 2018 to the year 2050; it includes a historical period with statistical data from 2013 to 2017 allowing the model to be calibrated because there is information available from official documents.
The model considers the demand for electricity in different economic sectors: residential, agricultural, industrial, services, and commerce; most energy system modeling studies use socioeconomic indicators to describe demand behavior. In the reference scenario or Stated Policies Scenario (STEPS), mid-year population growth is used as a function of determining future electricity demand. The demographic variable is defined as the number of inhabitants (
Table 1) and its projection until 2050 (
Table 2) in agreement with the National Population Council (
CONAPO) [
26].
The analysis of demand is carried out using a disaggregated method, based on final consumption. For this study, electricity demand is defined in terms of population models, and the per capita consumption is considered an indicator to know the evolution of electricity consumption. The final electricity consumption reported by the Program for the Development of the National Electric System (
PRODESEN) [
7] and the total population [
26] is considered to be the historical consumption in kilowatt-hours per person (kWh/p) (
Table 3).
In the transformation analysis, losses in transmission and distribution processes are considered. The process of electricity generation is composed of 13 technologies simulating the existing energy production and characterized according to fuel, process efficiency, lifetime, capacity factor, investment or capital costs, fixed operating and maintenance costs, and variable operating and maintenance costs [
7]. The process efficiency indicator for renewable technologies is 100% always in
LEAP, since by convention it is assumed that these plants have a complete transformation because the resource is unlimited and does not cost to process [
27]. The historical information on the installed capacity and production of electricity by type of technology is considered according to reported from
PRODESEN [
7] and prospects of the electricity sector published annually [
28].
Scenario Proposal
The NES-50 model considers population growth to determine electricity demand, so official estimates of World Population Prospects of the United Nations (UN) were used (
Table 4), based on probabilistic projections of fertility, mortality, and migration. The UN methodology for estimating population and its prospects presents a model of Low Variability of Fertility (LVF) and another model of Constant Variability of Fertility (CVF) [
29].
Two per capita consumption scenarios are considered: the first with a value of 2.0 MWh, based on the average consumption from 2000 to 2015 in Mexico, and the second with a value of 4.0 MWh, considering the consumption of some developed countries during 2015 according to data reported by the IEA.
The NES-50 model does not consider the contribution of technologies such as distributed generation, regenerative brakes, and projects of the “
Fideicomiso de Riesgo Compartido” [
7]. In terms of current generation modalities, the participation of generation plants owned by the FEC, IEP plants, and the contribution of private producers is considered. According to
PRODESEN issued by
SENER in 2018, electricity generation technologies were considered, which in turn are classified as fossil and clean, according to the fuel used.
3. Results and Discussion
According to the selected population models, the CONAPO estimates the population in Mexico will be 148.13 million inhabitants in 2050. For its part, the UN’s world population projections under the LVF scenario estimate that by 2050 the population will be 134.12 million people, while the CVF scenario calculates 180.78 million inhabitants.
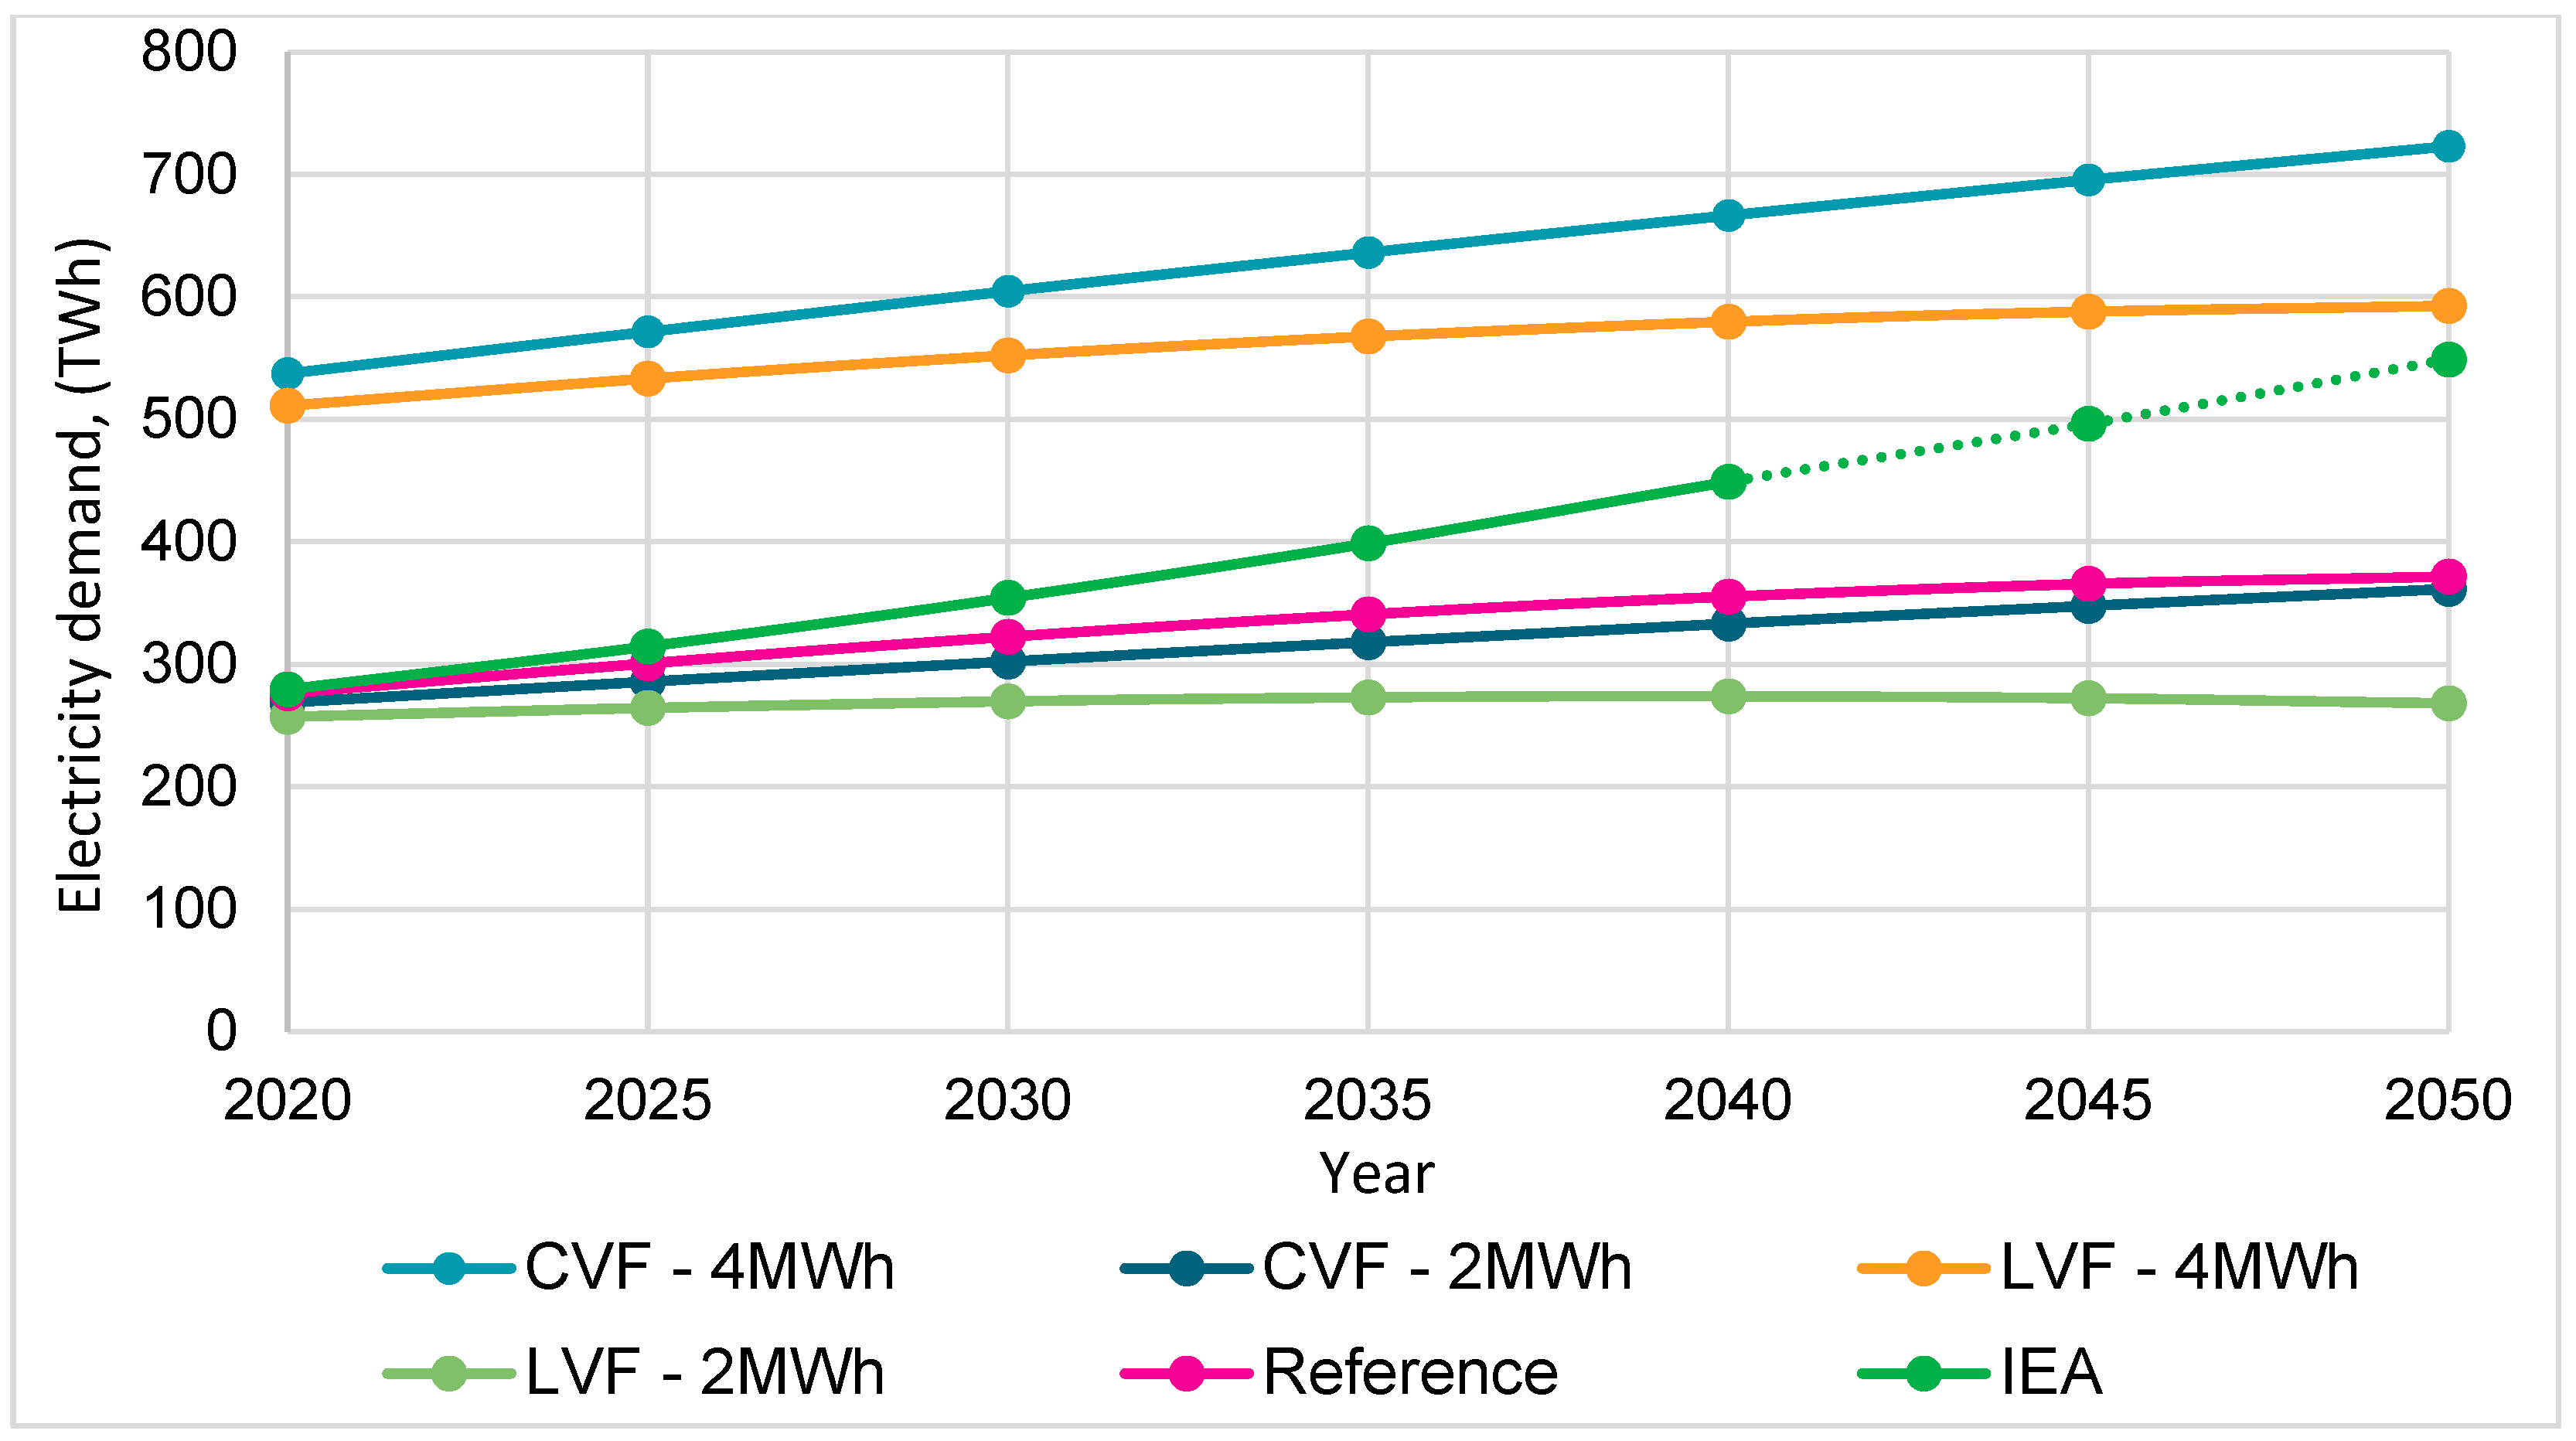
According to the population models of the
CONAPO and the UN with per capita consumption taken from the IEA, it was possible to estimate the expected electricity demand for the year 2050 as shown in
Figure 2. This scenario presents the highest growth in CVF-4 MWh demand due to constant population growth and high per capita consumption, while the lowest growth is presented by the LVF-2.0 MWh scenario. Electricity demand in Mexico will grow at an annual rate of 2.4% reaching 459 TWh in 2040 according to the IEA [
2]. It can be inferred that the IEA projection is within the range of the expected demands of the NES-50 model.
3.1. Reference Scenario
The reference scenario or STEPS is calculated with the
PRODESEN 2018–2032 government plans for the retirement by end of useful lifetime and installation of power plants, it considers
CONAPO´s data population projections, and it also estimates the electricity consumption value per capita based on information reported by
SENER [
7]. As a result of electricity system expected growth, the total capacity will be 130 GW in 2032 when considering the annual evolution of the additions and withdrawals of the generating units that comprise the NES. The retirement of 11 GW is scheduled for the period 2018–2032, and the retirement of conventional thermoelectric plants is foreseen mainly, as the
PRODESEN said. Due to the installation of new power plants, it is expected to be a cumulative 66 GW. Combined cycles, as well as wind power plants, predominate in electricity generation infrastructure as shown in
Figure 3. The accumulated investment cost, operation cost, and maintenance cost for 2032 will be USD 167 041 million [
7].
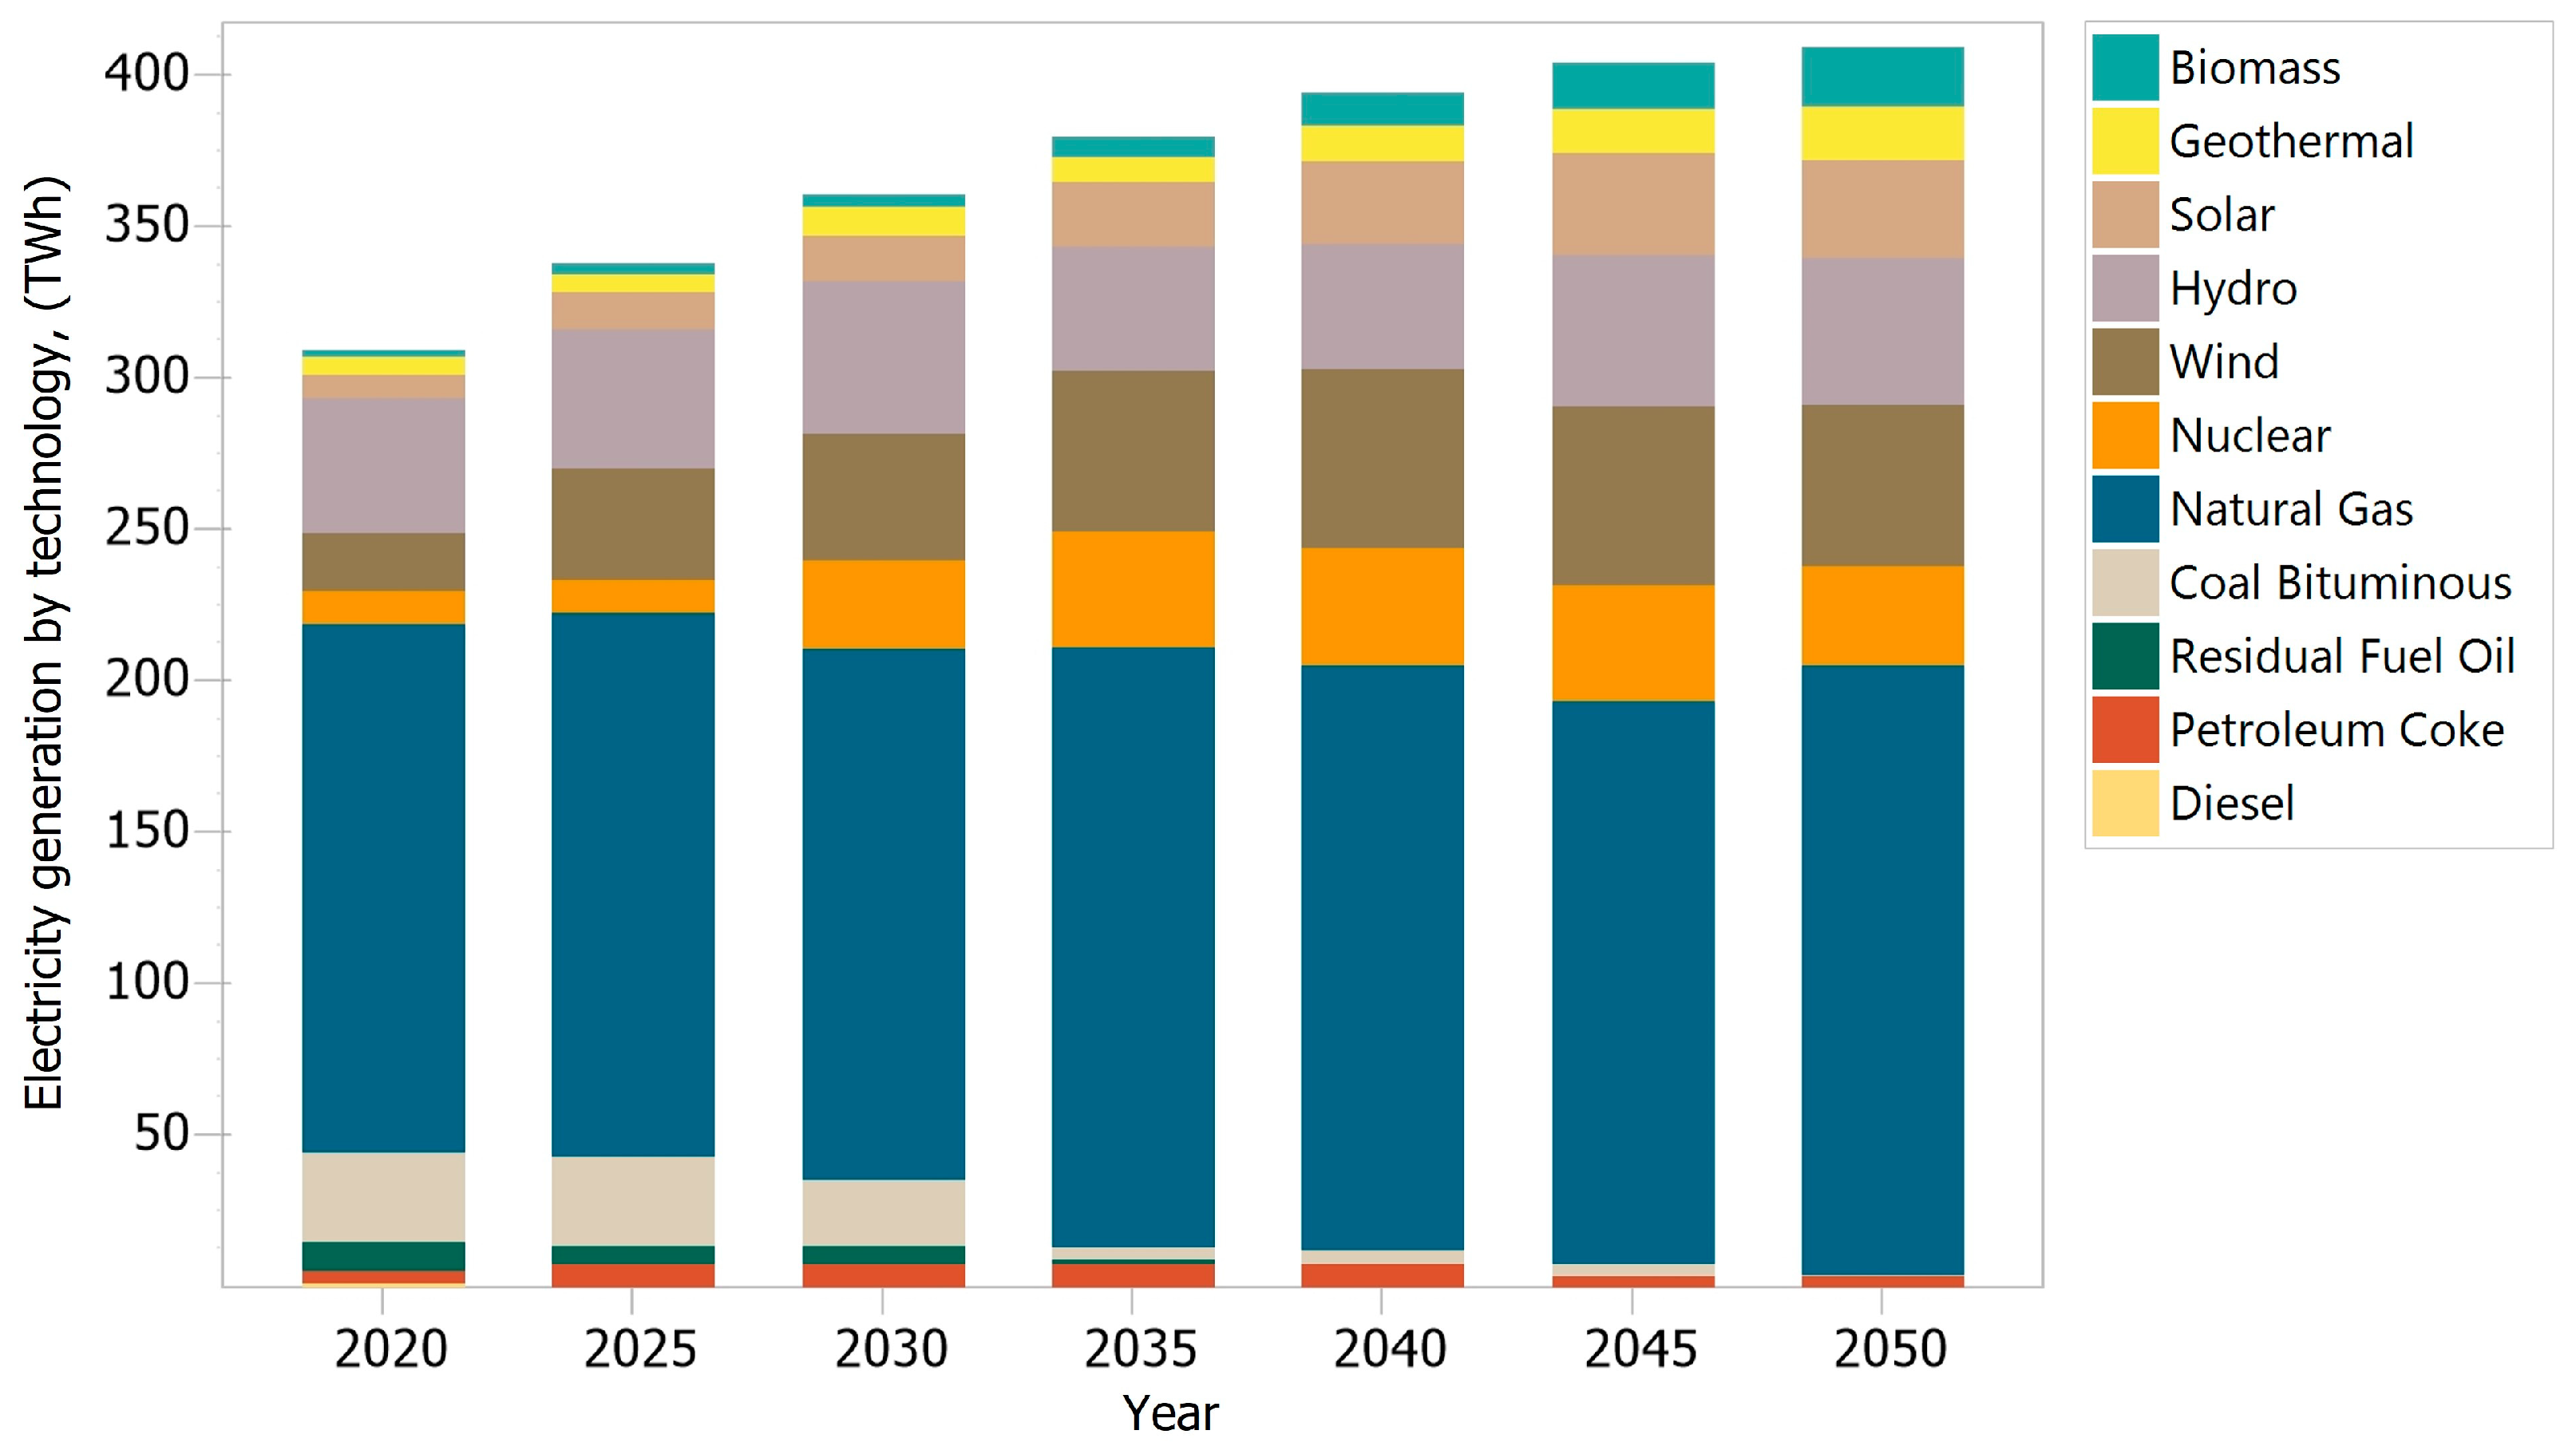
Figure 4 shows that the matrix for electricity generation is gradually decarbonized. The share of electricity generation, based on clean energy, increases from 21.89% to 49.79% in the 2018–2050 planning horizon, under the STEPS scenario to increase the use of clean energy, while generation from fossil energy sources represents 50.22%. Electricity generation increases from 329 TWh in 2017 to a much more diverse portfolio of 409 TWh in 2050.
Among the different renewable technologies, wind power plants are the ones that contribute the most to electricity generation, with 12.99% in 2050. The increase in hydroelectric energy is much slower, however, it contributes 11.80% to electricity production. Solar PV is growing rapidly, generating 7.90% by the end of the period. Bioenergy has a 4.70% share, while geothermal fields contribute 4.34%. The addition of new nuclear units increases the portion of this technology with a contribution of 8.05%.
Natural gas remains the dominant energy source, accounting for around 49.21% of the total electricity generation at the end of the projection period, meanwhile the contribution of coal and petroleum derivatives decreases considerably. At the end of the analyzed period, plants that use petroleum coke contribute 0.84%, and coal-fired plants have a minimum participation of 0.17%.
With the Mexican Energy Reform [
6], the market opening of the electricity sector made it possible to conclude contracts with individuals for electricity generation, which has been fundamental to diversifying the electricity generation matrix. Another important factor is that prices of renewable energies have decreased significantly in recent years [
7], and they have become competitive against conventional sources of electricity generation. The
LEAP calculated total cost for operation, maintenance, and investment in 2050 is USD
2017 552,914 million.
3.2. LVF-2.0 MWh
Electricity generation for the LVF-2.0 MWh scenario can be appreciated in
Figure 5. It shows that electricity demand decreases from the reported 329 TWh in 2017 to the calculated 295 TWh in 2050 due to low population growth and low per capita consumption.
As renewable energy capacity grows, the generation matrix in Mexico becomes increasingly diverse and less dependent on fossil fuels. The share of fossil fuel based electricity generation accounts for 50.48% in 2050, with the share of natural gas being the highest proportion: it contributes 49.09% of total production. Conversely, petroleum coke and coal contribute 1.16% and 0.23%, respectively. While the share of coal and oil declines, clean energy plays an increasingly important role in the electricity generation matrix; electricity production from clean energy sources is 49.52% in 2050. The contribution of wind energy is 13.44%, while hydroelectric plants contribute 11.84%, nuclear power plants 11.15%, solar parks 7.34%, geothermal fields 3.96%, and bioenergy contributes 1.78% to cover the demand for electricity by 2050. Nuclear goes from 10.88 TWh in 2017 to 32.89 TWh in 2050 that represents a 3.02 factor of power increase without CO2e emissions. The total cost for operation and investment for 2050 is USD2017 521 126 million.
3.3. LVF-4 MWh
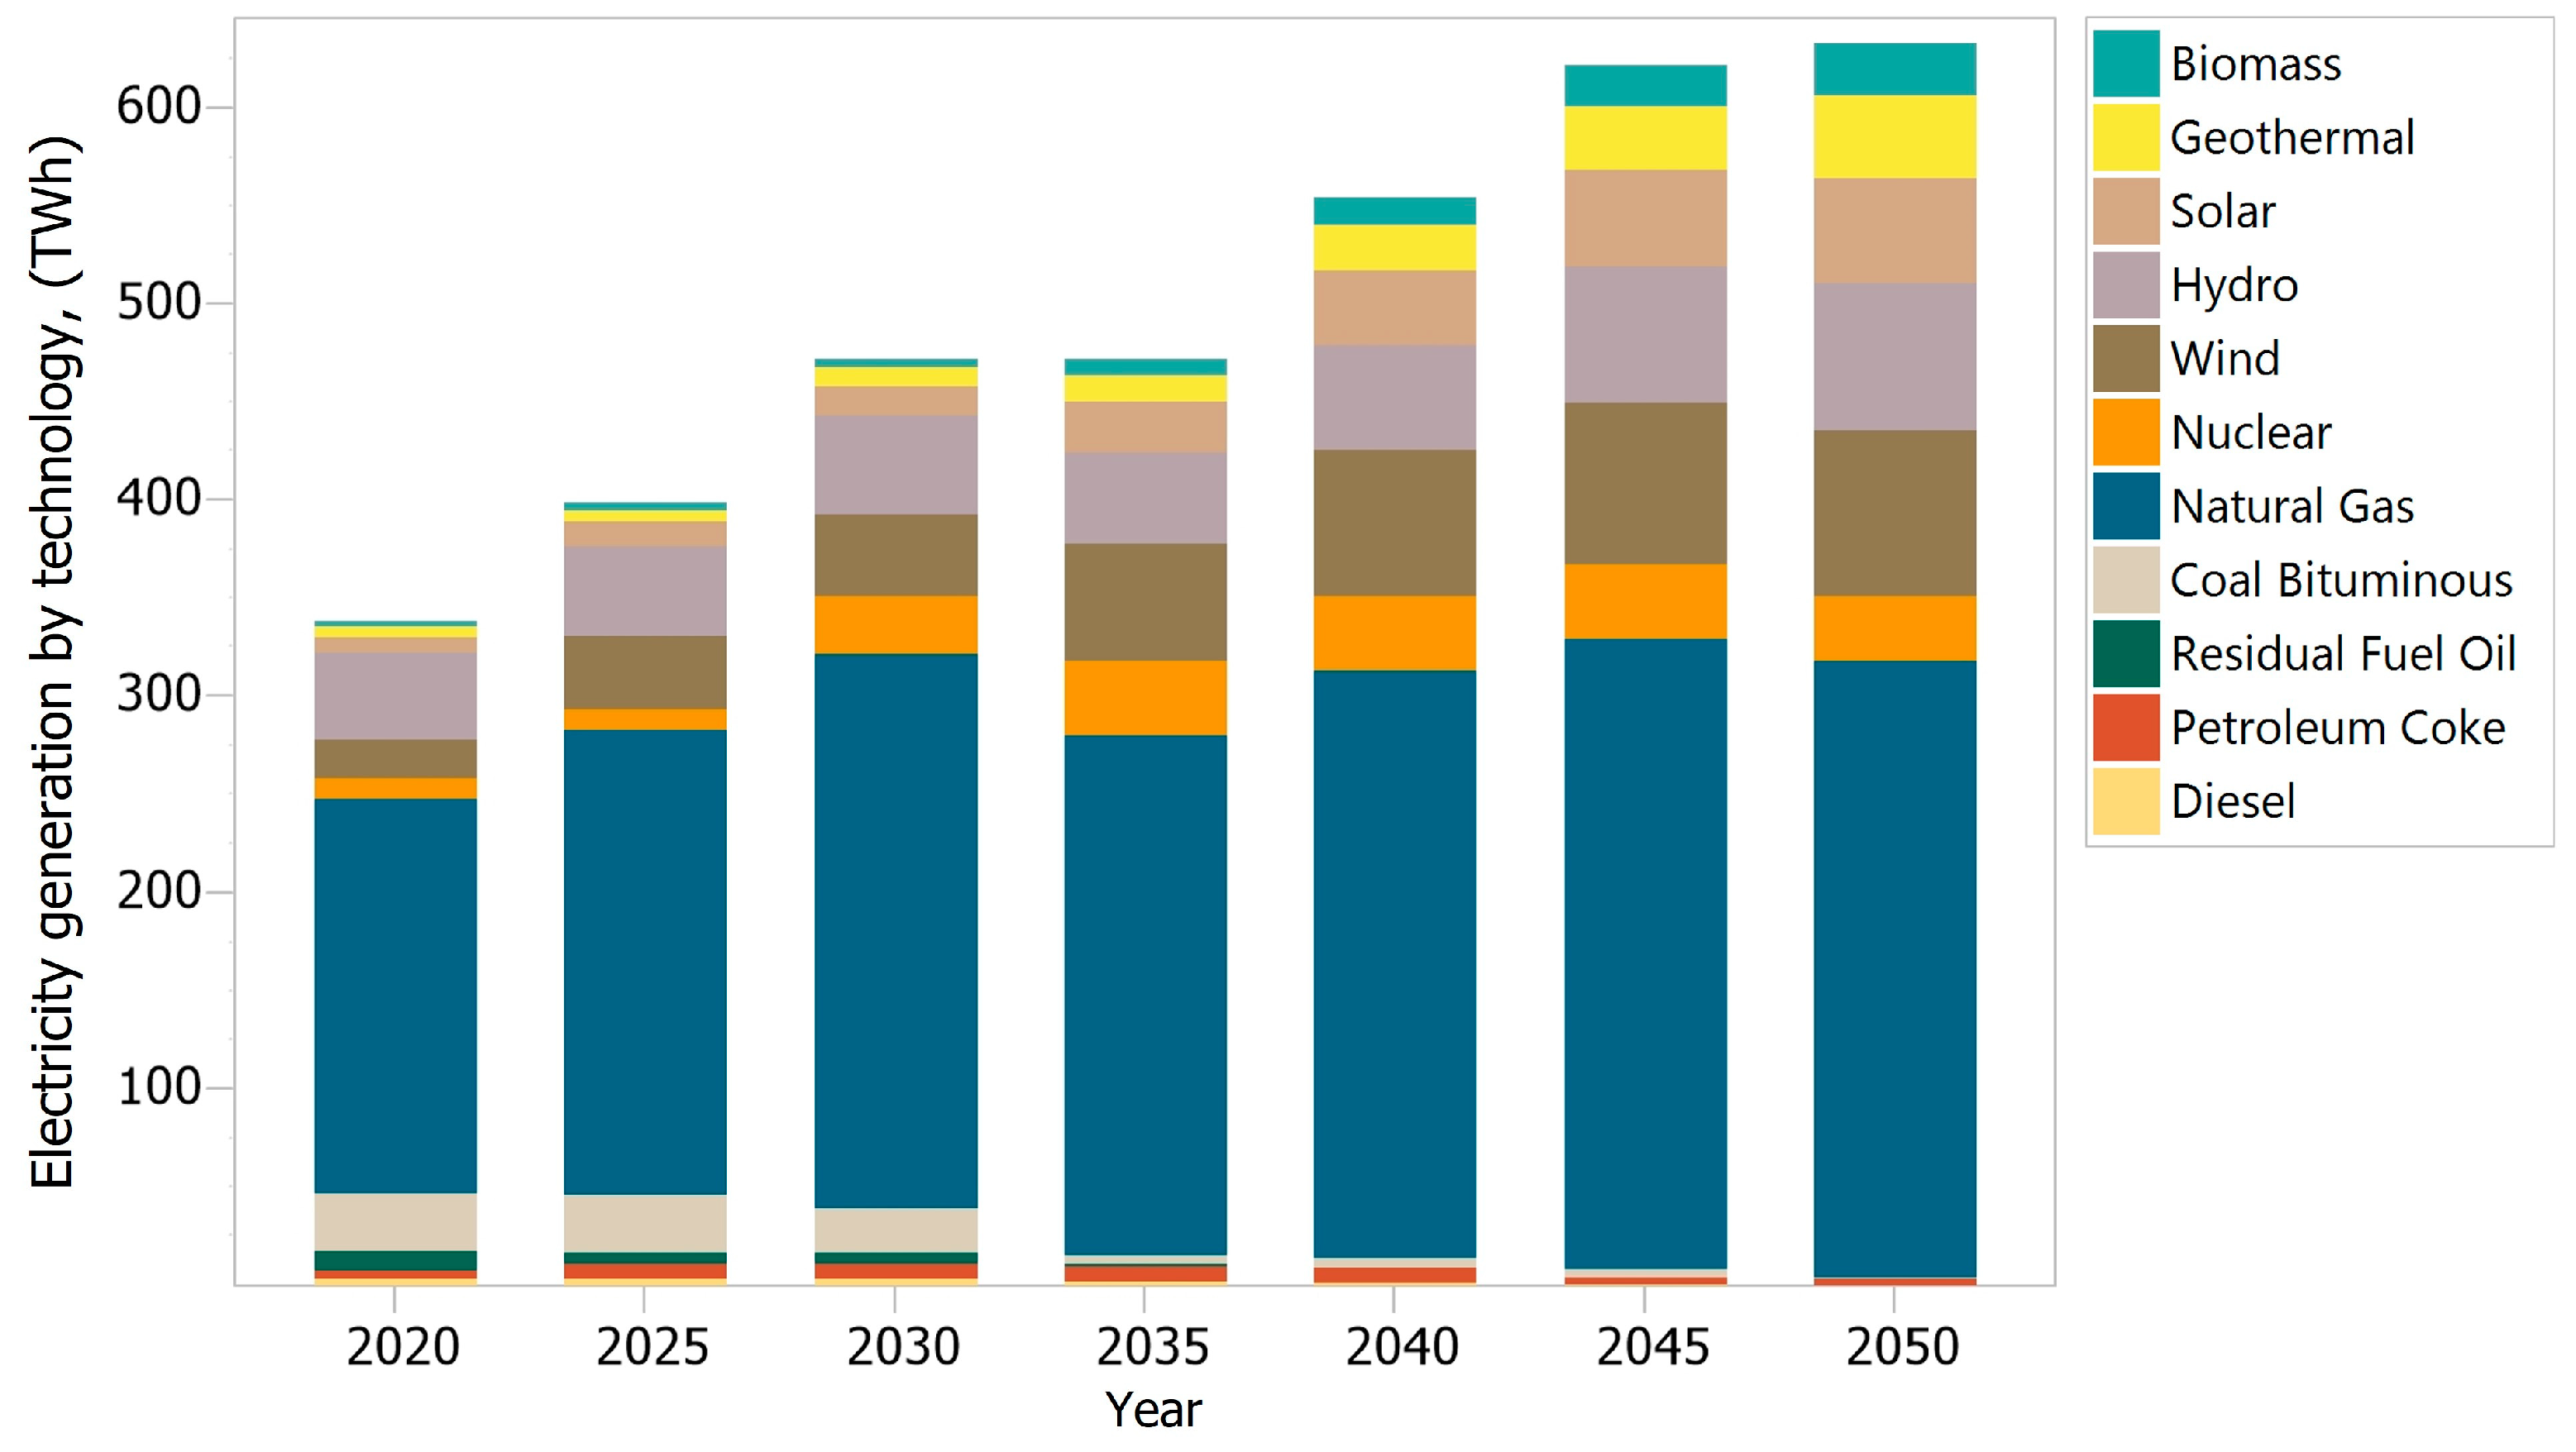
Considering the conditions of the LVF-4.0 MWh scenario, where population growth will be low, while per capita electricity consumption is high, reflecting two counteracting trends. Electricity production increased from 329 TWh in 2017 to 633 TWh in 2050 as shown in
Figure 6. The share of fossil fuels for electricity generation is 50.31%, while clean energy sources contribute 49.69% of the national production in 2050. The combined cycles based on natural gas dominate the generation matrix with 49.63%; on the other hand, with the withdrawal of conventional plants and promotion of clean energies, the share of petroleum coke is 0.54%, coal is 0.11%, and diesel 0.02%.
The energy from wind farms represents 13.38%, hydroelectric plants contribute 11.84%, photovoltaic plants 8.48%, geothermal energy 6.65%, nuclear power plants 5.21%, and biofuels 4.14% to meet demand by 2050.
In this scenario, a growing population creates a bigger dependence on electricity and natural gas is the constant source of electricity generation, close to 314.15 TWh. LEAP calculated total cost in 2050 would be USD2017 878 082 million.
3.4. CVF-2.0 MWh
The estimated electricity production for 2050 will be equivalent to 398 TWh in the scenario of constant population growth and low consumption as shown in
Figure 7. The electricity matrix will be integrated by 50.49% of conventional energies and 49.51% of clean energies in 2050. In the CVF-2.0 MWh scenario, the share of natural gas represents 49.45%, petroleum coke 0.86%, and coal 0.17% of the total generation by 2050.
Due to the trend shift towards a more sustainable electric generation model by 2050, investment in clean energy is notorious. The technology with the highest generation is wind energy at 13.36%, hydropower has a contribution of 10.46%, nuclear energy at 8.28%, followed by solar at 8.12%, geothermal at 4.46%, and bioenergy at 4.83%, to cover electricity demand by 2050.
This scenario achieves the goal of half generation with clean energy fuels with 67.68 Mt CO2e with the operation, maintenance, and investment cost of USD2017 580 439 million.
3.5. CVF-4.0 MWh
In the scenario of constant population growth and high per capita electricity consumption, the electricity transformation has a high growth rate, going from 329 TWh in 2017 to 688 TWh in 2050 as shown in
Figure 8. In the CVF-4.0 MWh scenario, the share of natural gas represents 50.55%, petroleum coke 0.50%, coal 0.10%, and diesel 0.05% of the total generation by 2050. The potential of renewable resources in Mexico allows the rapid growth of clean energies; the technology with the highest generation is by wind energy at 14.26%, hydropower has a contribution of 10.89%, the third contributor is solar energy at 8.96%, geothermal with 6.11%, nuclear energy 4.79%, and bioenergy 3.81% to cover all electricity demand by 2050.
The higher per capita electricity consumption leads to a non-desirable scenario because the CO2e is almost twice as high compared to the LVF-2.0 MWh scenario. With the highest cost of operation and investment of USD2017 996,988 million by 2050.
The IEA forecasts that the installed capacity for electricity generation in Mexico will be 161 GW in 2040 as shown in
Figure 9. It has also an assessment of electricity generation: its results show that to meet demand it will be necessary to produce 518 TWh in 2040 as shown in
Figure 10.
When analyzing the results of the NES-50 model and making a comparison with the IEA´s model, it was estimated that the values are closed for both scenarios with a per capita electricity consumption of 4.0 MWh and the LVF population model for this research. The 688 TWh for predicted consumption in 2050 is higher than the IEA´s scenario and the NES would not be able to provide.
Based on the emissions analysis, the baseline of the annual report on GHG mitigation potential in the electricity sector [
31], an exercise to project Mexico’s future GHG emissions, was considered. In
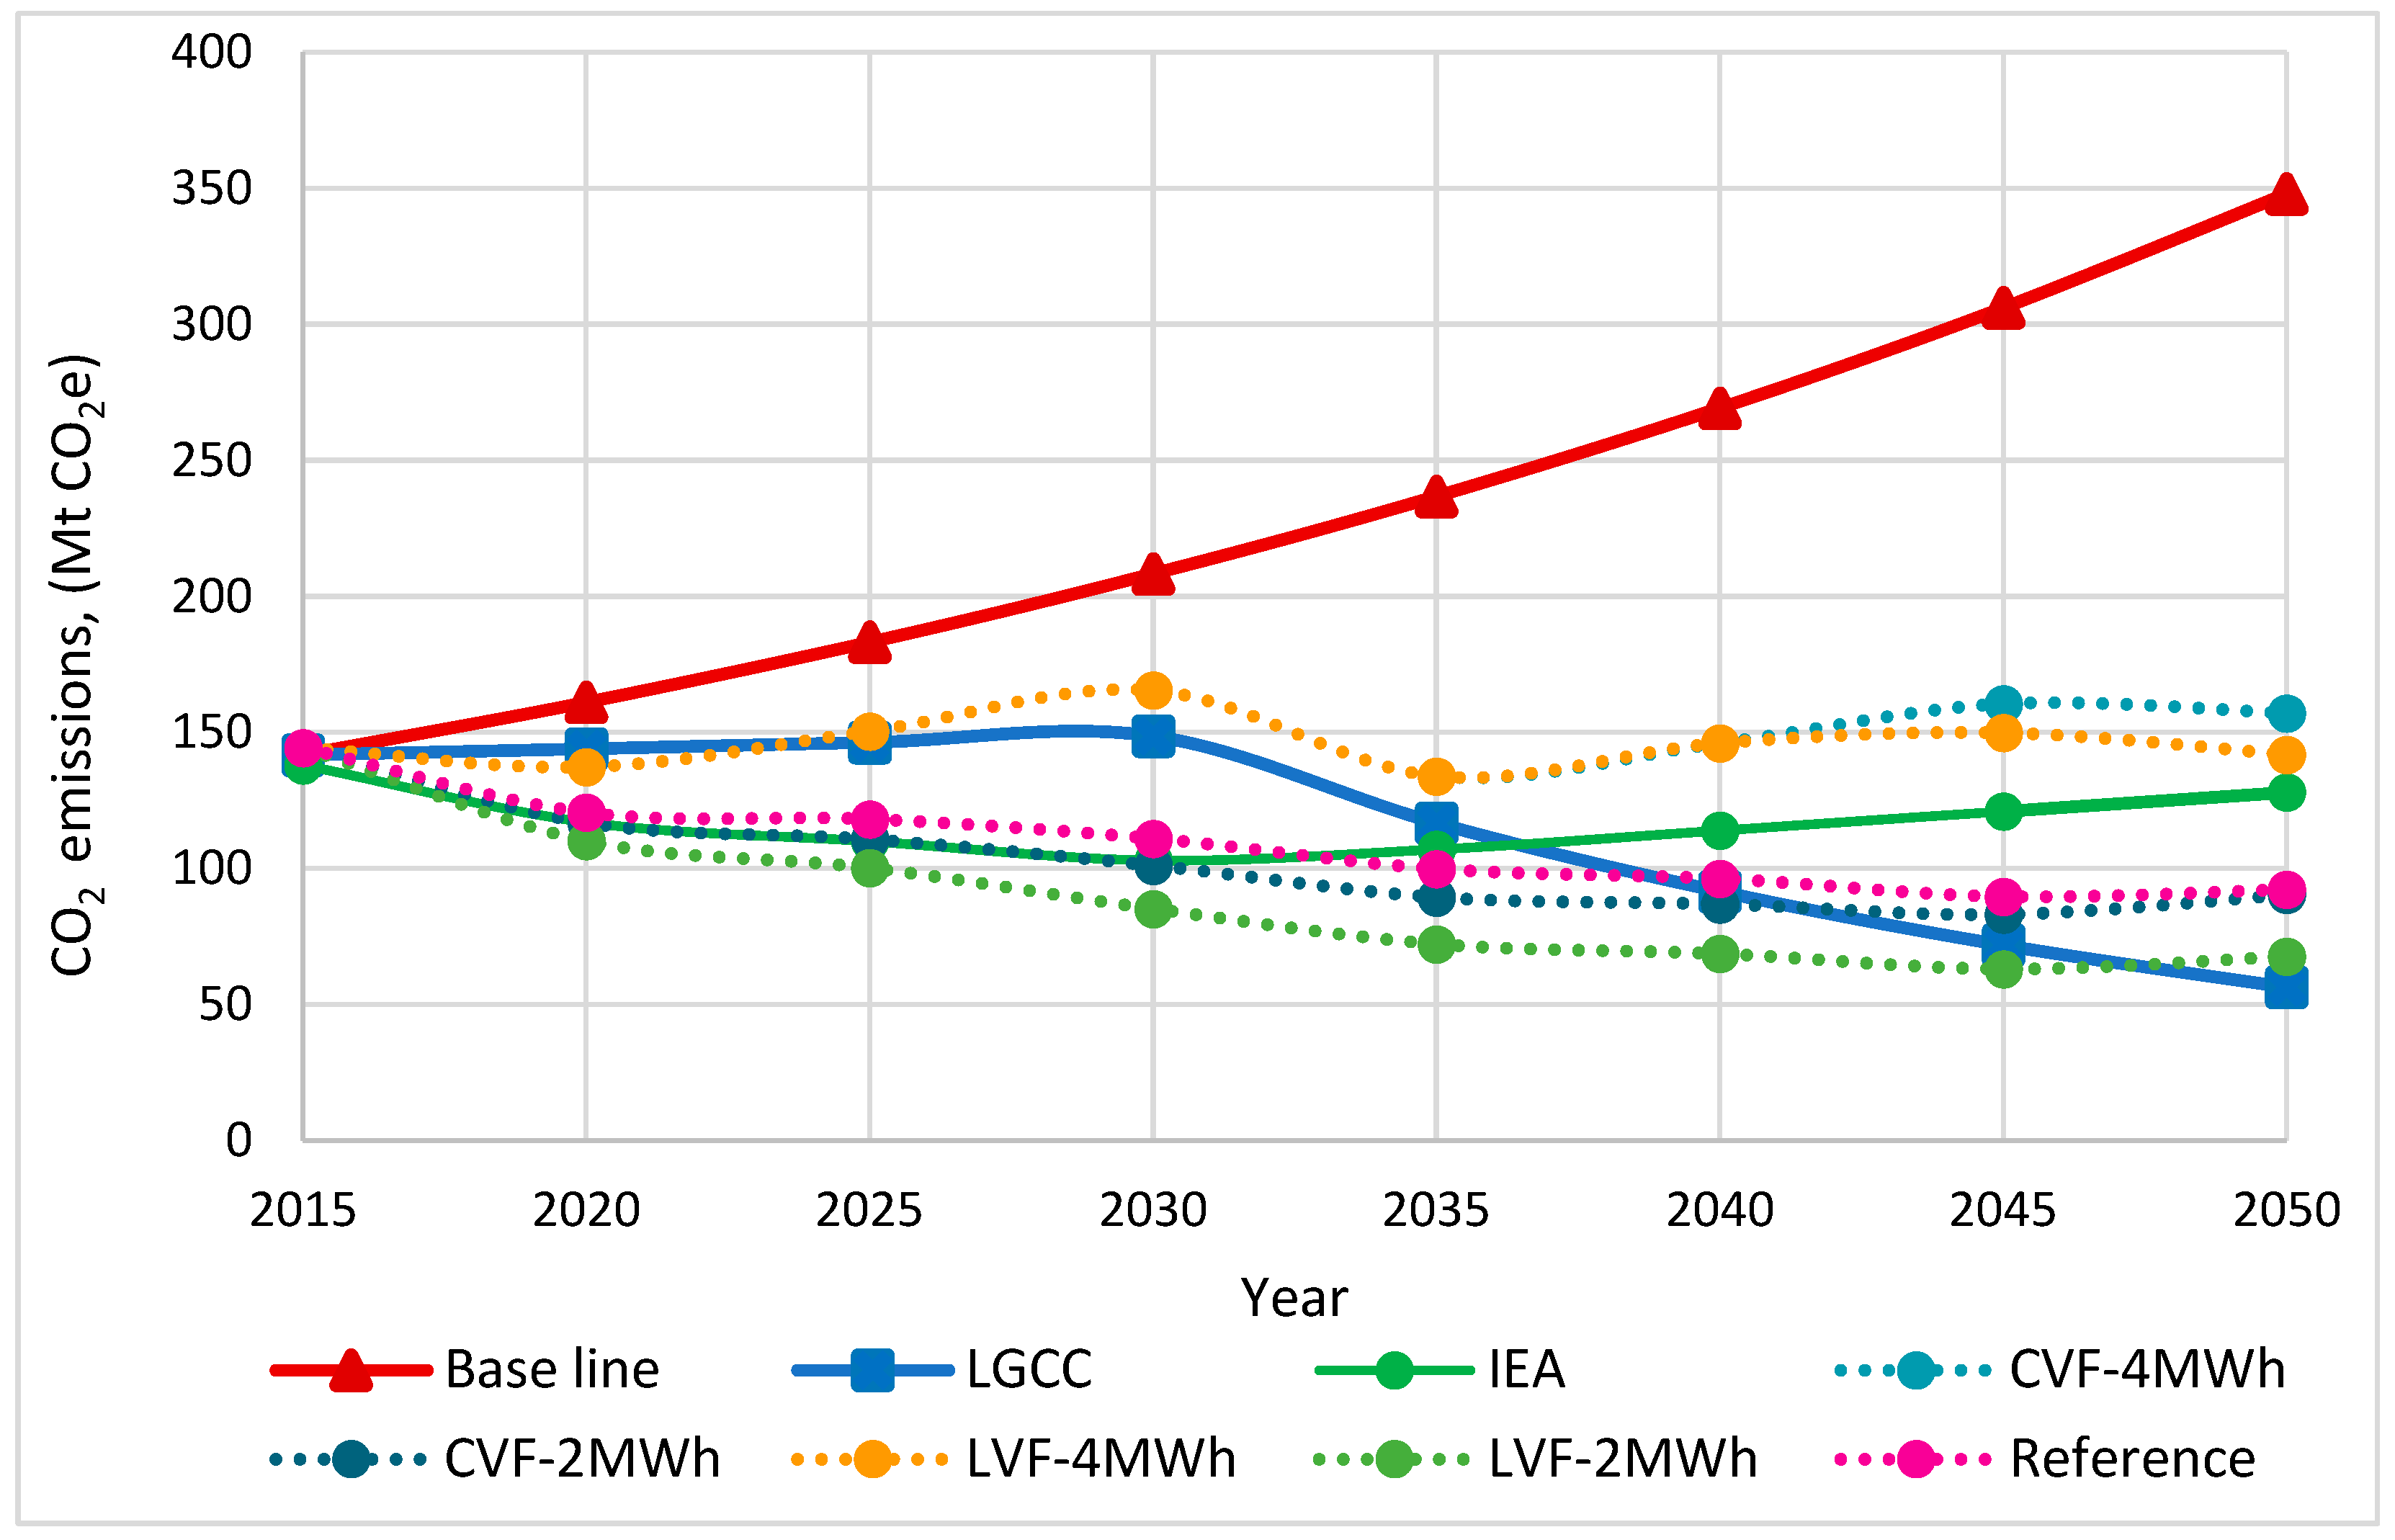
Figure 11, the baseline scenario is a reasonable emissions projection that would occur in the absence of climate change mitigation actions. Its objective is to serve as a basis for the identification of reducing the emissions potential at a national level, for the initiative’s design that allows capturing this power to the abatement, and for the evaluation of the actions undertaken in this context.
According to the GCCL, mitigation actions seek to transform the electricity matrix, increase participation in clean technologies, and use fossil resources more efficiently. In
Figure 11, the GCCL scenario reflects compliance with GHG reduction targets of 30% by 2030 and 50% by 2050.
It is important to mention that according to the NES-50 model, the scenario with the highest mitigation GHG emissions was the LVF-2.0 MWh scenario in which the mitigation reduction was 280.34 Mt of CO₂e, followed by the CVF-2.0 MWh with a decrement of 257.63 Mt of CO₂e, while the highest consumption scenarios (4.0 MWh/per capita) only managed to reduce 190.97 Mt of CO₂e with constant population growth and 206.15 Mt CO₂e with low population growth.
The CO
2e minimal scenario where 49.09% electricity production by gas natural in Mexico has a bigger value than calculated values for the global scenario in 2050, close to 15.25% [
32]; even for the North American zone the percentage values are quite different: Canada 8.42% from natural gas [
33] and USA 34.00% from natural gas [
34].
4. Conclusions
The proposed LEAP model defines energy scenarios integrated by an optimal matrix based on the cost of electricity generation, which matches the Mexican electricity demand as a function of time. In each of the six analyzed scenarios, it was possible to estimate the expected electricity energy demand and generation from 2020 to 2050, depending on population growth as an indicator of the evolution of electricity consumption and two electricity scenarios for per capita consumption.
In the compared scenarios, it is observed that the clean technology with the highest growth is wind energy, which contributes between 12.99% (reference or STEPS scenario) and 14.26% (CVF-4.0 MWh). Hydroelectric power plants remain in the second position of electricity generation, due to their long technical lifetime and their maximum availability compared to renewable energies.
Solar PV and wind technologies have had rapid growth in capacity additions during the period to achieve Mexican long-term goals for electricity generation from clean energy sources. Solar’s generation would be 7.34% for LVF-2.0 MWh or 8.96% for CVF-4.0 MWh.
Fossil fuel technologies mainly combined cycle plants of those with important participation in the scenarios evaluated: their participation ranges from 49.09% to 50.55% for actual infrastructure and costs. Nuclear power plants represent 4.79% of higher electricity demand in 2050 and 11.15% for the STEPS scenario due to the new operation of three projects proposed by the PRODESEN, while hydroelectric plants diminish relative to their participation because of their exit from operation due to their technical lifetime.
From the analysis of emissions, the LVF-2.0 MWh scenario is successful for CO2e reduction and presents a greater reduction in yearly emissions of 67.68 Mt de CO2e approaching the scenario proposed in the GCCL, while the CVF-4.0 MWh is the one that presents the highest yearly emissions with 157.05 Mt de CO2e in 2050. These emissions are due to the growth in population and growth in per capita high electricity consumption.
The next work will analyze the COVID-19 energy consumption and the Ukraine crisis energy drivers for new scenarios in 2050.


 ,
, 


