Article

Experimental and Numerical Analysis of Flow Force Acting on the Spool of Proportional Directional Valve

Department of Hydromechanics and Hydraulic Equipment, Faculty of Mechanical Engineering, VSB-Technical University of Ostrava, 17. Listopadu 2172/15, 708 00 Ostrava, Czech Republic
*
Author to whom correspondence should be addressed.
Processes 2023, 11(12), 3415; https://doi.org/10.3390/pr11123415
Submission received: 16 November 2023 / Revised: 7 December 2023 / Accepted: 11 December 2023 / Published: 13 December 2023

Abstract

:
This paper deals with the experimental and numerical analysis of the flow force acting on the spool of a proportional directional valve. The flow force arises due to the fluid flow through the flow path of the proportional directional valve and significantly influences the dynamics of the valve spool. The valve under investigation is a three-position four-way proportional directional valve with zero spool lap and feedback from the spool position. The dependence of the valve spool flow force on the volumetric flow rate is measured as part of the experiment. The measurements are performed for different spool displacements. The measured data will be used to verify the numerical simulations. The proportional directional valve was modified so that a force sensor could be included on the spool axis to realize the experiment. Firstly, the flow force is measured as the fluid passes through the two flow paths of the valve (PB and AT). Subsequently, the experimental setup is modified to determine the flow force when the fluid passes through each flow path separately. The measurements are compared. Simulations of the flow through the proportional directional valve are performed using Ansys Fluent 2022 R2 software to determine the flow forces acting on the valve spool. Simulations are performed for the selected spool positions of the proportional directional valve. Finally, the results of the simulation and the experiment are compared. The contribution of this study is a CFD model of the flow paths of the proportional directional valve verified by experiment. The CFD model will allow the flow force analysis for different flow path geometries of the investigated valve. Experimental analysis of flow force is performed over the entire spool stroke at different volumetric flow rates. The flow forces are measured for each flow path separately and for both flow paths simultaneously.

Graphical Abstract

1. Introduction

Nowadays, proportional directional valves are frequently used components in hydraulic systems of industrial hydraulics where the application requires continuous control of the magnitude and direction of the flow [1,2]. Continuous control of the magnitude and direction of fluid flow is an important part of various applications, e.g., process technology and energy systems. Motivation to reduce energy consumption and improve the dynamics of hydraulic actuators is being addressed in many applications now [3,4]. For this reason, it is necessary to focus attention on possible innovations in proportional directional valve designs that can improve the control characteristics and stability of the entire hydraulic system. In terms of design, spool valves are the most used to control the direction and magnitude of flow [5]. Various hydraulic applications operate under different operating conditions, so it is necessary to design the appropriate proportional directional valve for each application. Knowledge of the individual forces affecting the movement of the valve spool is important for the design or optimization of the proportional directional valve. The motion equation of the valve spool is defined by the actuating force, the mass force, the friction force, the spring force and the flow force resulting from the fluid flow through the valve [6]. The issue of flow forces acting on a valve spool is a complex topic that has been the subject of research in many scientific publications [7,8,9]. In the case of a proportional directional valve without spool position feedback, it is difficult to achieve the desired position, because even with the same control voltage, the hydrodynamic force can disrupt the force balance. As a result of continuous development and innovation in valve geometry, higher flow ranges can be achieved. However, as the flow rate increases, the flow force acting on the valve spool increases, and a greater actuating force is required [10]. Using CFD simulation software Ansys Fluent 2022 R2, the flow field in the proportional directional valve can be analysed. Thus, CFD analysis provides a means to predict the flow force when designing or upgrading the geometry of a proportional directional valve [11,12,13,14,15]. The magnitude of the flow force can be influenced, for example, by the shape of the groove or the flow area of the throttle edges.
The subject of this research is the analysis of the flow force in a proportional directional valve with the sharp-edged spool design. Experimental analysis was performed to determine the flow forces acting on the spool for each flow path separately and for both flow paths simultaneously. The analysis results will help to better describe the force loads on the spool due to the oil passes in each flow path. The analysis of the flow force, acting on the spool of the proportional directional valve under investigation in this study, is of key importance as part of a large-scale research project. The aim of this large-scale research project is to develop a complex 1D mathematical model of a selected proportional directional valve. In this model, it is possible to define sub-parameters that affect the static and dynamic properties of the valve. The mathematical model for CFD analysis of the flow in the directional proportional valve in this study is verified using measured data. The verified model will also allow the analysis of different flow path geometries and their influence on the flow force.

2. Experimental and Numerical Methods

2.1. Flow Force Analysis

The analysis of flow forces was performed on the proportional directional valve PRL2-06-32-0-24 from Argo Hytos (Vrchlabí, Czech republic). Valve size is 06 and nominal volumetric flow rate is QN = 32 dm3·min−1 for nominal pressure drop pN = 70 bar. It is a direct controlled, three-position, four-way spool valve. The valve spool is made in a sharp-edged design with zero spool lap in the middle position. The control part of the proportional directional valve consists of a linear motor. The armature of the linear motor is firmly connected to the valve spool. An inductive position sensor is placed between the linear motor and the valve spool. The inductive position sensor provides feedback from the spool position and ensures higher accuracy of the proportional directional valve. The desired position of the valve spool can be disturbed, for example, by the flow force [16]. The desired position of the valve spool can be controlled by means of feedback from the position of the valve spool.
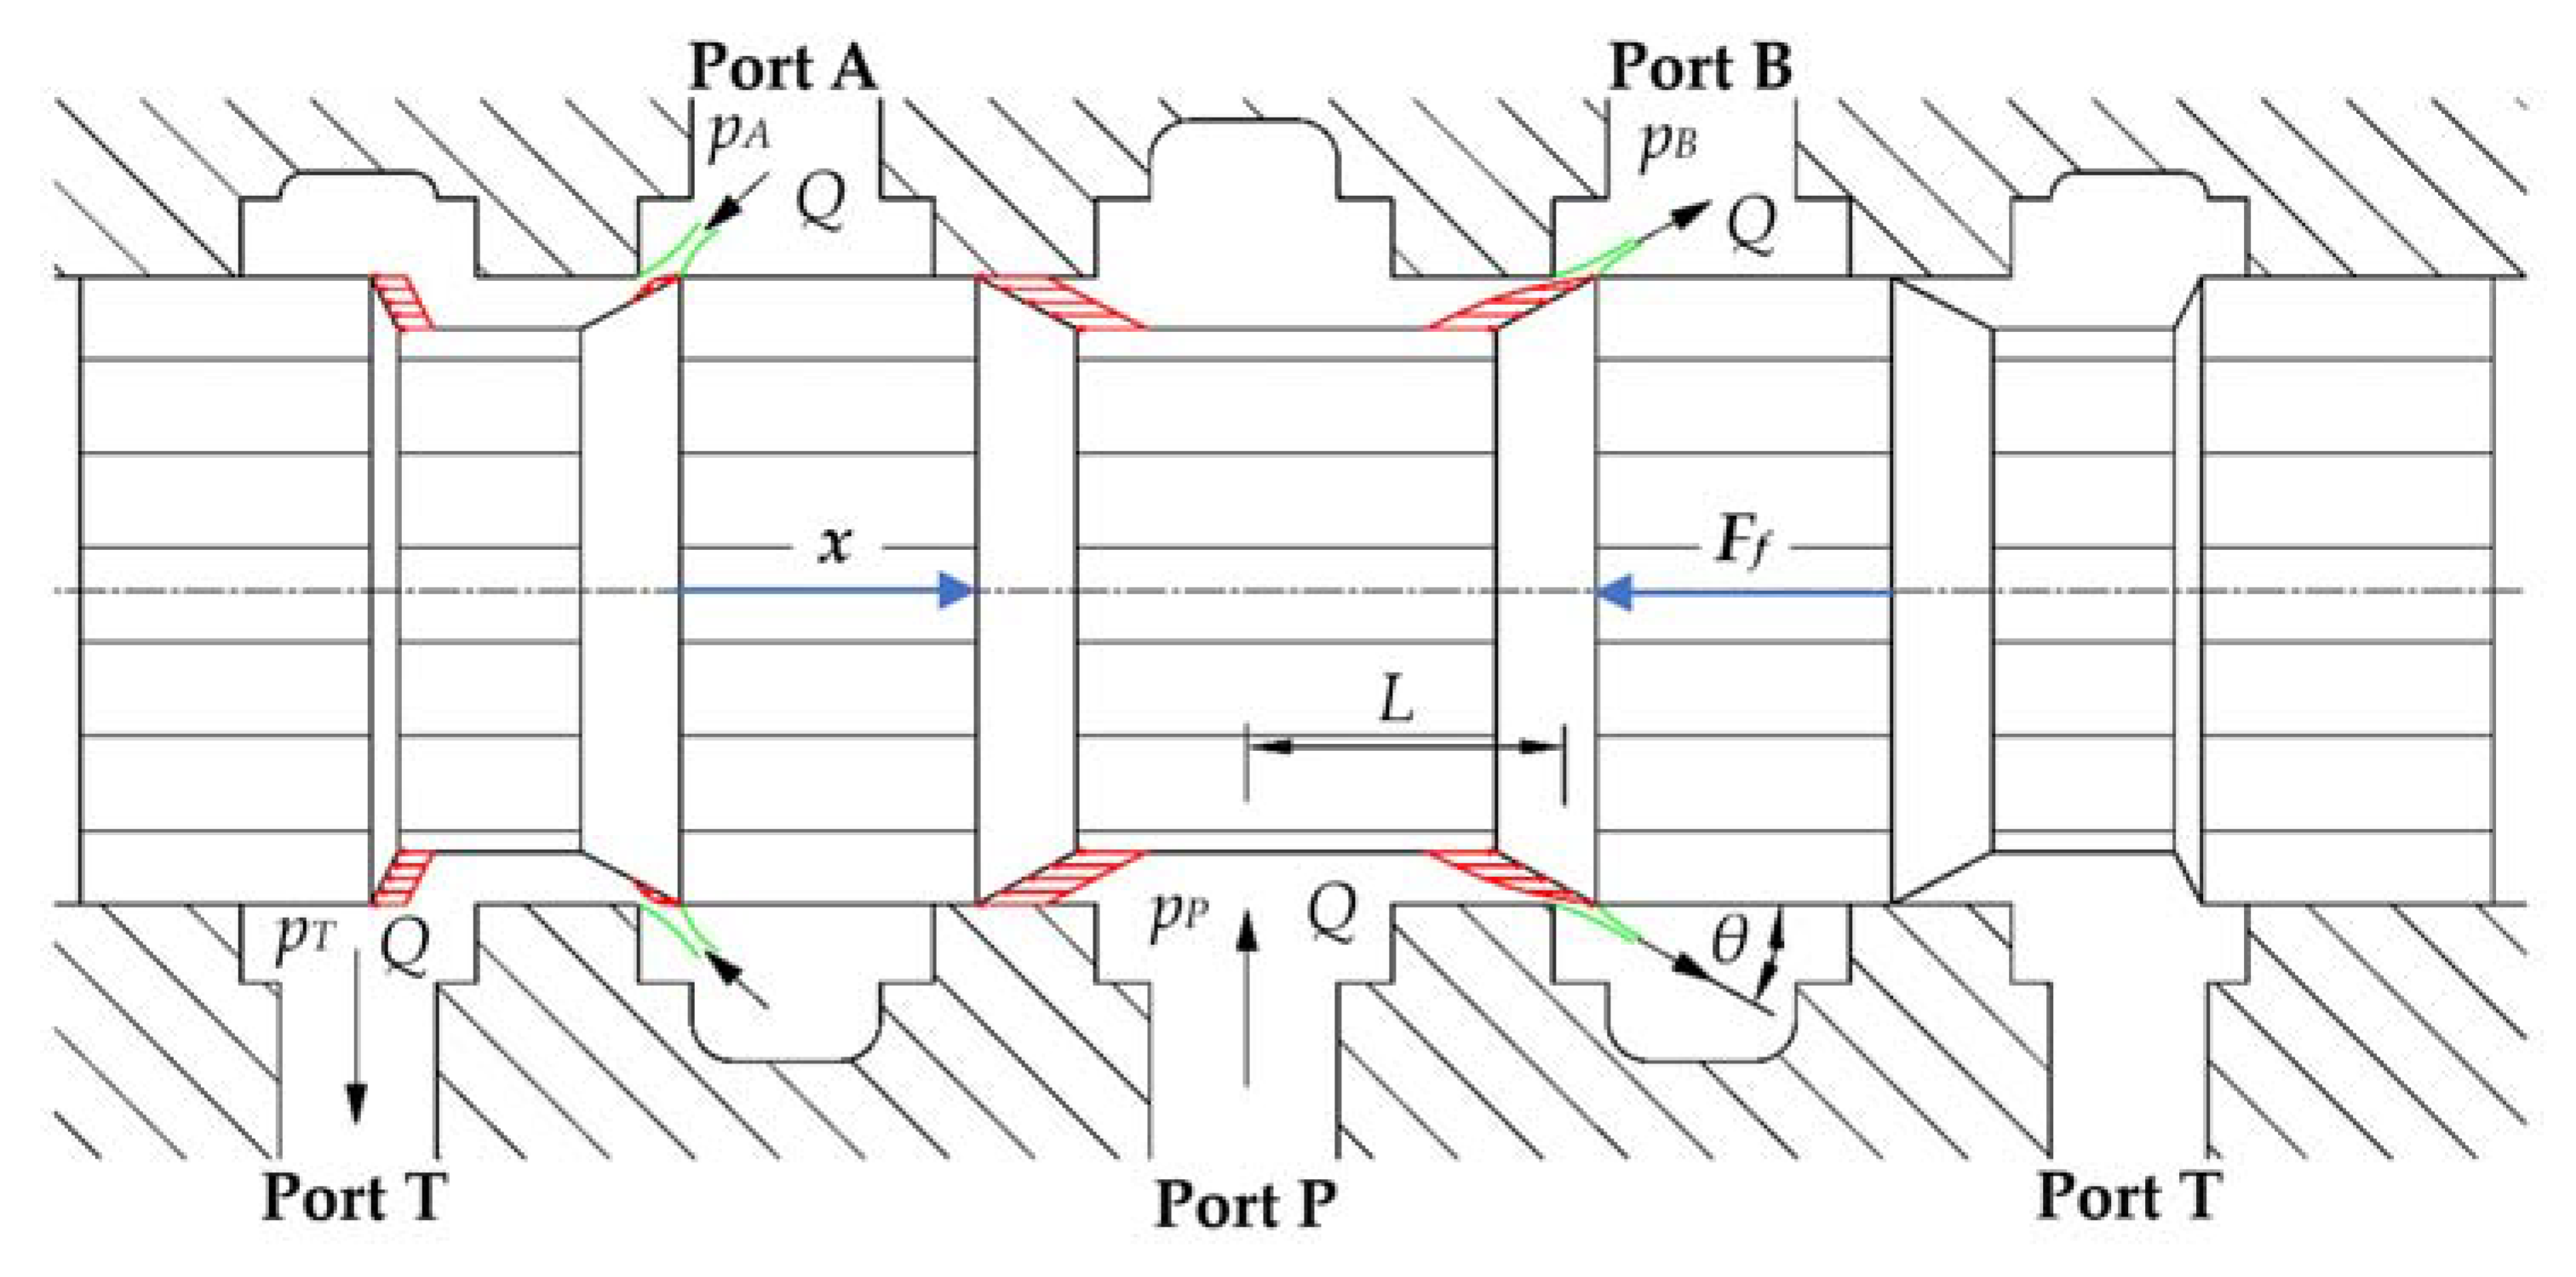
As an effect of the fluid flow through the directional valve, a flow force acts on the valve spool when the spool is deflected from its middle position. The flow force Ff is defined by two components of this force. The steady-state flow force Ffs is caused by a change in the momentum of the flowing fluid in the axis of the valve spool. This force can be expressed by the Equation (1) [17,18]. The steady-state flow force Ffs always acts on the valve spool in the direction that closes the flow path of the directional valve.
F f s = ρ Q 2 S p cos ( θ ) ,
where ρ is density of the fluid, Sp is the flow area, Q is volumetric flow rate and θ is the angle of the fluid jet; see Figure 1. The flow direction through the valve is shown by the black arrows. The blue arrows show the direction of the spool displacement and the flow force direction.
A transient flow force Fft is generated when the fluid flow surrounding the valve spool in the valve chamber is accelerated. The magnitude of this force is defined by Newton’s second law, and, after modification, it can be expressed by Equation (2) [17,18]. This force can act in the direction that closes or in the direction that opens the flow path of the directional valve, depending on the sign Q / t .
F f   t = ρ L Q t ,
where L is the axial distance between the inlet and outlet fluid flow; see Figure 1.
Then, the magnitude of the flow force Ff is determined by Equation (3) [17]. The direction of flow forces, or the signs of individual forces, are determined for the case of the proportional directional valve setup; see Figure 1. For the directional valve setup with the same spool displacement but opposite direction of fluid flow, the sign of the steady-state flow force remains the same and only the sign of the transient flow force changes. A change in the direction of the steady-state flow force occurs if the valve spool is moved in the opposite direction [17].
F f =   F f   s F f   t = ρ Q 2 S p cos θ ρ L Q t .

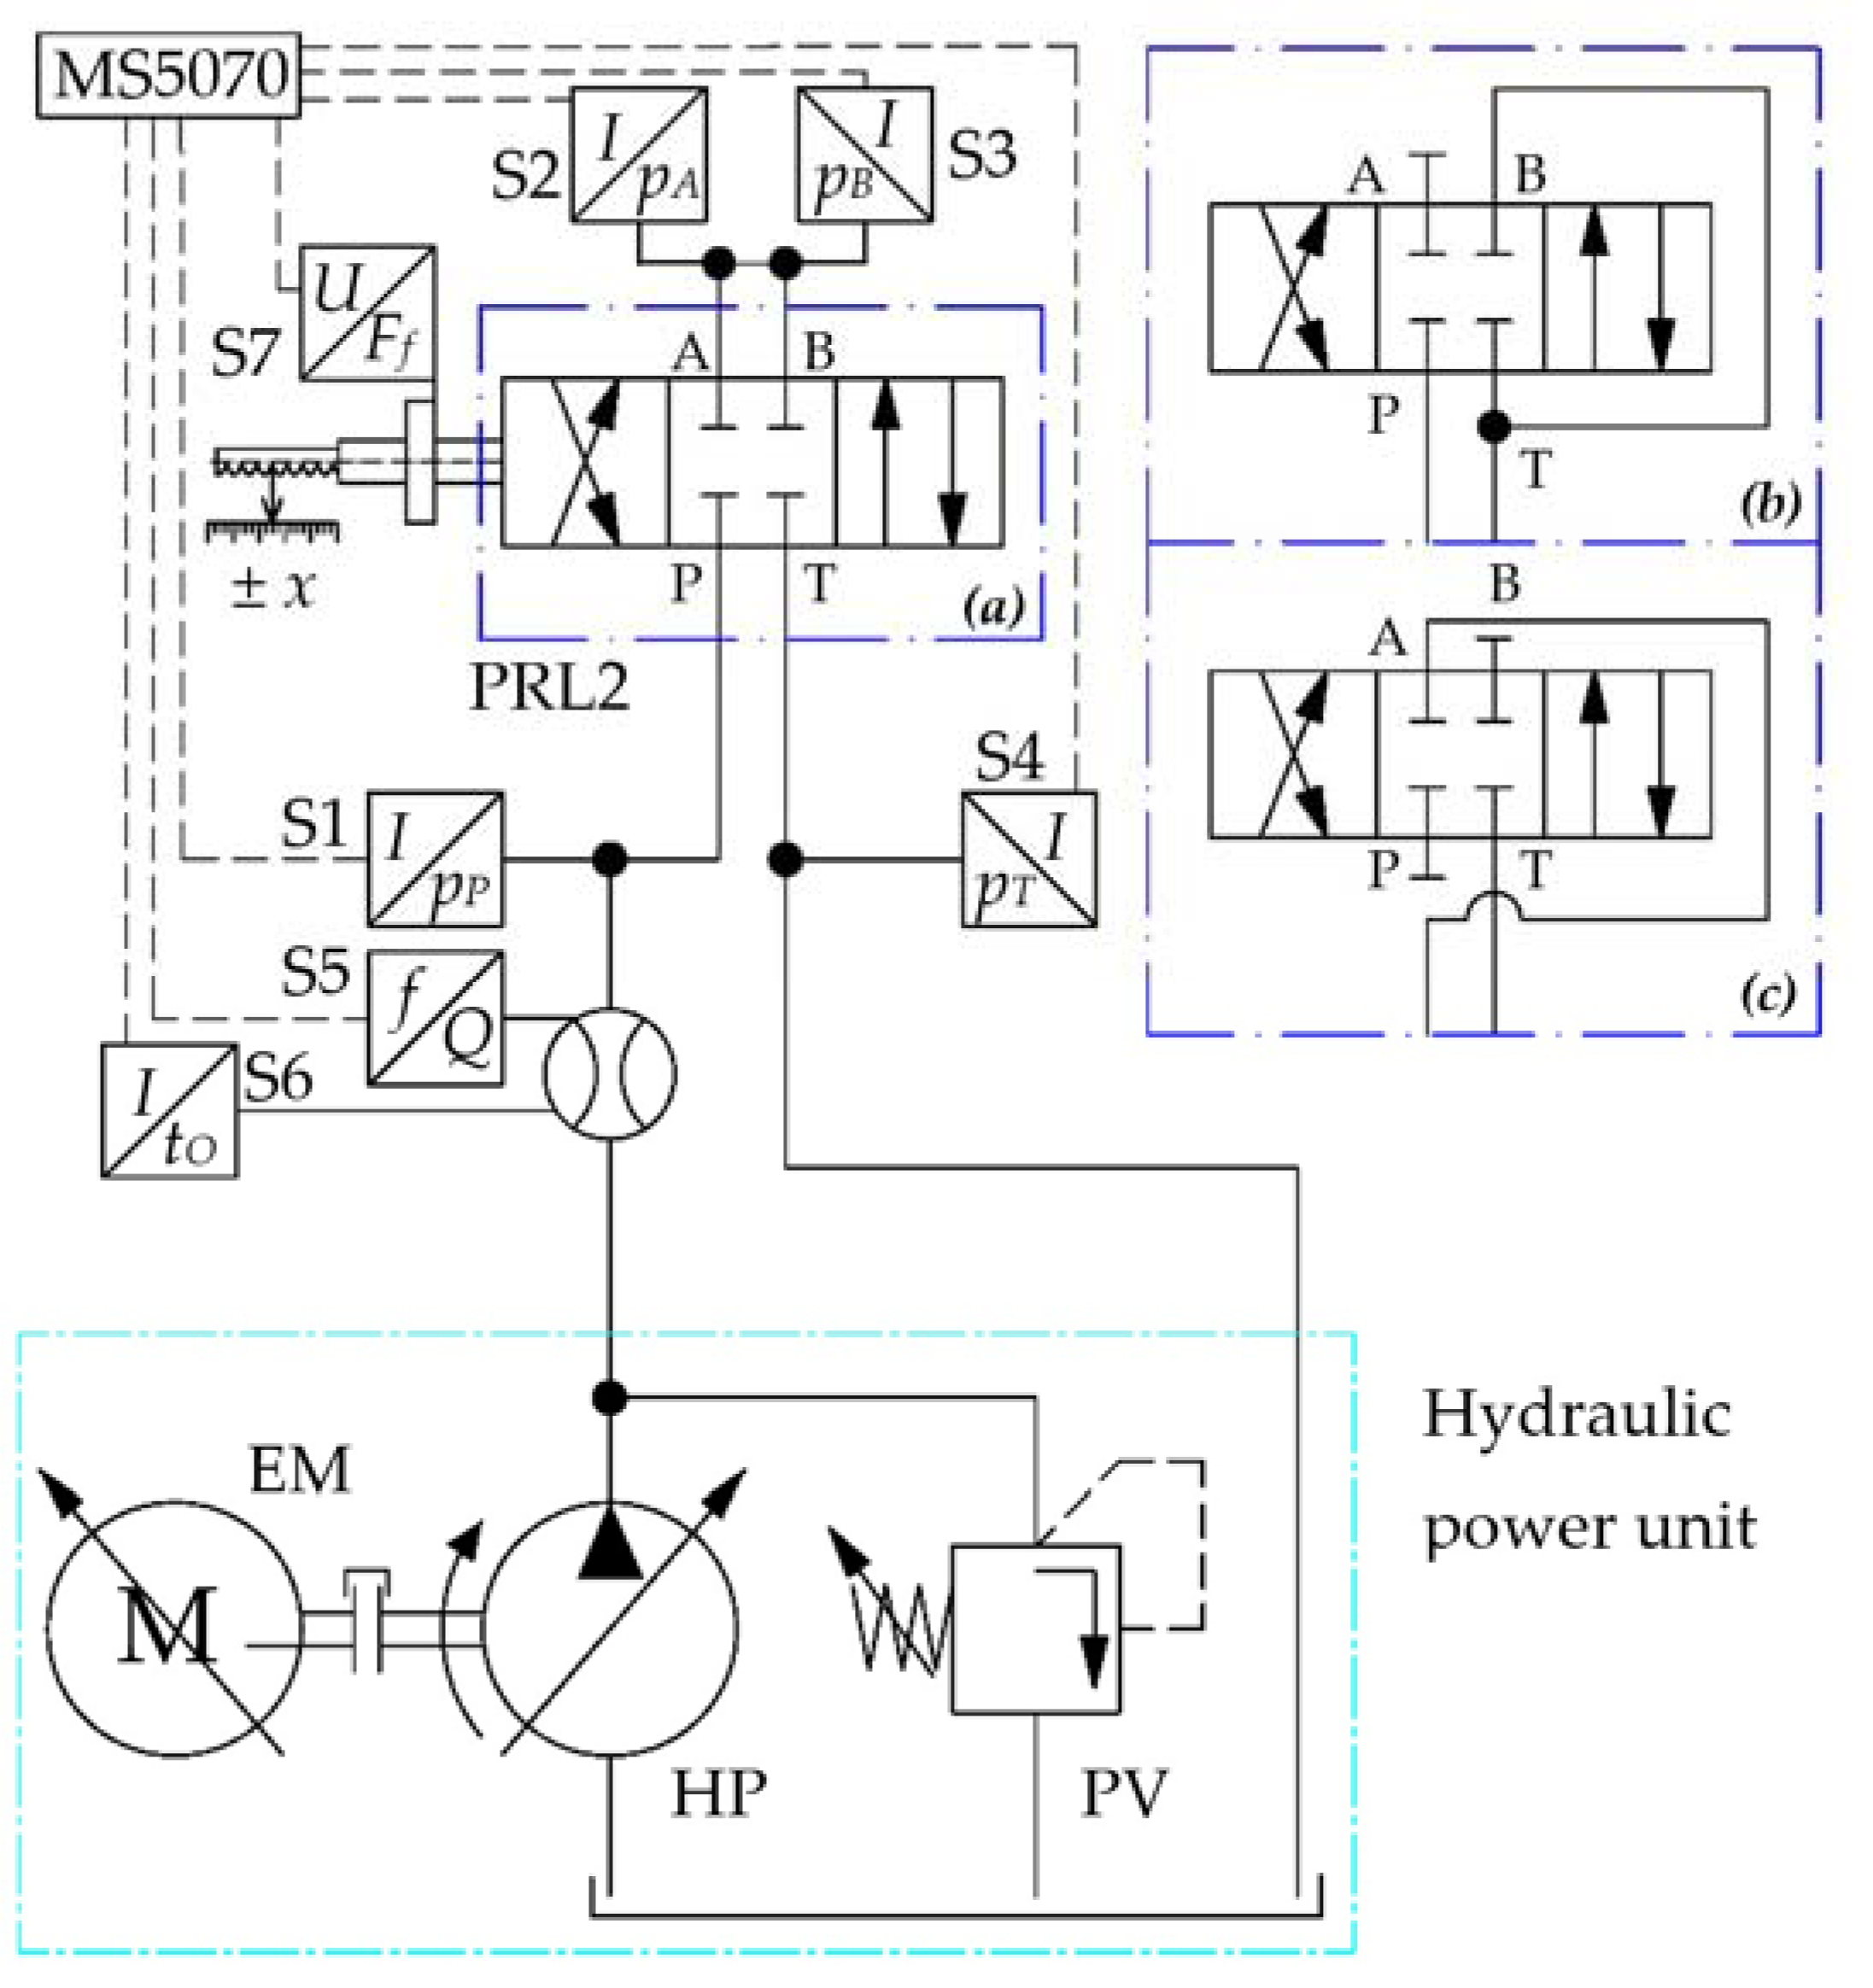
2.2. Experimental Test Stand

A hydraulic system was designed and built to measure the flow force. A simplified hydraulic scheme of the experimental system with different system variations is shown in 
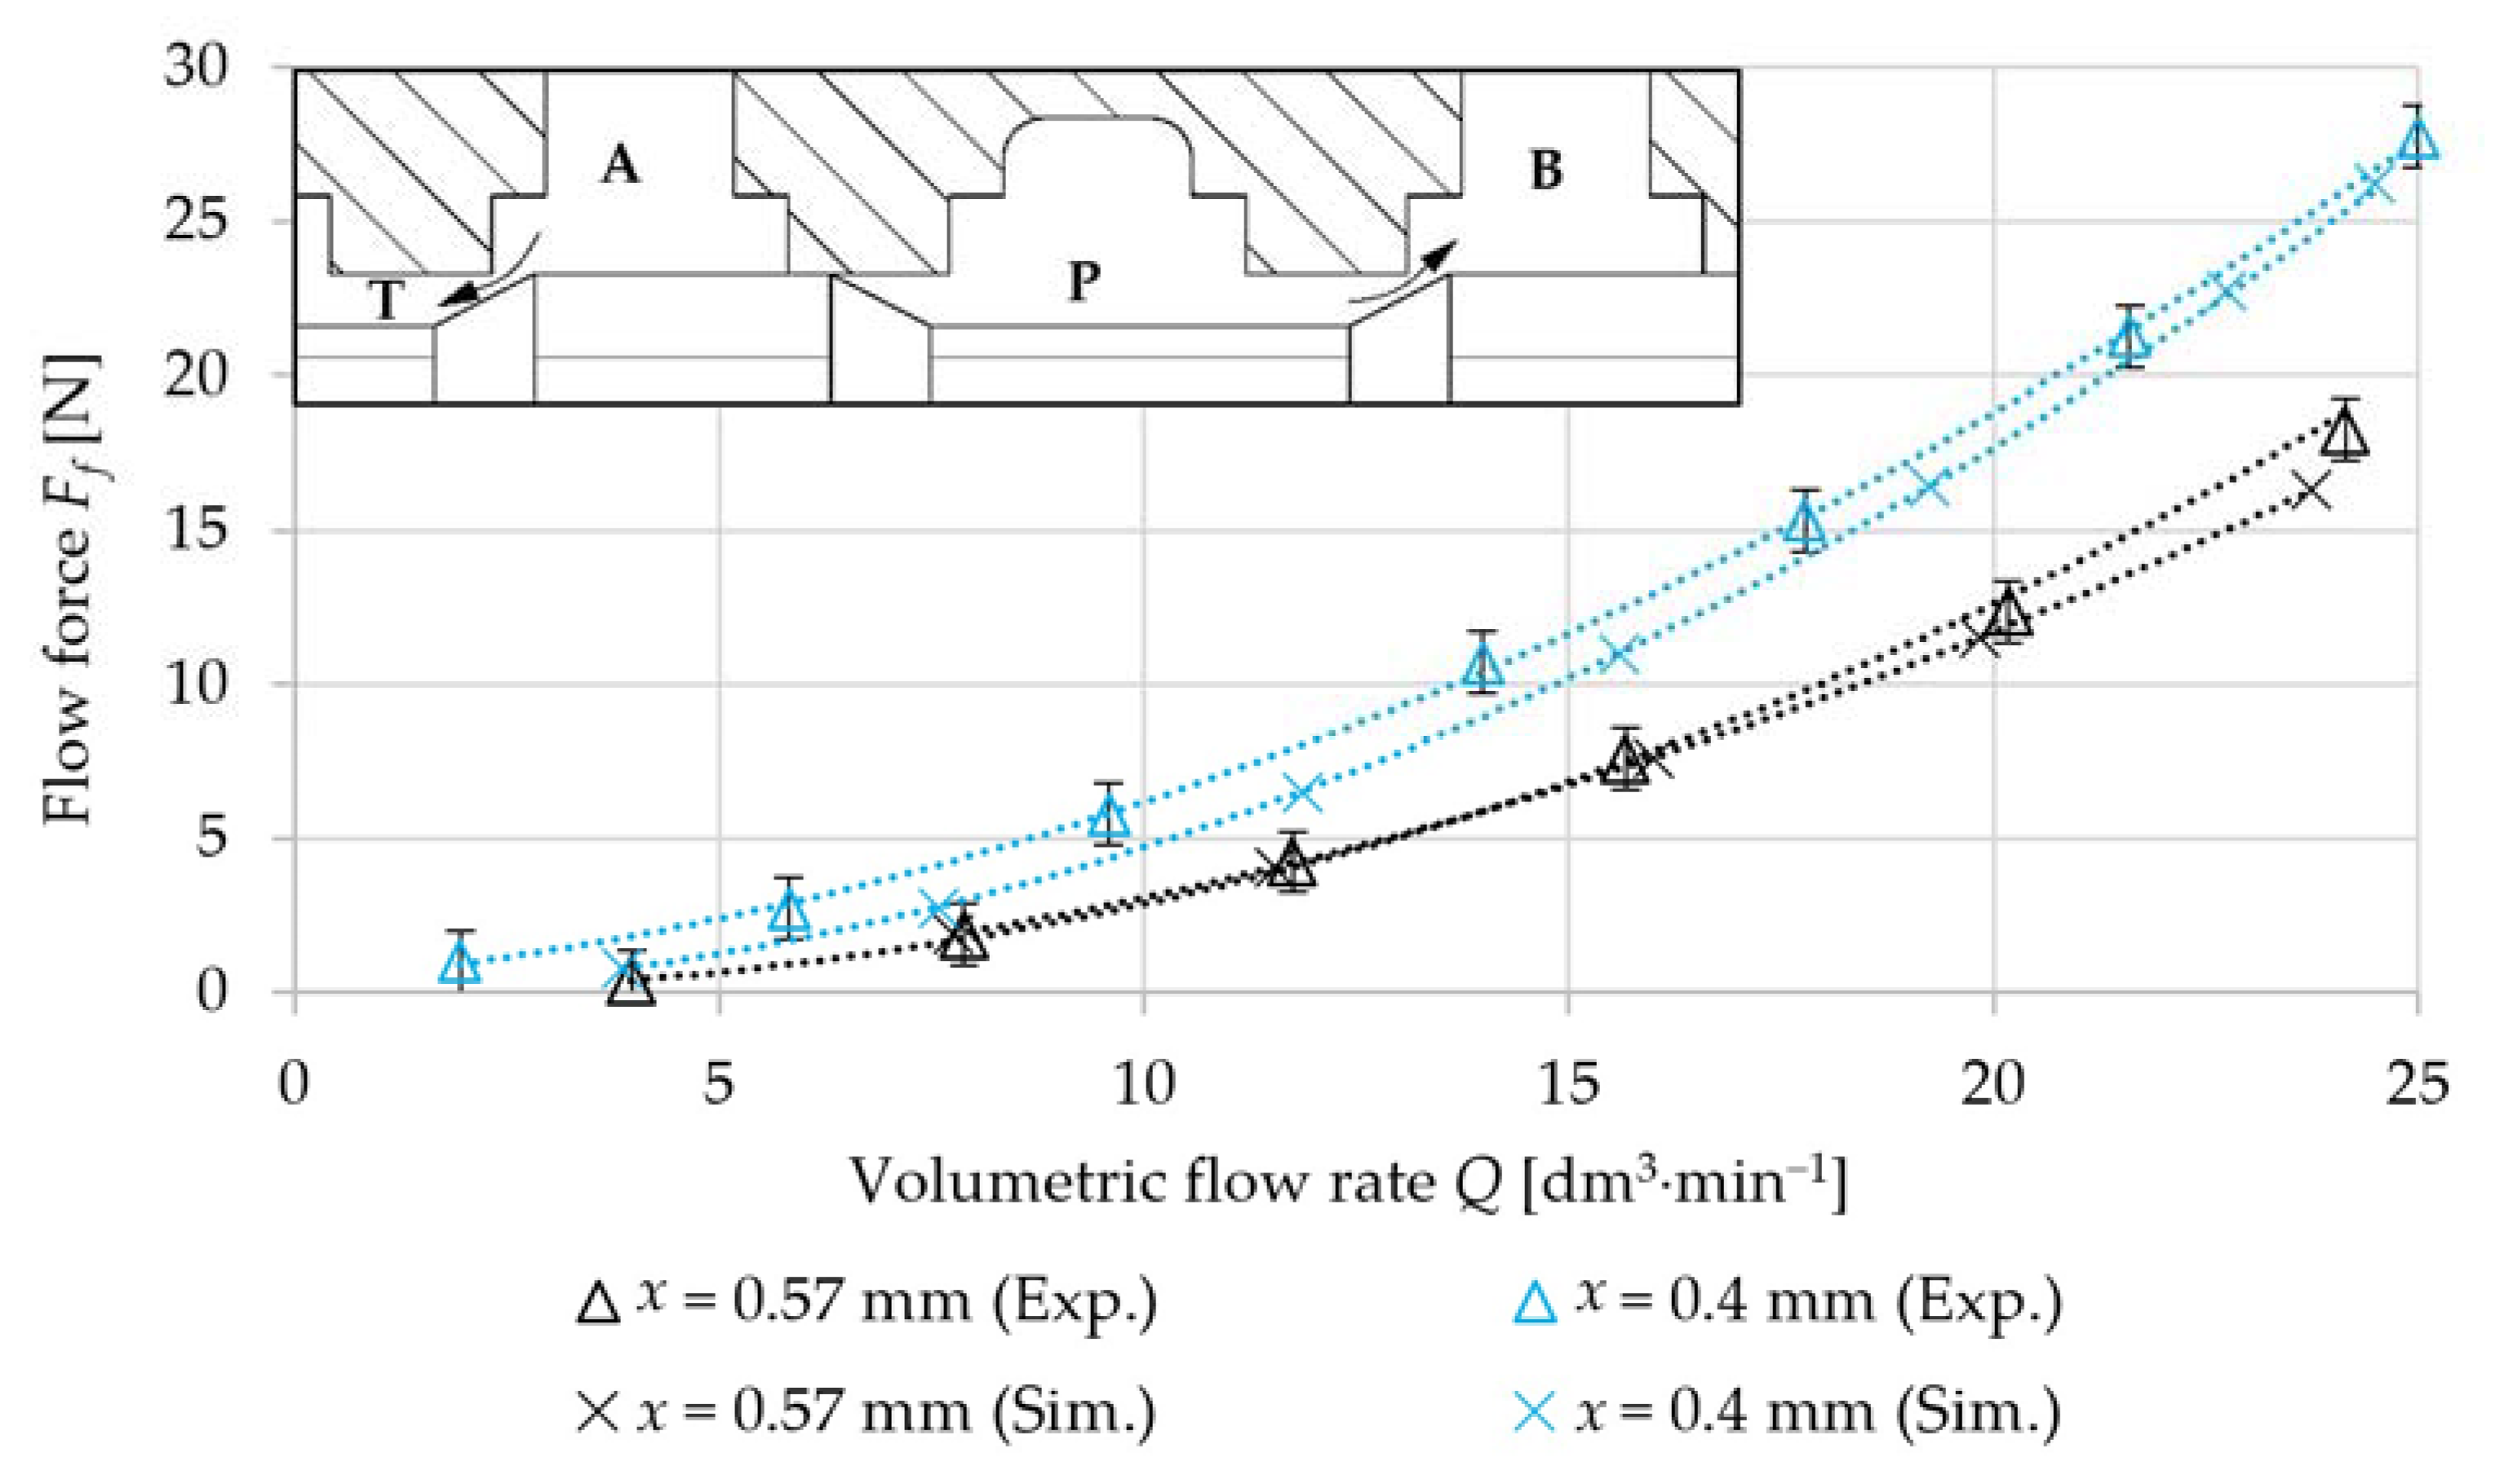
Figure 2. The standard directional valve connection shown in Figure 2a was used to measure the flow force 
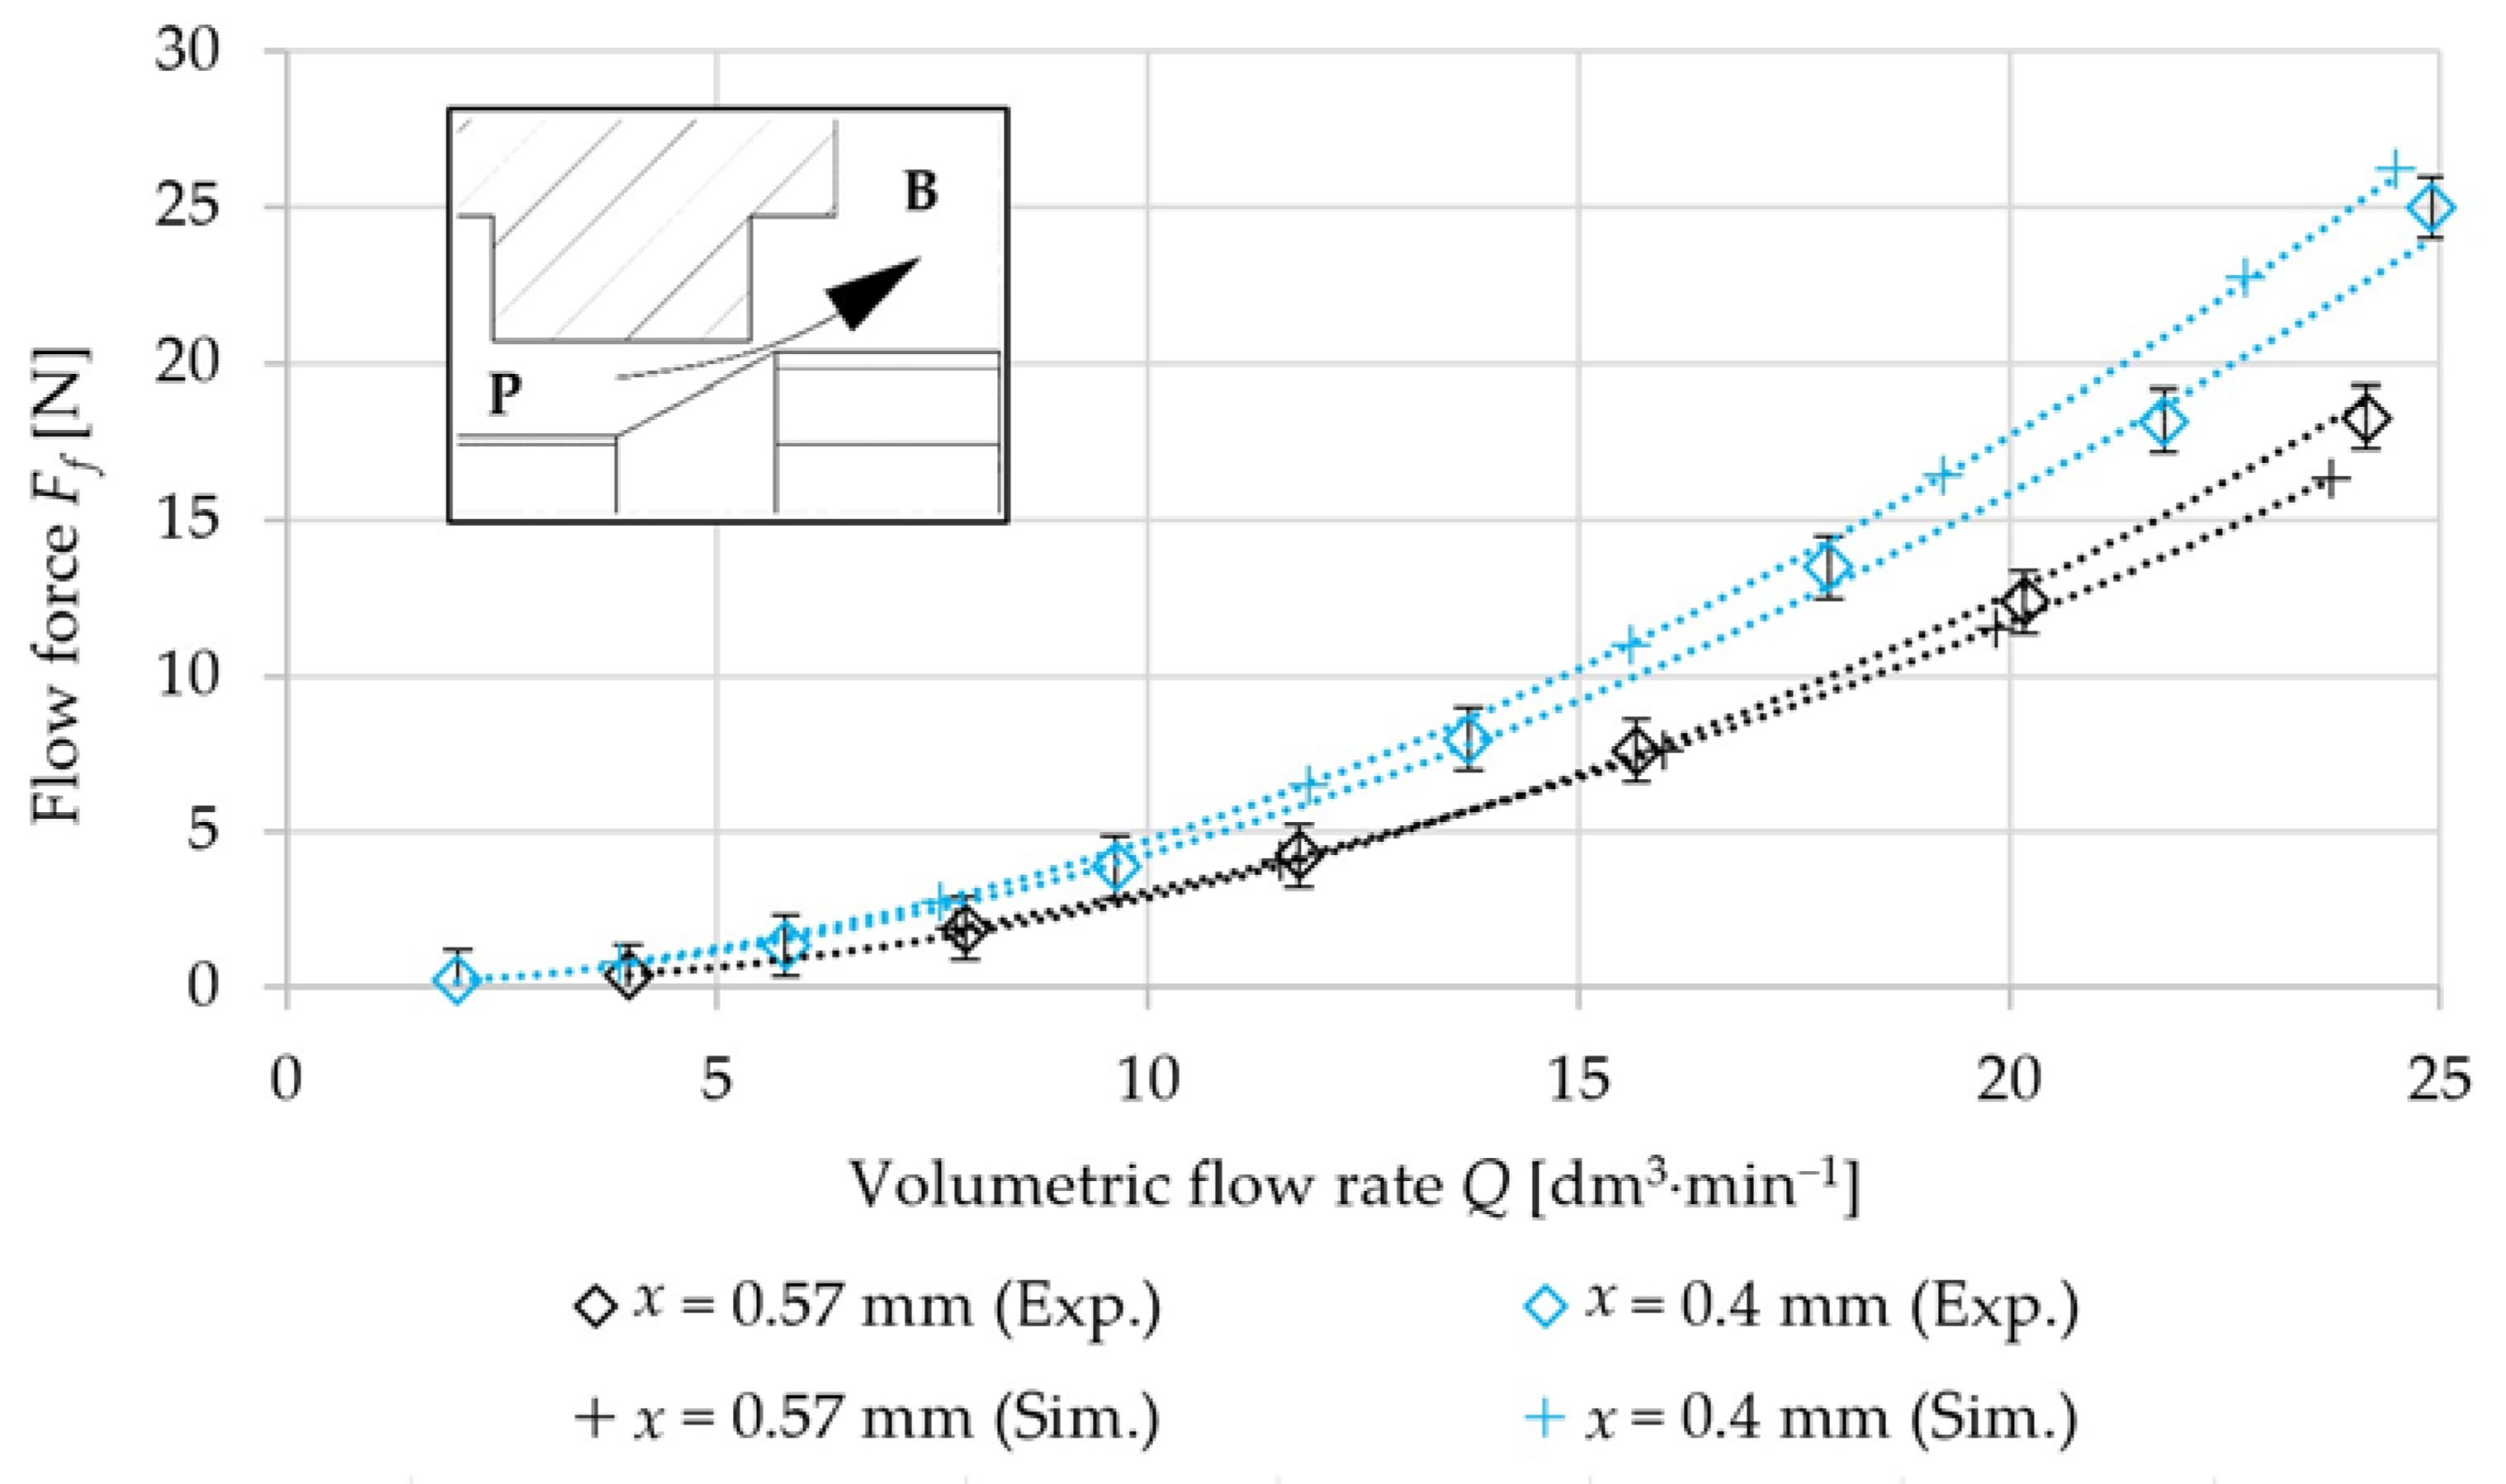
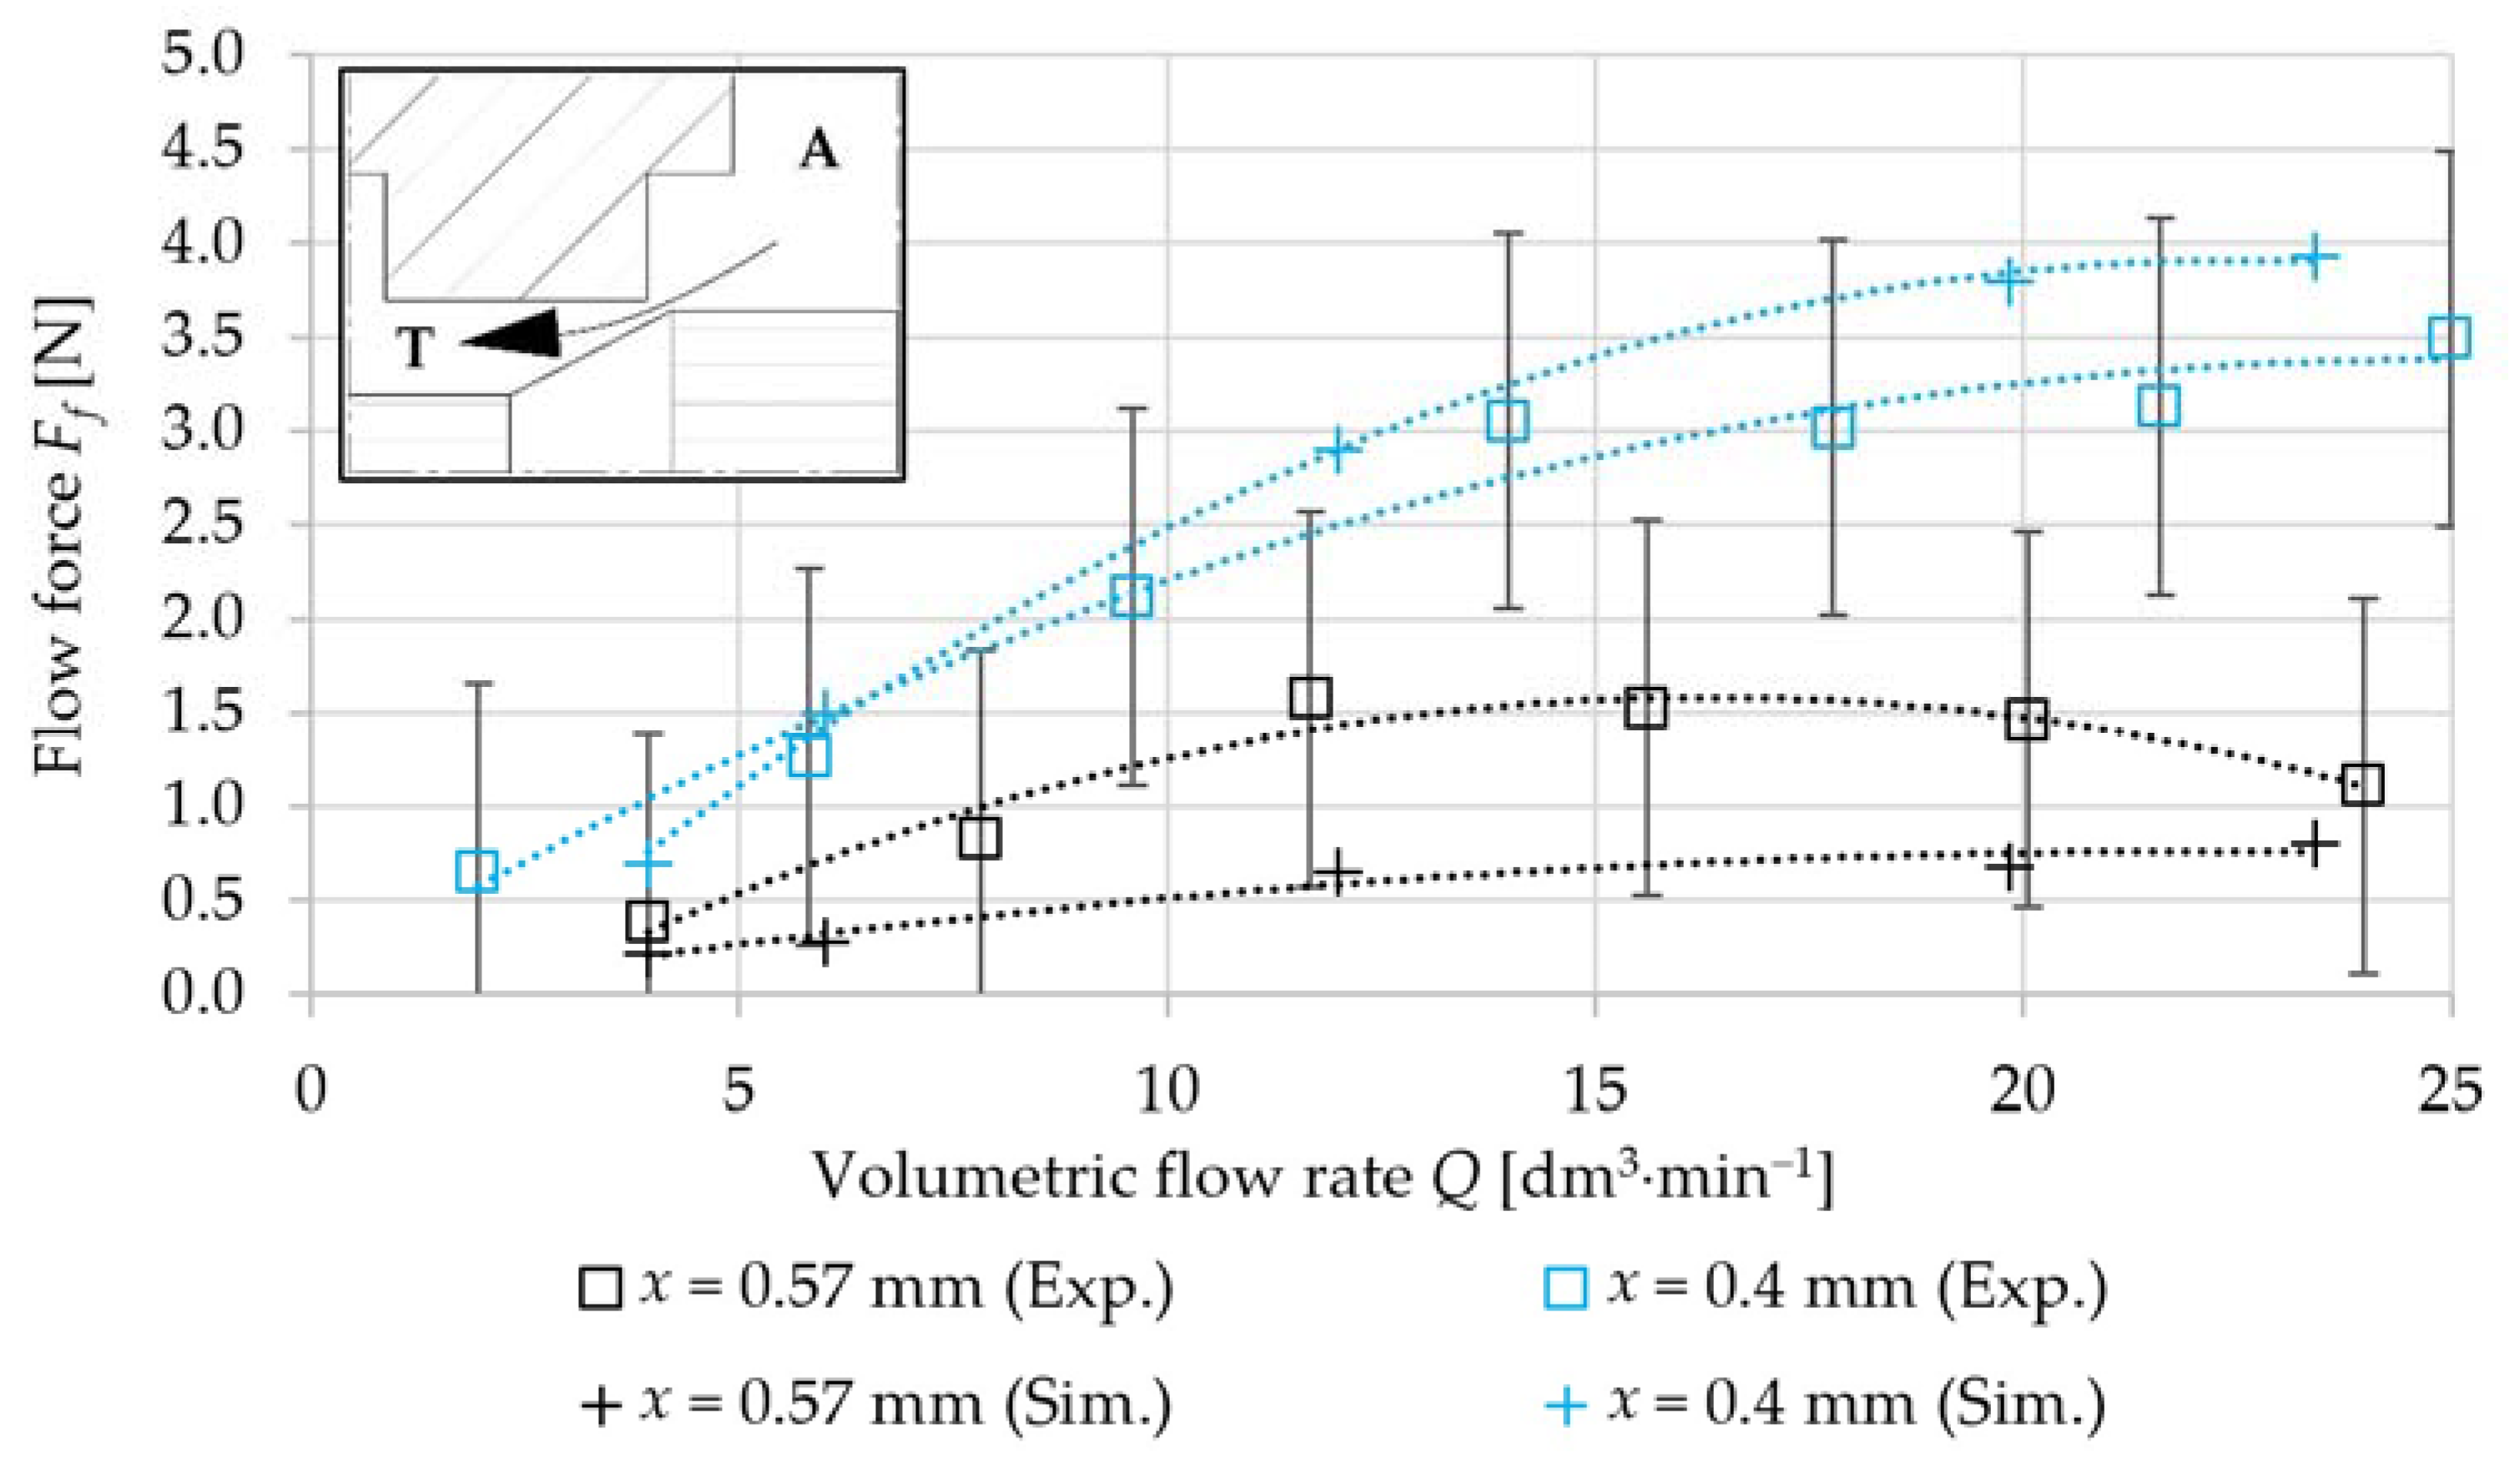
Ff when the fluid passed through the flow channels PB and AT simultaneously. The connection scheme of the directional valve shown in Figure 2b or Figure 2c was used to measure the flow force Ff when the fluid passed through each flow path separately (PB only or AT only). The source of the pressure energy was a hydraulic power unit that worked as a constant flow source. Pressure sensors S1, S2, S3 and S4 were connected in the system to measure the pressures p in individual ports of the proportional directional valve. The volumetric flow rate Q was measured by flow meter S5 in the circuit. The temperature of the oil tO was measured by a temperature sensor S6, which was located in the flow meter. The flow force was measured by the S7 force sensor. The measuring instrument MS5070 from Hydrotechnik (Limburg an der Lahn, Germany) was used to record individual measurements. The measuring ranges and accuracy of each sensor are shown in Table 1. Hydraulic oil HV46 was used in the experiment. At the oil temperature tO = 40 °C, the density of the oil was 852 kg·m−3 and the dynamic viscosity is 0.03859 Pa·s.
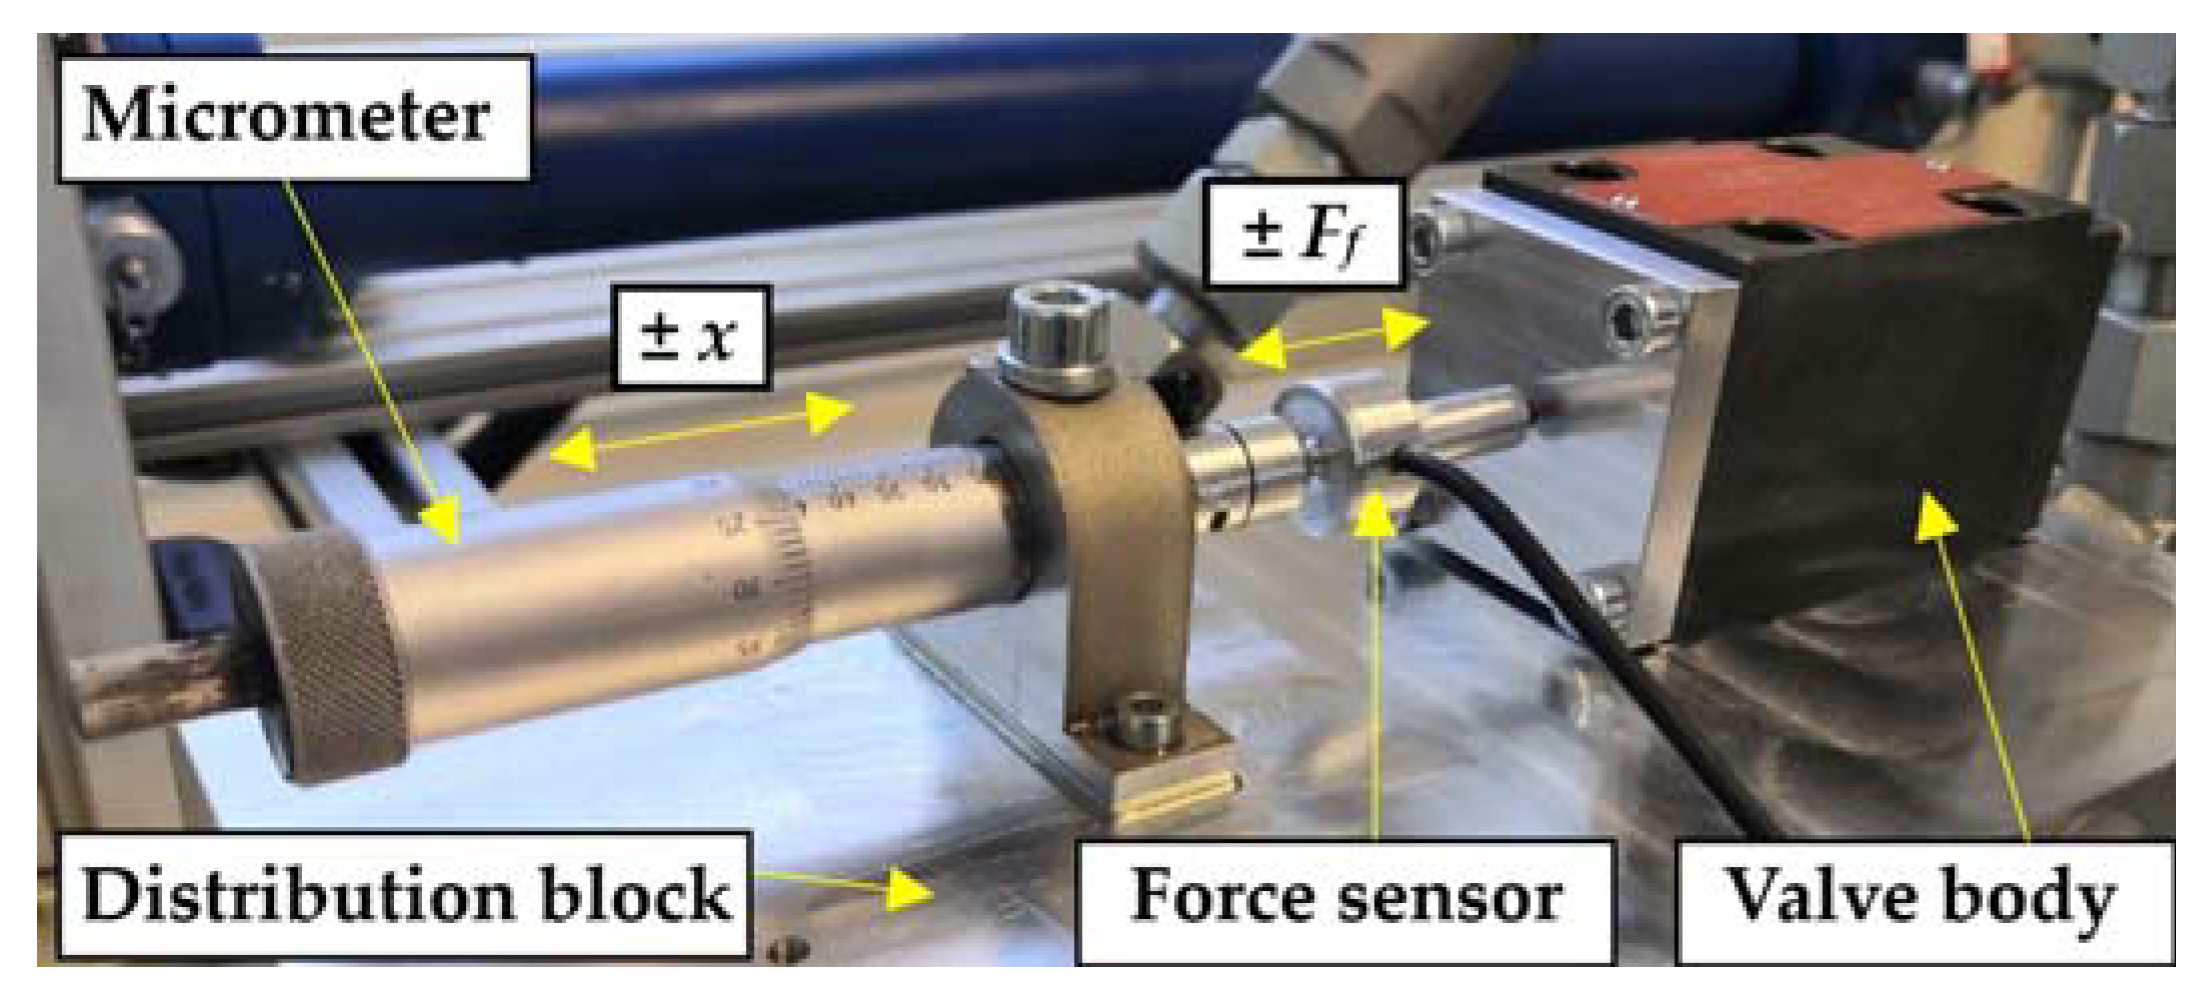
To measure the flow force, modifications were made to the proportional directional valve. The proportional directional valve was disassembled and only the hydraulic part of the valve, consisting of the cast iron body and the valve spool, was used for the measurement. After disassembling the directional valve, it was possible to place the force sensor on the spool axis. The force sensor was supported on the opposite side by a micrometer. The micrometer holder was attached to the distribution block. The force sensor S7 was placed between the moving end of the micrometer and the valve spool. The micrometer holder was designed to preserve the coaxiality of the micrometer, force sensor and valve spool. Thereafter, only the force due to the flow of the fluid acted on the force sensor. A micrometer was used to set the desired spool position. The relative position of the spool was determined by the position of a digital deviation meter in relation to a reference point. The digital deviation meter was placed on the front side of the spool. The digital deviation meter was used to check the deflection of the spool from the desired position. The reference point was the middle position of the valve spool. Pressure symmetry in the valve chambers with blocked ports A and B was used to determine the middle position of the valve spool. The micrometer was equipped with a locking screw that ensured a fixed position of the spool in the directional valve. The control part side of the valve body was fitted with an aluminium cover to minimise fluid leakage after the control part of the proportional directional valve was removed. The picture of the experimental equipment for flow force measurement with a description of the individual parts is shown in Figure 3.

Flow Force Measurement

The flow force 
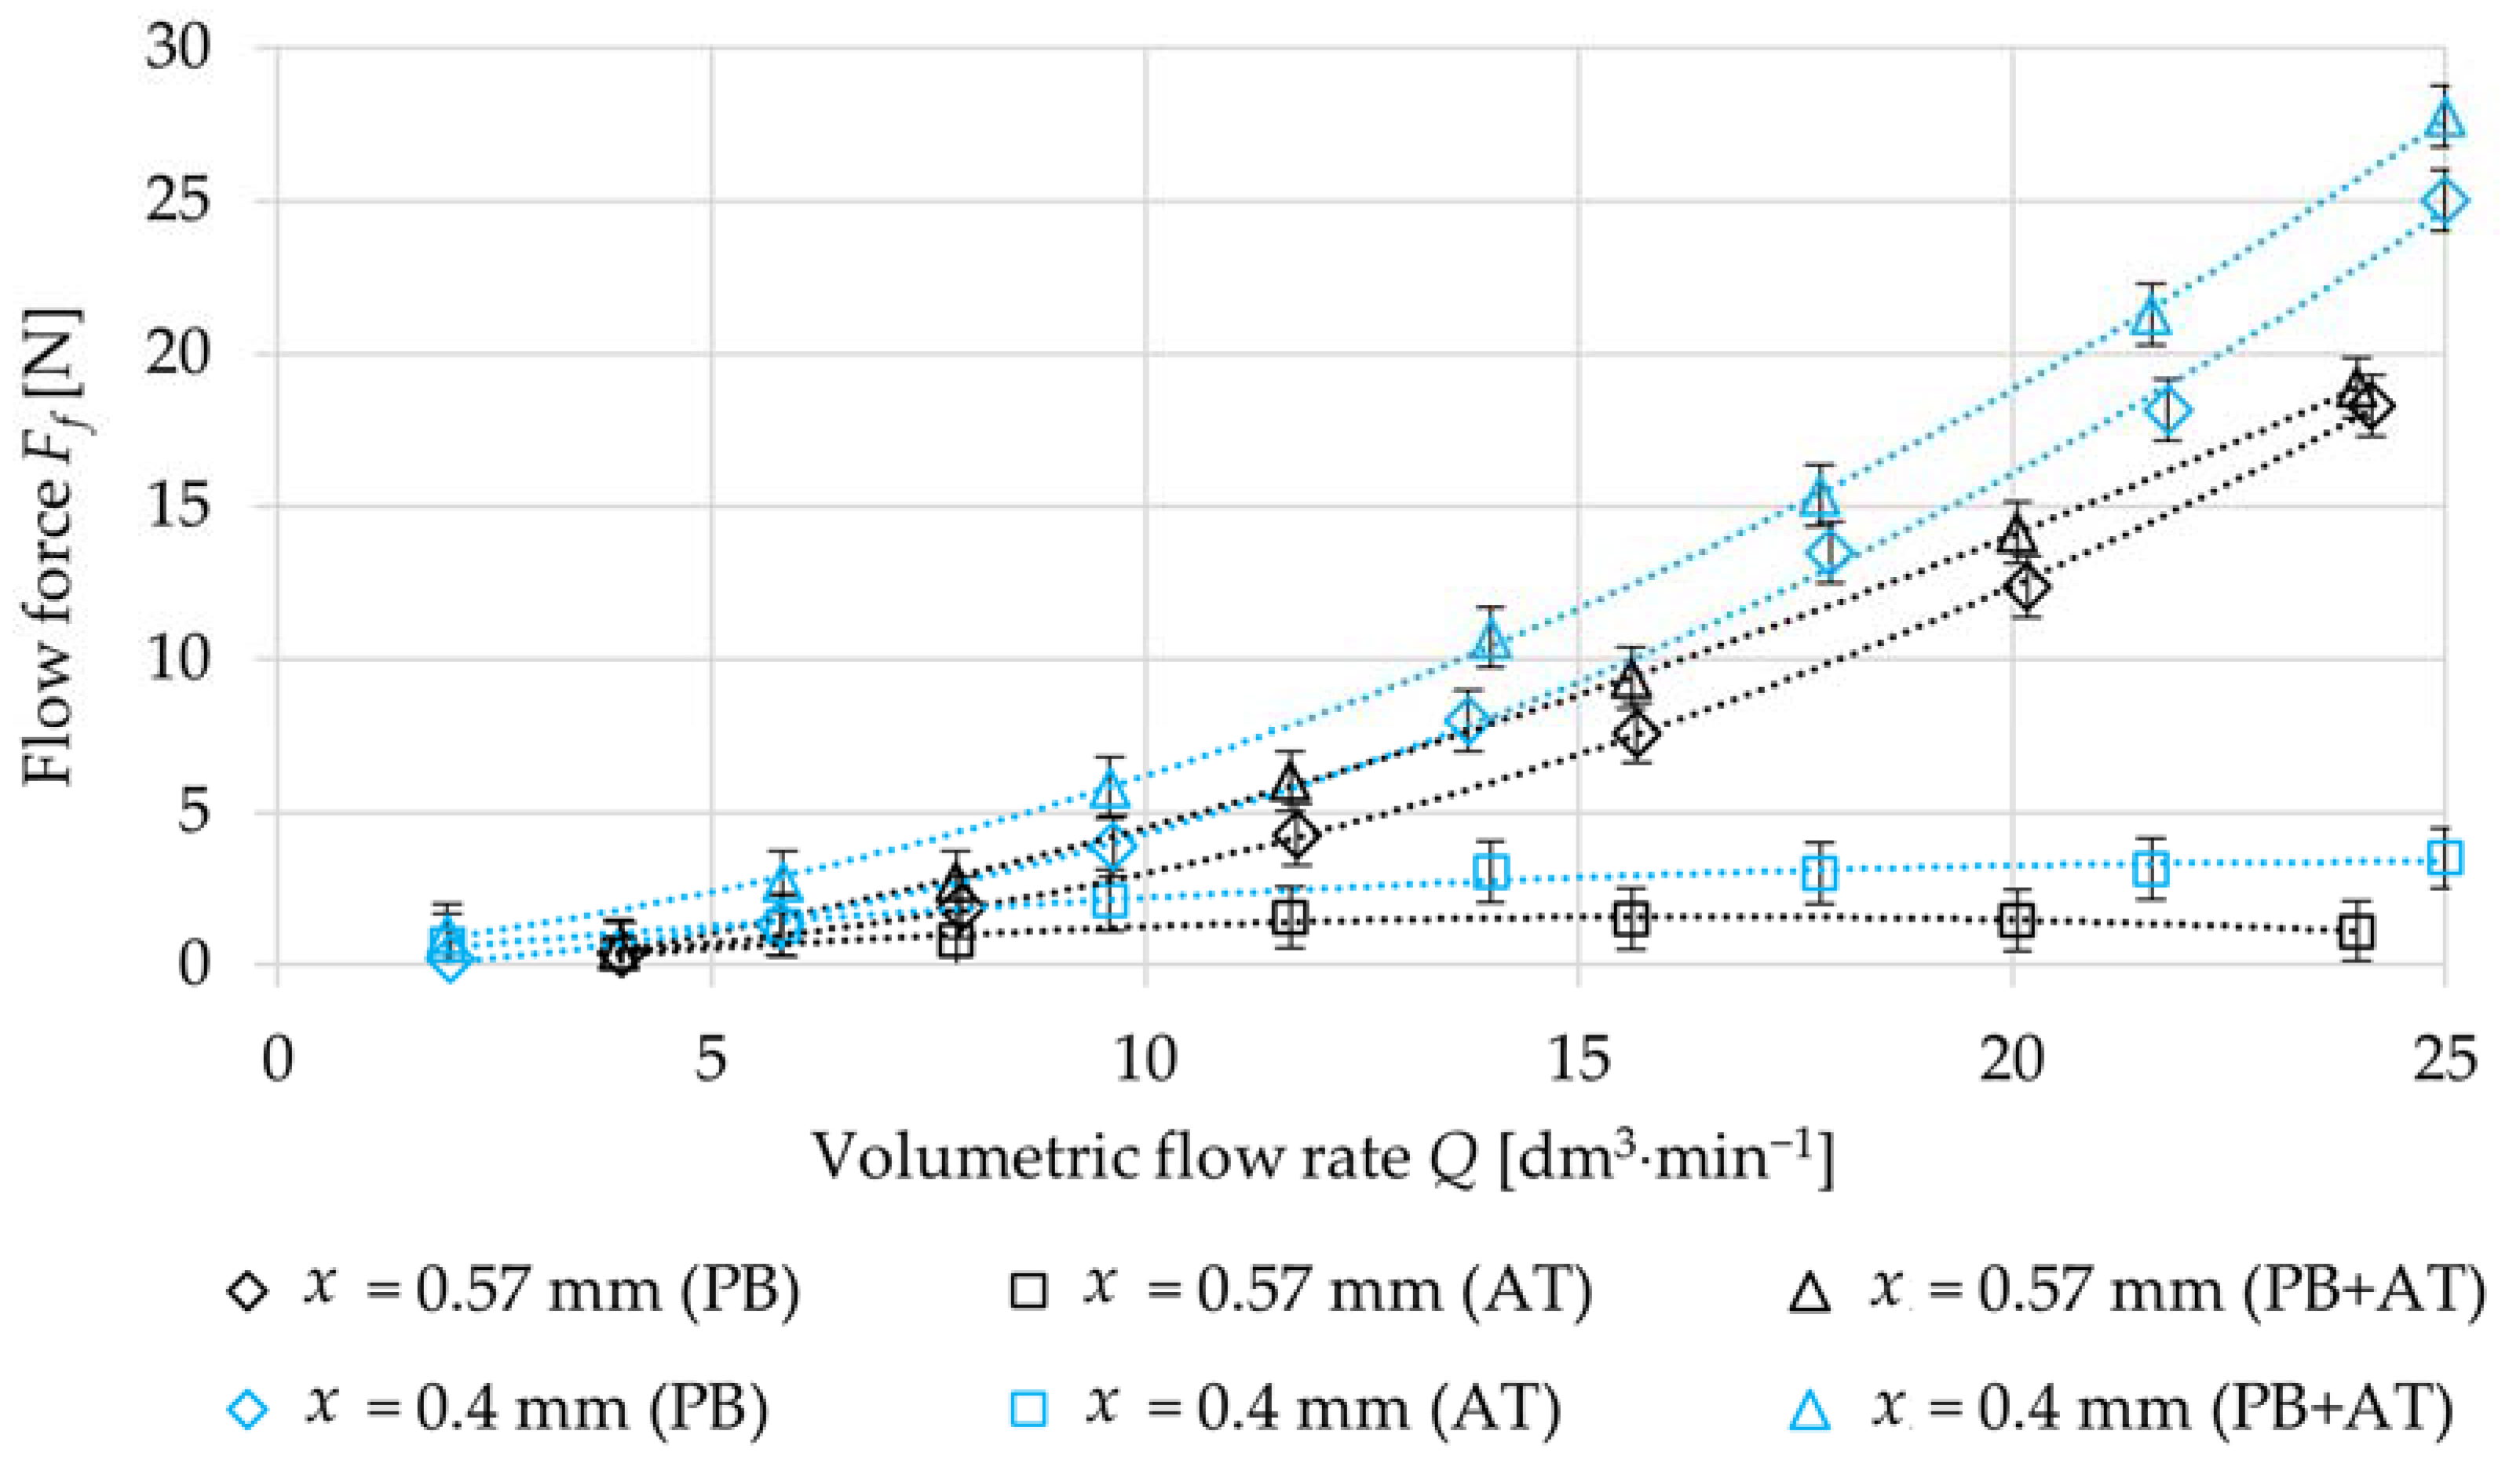
Ff, acting on the valve spool, was measured for the positive direction of the spool displacement, resp. of the oil flow through flow paths PB and AT. Firstly, measurements were performed to determine the flow force Ff that acts on the valve spool when oil passes through flow paths PB and AT separately. During this measurement, the hydraulic system was adjusted so that the oil always flows only through the given flow path; see 
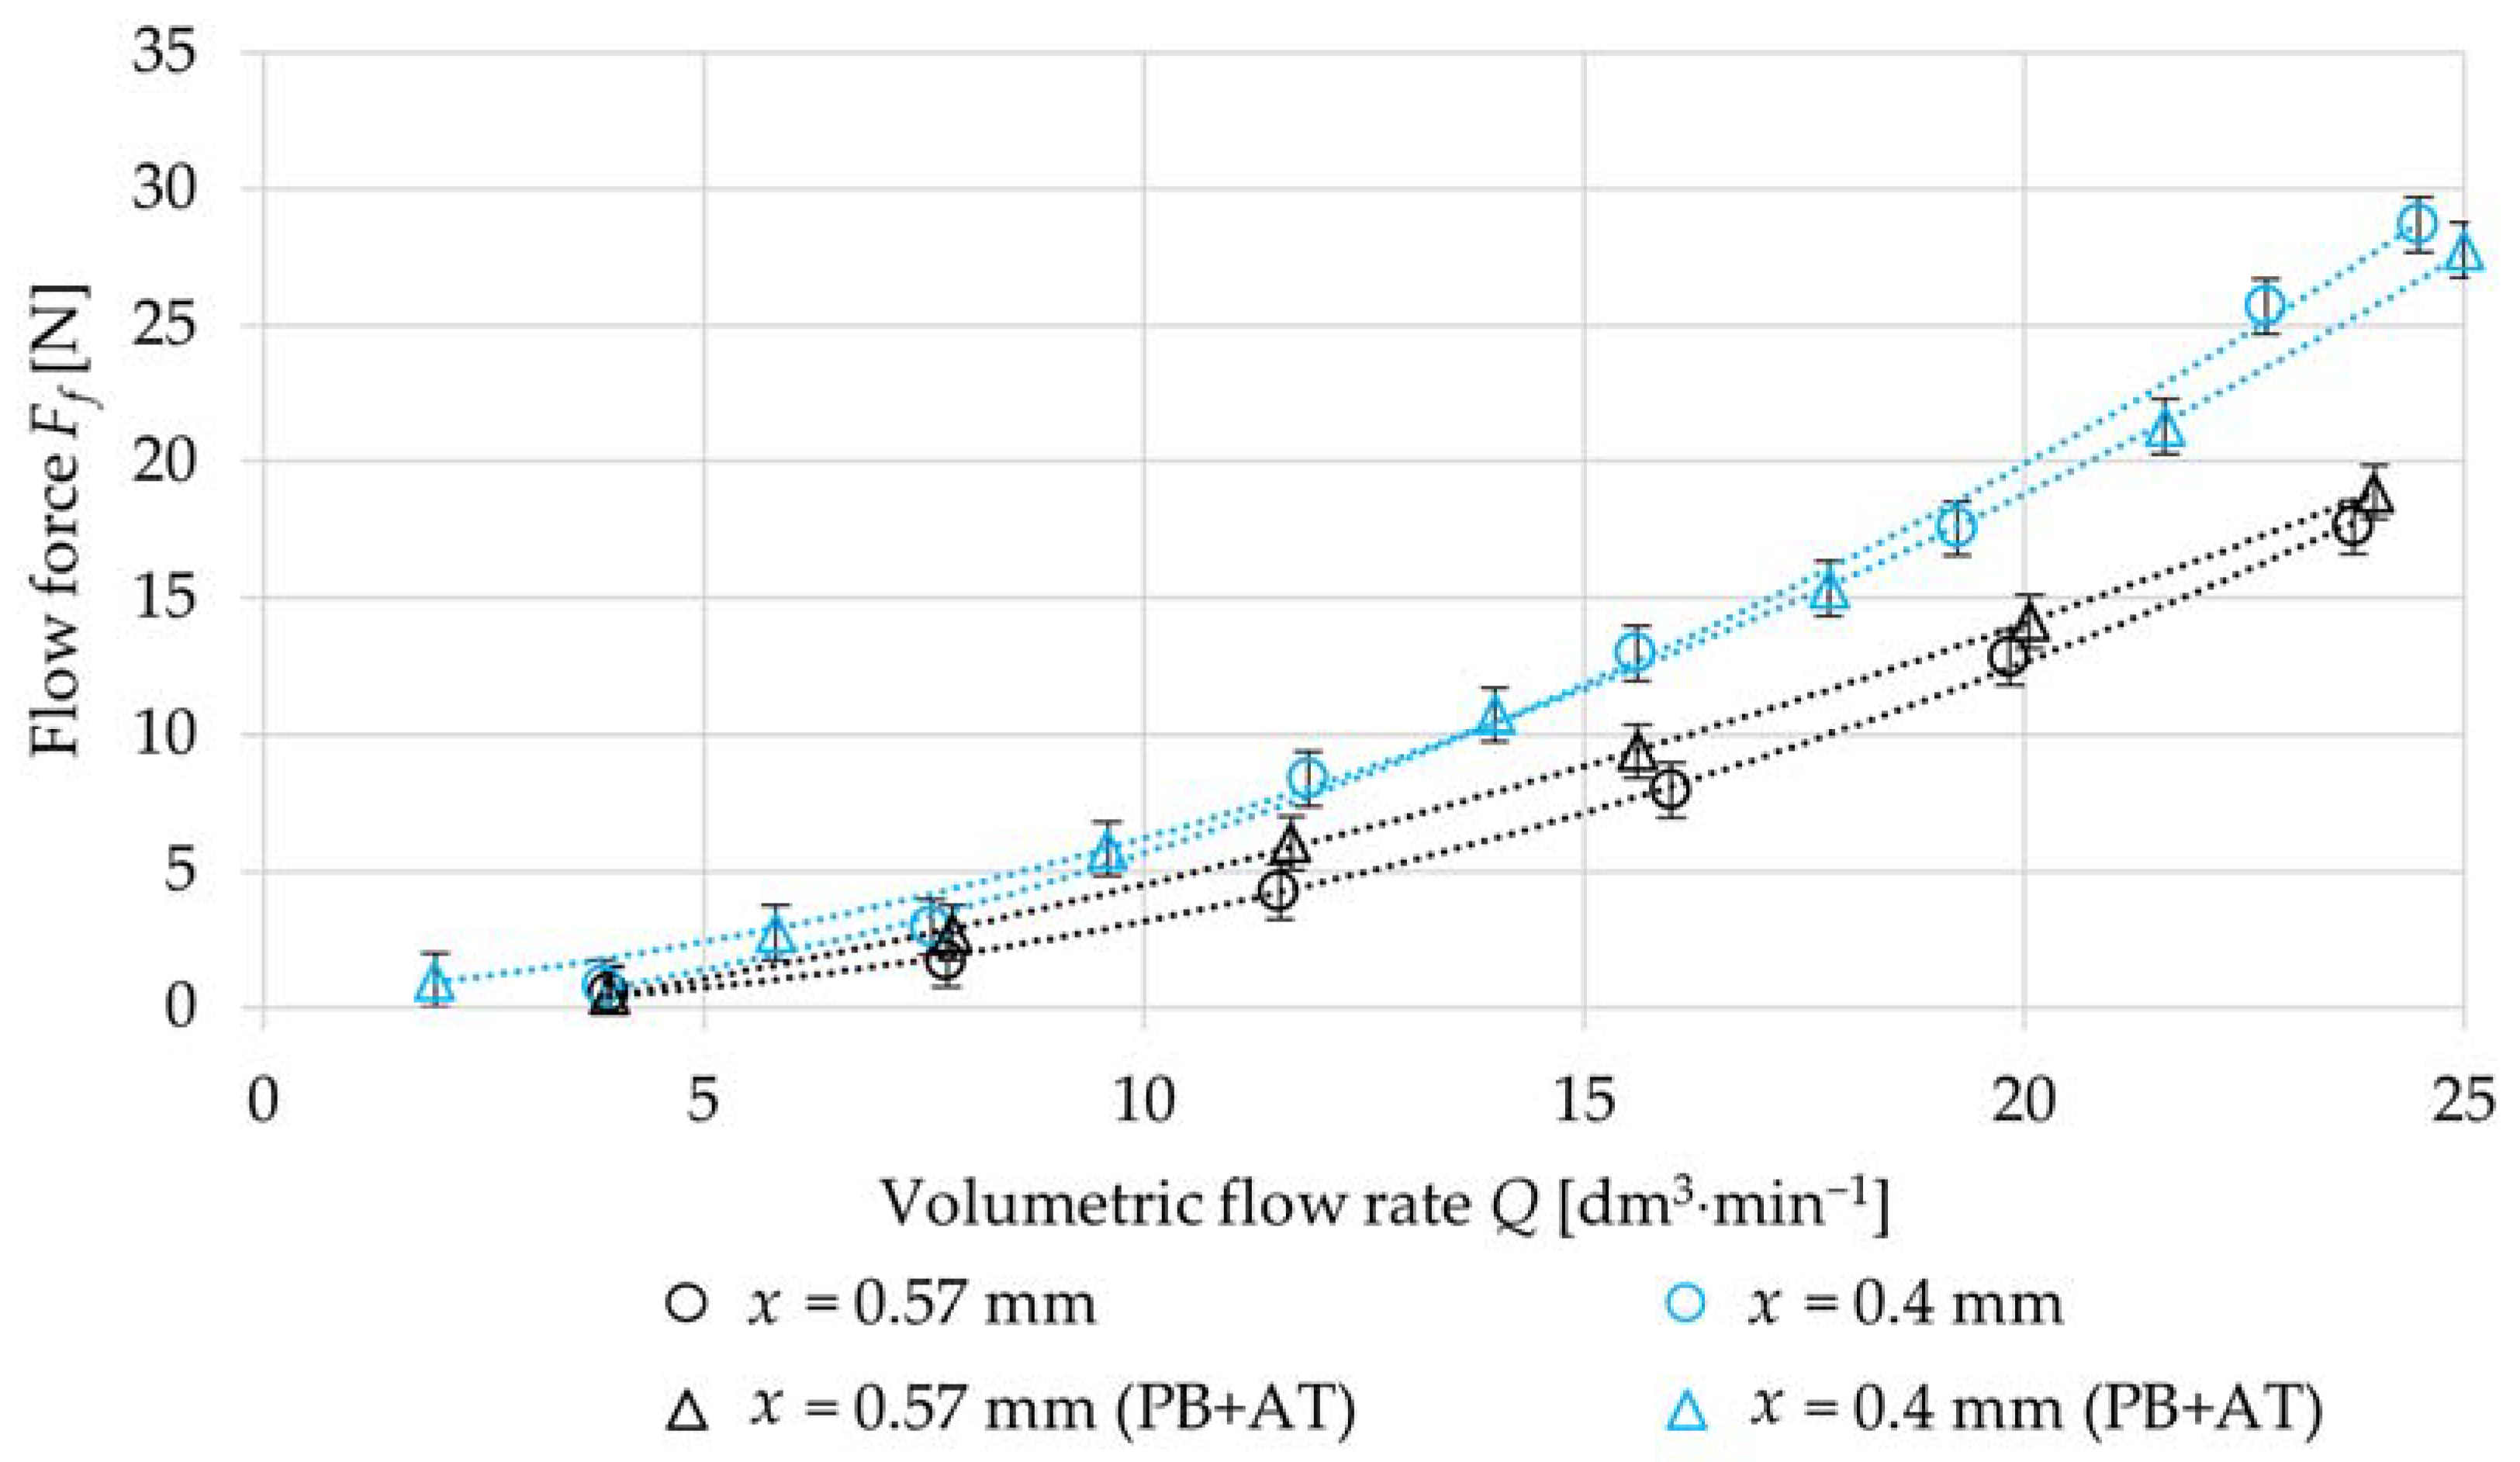
Figure 2b,c. Subsequently, measurements were performed to determine the flow force 
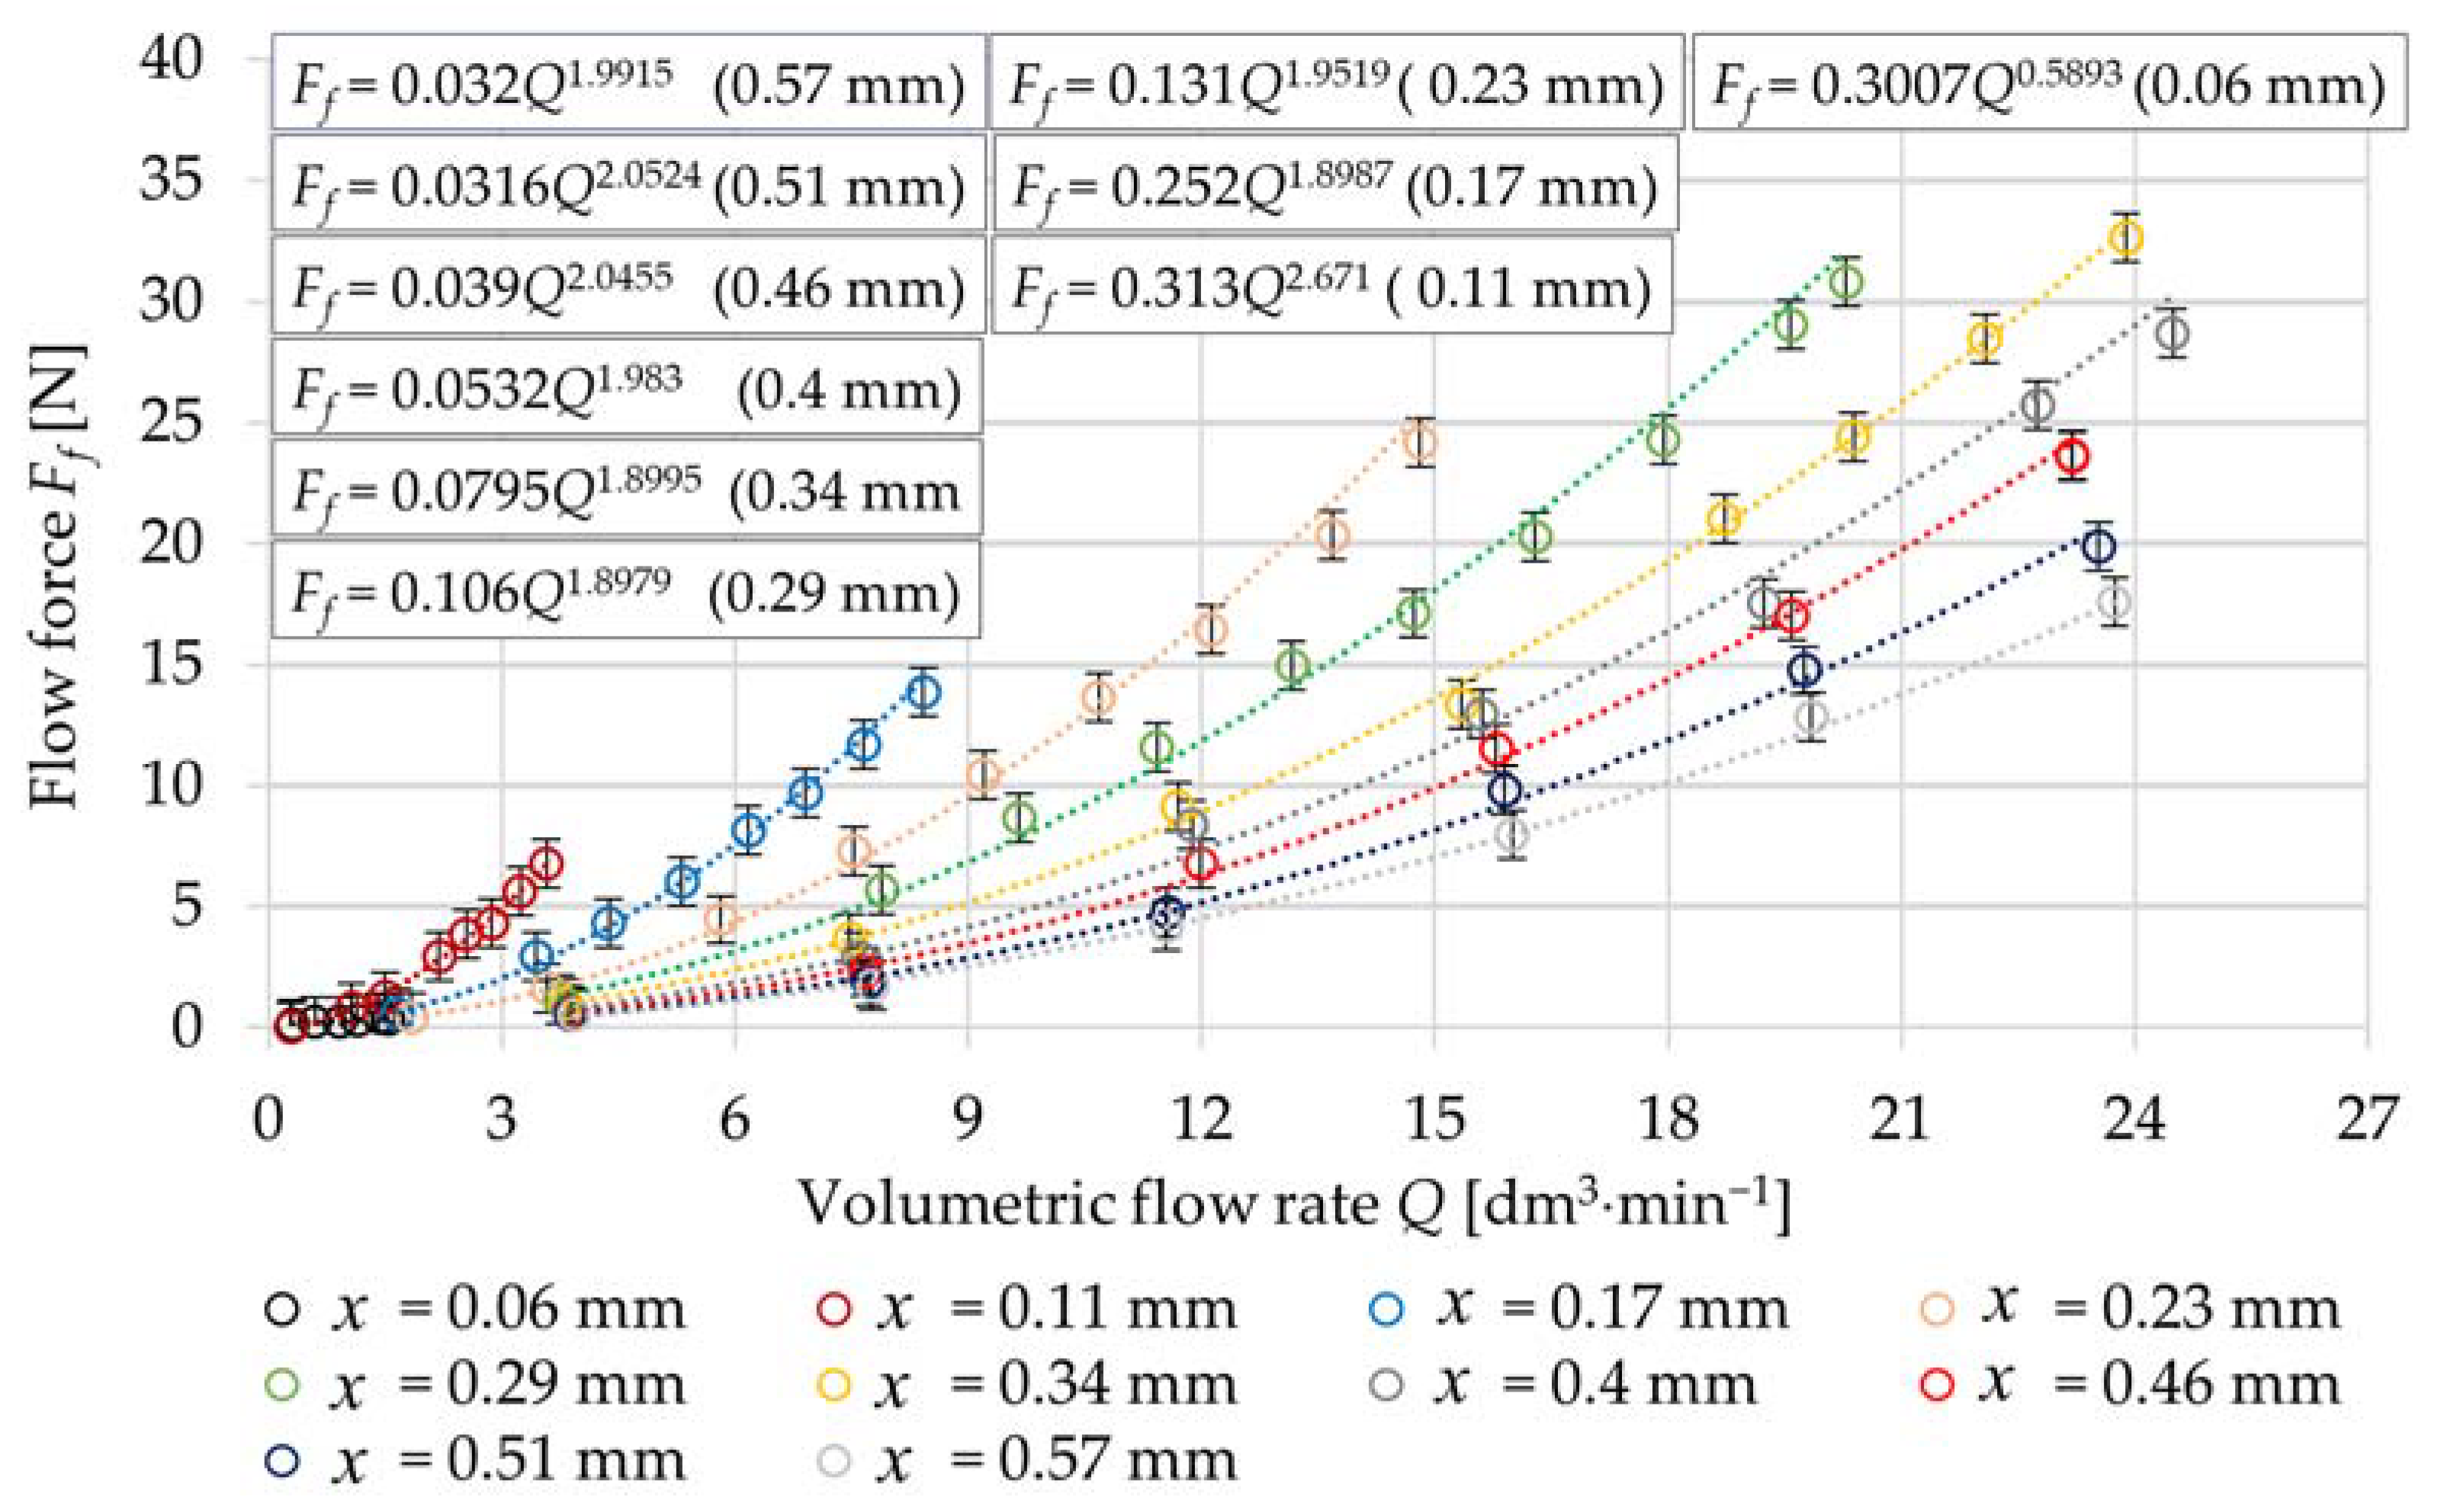
Ff that acts on the valve spool when oil passes through flow paths PB and AT simultaneously. The measurements were performed sequentially for several spool displacement x over the entire stroke range for flow paths PB and AT, resp. x = (0 ÷ 0.57) mm. The micrometer scale was used to set the desired position of the spool. However, it was necessary to establish a reference point. The middle position of the valve spool was chosen as a reference point. The symmetry of pA and pB pressures in valve chambers in blocked ports A and B was used to determine the middle position of the valve spool [7]. The digital deviation meter was used to verify the correct spool position. The measurement of the flow force was performed when the spool position was set and verified. The system pressure was set to pPV = 20 MPa. The volumetric flow rate Q in the hydraulic system was gradually increased by the variable displacement pump HP. The steady-state values of the pressures in individual ports of the valve, volumetric flow rate Q and flow force Ff were recorded using the MS5070 measuring instrument for each change of volumetric flow rate Q. The oil temperature was maintained at tO = (40 ± 1) °C during the entire measurement.

2.3. Numerical Simulation

Numerical simulations of the flow in the PRL2-06-32 proportional directional valve through P-B and A-T flow paths were performed in Fluent 2022 R2. The flow force, acting on the valve spool, was then evaluated for selected spool displacements from results of the numerical simulation.
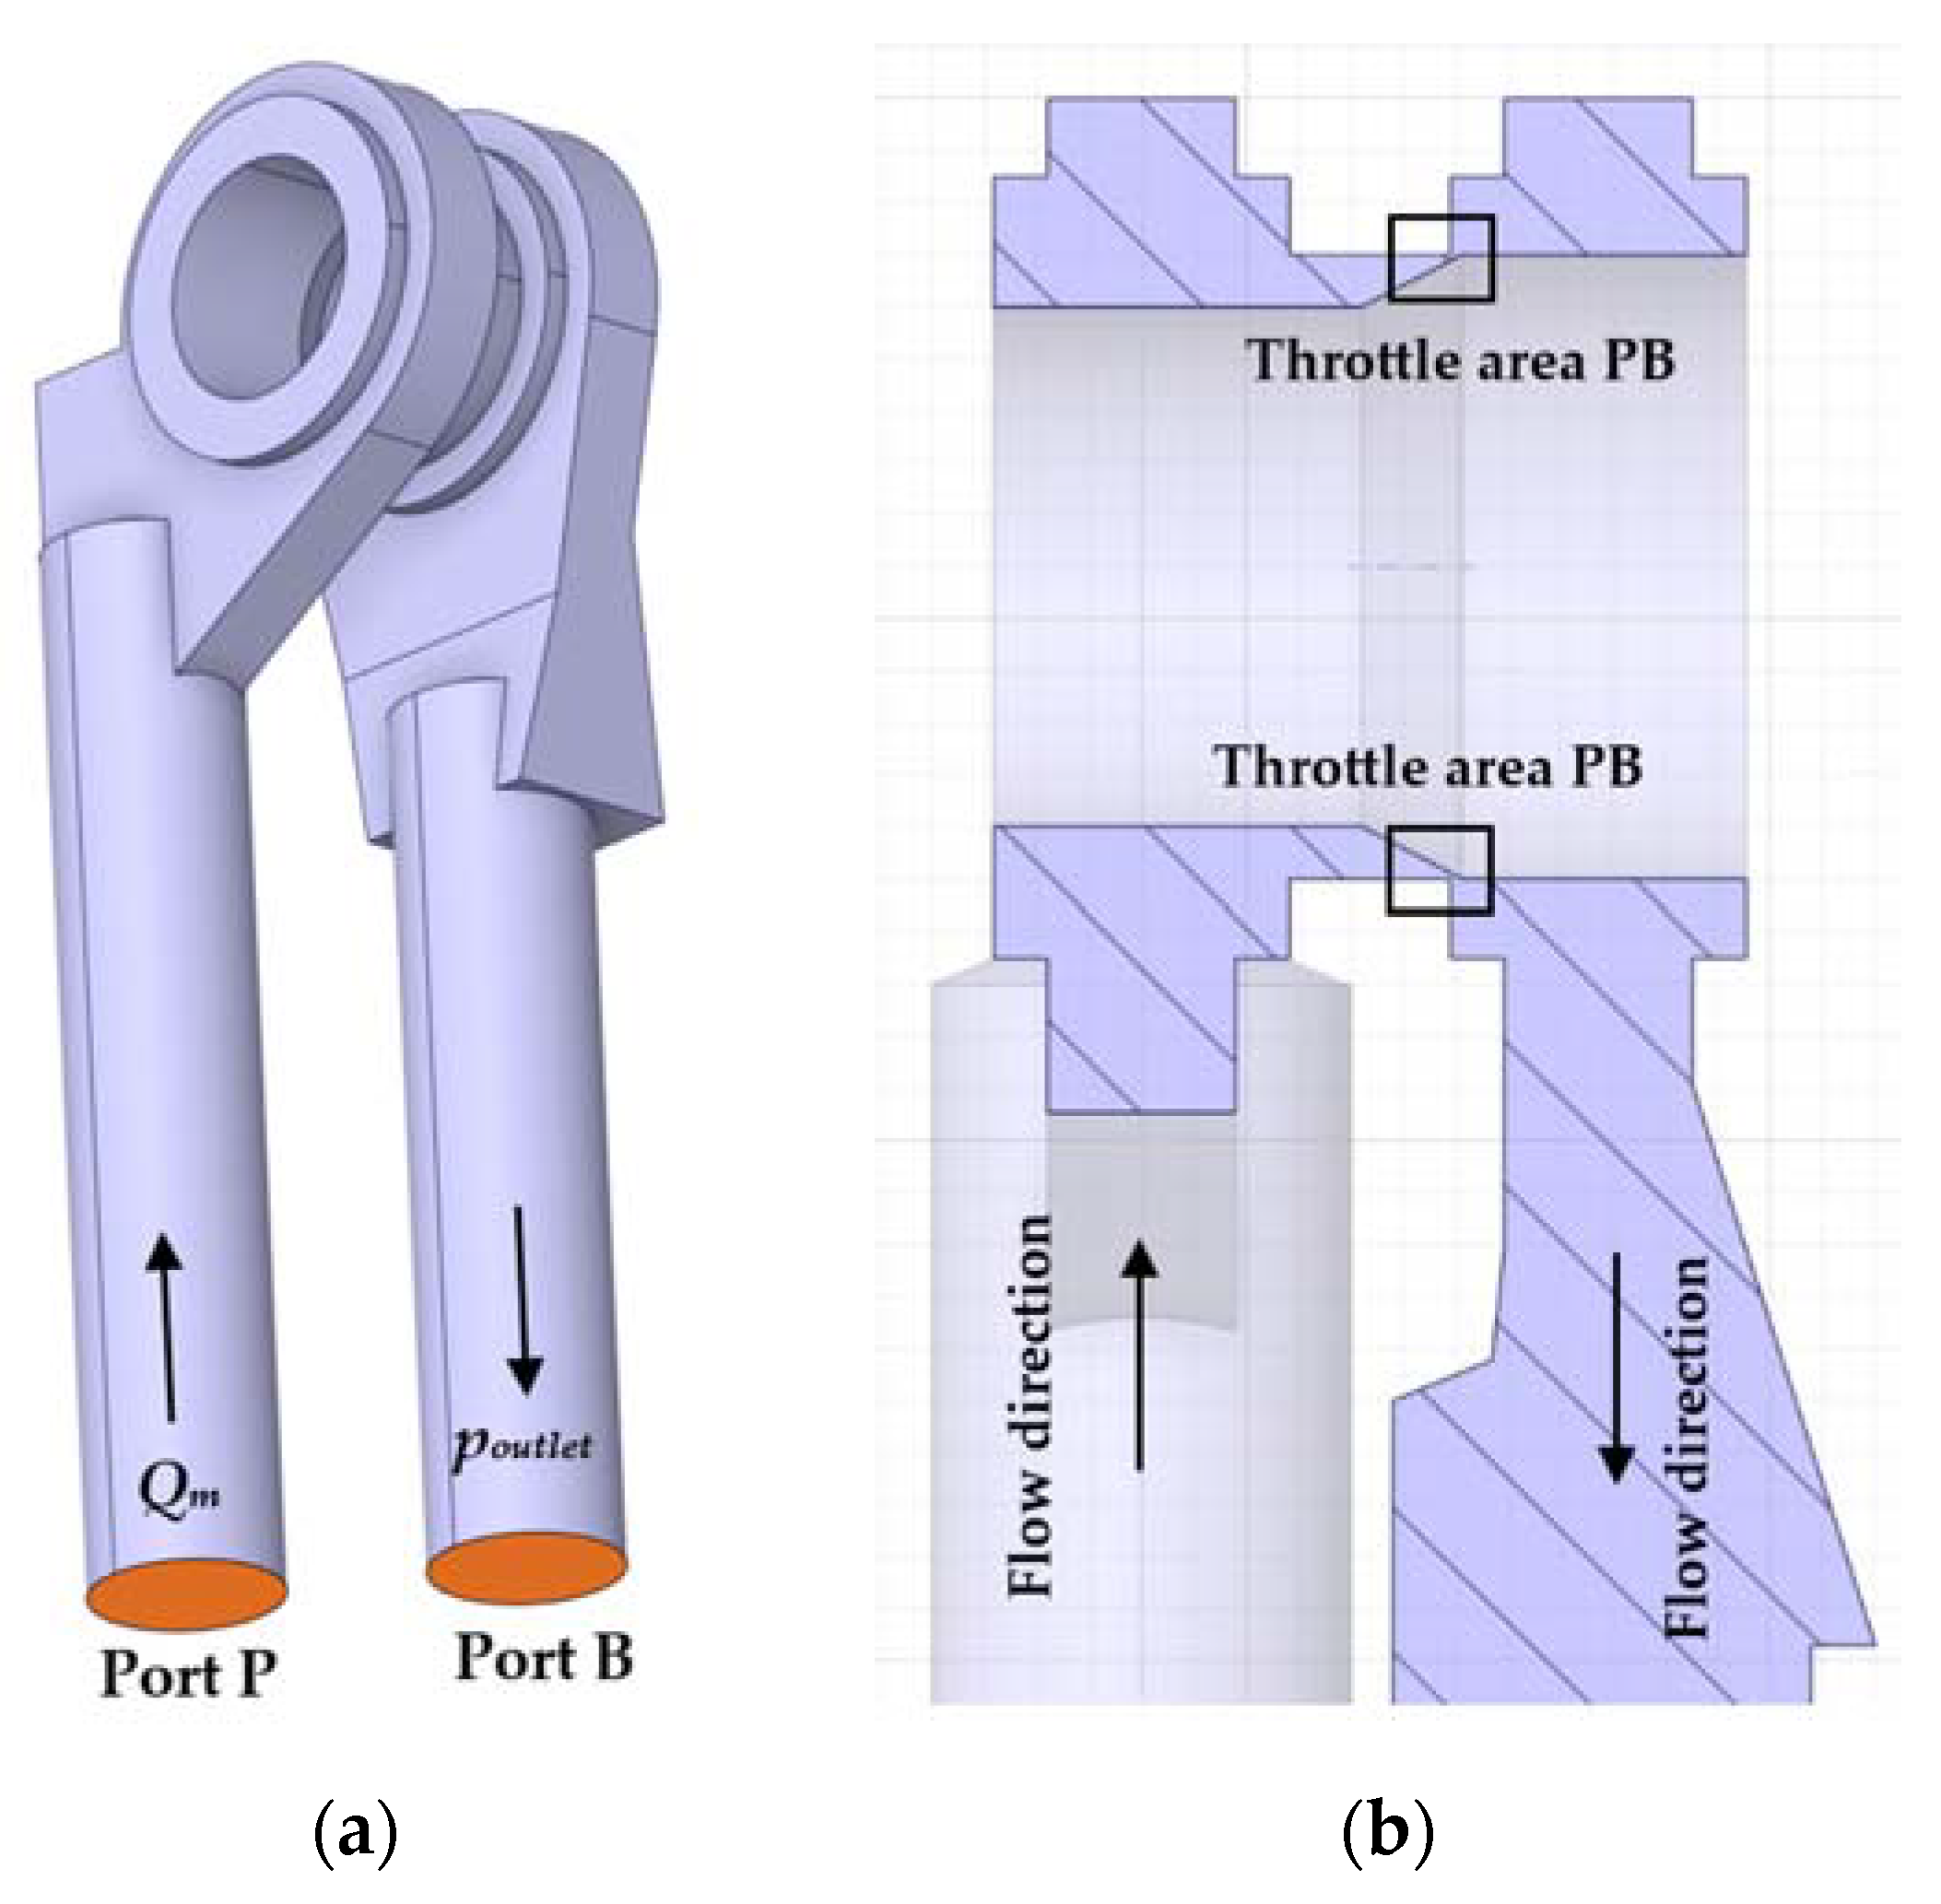
The 3D model of the investigated directional valve was used to create the flow geometry. Then, the created directional valve model was modified and simplified in SpaceClaim. The valve spool was set to the position corresponding to the required spool displacement, resp. of flow cross-section area. Simplification of the model was performed with respect to the number of cells and the quality of the computational mesh so that the flow path area was not affected, e.g., removal of technological curves, chamfers, etc. Fluid leakage due to radial clearance between the spool and the sleeve was neglected in the model. An inverse geometry of the flow path in the directional valve was created from the modified model. The inverse geometry was extended with input and output connection channels to match as closely as possible the real measurement geometry. Boundary conditions were defined on the inlet and outlet channels. The inlet boundary condition was defined by the mass flow rate Qm. The outlet boundary condition was defined by the outlet pressure poutlet. An example of the resulting PB flow path geometry with marked boundary conditions is shown in Figure 4a. Figure 4b shows an example of a longitudinal section of the flow path geometry with the throttle area which is marked by a box. The geometry of the flow path was created for two spool displacements x = (0.57; 0.4) mm.
The computational mesh for each geometry was created in Fluent Meshing; see 
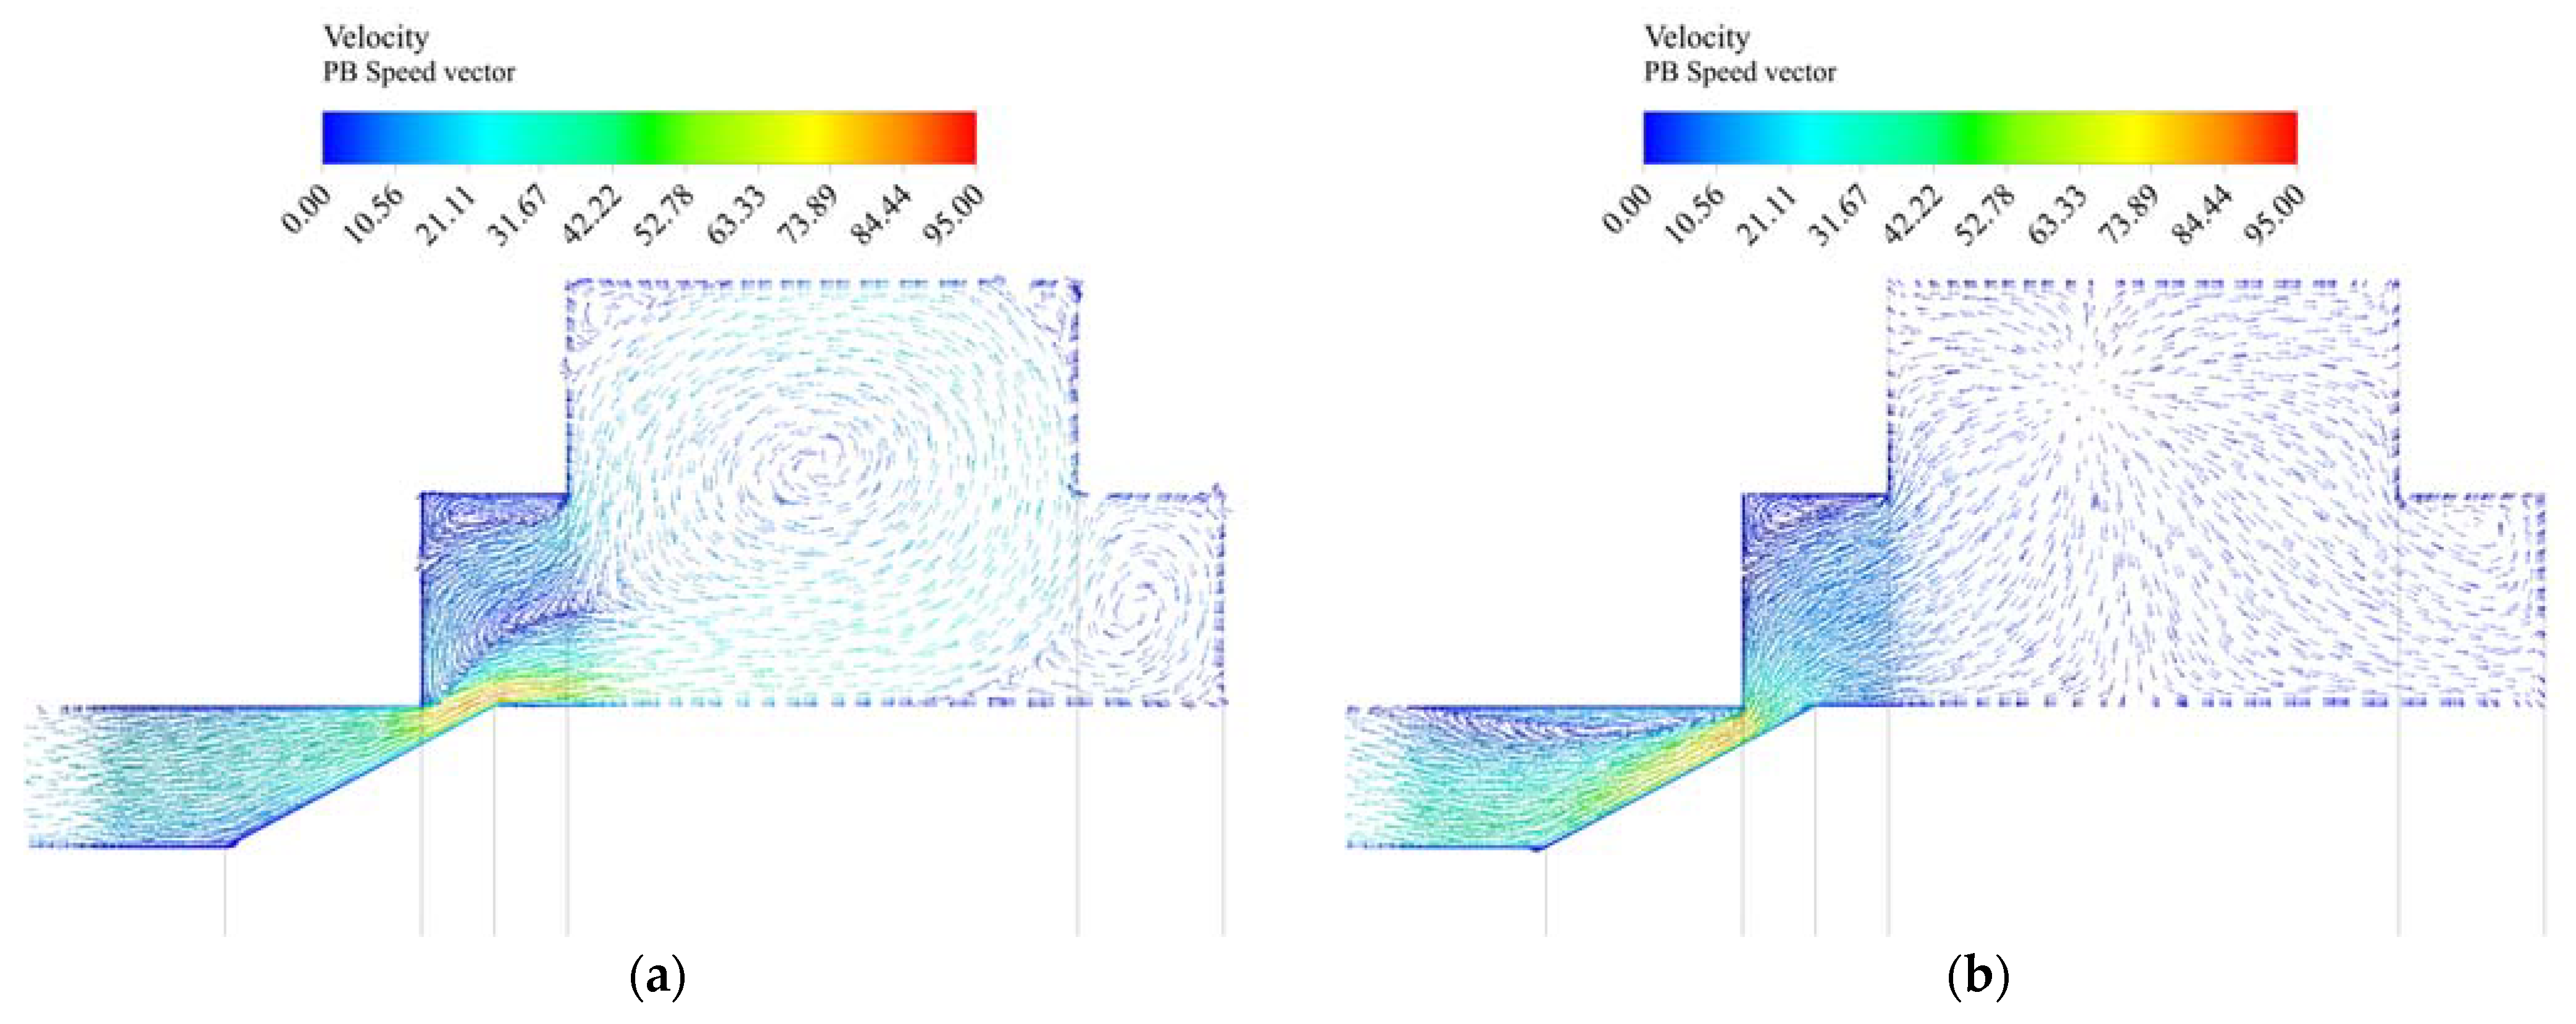
Figure 5. The computational mesh was created by polyhedral elements. The polyhedral mesh was used for the numerical simulation because of the smaller number of elements than, for example, a tetrahedral mesh. The global size of the computational mesh elements was set to 0.75 mm. The growth rate of the mesh was defined as 1.2. As part of the creation of the computational mesh, the total volume was divided into specific sub-volumes. The sub-volumes were located in the area of the throttle cross-section and the downstream of the throttle cross-section. These sub-volumes were created due to the possibility of refining the computational mesh in different flow regions. Different element sizes were set for each specific sub-volume. The size of the elements for the sub-volume in the throttle area was set with respect to the width of the throttle section. In the downstream area of the throttle section, the mesh was refined due to the possibility of fluid swirl in this area. A boundary layer was created near the walls.
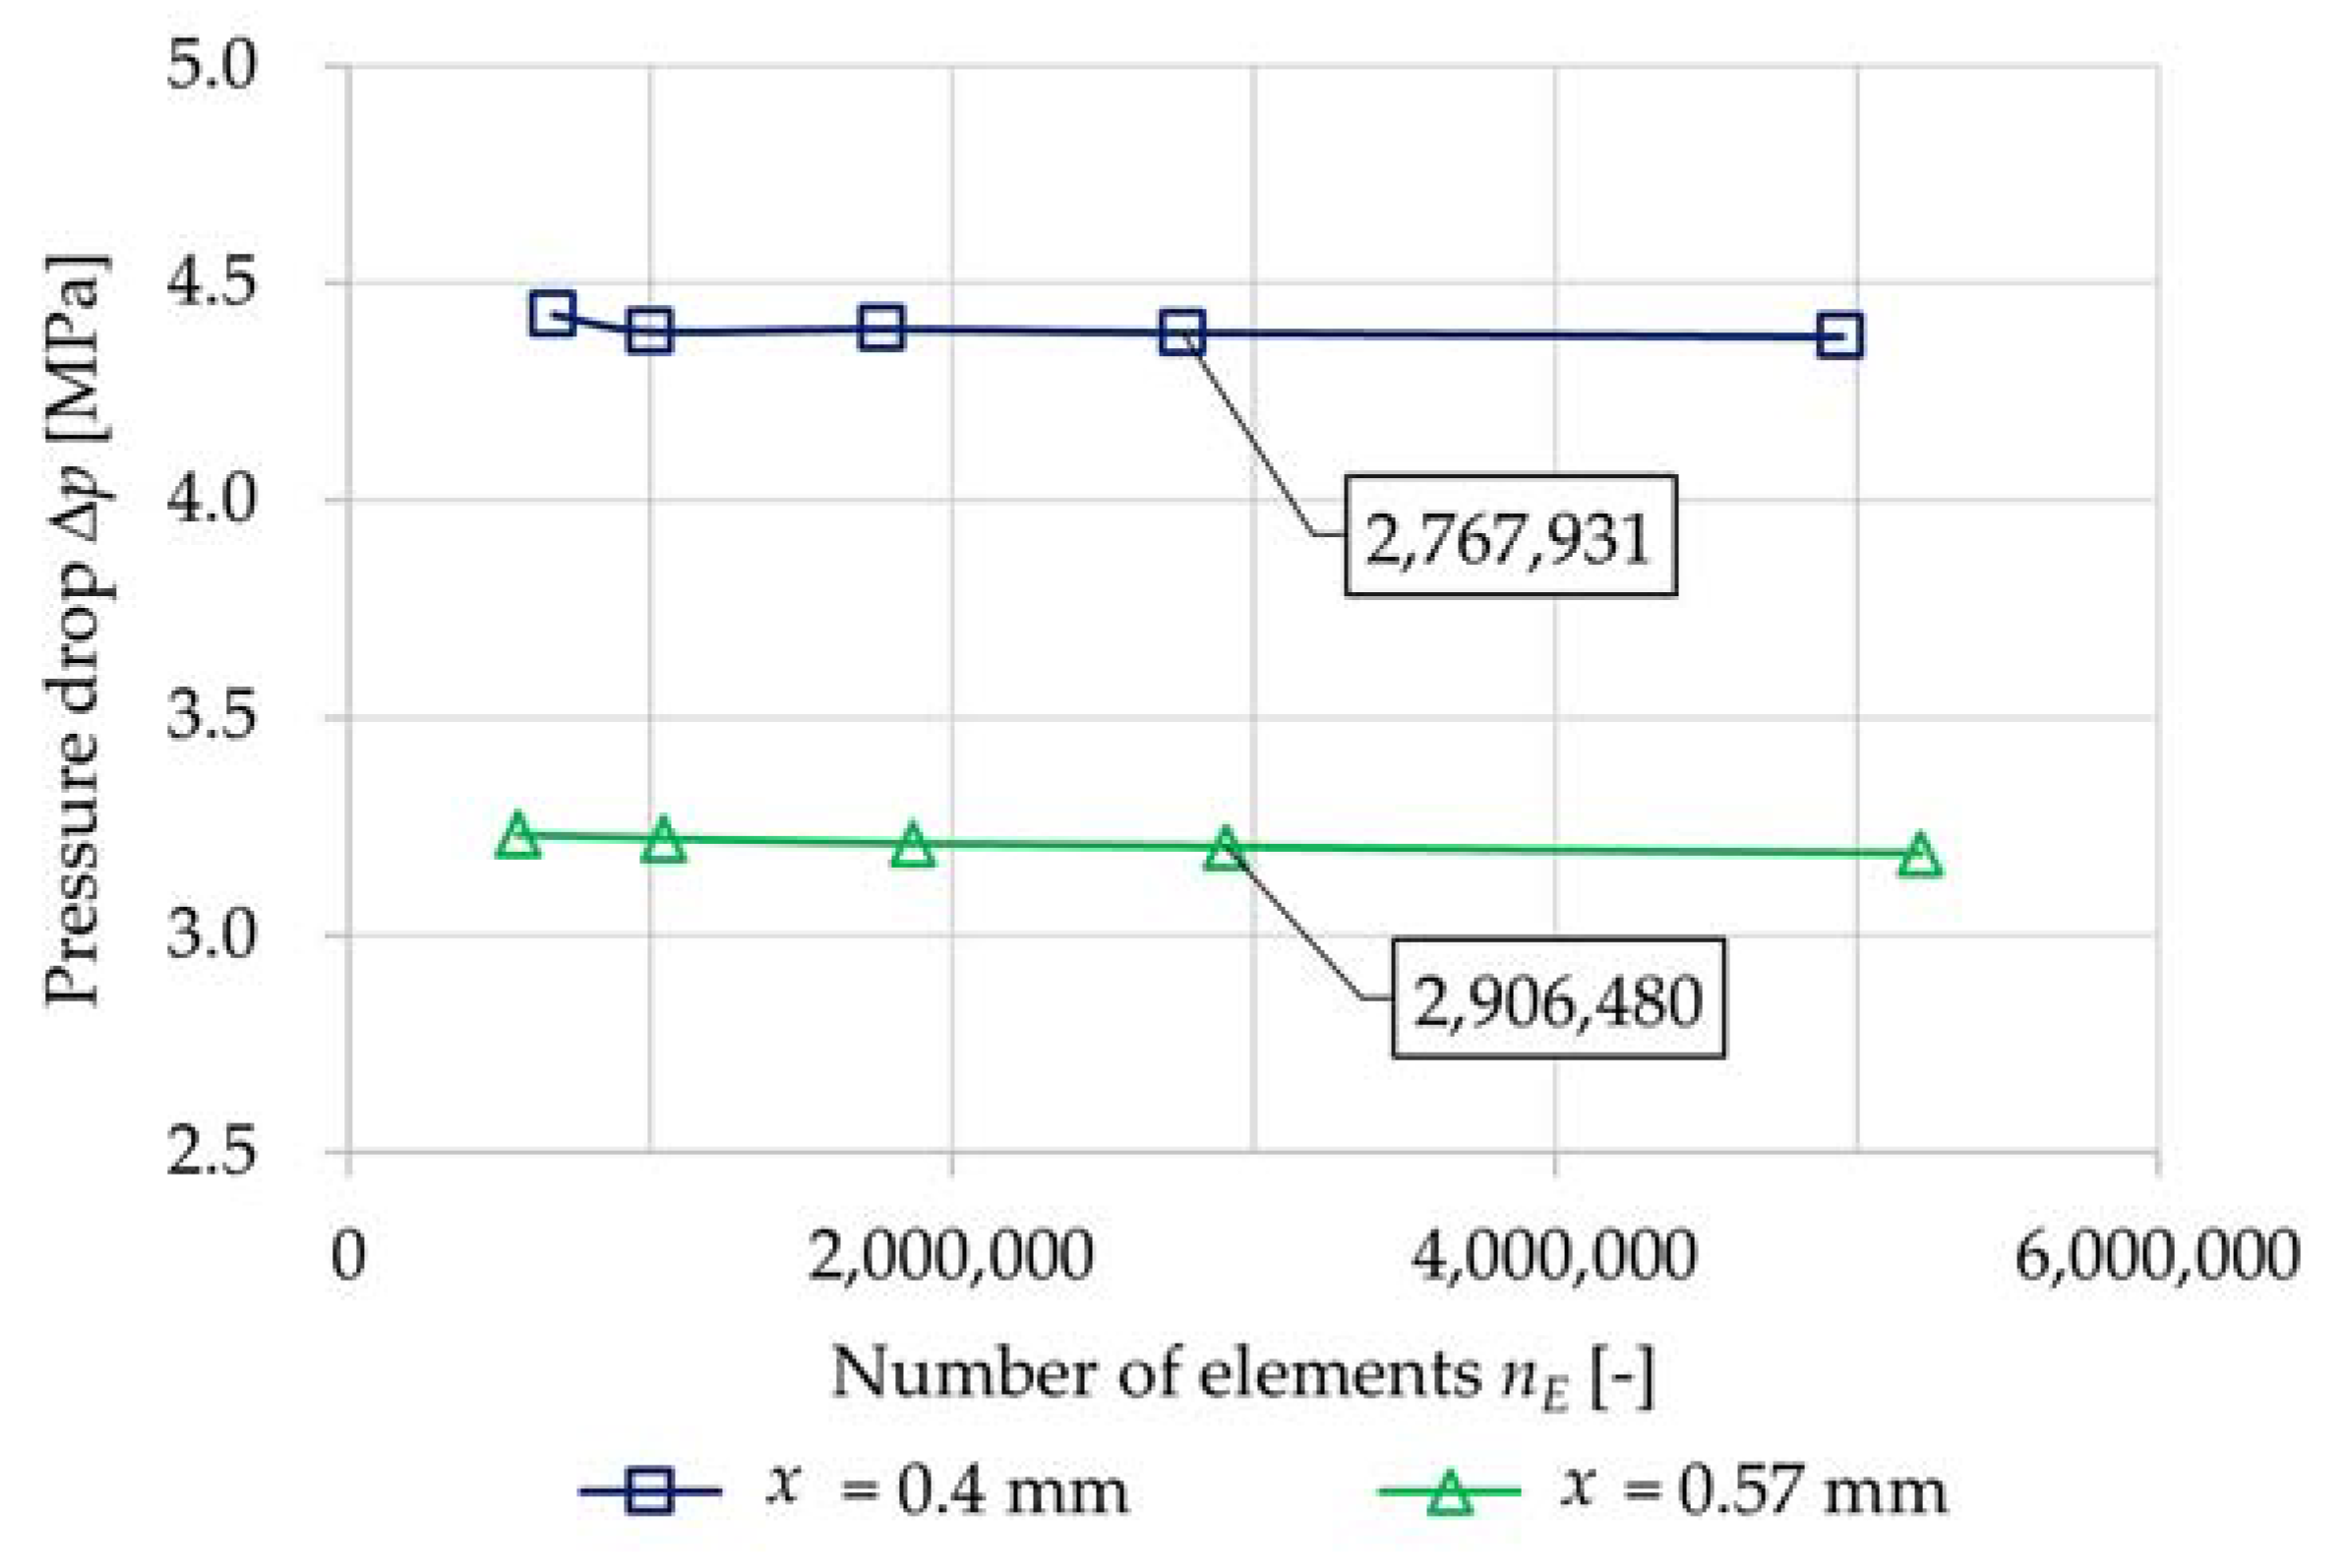
The basic setup of the computational mesh was then gradually adjusted by reducing the size of elements in specific sub-volumes, resp., by refining the coarse mesh in critical areas. The pressure drop Δp across the throttle cross-section and the flow velocity v in the throttle cross-section was monitored for each modification of the computational mesh. The refinement of the computational mesh and the evaluation of the monitored variables was always performed at the maximum mass flow rate for the given geometry. The resulting computational mesh was chosen with respect to the steady state of the monitored variables and the number of elements, which significantly affected the time consumption of the numerical simulation. The results of the convergence test are shown in Figure 6 and Figure 7. The quality of computational meshes was checked in relation to cell deformation using the Skewness parameter. The quality of computational meshes of each geometry was satisfactory.
In fluid mechanics, two types of flow can be characterized, laminar and turbulent flow. A characteristic feature of turbulent flow is the random fluctuations of the hydraulic parameters of the flow field, which are a function of both space and time. The boundary between laminar and turbulent flow is defined by the Reynolds number (4) and depends on the nature of the problem to be solved and the specific conditions.
R e = v   d h   ρ η ,
where v is the flow velocity in the throttle cross-section area, dh is the hydraulic diameter corresponding to the throttle cross-section, ρ is the oil density and η is the dynamic viscosity.
In terms of the magnitude of the Reynolds number, it has been determined that turbulent flow occurs in the flow paths. Therefore, the k-ε RANS (RNG) model was used for the numerical simulations. This is a turbulence model constructed from two differential equations. The first equation is used to calculate the turbulent kinetic energy k (5), and the second equation is used to determine the turbulent kinetic energy dissipation rate ε (6) [19].
k = 1 2 ( u 1 2 ¯ + u 2 2 ¯ + u 3 2 ¯ ) ,
ε = ν u l x k u l x k ¯ .
The RNG k-ε-based turbulence model is derived from the instantaneous Navier–Stokes equations, using a mathematical technique called renormalization group (RNG) method. The turbulent kinetic energy k and the turbulent kinetic energy dissipation rate ε appear in the following transport equations [19,20,21].
t ρ k + x i ρ k u i = x j α k μ e f f k x j + G k + G k ρ ε Y M + S k ,
t ρ ε + x i ρ ε u i = x j α ε μ e f f ε x j + C 1 ε ε k G k + C 3 ε G b C 2 ε ρ ε 2 k R ε + S ε ,
where Gk represents the generation of turbulent kinetic energy due to the mean velocity gradients, Gb is the generation of turbulent kinetic energy due to buoyancy, Ym represents the contribution of the fluctuating dilatation in compressible turbulence to the overall dissipation rate. The quantities αk and αε are the inverse effective Prandtl numbers for k and ε, Sk and Sε are user-defined source terms and C1ε, C2ε and C are constant.
The steady-state solver was used for the numerical solution. To ensure greater stability and robustness of the numerical calculation, a pressure-based coupled algorithm was defined to solve the interdependence between flow velocity and pressure. Second order interpolation schemes were defined to ensure greater accuracy of the numerical solution when solving the spatial discretization. The values of boundary conditions for each spool displacement corresponded to the experiment; see Table 2. The physical properties of the oil were set for the temperature tO = 40 °C, at which the experiment was performed.
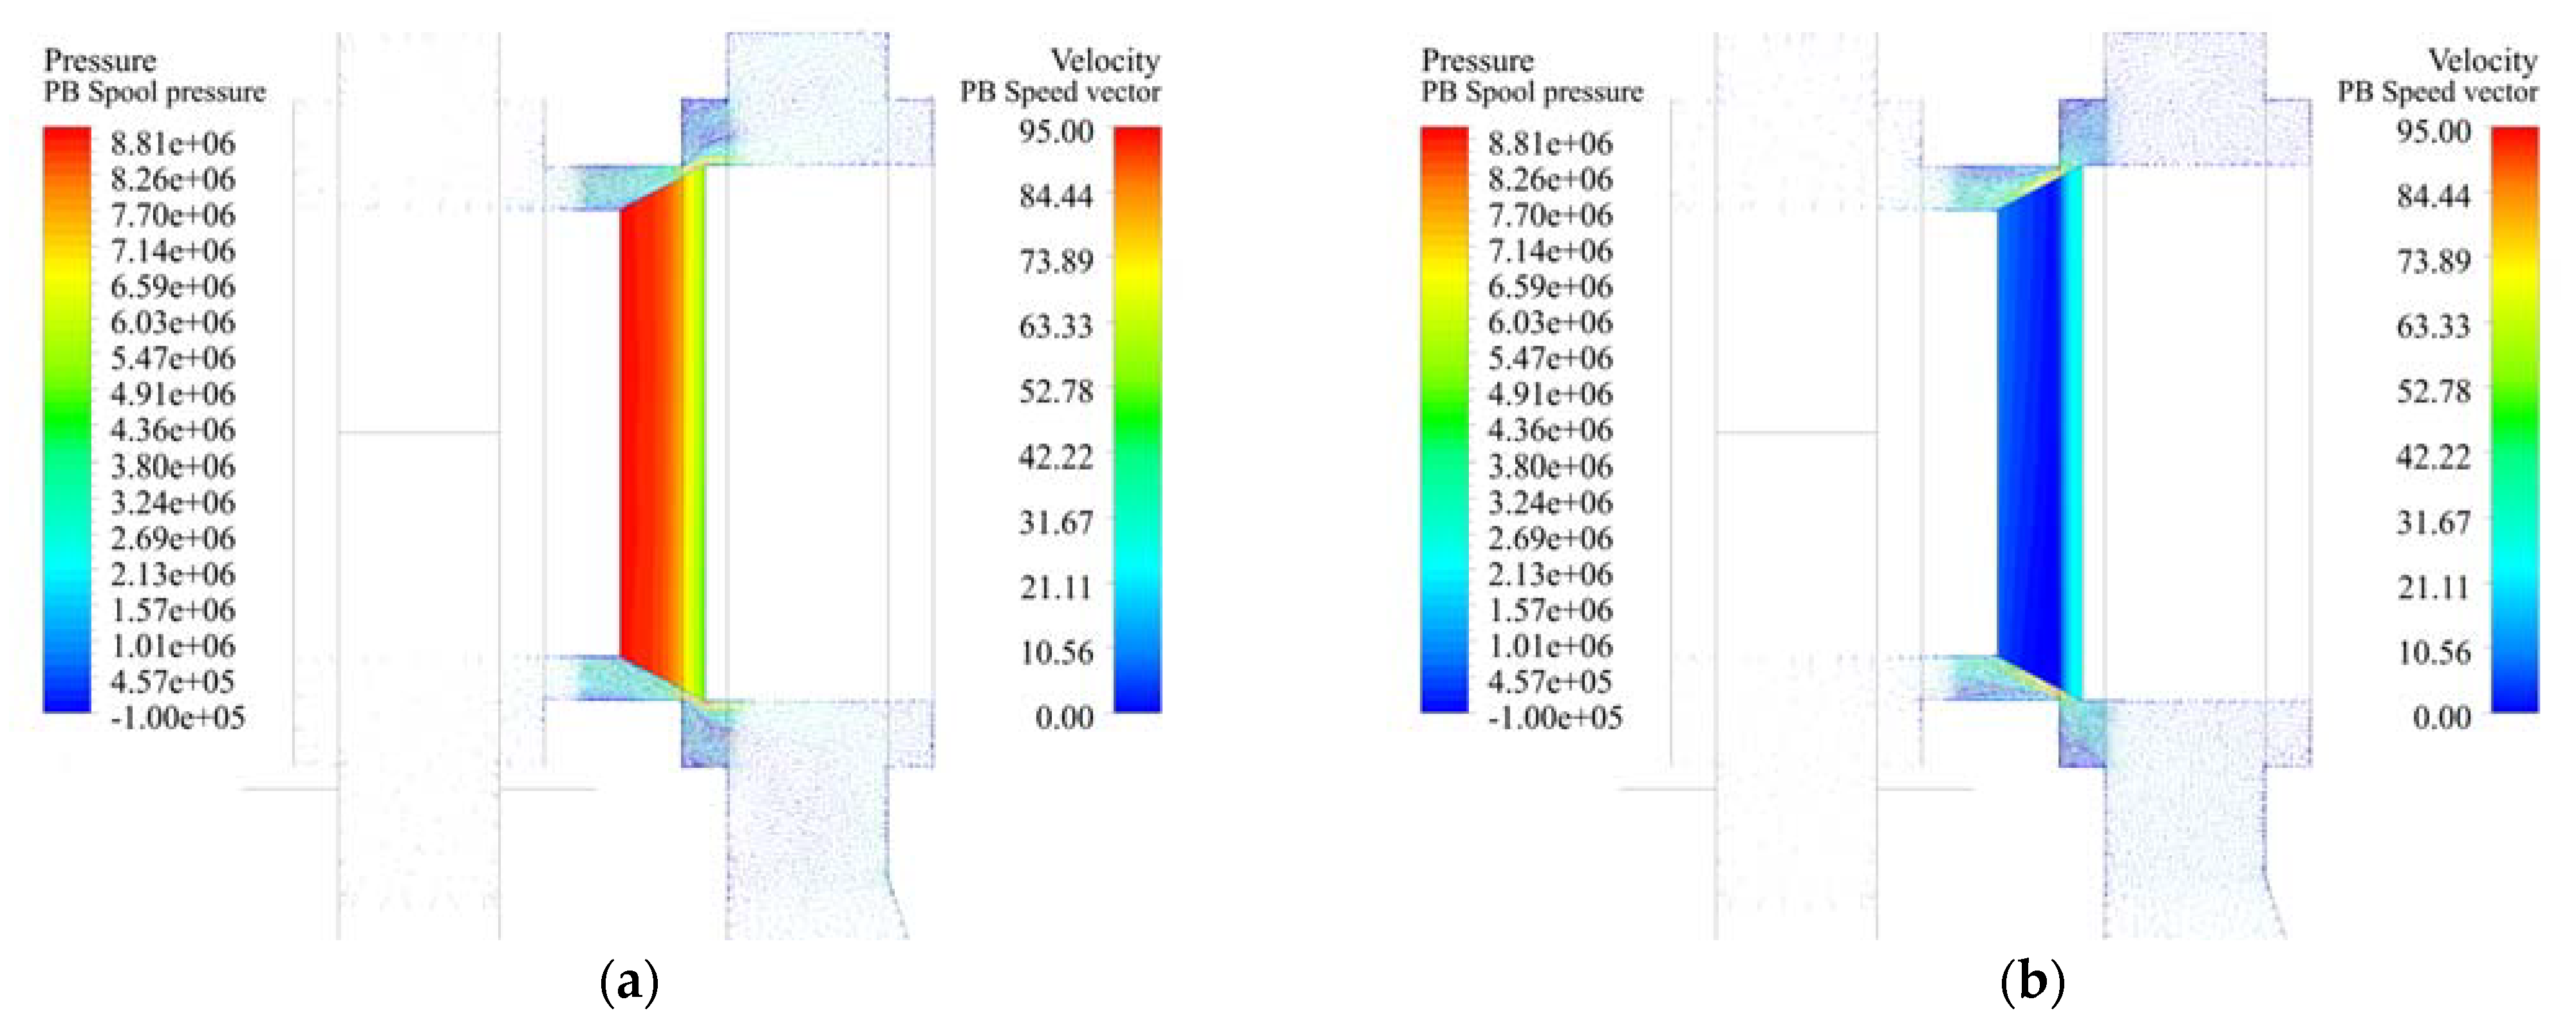
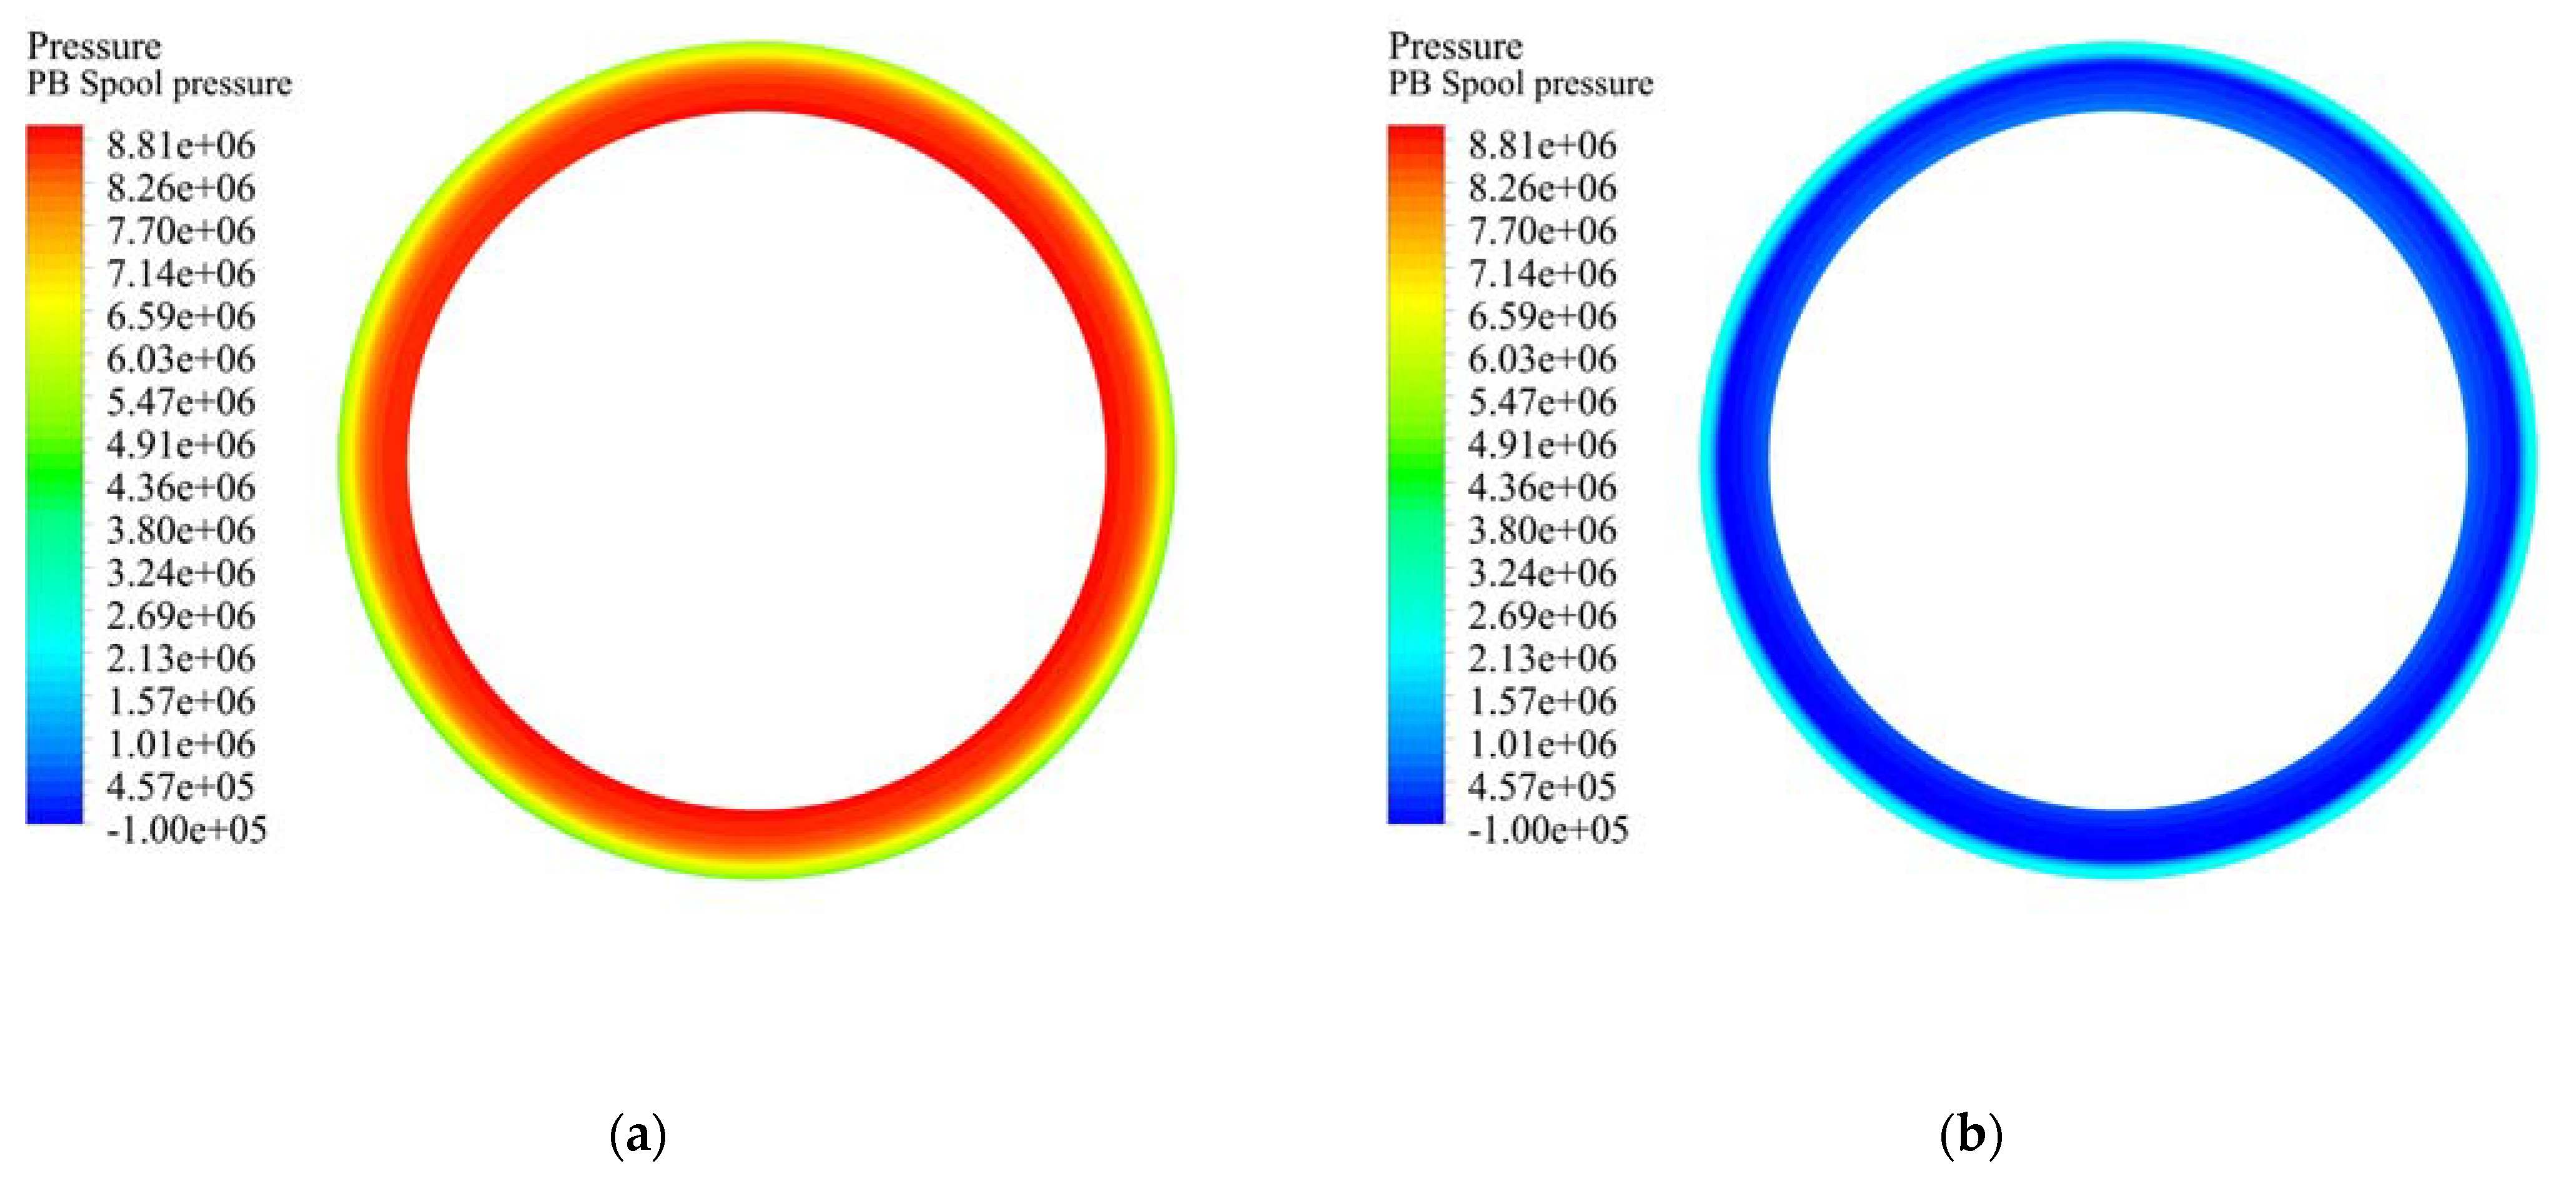
The arising forces from the oil flow, acting on the chamfered surface of the valve spool, were determined from numerical simulations. The resulting flow forces were evaluated as the difference between the axial force acting on the chamfered surface of the spool in the direction of oil flow and the pressure force acting on the opposite chamfered surface. The force from the oil pressure was not affected by the flow. The chamfered area, which was unaffected by flow, was not included to reach simplification of the model geometry and computational mesh. The oil pressure force, acting on this surface, was then determined in the horizontal direction. The area for the calculation was defined as the projection of the chamfered surface into the vertical plane and the static pressure near the chamfered surface was determined from the numerical simulation.

3. Results and Discussion

3.1. Experimental Measurements

Figure 8 shows the dependence of the flow force Ff on the volumetric flow rate Q for the case when the oil passes through each flow path separately (PB, AT). Next, the graph shows the dependencies of the resulting flow forces Ff that were determined as the sum of individual flow forces during the flow through each flow path, PB and AT, separately (PB + AT in Figure 8). It was found from the measurements that the flow force on the spool is much greater when the oil passes through the flow path PB in comparison to the oil flow through the flow path AT. The flow force during oil flow in the PB direction forms a substantial part of the resulting flow force.
The resulting flow forces Ff, which were determined by the sum of the flow forces for the individual flow paths PB and AT, are compared with the results from when the oil passes through the entire valve in the direction PB–AT; see Figure 9. The comparison of the resulting flow forces Ff shows that there is only a slight deviation between the differently determined flow forces for the same spool displacement x. This deviation could be caused by the measurement accuracy.
Figure 10 shows the experimentally determined dependencies of resulting flow forces Ff on the volumetric flow rate Q when the oil passes through both flow paths in the direction PB–AT for different spool displacements in the range x = (0 ÷ 0.57) mm.
The flow force was also evaluated using dimensionless groups. These are the dimensionless spool displacement x1, dimensionless pressure drop p1, dimensionless volumetric flow rate Q1 and dimensionless flow force F1. The individual dimensionless groups are expressed using Equations (9)–(12):
x 1 = x x m a x ,
p 1 = p P B + p A T p N ,
Q 1 =   x 1 · p 1 ,
F 1 = Q 1 2 x 1 =   ( x 1 · p 1 ) 2 x 1 = x 1 · p 1 ,
where x is the actual spool displacement, xmax is the maximum spool displacement, ΔpPB and ΔpAT are the pressure drops at the throttle edges and pN is the nominal pressure of the proportional directional valve.
Figure 11 shows the dependence of the flow force on the volumetric flow rate for different spool displacements using dimensionless groups.

3.2. Numerical Simulation

The flow force was determined by numerical simulation for the individual flow paths of the valve PB and AT. The following graphs compare the numerically and experimentally determined dependencies of the flow force Ff on the volumetric flow rate Q. The comparison is performed for two spool displacements: x = (0.57; 0.4) mm. Figure 12 compares the measured and numerically simulated flow forces Ff for the PB flow path. It can be seen from the comparison that numerically determined dependencies follow the trend of experimentally determined dependencies. There is a minimal deviation between the measurement and the numerical simulation for each spool displacement. Figure 13 compares the measured and numerically simulated flow forces Ff for the AT flow path. It can be seen from the comparison that there are deviations between the measurement and the numerical simulation. The deviations can be caused by the magnitude of the flow force and the accuracy of the used force sensor. The measurement accuracy of the used sensor is ±2% of the full scale (i.e., ±1 N). The determined flow forces by numerical simulation are within the error range. The range was defined by the force sensor accuracy. Figure 14 compares the measured and numerically simulated flow forces Ff for oil flow through the entire valve (flow path PB + AT). It can be said from the comparison of resulting flow forces Ff that the numerical simulations and the experiment measurements are in good agreement. The created CFD model can be used to analyse the flow in the directional valve and modify the geometry of the flow paths.
The numerical simulations also resulted in the visualization of the flow field in the throttle edge area and the valve spool pressure load. The visualization was performed for the PB and AT flow paths at the maximum spool displacement of x = 0.57 mm. The boundary conditions for the PB flow path are Qm = 0.339 kg·s−1 and poutlet = 2.55 MPa. The boundary conditions for the AT flow path are Qm = 0.339 kg·s−1 and poutlet = 0 MPa. Figure 15 shows the complex visualization of the flow field in a longitudinal section of the throttle edge area. Figure 16 shows the valve spool pressure load. It can be said from the comparison of the valve spool pressure loads for the paths PB and AT that the valve spool pressure load is affected by the direction of oil flow through the throttle edge. Figure 17 shows velocity vectors in the throttle edge area.

4. Conclusions

The purpose of this paper was to analyse the flow force acting on the valve spool of the proportional directional valve. The dependence of the valve spool flow force on the volumetric flow rate was measured as a part of the experiment. Measurements for the determination of the flow force were performed for three different flow path connections of the directional valve. Firstly, the flow force during oil flow through the PB and AT flow paths was determined separately. Subsequently, the flow force of the oil flow through both flow paths was determined simultaneously. The flow force was determined as a function of the volumetric flow rate for several spool displacements. The measurements were performed at oil temperature tO = (40 ± 1) °C. Subsequently, numerical simulations of the flow through the directional valve were performed to determine the flow force acting on the valve spool. The following conclusions were obtained:
(1)
The flow force, acting on the valve spool when oil passes through the PB flow path, is much greater than in the case of flow through the AT flow path. The difference in the magnitude of the flow force is due to the different valve spool pressure load. The valve spool pressure load is affected by the direction of oil flow through the throttle cross-section.
(2)
The CFD model for flow analysis in the flow paths of the directional valve was verified by measurements. The results of the numerical simulations showed good agreement with the measurements. The CFD model can be used to analyse the flow field in the directional valve and innovate the geometry of the flow paths.
The results of the flow force analysis will be further used for the definition of a complex 1D mathematical model of the investigated proportional directional valve with the possibility of its parametrization. The measurement methodology and the evaluated results can be used in the design or optimization of spool valves.

Author Contributions

Conceptualization, M.L., L.H. and A.B.; methodology, M.L., A.B. and T.P.; validation, M.L., A.B. and F.D.; formal analysis, M.L. and L.H.; investigation, M.L., L.H., A.B. and D.K.; resources, M.L., F.D. and D.K.; data curation, M.L. and F.D.; writing—original draft preparation, M.L.; writing—review and editing, M.L. and A.B.; visualization, M.L. and T.P.; supervision, L.H. and A.B.; funding acquisition, L.H. All authors have read and agreed to the published version of the manuscript.

Funding

This work was supported by the European Regional Development Fund in the Research Centre of Advanced Mechatronic Systems project, project number CZ.02.1.01/0.0/0.0/16_019/0000867 within the Operational Programme Research, Development and Education” and “The work presented in this paper was supported by a grant SGS”. Experimental methods for fluid mechanisms mathematical models verification “SP2023/015”.

Data Availability Statement

The data presented in this study are available on request from the corresponding author.

Conflicts of Interest

The authors declare no conflict of interest.

References

  1. Li, S.; Du, J.; Shi, Z.; Xu, K.; Shi, W. Characteristics Analysis of the Pilot-Operated Proportional Directional Valve by Experimental and Numerical Investigation. Energies 2022, 15, 9418. [Google Scholar] [CrossRef]
  2. Rybarczyk, D.; Milecki, A. The Use of a Model-Based Controller for Dynamics Improvement of the Hydraulic Drive with Proportional Valve and Synchronous Motor. Energies 2022, 15, 3111. [Google Scholar] [CrossRef]
  3. Vašina, M.; Hružík, L.; Bureček, A. Energy and dynamic properties of hydraulic systems. Teh. Vjesn. 2018, 25, 382–390. [Google Scholar]
  4. Bury, P.; Stosiak, M.; Urbanowicz, K.; Kodura, A.; Kubrak, M.; Malesińska, A. A Case Study of Open- and Closed-Loop Control of Hydrostatic Transmission with Proportional Valve Start-Up Process. Energies 2022, 15, 1860. [Google Scholar] [CrossRef]
  5. Li, Y.; Li, R.; Yang, J.; Yu, X.; Xu, J. Review of Recent Advances in the Drive Method of Hydraulic Control Valve. Processes 2023, 11, 2537. [Google Scholar] [CrossRef]
  6. Qu, D.; Zhou, Y.; Liu, Y.; Luo, W.; Zhang, F. Steady flow force compensation and test research on electrohydraulic proportional relief valve. IEEE Access 2019, 7, 48087–48097. [Google Scholar] [CrossRef]
  7. Lisowski, E.; Filo, G.; Rajda, J. Analysis of flow forces in the initial phase of throttle gap opening in a proportional control valve. Flow Meas. Instrum. 2018, 59, 157–167. [Google Scholar] [CrossRef]
  8. Rajda, J.; Lisowski, E. Flow forces acting on the spool of directional control valve. Czas. Tech. 2013, 5, 349–356. [Google Scholar]
  9. Domagala, M.; Fabis-Domagala, J. A Review of the CFD Method in the Modeling of Flow Forces. Energies 2023, 16, 6059. [Google Scholar] [CrossRef]
  10. Amirante, R.; Del Vescovo, G.; Lippolis, A. Flow forces analysis of an open center hydraulic directional control valve sliding spool. Energy Convers. Manag. 2006, 47, 114–131. [Google Scholar] [CrossRef]
  11. Amirante, R.; Andrea Catalano, L.; Tamburrano, P. The importance of a full 3D fluid dynamic analysis to evaluate the flow forces in a hydraulic directional proportional valve. Eng. Comput. 2014, 31, 898–922. [Google Scholar] [CrossRef]
  12. Lisowski, E.; Czyżycki, W.; Rajda, J. Three dimensional CFD analysis and experimental test of flow force acting on the spool of solenoid operated directional control valve. Energy Convers. Manag. 2013, 70, 220–229. [Google Scholar] [CrossRef]
  13. Li, Q.; Zong, C.; Liu, F.; Xue, T.; Yu, X.; Song, X. Numerical and experimental analysis of fluid force for nuclear valve. Int. J. Mech. Sci. 2023, 241, 107939. [Google Scholar] [CrossRef]
  14. Li, R.; Sun, Y.; Wu, X.; Zhang, P.; Li, D.; Lin, J.; Xia, Y.; Sun, Q. Review of the Research on and Optimization of the Flow Force of Hydraulic Spool Valves. Processes 2023, 11, 2183. [Google Scholar] [CrossRef]
  15. Liu, J.; Li, R.; Ding, X.; Liu, Q. Flow force research and structure improvement of cartridge valve core based on CFD method. Heliyon 2022, 8, 14. [Google Scholar] [CrossRef] [PubMed]
  16. Ledvoň, M.; Hružík, L.; Bureček, A.; Dýrr, F.; Polášek, T. Leakage Characteristics of Proportional Directional Valve. Processes 2023, 11, 512. [Google Scholar] [CrossRef]
  17. Manring, N.D. Hydraulic Control Systems; John Wiley & Sons, Inc.: Hoboken, NJ, USA, 2005. [Google Scholar]
  18. Herakovič, N. Flow-force analysis in a hydraulic sliding-spool valve. Strojarstvo 2009, 51, 555–564. [Google Scholar]
  19. ANSYS, Inc. Fluent Theory Guide Release 2022 R2; ANSYS, Inc.: San Diego, CA, USA, 2022. [Google Scholar]
  20. Xie, P.; Li, C.; Lv, S.; Zhang, F.; Jing, H.; Li, X.; Liu, D. Numerical Simulation of 3D Flow Structure and Turbulence Characteristics near Permeable Spur Dike in Channels with Varying Sinuosities. Sustainability 2023, 15, 15862. [Google Scholar] [CrossRef]
  21. Lisowski, E.; Rajda, J. CFD analysis of flow forces acting on the spool of directional control valve type WE10J. Czas. Tech. 2015, 7, 133–140. [Google Scholar]
Figure 1. Analysis of flow force acting on spool of directional valve.
Processes 11 03415 g001
Figure 2. Scheme of experimental equipment for various flow path connections—(a) PB–AT, (b) PB only, (c) AT only. P—supply port, A, B—load port, T—tank port, EM—electric motor, HP—hydraulic pump, PV—pressure relief valve, PRL2—proportional directional valve.
Processes 11 03415 g002
Figure 3. Experimental equipment.
Processes 11 03415 g003
Figure 4. (a) Example of the flow path geometry PB of the directional valve, (b) section of the modelled area.
Processes 11 03415 g004
Figure 5. (a) Mesh of solved region, (b) detail of the flow path PB mesh.
Processes 11 03415 g005
Figure 6. Dependence of the pressure drop Δp across the throttle cross-section on the number of elements nE.
Processes 11 03415 g006
Figure 7. Dependence of the flow velocity Δp across the throttle cross-section on the number of elements nE.
Processes 11 03415 g007
Figure 8. Dependence of flow force Ff on volumetric flow rate Q (flow paths PB, AT, PB + AT).
Processes 11 03415 g008
Figure 9. Comparison of the dependence of flow force Ff on volumetric flow rate Q for different hydraulic system connections.
Processes 11 03415 g009
Figure 10. Dependence of flow force Ff on volumetric flow rate Q for different spool displacements.
Processes 11 03415 g010
Figure 11. Dependence of dimensionless flow force F1 on dimensionless volumetric flow rate Q1 for dimensionless spool displacements x1.
Processes 11 03415 g011
Figure 12. Comparison of numerically simulated and experimentally determined flow force Ff as a function of volumetric flow rate Q for different spool displacements (flow direction from port P to port B).
Processes 11 03415 g012
Figure 13. Comparison of numerically simulated and experimentally determined flow force Ff as a function of volumetric flow rate Q for different spool displacements (flow direction from port A to port T).
Processes 11 03415 g013
Figure 14. Comparison of numerically and experimentally determined flow force Ff as a function of volumetric flow rate Q for different spool displacements (flow direction from PB to AT).
Processes 11 03415 g014
Figure 15. Valve spool pressure load [Pa] and velocity vectors [m⋅s−1] in the throttle edge area: (a) flow path PB, (b) flow path AT.
Processes 11 03415 g015
Figure 16. Valve spool pressure load [Pa]: (a) flow path PB, (b) flow path AT.
Processes 11 03415 g016
Figure 17. Velocity vectors [m⋅s−1] in the throttle edge area: (a) flow path PB, (b) flow path AT.
Processes 11 03415 g017
Table 1. The measuring ranges and accuracies of the used sensors.
SensorsMeasuring RangeMeasuring Accuracy
Pressure sensor S1(0 ÷ 400) bar±0.25% of full scale
Pressure sensor S2, S3(0 ÷ 250) bar±0.25% of full scale
Pressure sensor S4(0 ÷ 60) bar±0.25% of full scale
Flow meter S5(0.7 ÷ 70) dm3·min−1up to ±0.4% of reading
Temperature sensor S6(−50 ÷ 200) °C0.3 + 0.005·tO °C
Force sensor S7±50 N0.5% of linearity
Table 2. Example of boundary conditions for flow path P-B for spool displacement and physical properties of the oil.
x = 0.57 mmx = 0.4 mm
QmpoutletQmpoutlet
[kg·s−1][MPa][kg·s−1][MPa]
0.3392.550.3254.82
0.2831.770.2743.44
0.2281.150.2232.19
0.1650.590.1691.22
0.1110.260.1080.45
Density852 kg·m−3Turbulence intensity5%
Dynamic viscosity0.03859 Pa·sHydraulic diameter0.008 m
Disclaimer/Publisher’s Note: The statements, opinions and data contained in all publications are solely those of the individual author(s) and contributor(s) and not of MDPI and/or the editor(s). MDPI and/or the editor(s) disclaim responsibility for any injury to people or property resulting from any ideas, methods, instructions or products referred to in the content.

