Article

Study of the Grinding Process by Friction of Cereal Grains in Stone Mills

by
Filip Ilie
1,*,
Constantin Daniel Cotici
2 and
Andrei-Florin Hristache
2
1
Department of Machine Elements and Tribology, Polytechnic University of Bucharest, 060042 Bucharest, Romania
2
Department of Biotechnical Systems, Polytechnic University of Bucharest, 060042 Bucharest, Romania
*
Author to whom correspondence should be addressed.
Processes 2023, 11(12), 3376; https://doi.org/10.3390/pr11123376
Submission received: 28 October 2023 / Revised: 26 November 2023 / Accepted: 27 November 2023 / Published: 6 December 2023

Abstract

:
The grinding process via friction at the micro-scale in a mill with stones is considered a variable combination of contacts, with two-body (the asperities of lower millstone in direct contact with the asperities of upper millstone) and three-body (micro-particles of ground seeds trapped between the asperities of lower and upper stones of the mill) contacts. Three elements are described: (1) the mechanical contact of the asperities of the lower and upper millstones to predict pressures on asperities by modeling; (2) tests on a millstone sample covered with grinding particles; and (3) tests on a wafer sample formed by the millstones with the grinding particles between them. This paper highlights the combined effects of the micro-scale friction via individual measurements, using an analytical model to sum these effects and validating the model by performing several experiments. An efficiency grind by friction assumes the grain’s movement and interaction between the seeds and solid surfaces, and is highlighted through theoretical and experimental studies. Topography analysis of the surface of the millstones reveals the model of microscopic frictional force. Endpoint measurements (the traces of the surface topography evolution) enable model verification in the grinding process. Thus, the results obtained in the grinding process in the stone mills via friction have practical utility through research benefits. Therefore, they allow for the improvement of quality, reliability, flexible grinding, quality control of the flours, and uniformity degree (fineness/shredding).

1. Introduction

Cereals and cereal products have been widely used by people since the emergence of agriculture and constitute the staple foods for the population, but their processing was homogeneous in time and space. A history of the processing of cereals, as well as their consumption by the population, is highlighted by Thielecke et al. [1]. To enable cereal consumption by humans, most must be processed because we are not able to survive exclusively on raw grains. By processing the cereals, the raw grains are transformed into nutritious, safe, and palatable foods because they provide the required nutrients and energy in the everyday diet via direct consumption [2]. Modern processes allow quality and safe cereal-based products to be used in a wide and diverse range of foods, which contributes to meeting the needs of the population, consumer tastes, and expectations. This is due to their positive contribution, when consumed as whole grain, especially to the intake of dietary fiber, vitamins, and minerals.
A comparison between the modern grinding process with the help of rollers, which is a fast system (capable of processing larger quantities of seeds but with resulting flours that are devoid of nutritional compounds due to the high temperature achieved in this grinding process), and the older grinding process that uses two stones to grind cereal grains, such as wheat, corn, rice, etc. producing a flour rich in nutrient substances such as fiber, minerals, vitamins, and antioxidants) is presented in ref. [3].
The study in ref. [4] analyzes the friction and wear of grinding stones with a focus on de-husking cereals and on their processing. It shows that grinding stones were not always used to de-husk cereals prior to grinding, but may have been (occasionally) implemented in the husking process. Nevertheless, even within the same period, which attests to the cereal flour diversity and of food processing, variations have been detected. During the grinding process, the interaction between the seeds and solid surfaces, as well as the movement of the grain, is very important to obtain appropriate grinding results. This movement and interaction between and with solid surfaces of the seeds occurs through friction that, in the grinding process, helps to obtain the desired grist. The very fine grinding is achieved at the micro-scale level as a result of the friction activity combined with the mechanical one.
Past research shows that friction at the micro-scale mainly depends on the molecular adhesion of two contacting bodies [5,6,7,8,9,10,11]. Thus, Li et al. [5] present and bring clarification to the rice grinding process with millstones; specifically, they offer indications for the design of friction stone mills for rice. At the same time, using the discrete element method, they numerically simulated the rice grain motion by friction between the millstones, and introduced a method for quantification of grinding uniformity. The grinding process by friction, with respect to the grinding powder properties, is influenced by the moisture effect of cereal seeds [6]. Also, the resistance and the mechanical properties of grains are dependent on the moisture content of the grains and represent key characteristics that enhance the grinding behavior of cereals. Gierz et al. [12] conducted, through simulation based on the discrete element method (DEM), research on the moisture influence on modifications of the physical properties of dressed and untreated cereal seeds (length, width, thickness, and weight). Lupu et al. [13] and Jung et al. [14] studied the influence of different moisture contents on the grinding process of wheat and corn, while Hassoon et al. [15] determined the grinding characteristics of wheat (grinding energy, average particle size, and particle size distribution) with low moisture content. The results showed a significant relationship in the grinding process between the cereal type, the moisture content, and their resistance characteristics.
On the other hand, Zeng et al. [7], simulated the motion of particles (considered spherical) with different static friction coefficients in a rice mill with stones to clarify the influence of the asperities of rice grain surfaces on the grinding process. The filling level (examined experimentally and numerically) of rice in a stone mill by friction determines and improves rice milling quality (as an effect on grinding degree and uniformity) by establishing and applying a method that can quantify grinding uniformity, affected directly by the particle rotational kinetic energy [4,8]. Regarding obtaining the degree and uniformity of grinding, it is necessary to solve optimization problems. A concrete example of optimization by investigating the exchange and properties of the hard/soft nanoparticles is described by Almessiere et al. [9]. Other researchers have evaluated the effects of the friction plates’ hardness and orientation of their surfaces on the static friction coefficient and the cereal seeds’ angle [9,10]. The study of the external and internal friction coefficients of grain agricultural products, in static and dynamic friction regimes, was necessary, being the most important physical and mechanical characteristics of bulk seeds [11,16]. Also, Savenkov et al. [16] presented a carousel-type device and the methodology for determining the internal friction dynamic coefficients, as well as the program and research results of the practical use of these coefficients for cereal agricultural products in bulk, by layers of linear displacement in a speed range. A concrete example of promising materials for practical application, with an effect on the practical use of dynamic coefficients of internal friction, for bulk cereal agricultural products is presented by Kozlovskiy and Zdorovets [17].
The question is asked: What will happen when a solid surface (here with the millstone surfaces) collides with micro/nanoparticles? Thus, for the milling industry (in the present case), it becomes an important problem, not far from the powder manufacturing industry, the ultra-smooth surface manufacturing industry, etc. It also provides important information for a general understanding of micro/nanoparticle collision, which is essential for controlling and preventing solid surface damage, in micro/nano-modification. In order to evaluate compliance with specifications, the properties of a material, components, structure, or system for different characteristics or defects, without causing damage to the original element, are necessary for the control and prevention of damage to the solid surface in micro/nano-modification. To determine its properties, foam testing [18] or non-destructive testing [19] is necessary. However, such studies are relatively rare in the research on micro/nanoparticle collision on a solid surface. Precisely for that reason, in this study, we sought to complete this type of research on the interactions of micro/nanoparticles of flour with solid surfaces (in this case, millstones).
To investigate the interactions/collisions between solid surfaces and energetic clusters, more tests and simulations have been performed in the last few decades [20,21,22,23,24]. The energetic clusters are atomic and molecular groups that connect individual atoms and solids. They can be used both as models for fundamental research on the transition from bulk material to the atomic scale and as controllable and versatile tools for the surface modification of superficial layers at the micro/nanometer scale [20]. The interaction with small, energetic clusters of metallic atoms at the surface was investigated through computerized molecular dynamics simulations. To elucidate the relative elastic properties of the cluster and substrate, as well as the effects of incidence angle, size, and cluster energy, cluster–solid combinations were studied in a wide variety [21]. Additionally, Afify et al. [22] conducted large-scale molecular dynamics simulations to study the impact of a single cluster on a hardened surface, aiming to investigate highly energetic cluster–surface interactions. Then, Ilie [23] presented experimental and theoretical studies on the movement and collision between micro/nanoparticles in a chemical–mechanical planarization/polishing process slurry, as well as between solid surfaces and these particles, using a microscopic friction model based on surface topography. Also, ref. [24] analyzed the impact of chemical–mechanical interactions/collisions, among micro/nanoparticles, and between the polishing/planarization head-micro/nanoparticles-polishing/planarization platen on the chemical–mechanical polishing/planarization performance, by measuring friction force at the interface. By extrapolation, such phenomena (interactions and collisions between energetic clusters) also occur in the case of cereal agricultural products during the grinding process. Therefore, the paper presents theoretical and experimental research on seed movement, collisions between seeds, and between seeds and solid surfaces during the grinding process using a microscopic frictional force model based on surface topography. The goal is to obtain practical results by examining the quality, reliability, and flexibility of grinding, as well as the quality control of flours and degree of uniformity (fineness/shredding).

2. Materials and Methods

In the work process, the upper millstone was placed in position, pressed against the lower millstone with a normal load, and fixed on a rotating turntable (Figure 1). This facilitates the mechanical entry of seeds between the upper and lower millstones, even when the seeds are dispersed. It enables the grinding activity and maintains a surface flooded with grinding material. Although the friction grinding process in stone mills can be applied and is valid for any type of cereal grain subjected to grinding, for the experiments conducted to validate the modeling applied in this work, wheat, barley, rye, rice, and corn were used. The average properties and dimensions of these cereal grains subjected to the grinding process were as follows: seed weight, density, moisture content, length, width, and thickness (respectively, for wheat: 39.7 mg, 1.38 g/cm3, 12.8%, 6.7 mm, 3.4 mm, 2.8 mm; barley: 26.6 mg, 1.35 g/cm3, 12.2%, 8.7 mm, 3.0 mm, 2.3 mm; rye: 16.6 mg, 1.39 g/cm3, 11.6%, 6.7 mm, 2.5 mm, 2.1 mm; rice: 19.3 mg; 1.45 g/cm3, 13.0%, 6.8 mm, 2.9 mm, 2.0 mm; corn: 232.5 mg, 1.27 g/cm3, 10.9%, 11.6 mm, 8.3 mm, 3.9 mm).
Figure 1 illustrates that the movement of seeds on each stone is different. Consequently, the seeds enter through the hole in the middle of the upper millstone (Figure 1a) and move in a spiral pattern, while on the lower stone (Figure 1b) the seeds follow a curved trajectory.
It is noted that the hole has a trapezoidal shape to facilitate the uniform and regular distribution of the seeds (Figure 2a) because there is an approximate distance of 10 mm between the two stones in the center and much less at the border (endpoint). As a result, the grains are ground (through grain crushing and breaking) and displaced by the millstone until they reach the border and are collected externally, along the border (of the endpoint) in the form of flour (Figure 2b).
Figure 2. Section through the stone mill: (a) entry of the cereal seeds; (b) stones’ action on the seeds during rotational movement of the lower millstone. This is schematically illustrated in Figure 3, where both millstones are made from the same material, corundum ceramic, with the following properties: chemical composition: 94.5–95.5% Al2O3, 1.33–1.50% SiO2, 0.18–0.30% Fe2O3, 2.45–3.50% Ti2O, 0.11–0.30% CaO; melting point 2050 °C; density 3900 kg/m3; Mohs hardness 9 ≈ HV hardness 2100–2400 [25,26]. In the final part of the millstones, where the distance between the stones is very small, most of the crushing and breaking of cereal grains occurs [27,28]. Very fine grinding take place at the micro-scale as a result of both the mechanical and friction activity.
Processes 11 03376 g002
Therefore, previous research has demonstrated that in friction mills, friction predominates at the micro-scale between two contacting bodies, depending on their molecular adhesion. It was then suggested that the grinding process, as a result of the pressing and sliding movement, is accompanied by friction at the micro-scale and can be dependent on three bodies in contact: between seeds (micro-particles of grinding), and between the seeds (micro-particles of grinding) caught between the asperities of the lower millstone and the upper one. Thus, the authors propose that total friction is the sum of the friction resulting from the three-body individual contacts of seeds trapped between the asperities of the lower millstone and the upper one (2 contacts), and individual contacts between the asperities of the lower millstone and the upper one (3rd contact).
Based on this understanding, experimental micro-indenter adhesion measurements were conducted both for seeds and the asperities of the lower millstone and the upper one. Micro-identification was performed using Micro-scratch Testing equipment from Ebatco, Eden Prairie, MN, USA, which had the following key specifications: maximum load capacity of up to 30 N; load resolution of 0.3 mN; maximum depth of 1 mm; depth resolution of 0.3 nm; maximum scratch length of 120 mm; scratch speed of 0.4–600 mm/min. To measure the material’s asperities (surface topography) an Atomic Force Microscope (AFM, type WITec Alpha300 A, Quantum Design GmbH, Grimbergen, Belgium) was utilized.
For friction measurements, a pin/disk tribometer, commonly used in academia (from our university), was employed to investigate the tribological system’s behavior under friction and wear conditions, on whose disc were fixed samples of a lower millstone with flour particles (sized between 40–200 μm) and rotating at a speed of 60 rpm. It is designed to test planar base materials against a counter body under sliding conditions. The counter body is pressed against the rotating base material by a defined normal load using dead weights placed on a plate. It can operate with constant normal forces of up to 100 N, a rotational radius of up to 50 mm, and rotational speeds of up to 1500 rpm, typically at ambient temperature. The resulting frictional forces are detected by force sensors and plotted against the travel path. It can also be used to investigate tribological contacts under dry sliding conditions, both with and without lubrication. The entire setup can be heated, and the tests can be conducted under different atmospheres. Analyzing the wear track on the base material and the wear on the counter body provides valuable information about the tribological behavior of the tested systems. However, the pin/disc tribometer is equipped with an articulated arm in which the upper millstone samples are fixed (in the form of cylindrical pins with a diameter of 10 mm) and maintained in contact with the other samples fixed on the tribometer disk (in the form of circular plates with an average diameter of 80 mm). At the same time, the arm is provided with load sensors, and the friction is measured in simulated conditions of the grinding process created by applying a normal load on the arm to maintain contact between the lower and upper millstone samples. It is worth noting that the material used for the millstones can be either granite or ceramic, and in this paper, ceramic was chosen as the best naturally transparent material (a rock-forming mineral primarily composed of aluminum oxide, Al2O3, in the crystalline form with traces of iron, titanium, vanadium, and chromium) [27,28,29,30]. Therefore, the samples to be tested were made of the same material as the millstones, which was corundum ceramic, with an average surface roughness of 0.258 μm). Based on the micro-scale adhesion measurements, each contact between seeds and/or asperities generated an appropriate friction force. To achieve this, a profilometer (ST 400 Nanovea, St. Gallen, Switzerland) was used, to measure the replicas of the asperities of the lower millstone and develop a contact model. Additionally, a virtual micro-tribometer was employed to simulate the contact on the asperity under the effect of contact pressure. The total friction was determined by multiplying the individual friction forces of the contacts by the total number of contacts based on an analytical model. These experiments were conducted at a bench-scale level to guide and validate the model.

3. Results and Discussion

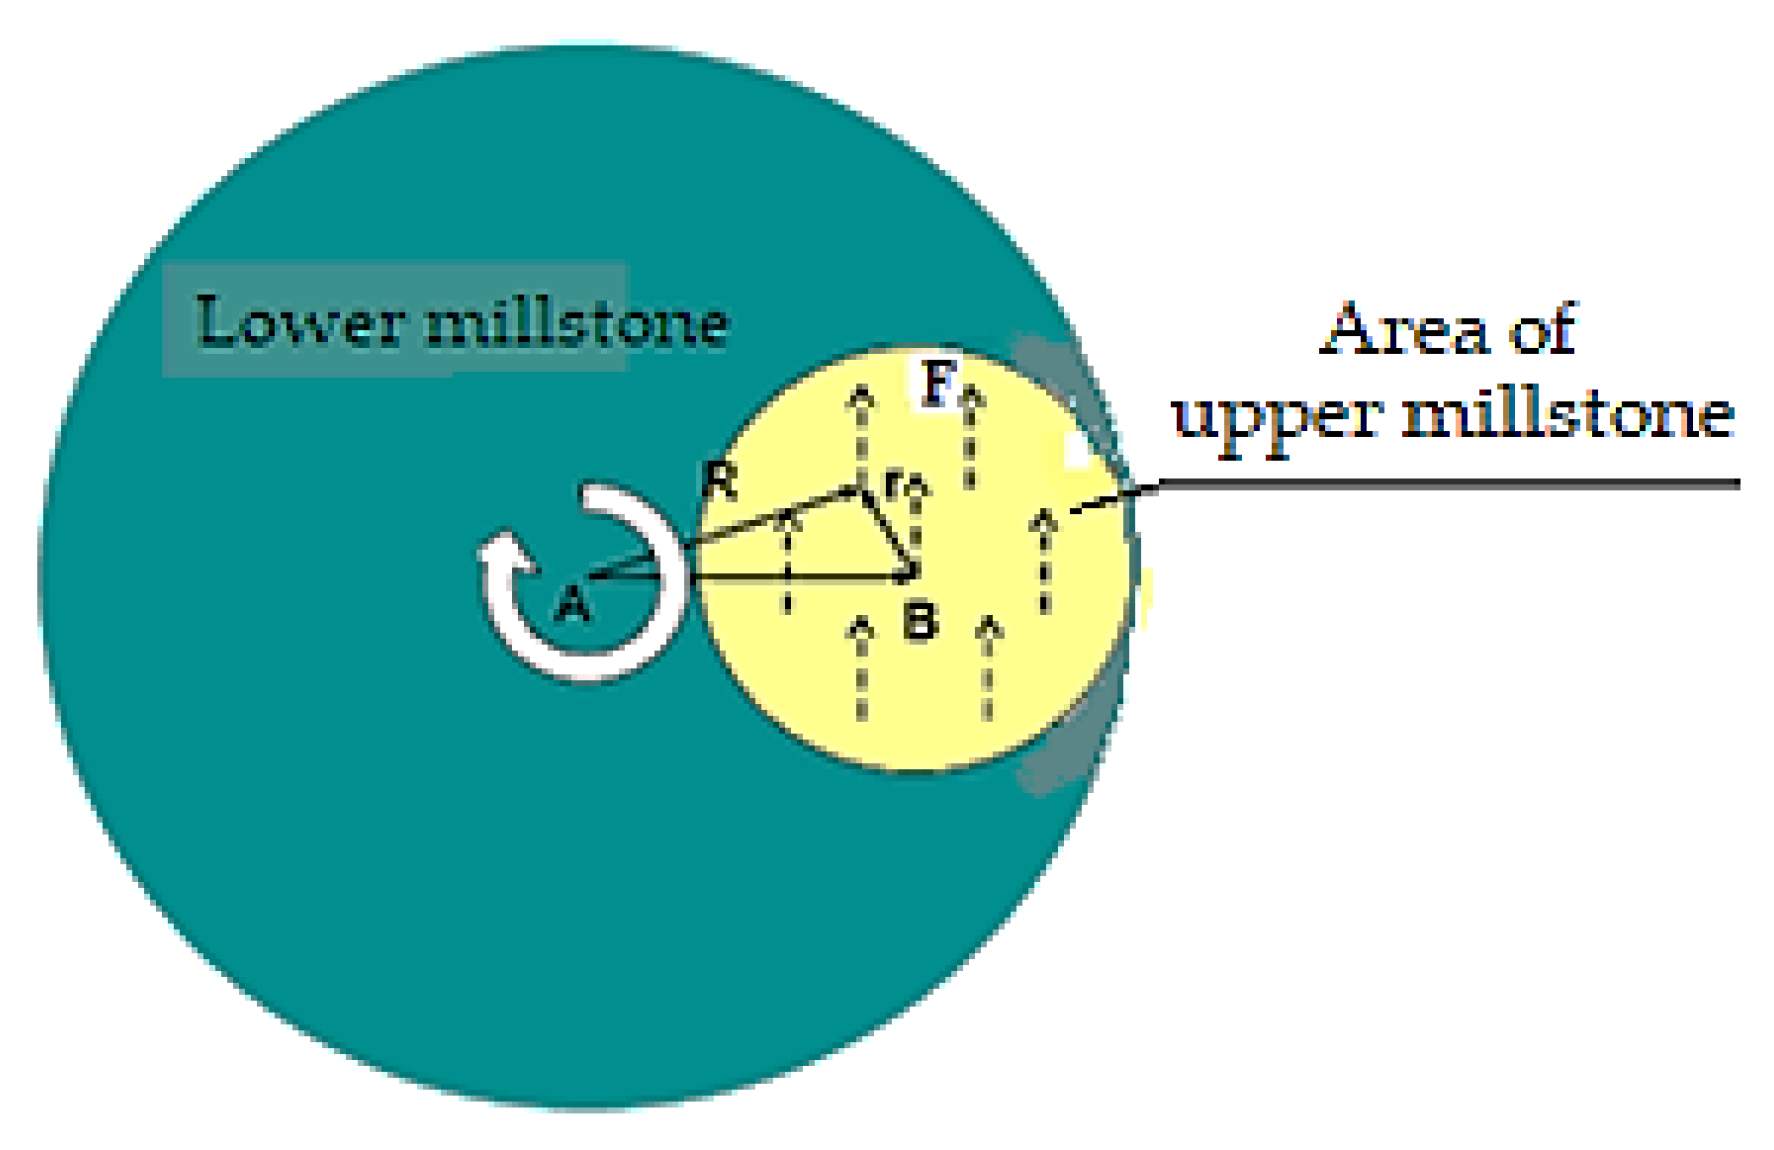
3.1. Friction Modeling

The development of a friction model was necessary considering that the total friction, Ff between the lower millstone, seeds, and upper millstone in the grinding process has three distinct friction force components [23,31].
Thus, the frictional force between the lower millstone and the upper millstone, Ffl–u, constitutes the first component. The second component is the frictional force between grain and upper millstone, Ffg–u, and the frictional force between seeds and lower millstone, Ffg–l, is the third component. This arrangement is depicted schematically in Figure 4. Each component of the friction force has an associated friction coefficient (μl–u, μg–u, and μg–l), and these coefficients correspond to molecular and mechanical adhesion components [32].
The friction force components cumulated represent the friction force, Ff (see Figure 4), and can be written in the form
F f = [ C 1 μ l u + C 2 μ g u μ g l ] F n ,
where Ff is the total friction force by sliding; Fn is the applied normal force; and C1 and C2 are constants that consider the contact’s number.
By considering seed density, the distribution of asperities on both the lower and upper millstones, and employing rough contact modeling, it is possible to evaluate the number of contacts [33]. Also, in the assessment of these contacts, the porosity of the lower millstone is taken into account. Figure 5 provides a schematic representation of the typical tool setup used to measure friction between the upper millstone and grain (flour, which is on the lower millstone), and between the lower millstone and grain (flour, which flows from the upper millstone). Further details are presented below.
Experiments conducted using different samples of lower millstones reveal distinct endpoint traces, whereas the results obtained from the upper millstone are deemed unusable.
If it is assumed that all of the necessary energy for grinding is consumed by the friction between the upper millstone and lower millstone, then it can be considered that this is roughly proportional linearly to the average Ff. A way to highlight Ff exerted by the upper millstone on the lower one is shown in Figure 6 (considering an area (the yellow one, for visualization) from the upper millstone in contact with the lower millstone, something that can be generalized over the entire surface of the upper millstone).
Ff is periodically distributed on the contact surfaces of the upper millstone and the lower one because the small flour particles are anchored and symmetrically distributed on each surface, and the relative velocity between the two surfaces remains constant. Consequently, it is expected that the net torque of friction forces in ratio with the upper millstone is almost zero, while the net torque in relation to the lower millstone contributes and augments the small torques of these forces. This accounts for the distinctive traces observed on the endpoint of the lower millstone, whereas those from the upper millstone are unusable.
Hence, the traces observed during the grinding process provide us information on the evolution of friction. An evaluation model is required to better comprehend the grinding process and to enhance endpoint monitoring.
Below, a friction model is presented with two factors (the standard deviation of the highest areas, σsd, and averaged material friction coefficient, μav); it is relatively simple, although more friction models can be considered. The goal is to understand the interactions between lower millstone and the physics model of the wafer (lower millstone with flour particle) in more detail. Based on experimental data, additional factors can be considered, making the friction models potentially more complex, although they are relatively simple.
The model assumes that two factors are responsible for the modification of Ff, during the grinding process: namely, adherence of flour layer and variations in surface topography (roughness height) [34]. To characterize the Ff between the lower millstone and upper millstone, it is assumed that the Ff is proportional linearly with the multiplication between the μav and the σsd, and the Ff relation becomes:
F f ~ μ a v 1 + β σ s d ,
where μav is obtained by averaging a weighted friction coefficient of material from friction exposed area (μav = 0.42); β is the empirical parameter dependent on the friction coefficients sensitive to the flour blanket and the materials used for the lower millstone and upper one (β = 460.68).
For the σsd determination first, the lower millstone was divided into cells on friction length size and was calculated as the average of the highest heights of each cell (σsd = 0.0645).

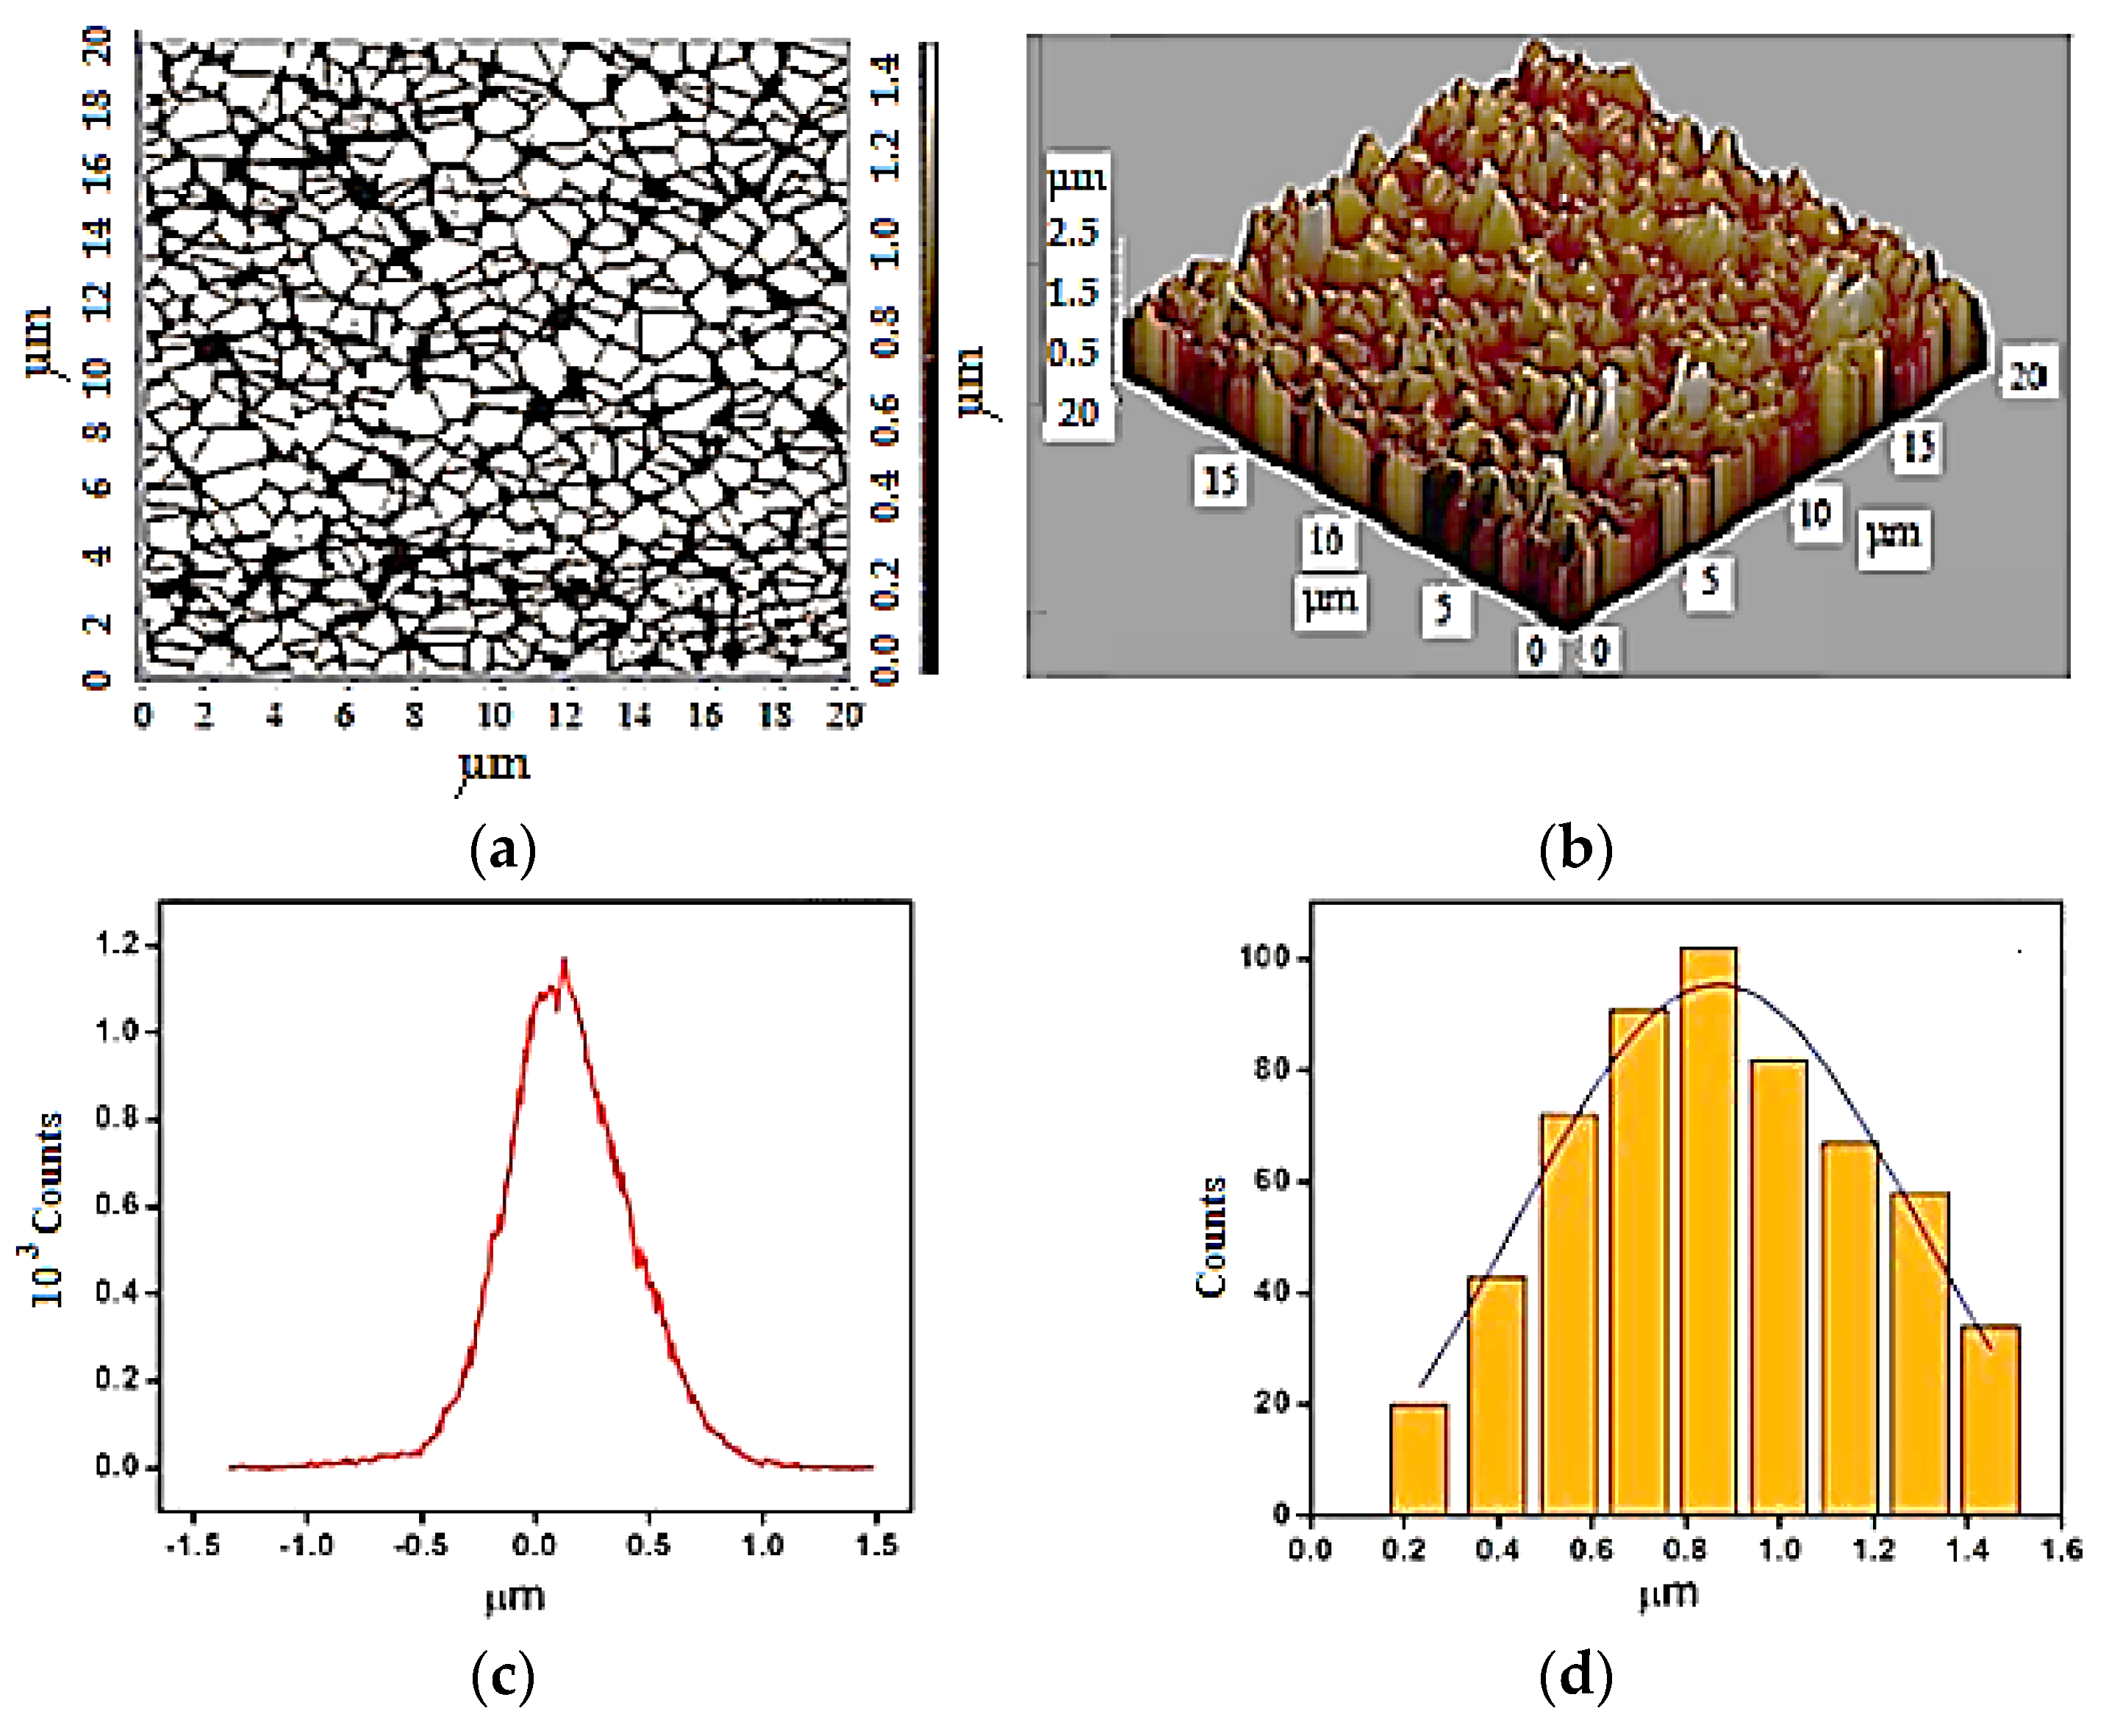
3.2. Experimental Procedure

Initially, a series of experiments were conducted to isolate the friction effects between the material of the lower millstone and the upper millstone. It is important to note that even here, the frictional forces can be influenced by individual flour particles in contact with the lower millstone’s asperities as well as those of the upper millstone.
To facilitate this, the millstone surface must be foreseen by grooves arranged radially to allow adequate friction between the stone asperities and seeds (as seen in Figure 3) and the seeds’ movement (Figure 1). Additionally, the main grooves have the basic function of stone cooling and extend from the central hole to the millstone edge, while the secondary grooves contribute to distributing the product uniformly on the stone surface and helping to release the flour.
The grinding and movement of grains toward the border occur mainly by friction as discussed above (see Figure 1 and Figure 3). This phenomenon was analyzed through modeling, simulation, and experimental methods.
Micro-indentation and micro-scratch tests were conducted to measure micro-scale friction forces, with a friction force sensor equipped on the indenter used to measure lateral forces. The tests provided friction results from the interfaces between the lower millstone and the flour particles, as well as between the flour particles and the upper millstone. Also, the friction between a small section of the lower millstone material and the upper millstone was measured. To create a more complex testing scenario, this was then replicated over a substrate section with impregnated flour particles from the material of the lower millstone.
It should be noted that the frictional forces can be influenced by individual flour particles in contact with the asperities of both the lower millstone and the upper one. The Atomic Force Microscope (AFM, type WITec Alpha300 A, Quantum Design GmbH, Grimbergen, Belgium) was used to measure the asperities of the material. The structure of the lower millstone was highly porous [35], with pores around 200 μm in size.
Using the AFM, the regions between the open pores were captured to measure the asperities of these areas at the micro-scale. Figure 7 presents specific AFM images with corresponding data (Figure 7a,b), along with an asperity histogram (Figure 7c) and the distribution curve of the grain sizes (Figure 7d).
Examining the AFM images of the ceramic millstones, Figure 7a provides a two-dimensional image displaying the surface morphology of the grains and their boundaries. In the TAFM image, the ceramic material exhibits a compact structure with granular morphology, flat grains characterized by clear boundaries, and a buffer layer. A three-dimensional AFM image of the ceramic surface is presented in Figure 7b, which shows the maximum peak height of the grain asperities of 2.52 µm within a scan area of 20 µm × 20 µm. Figure 7c displays the three-dimensional surface roughness of the ceramic grinding stone, with an average roughness of 0.225 µm and a mean squared deviation of 0.290 µm. Additionally, the AFM analysis indicates a wider distribution of grain sizes in the grinding stone ceramic material that was analyzed. The two-dimensional AFM image estimated an average grain size of 0.620 µm based on 630 contacts, in accordance with the histogram in Figure 7d.
The pin/disk tribometer was chosen, as it is the most suitable instrument for measuring the frictional forces at the interface between the grinding stones and the cereal grains, as well as between these and the flour particles. The process assumed fixing cereal grains between a circular pin with a diameter of 10 mm and a plate with a diameter of 80 mm, which rotated at 60 rpm, resulting in the gradual transformation of the grains into flour powder during the friction process. This transformation was achieved by applying a normal load on the arm to maintain contact between the lower and upper millstone samples and the grain particles. Consequently, the friction was measured under simulated conditions resembling the grinding process.
Furthermore, the friction work process closely resembled that of a mill with grinding stones, with the samples being composed of the same material as the grinding stones and possessing a similar surface structure and morphology (corundum ceramic). The distinction from the actual grinding process for a large number of cereal grains was that, for measuring the frictional forces from the surface, the forces may differ relatively little from the real ones. The difference is due to the fact that first, the grains are transformed into coarse flour particles and then ground finer and finer, similarly to those of the grinding process in a stone mill. Additionally, the contact area between the grinding stone samples used in the pin/disk tribometer differs significantly from the actual contact area in the friction grinding mill, being much smaller. This difference has been validated through simulation and analytical modeling.
Moreover, the impact of grinding on flour flowability can be assessed using flow indicators, including the friction coefficient (discussed in this paper), bulk density, angle of repose, flour flow stability, cohesive index, and caking strength. These flow indicators, along with powder flow analysis, have shown that the flours obtained from the stone mill exhibit cohesion. Based on the friction forces measured on the pin/disc tribometer, the friction coefficient was determined using the Amontons–Coulomb law. This coefficient serves as one of the flow indicators used to evaluate the effect of grinding on flour flowability.
Thus, the variation in the friction coefficient over time and with the load at the sliding speed of ~1 m/s (v = 2πnd/2 = [(2·3.14·60·80)/(60·2)] = 251.2 mm/s = 0.2512·3.6 ≈ 0.904 m/s) is shown in Figure 8.
Analyzing Figure 8a, it becomes evident that the friction coefficient follows a normal evolution during sliding, initially increasing and then gradually decreasing until it stabilizes around a relatively constant value. This behavior apparently indicates that the friction pairs first go essentially through a running-in process. The explanation lies in the fact that, from the beginning of the test, a flour film did not form on the surface (the cereal seeds were either mostly intact or in the form of coarse/large particles, such as broken or crushed), resulting in a relatively high friction coefficient for a very brief period (as observed in Figure 8a).
This initial phase can be attributed to the relatively dry friction that occurred between the millstones’ asperities and the outer layers of the seeds (broken or crushed particles) on the one hand, and between the seeds themselves on the other hand. This led to an increase in the friction force and consequently the friction coefficient, indicated by a relatively abrupt jump (from approximately 0.3 to 0.6), lasting about 60–90 seconds (as seen in Figure 8a).
Subsequently, the friction coefficient began to decrease relatively rapidly (reaching around 0.45 after approximately 300 seconds, down from the initial value of approximately 0.6), followed by a slower decline (reaching approximately 0.43 after 3600 seconds) with minor oscillations and a tendency toward stabilization. This decline corresponded to the seed particles decreasing in size until they transformed into fine flour particles. Consequently, a continuous film of flour formed between the millstones’ asperities, acting like a solid lubricant film. Friction then occurred on this film of flour particles, either by sliding or rolling, leading to a reduction in the friction coefficient and its stabilization around an average value in the range of approximately 0.42–0.44.
It is worth noting that the obtained friction coefficient values fell within the typical range for cereal seeds, which is generally between 0.25 and 0.65, depending on the type of seed and its moisture content. Therefore, the results (as shown in Figure 8) align with the range reported in specialized literature [36,37]. Moreover, after the formation of the flour film, the friction tended to decrease, and the friction coefficient stabilized (as depicted in Figure 8a). Additionally, the friction coefficient decreased as the load increased, as observed in the average values (as seen in Figure 8b). This behavior is consistent with the model used to determine the friction force, which explains the experimental phenomena based on the obtained results and in accordance with findings in specialized literature.
For example, for a normal contact force, F of 30 N (made by the weights placed on the arm of the pin/disc tribometer), a friction force, Ff ≈ 13.2 N was experimentally obtained (which corresponded to a friction coefficient, μ ≈ 0.44), while the force obtained by using the analytical model based on the relationship/Equation (1) was Ff ≈ 12.9 N (resulting in μ ≈ 0.43), and that by the two-factor model (given by the relation/equation (2)) was Ff ≈ 13.5 N (resulting in μ ≈ 0.45). Or, for the normal contact force, F of 50 N (made under the same conditions as F = 30 N), a friction force, Ff ≈ 21.8 N (resulting in μ ≈ 0.436) was experimentally obtained, while by using the analytical model based on the relationship/Equation (1), it was Ff ≈ 21.2 N (resulting in μ ≈ 0.424), and by the two-factor model (given by the relation/Equation (2)), the friction force was Ff ≈ 21.5 N (resulting in μ ≈ 0.43).
These results confirm the statement made earlier that the friction coefficient decreases as the load increases, as depicted in Figure 8b. Although there were very slight differences between the experimentally determined friction forces and those obtained through modeling, and even smaller differences in the coefficients of friction, there was a good correlation between the experimental and analytically determined results, which justifies the validation of the model. Significant deficiencies in model improvement were not identified.
Instead, to a contact model was developed using the geometric data of the resulting asperities by measuring the asperities replicas of lower millstones using the profilometer. Also, the virtual micro-tribometer was employed to simulate contact under loads based on contact pressure prediction on asperity. The objective of these efforts was to identify areas where the contact pressure caused grain material shear and delamination in a well-controlled manner. This approach (modeling technique) not only significantly influences flour quality, dough rheological properties, and bread characteristics but also leads to ease of use and the system simplicity.
In a different context, the cereal product chain, rooted in tradition and known for its distinct organoleptic characteristics, is exploring alternative uses and diversified production, creating an interesting potential market niche. Increased income from the production of products with high nutritional and sanitary value can be achieved by reintroducing ancient milling techniques such as millstones for non-hybridized grains. Rediscovering these past traditions requires further efforts to promote the use of the stone mills through actions related to territorial promotion, tourism, culture, and gastronomy; all of these are extremely important for this purpose.
Additionally, establishing connections between the final product and region, as well as adopting cultivation methods with low environmental impact (such as ecological agriculture and integrated production), and registering collective geographical brands can play a significant role in this sector. To harness the potential of this sector (which we believe still has unexpressed potential), certification according to international standards for supply chain organizational models, raw material valorization, and the promotion of a quality network is essential. These aspects are precisely supported by the experimental results of the simulations and analytical modeling.

4. Conclusions

The understanding and interpretation of the friction phenomenon in the grinding process of stone mills was achieved through modeling, simulation, and experimentation. Two analytical models were employed to determine the total friction force and its components at the interface during the grinding process. These models were subsequently validated through simulation and experimentation using the pin/disc tribometer.
Frictional forces are periodically distributed across the contact surfaces of the millstones and are influenced by individual flour particles coming into contact with the millstones’ asperities as well as the constant relative velocity between them.
The measurement of friction forces at the micro-scale, conducted as part of the simulation and experimental methods during the grinding process, helped identify the interactions between the millstones, seeds, and flour particles. At the same time, it also facilitated the identification surface topography with the help of the AFM data and images. This, in turn, emphasized and highlighted the model of microscopic frictional force.
These micro-scale friction measurements were instrumental in understanding and interpreting the friction phenomena, laying the foundation for optimizing grinding performance.
Furthermore, by measuring the replicated asperities on a lower millstone using a profilometer and simulating with a virtual micro-tribometer based on asperity load, it became possible to monitor and improve the endpoint of the grinding process, which directly impacts flour quality. This also facilitated model verification in the context of the grinding process.As a result, the practical utility of the obtained results in the grinding is significant (through the research benefits) for stone mills. They will contribute to the development of quality, reliability, and flexibility in grinding operations, enable quality control of flours and ensure uniformity in fineness and shredding. These outcomes justify the validation of the modeling through analytical calculations, simulations, and experiments.
Subsequent research will involve expanding these tests under more comprehensive conditions and exploring various combinations of the grinding process. This will help identify the effective conditions for grinding performance and quality.

Author Contributions

Conceptualization, F.I.; methodology, F.I., C.D.C. and A.-F.H.; software, C.D.C.; validation, F.I., C.D.C. and A.-F.H.; formal analysis, C.D.C. and A.-F.H.; investigation, F.I., C.D.C. and A.-F.H.; resources, F.I., C.D.C. and A.-F.H.; data curation, F.I., C.D.C. and A.-F.H.; writing—original draft preparation, F.I.; writing—review and editing, F.I.; visualization, C.D.C. and A.-F.H.; supervision, F.I., C.D.C. and A.-F.H.; project administration, F.I.; funding acquisition, F.I., C.D.C. and A.-F.H. All authors have read and agreed to the published version of the manuscript.

Funding

This research received no external funding.

Data Availability Statement

Data are contained within the article.

Conflicts of Interest

The authors declare no conflict of interest.

References

  1. Thielecke, F.; Lecerf, J.-M.; Nugent, A. Processing in the food chain: Do cereals have to be processed to add value to the human diet? Nutr. Res. Rev. 2020, 34, 159–173. [Google Scholar] [CrossRef] [PubMed]
  2. Papageorgiou, M.; Skendi, A. Chapter 1—Introduction to cereal processing and by-products. In Sustainable Recovery and Reutilization of Cereal Processing By-Products; Woodhead Publishing: Sawston, UK, 2018. [Google Scholar] [CrossRef]
  3. Rana, R.; Tricase, C.; Padalino, L.; Mastromatteo, M.; Del Nobile, M.; Conte, A. Milling Process of Cereal Grains and Quality of Flours. Int. J. Sci. 2014, 3. Available online: https://www.ijSciences.com (accessed on 10 January 2023).
  4. Chondrou, D.; Bofill, M.; Procopiou, H.; Vargiolu, R.; Zahouani, H.; Valamoti, S.M. How do you like your cereal? A qualitative and quantitative use-wear analysis on archaeological grinding tools from prehistoric Greek sites. Wear 2021, 476, 203636. [Google Scholar] [CrossRef]
  5. Li, A.; Han, Y.; Jia, F.; Zhang, J.; Meng, X.; Chen, P.; Xiao, Y.; Zhao, H. Examination milling non-uniformity in friction rice mills using by discrete element method and experiment. Biosyst. Eng. 2021, 211, 247–259. [Google Scholar] [CrossRef]
  6. Jung, H.; Lee, Y.J.; Yoon, W.B. Effect of Moisture Content on the Grinding Process and Powder Properties in Food: A Review. Processes 2018, 6, 69. [Google Scholar] [CrossRef]
  7. Zeng, Y.; Jia, F.; Meng, X.; Han, Y.; Xiao, Y. The effects of friction characteristic of particle on milling process in a horizontal rice mill. Adv. Powder Technol. 2018, 29, 1280–1291. [Google Scholar] [CrossRef]
  8. Li, A.; Jia, F.; Zhang, J.; Han, Y.; Meng, X.; Chen, P.; Wang, Y.; Zhao, H. The effects of filling level on the milling accuracy of rice in the friction rice mill. Powder Technol. 2022, 398, 117052. [Google Scholar] [CrossRef]
  9. Almessiere, M.A.; Algarou, N.A.; Slimani, Y.; Sadaqat, A.; Baykal, A.; Manikandan, A.; Trukhanov, S.V.; Trukhanov, A.V.; Ercan, I. Investigation of exchange coupling and microwave properties of hard/soft (SrNi0.02Zr0.01Fe11.96O19)/(CoFe2O4)x nanocomposites. Mater. Today Nano 2022, 18, 100186. [Google Scholar] [CrossRef]
  10. Kaliniewicz, Z.; Jadwisieńczak, K.; Żuk, Z.; Konopka, S.; Frączyk, A.; Krzysiak, Z. Effects of Friction Plate Hardness and Surface Orientation on the Frictional Properties of Cereal Grain. Int. J. Food Sci. 2020, 2020, 6639233. [Google Scholar] [CrossRef]
  11. Khozyaev, I.; Savenkov, D.; Kirischiev, O.; Kirischieva, Y.; Tupolskikh, T. Study of the dynamics of the coefficient of external friction of seeds crops with shell. E3S Web Conf. Interagromash 2021, 273, 01032. [Google Scholar] [CrossRef]
  12. Gierz, Ł.; Kolankowska, E.; Markowski, P.; Koszela, K. Measurements and Analysis of the Physical Properties of Cereal Seeds Depending on Their Moisture Content to Improve the Accuracy of DEM Simulation. Appl. Sci. 2022, 12, 549. [Google Scholar] [CrossRef]
  13. Lupu, M.I.; Pădureanu, V.; Canja, C.M.; Măzărel, A. The effect of moisture content on grinding process of wheat and maize single kernel. IOP Conf. Ser. Mater. Sci. Eng. 2016, 145, 022024. [Google Scholar] [CrossRef]
  14. Moon, J.H.; Yoon, W.B. Effect of moisture content and particle size on grinding kinetics and flowability ofballoon flower (Platycodon grandiflorum). Food Sci. Biotechnol. 2017, 1–10. [Google Scholar] [CrossRef]
  15. Hassoon, W.H.; Dziki, D.; Mis, A.; Biernacka, B. Wheat Grinding Process with Low Moisture Content: A New Approach for Wholemeal Flour Production. Processes 2021, 9, 32. [Google Scholar] [CrossRef]
  16. Savenkov, D.; Kirischiev, O.; Kirischieva, Y.; Tupolskikh, T.; Tatiana Maltseva, T.; Magomedov, M.; Chistyakov, A. Study of the nature of the dynamic coefficient of internal friction of grain materials. E3S Web Conf. 2019, 135, 01102. [Google Scholar] [CrossRef]
  17. Kozlovskiy, A.L.; Zdorovets, M.V. Study of hydrogenation processes in radiation-resistant nitride ceramics. J. Mater. Sci. Mater. Electron 2020, 31, 11227–11237. [Google Scholar] [CrossRef]
  18. Available online: https://www.twi-global.com/ (accessed on 10 August 2023).
  19. Available online: https://www.laboratuar.com/ro/ (accessed on 10 August 2023).
  20. Popok, V.N.; Vučković, S.; Campbell, E.E.B.; Jensen, J.; Samela, J. Nordlund, Energetic Cluster-urface Interactions. In Proceedings of the Ion-Surface Interactions, Proceedings of XIX International Conference, Zvenigorod, Russia, 21–25 August 2009; Volume 1, pp. 49–54. [Google Scholar]
  21. Sweatman, M.; Afify, N.; Ferreiro-Rangel, C.; Jorge, M.; Sefcik, J. Molecular Dynamics Investigation of Clustering in Aqueous Glycine Solutions. J. Phys. Chem. B 2022, 126, 4711–4722. [Google Scholar] [CrossRef]
  22. Afify, N.; Ferreiro-Rangel, C.; Sweatman, M. Molecular Dynamics Investigation of Giant Clustering in Small-Molecule Solutions: The Case of Aqueous PEHA. J. Phys. Chem. B 2022, 126, 8882–8891. [Google Scholar] [CrossRef]
  23. Ilie, F. Movement, and collision of nanoparticles in the process of chemical mechanical polishing (CMP). INMATEH—Agric. Eng. 2013, 39, 85–90. [Google Scholar]
  24. Ilie, F.; Ipate, G. Chemical-Mechanical Impact of Nanoparticles and pH Effect of the Slurry on the CMP of the Selective Layer Surfaces. Lubricants 2017, 5, 15. [Google Scholar] [CrossRef]
  25. Sand Blasting Aluminium Oxide/Brown Fused Alumina—Products—Dengfeng Sweet Abrasives Co., Ltd.—Ruixiangmc.com. Available online: http://dfsweet.ruixiangmc.com/sell/itemid-950.shtml (accessed on 15 November 2023).
  26. Wassilkowska, A.; Czaplicka-Kotas, A.; Zielina, M.; Bielski, A. An analysis of the elemental composition of micro-samples using eds technique. Tech. Trans. Chem. 2014, 1-Ch/2014, 133–148. [Google Scholar]
  27. Belderok, B. Milling of wheat. Plant Foods Hum. Nutr. 2000, 55, 21–29. [Google Scholar] [CrossRef] [PubMed]
  28. Madureri, E. Storia della Macinazione dei Cereali; Edizioni Chiriotti: Torino, Italy, 1995; ISBN 9788885022546. [Google Scholar]
  29. Perec, A. Research into the Disintegration of Abrasive Materials in the Abrasive Water Jet Machining Process. Materials 2021, 14, 3940. [Google Scholar] [CrossRef] [PubMed]
  30. Maletsky, A.V.; Belichko, D.R.; Konstantinova, T.E.; Volkova, G.K.; Doroshkevich, A.S.; Lyubchyk, A.I.; Burkhovetskiy, V.V.; Aleksandrov, V.A.; Mardare, D.; Mita, C.; et al. Structure formation and properties of corundum ceramics based on metastable aluminium oxide doped with stabilized zirconium dioxide. Ceram. Int. 2021, 47, 19489–19495. [Google Scholar] [CrossRef]
  31. Xia, J.; Yu, J.; Lu, S.; Huang, Q.; Xie, C.; Wang, Z. Surface Morphology Evolution during Chemical Mechanical Polishing Based on Microscale Material Removal Modeling for Monocrystalline Silicon. Materials 2022, 15, 5641. [Google Scholar] [CrossRef] [PubMed]
  32. Salerno, E.; Casotti, D.; Paolicelli, G.; Gualtieri, E.; Ballestrazzi, A.; Gazzadi, G.C.; Bolelli, G.; Lusvarghi, L.; Valeri, S.; Rota, A. Friction and wear of DLC films deposited on additive manufactured AlSi10Mg: The role of surface finishing. Surf. Coat. Technol. 2023, 463, 129531. [Google Scholar] [CrossRef]
  33. Albahrani, S.M.B.; Alves, J.T.; Duval, A.; Chaise, T.; De Vaujany, J.-P.; Michèle Guingand, M. Modelling of elastoplastic, multi-scale and multi-contact problems: Application to worm gears. Mech. Ind. 2022, 23, 6. [Google Scholar] [CrossRef]
  34. Boning, D.; Xie, X.; Sorooshian, J.; Philipossian, A.; Stein, D.; Hetherington, D. Relationship between patterned wafer topography evolution and STI CMP motor current endpoint signals. In Proceedings of the 9th International CMP-MIC Conference, Marina Beach, Dubai, United Arab Emirates, 16–18 November 2021; Volume 341. [Google Scholar]
  35. Zake-Tiluga, I.; Svinka, R.; Svinka, V. Highly porous corundum–mullite ceramics—Structure and properties. Ceram. Int. 2014, 40, 3071–3077. [Google Scholar] [CrossRef]
  36. Kaliniewicz, Z. Analysis of frictional properties of cereal seeds. Afr. J. Agric. Res. 2013, 8, 5611–5621. [Google Scholar]
  37. Matouk, A.M.; El-Kholy, M.M.; Radwan, S.M. Determination of friction coefficients for different varieties of some cereal crops. J. Agric. Sci. Mansoura Univ. 2003, 28, 6939–6955. [Google Scholar] [CrossRef]
Figure 1. View of grooving in the millstones and the seed movement direction during grinding (arrows): (a) seed movement on the lower stone, which rotates; (b) seed movement on the upper stone, which is fixed.
Processes 11 03376 g001
Figure 3. Micro-scale asperities between the upper millstone (above) and lower millstone (below), upper millstone and seeds, and seeds and lower millstone.
Processes 11 03376 g003
Figure 4. Schematic representation of the components of friction force.
Processes 11 03376 g004
Figure 5. Block scheme of grinding system.
Processes 11 03376 g005
Figure 6. Highlighting of friction force Ff between lower millstone and upper millstone.
Processes 11 03376 g006
Figure 7. AFM images of the ceramic grinding stone surface: (a) the grains and grain boundaries presented in the two-dimensional image; (b) three-dimensional image; (c) histogram of surface three-dimensional grain asperities; (d) distribution curve of grain sizes.
Processes 11 03376 g007
Figure 8. Variation in the friction coefficient over time (a) and with load (b).
Processes 11 03376 g008
Disclaimer/Publisher’s Note: The statements, opinions and data contained in all publications are solely those of the individual author(s) and contributor(s) and not of MDPI and/or the editor(s). MDPI and/or the editor(s) disclaim responsibility for any injury to people or property resulting from any ideas, methods, instructions or products referred to in the content.

