Article

Investigation of a Jet-Based Direct Mixing Process for Improved Structuring of Conductive Battery Hetero-Agglomerates

1
Institute of Particle Technology, University of Wuppertal, Rainer-Gruenter-Straße 21, Geb. FF, 42119 Wuppertal, Germany
2
Institute of Solids Process Engineering and Particle Technology, Hamburg University of Technology (TUUH), Denickestraße 15 (K), 21073 Hamburg, Germany
3
Chair of Mechanical Process Engineering and Solids Processing, Technische Universität Berlin, Ernst-Reuter-Platz 1, 10587 Berlin, Germany
*
Author to whom correspondence should be addressed.
Processes 2023, 11(11), 3243; https://doi.org/10.3390/pr11113243
Submission received: 24 September 2023 / Revised: 9 November 2023 / Accepted: 15 November 2023 / Published: 17 November 2023
(This article belongs to the Section Particle Processes)

Abstract

:
A jet-based direct mixing process is used to effectively mix heterogeneous materials. In this work, its application in the structuring, coating and agglomeration of cathode materials for all-solid-state battery (ASSB) production is investigated, with the aim of increasing the homogeneity and conductivity of the composites and ultimately improving battery performance. In this process, different particle systems consisting of lithium iron phosphate (LFP), carbon black (CB) and sodium chloride (NaCl) are dispersed in the gas phase and brought together in a mixing zone as particle-laden aerosol jets. The cathode material’s structure is studied through scanning electron microscopy combined with a focussed ion beam (SEM–FIB). Electrical conductivity measurements of the resulting composites assess the degree of mixing and the changes in tortuosity, while a laser light diffractor and a cascade impactor analyse the particle size distribution (PSD). The jet-based process effectively produces hetero-agglomerates with the possibility of creating different composite structures by adjusting the process parameters. The mass concentration influences not only the structure, but also the PSD in the flow and the electrical conductivity of the composite. The results serve as a basis for future experiments with solid electrolytes to comprehensively evaluate the process and the resulting battery materials.

1. Introduction

Functional disperse particle systems with special properties are becoming increasingly important today in many areas, such as the automotive industry (e-mobility) or the energy storage (battery technology) [1]. By mixing heterogeneous particle systems, materially different particles can come into direct contact with each other (hetero-contacts), so that new special properties and functional material systems can arise through the resulting interface or in the contact between the different components. Other applications of heterogeneous composites include materials science (e.g., nanocomposites for mechanical reinforcement), the pharmaceutical industry (e.g., nanoparticles as drug carriers) and magnetic seeded filtration for water treatment [2,3,4,5,6].
The overall aim of the research approach in this work is to contribute to the development of new particulate products based on the formation of hetero-agglomerates in the gas phase. In order to achieve this goal, it is necessary to establish gas-phase-based processes that allow the controlled formation of hetero-agglomerates. As such processes are still lacking, a novel process of jet-based direct mixed agglomeration in the gas phase is proposed and its application to the production of cathode materials for all-solid-state batteries (ASSB) is investigated experimentally. ASSBs are also heterogeneous composites, as they consist of different material components that interact with each other through hetero-contacts at the interfaces. These hetero-contacts influence the ion and electron transfer, can improve the reaction kinetics and contribute to increasing the specific capacity and cycling stability of the battery [7]. With the increasing demand for high-performance and sustainable energy storage systems, the development of advanced battery materials gains importance, with ASSBs being considered as promising next-generation energy storage devices due to their high energy density, safety and long lifetime. They offer many possibilities and opportunities by having many advantages over conventional lithium-ion batteries. Since they do not use a liquid but a solid electrolyte, they are non-flammable and protected against explosions [8]. In addition, they can achieve a higher energy density due to the use of a lithium metal anode [9,10,11]. Other advantages are that the size of the battery can be reduced and the lifetime and capacity of the battery can be increased [12]. These features make them an attractive choice for a wide range of applications, from portable devices to electric vehicles and energy storage systems.
The cathode material is a critical component of ASSBs and its performance is directly related to the overall performance of the battery. As already mentioned, no liquid electrolyte is used in ASSBs, but a solid electrolyte layer takes up both the ion conductor and the electrical insulator. Nevertheless, it is necessary to have solid electrolytes in the cathode material to ensure sufficient transport of the ions through the cell. A production of the ASSBs on a laboratory scale could be realised [13]. However, the large-scale production of such cathode materials for ASSBs is still a challenge that has not yet been overcome.
In order to achieve a good product quality and ultimately enable an application in ASSBs, it is important to have sufficient mixing of the cathode material, which usually consists of an active material, conductive additive material and solid electrolyte material. Functional mixing of these three components (hetero-agglomeration) may create a composite (hetero-agglomerate) with new outstanding electrochemical and mechanical properties. In this context, both the composition of the mixture and the production conditions are of crucial importance. Figure 1 schematically illustrates the formation of hetero-agglomerates in the ideal case.
By bringing together three particle components a new composite is formed. The degree of mixing determines the distribution of the components in the mixture and thus reflects the homogeneity of the mixture [14,15]. If there is a high degree of homogeneity, a high number of contacts between the components can also be achieved. These contacts are called hetero-contacts, and the process is called hetero-agglomeration. A high degree of mixing of the cathode material of ASSBs and thus the increased formation of hetero-contacts within this composite allows the electrochemical properties of the battery to be improved by allowing the lithium ions and electrons in the active material of the cathode to intercalate [7]. The resulting hetero-agglomerates are held together by weak interaction forces (e.g., van der Waals forces, electrostatic forces or hydrogen bonds). Through further treatment (e.g., thermal stabilisation) particles of complex structure can be formed, which are called hetero-aggregates.
There are different ways to form hetero-agglomerates. In principle, a hetero-agglomerate as in Figure 1 can be formed by direct mechanical mixing [16] of different components—but in practice this is not feasible. The reason for this is that primary particles in the submicron range tend to already adhere strongly among themselves and form agglomerates on different scales with different shapes and resulting fractals [17]. Usually, the primary particles (<1 μm) first form a primary agglomerate (fractal dimension ≈ 2). These usually agglomerate into simple agglomerates (>1 μm) of compact shape (fractal dimension ≈ 2.7), which then form complex agglomerates (>>1 μm) consisting of both primary agglomerates and simple agglomerates (fractal dimension ≈ 2) [18]. Mechanical mixing is strong enough to overcome the binding forces at the scale of the complex agglomerates and possibly the simple agglomerates, but it is usually not strong enough to overcome the resulting binding forces at the scale of the primary agglomerates. Therefore, mechanical mixing leads to hetero-agglomerates, which have a low degree of mixing but also a low number of formed hetero-contacts in relation to the total number of primary particles. Under such conditions, the produced composite will show poor performance, or in case of solid-state batteries, a high amount of inactive material with poor electrical and ionic conductivity. Another possibility for the formation of hetero-agglomerates represents the formation in the gas phase [17], although fewer processes have proceeded in this way so far [19,20,21,22]. However, this situation is expected to change, as gas-phase processes in particular allow for more comprehensive process control. In addition to the electrostatic and van der Waals forces, which also play a role in this context, the properties of the flow field also influence the formation of hetero-contacts and thus hetero-agglomeration in the gas phase. In the gas phase, the synthesis of hetero-agglomerates can be achieved by mixing existing particle systems (A + B) as well as by a sequential fabrication process that often involves nucleation of the second phase (B) on the first (A). The disadvantage of the sequential manufacturing is that the particle formation is not separated from the mixing process. Therefore, limitations might prevail in terms of the parameters of the formed hetero-agglomerates. Additionally, undesired phases might result out of the sequential manufacturing process. Therefore, the approach of direct mixing in the gas phase is pursued in this project and sequential fabrication is not considered further.
To realise the direct mixed gas-phase approach proposed, there are two to three requirements that must be met. First, the deagglomeration of the individual components, preferably down to the primary particle level, must be performed. This can be realised directly in the gas flow by sheared [23], accelerated [24] or turbulent flows [25]. Another possibility is impact crushing [26,27], which is used in mill types [21] and special mixers [28]. Breaking up of agglomerates can also be implemented by mechanical shearing. This can be realised by means of aerosol generators. In this case, the particle system to be deagglomerated is mechanically stressed by a rotating brush with different feed rates using dispersing gas [29,30]. Secondly, the separated primary particles of the components forming a hetero-agglomerate must be brought together in such a way that a copious number of hetero-contacts within the composite is formed. This step must immediately follow deagglomeration, as the increase in number concentration strongly favours reagglomeration. A higher number of particles per unit volume leads to increased interactions and collisions between particles of the same material, which should be avoided. Thus, only a small time window is available between the deagglomeration of the starting materials and the formation of hetero-contacts in the mixing process. Mixing of primary particles to form hetero-contacts must often be supported by turbulence as part of a flow [31,32]. However, very little is known about the time scales of the underlying processes. Suitable flows for mixing are crossing jets, where, e.g., [33] the orientation and flow velocities strongly influence the mixing and thus the hetero-agglomerates formed, which Kolck et al. have shown in simulations [34]. In a final step, thermal stabilisation of the hetero-agglomerates formed is still possible if required [31,32].

2. Materials and Methods

2.1. Materials

For the cathode material, the substances lithium iron phosphate (LiFePO4, LFP) as the active material and carbon black (CB) as the additive were used. The suitable solid electrolyte materials, such as lithium halide (Li3lnCl6) or lithium sulphide (Li6PS5Cl), could not be used experimentally yet, because both materials often react with humidity and therefore can only be used in a dry environment [35]. For this reason, sodium chloride (NaCl) was used as a model material for the solid electrolytes in these investigations. For the investigations and characterisation of the dispersing units by means of laser light diffraction (LLD), limestone (CaCO3) was used. The properties of the materials used in the experimental investigations, including the primary particle size (diameter), the density and the mass fraction of each material in the final cathode composite, are shown in Table 1.
LFP is a cathode material that has attracted considerable attention due to its high theoretical capacity, low cost and excellent thermal stability [36,37]. However, its low electrical conductivity limits its performance as a stand-alone cathode material. To improve its conductivity and electrochemical performance, LFP is often combined with a conductive additive. In this work, a carbon coated (2 wt%) LFP was used. With a mean particle diameter of 800 nm (scattered light equivalent diameter), it is in the submicron range and has a density of 3890 kg/m3. Since a significant percentage of CB (5–20 wt%) is required to reach the percolation point of high conductivity, especially with submicron LFP particles [37], additional CB was added. With a primary particle size of 50 nm (based on transmission electron microscopy), CB is a very fine powder that has high electrical conductivity and can enhance the transport of electrons within the cathode by percolation [38,39]. As already mentioned, NaCl was used as a model material for the solid electrolyte, which could not yet be used experimentally due to its sensitivity to humidity. The reasons for choosing NaCl were that this material is easily available and inexpensive, harmless to health and not electrically conductive. The latter point was important so that the electrical conductivity of the composite can be measured without being modified by NaCl. The NaCl used has a mean particle size of 9.22 µm (Sauter mean diameter), which is significantly coarser than the other two cathode materials. The mass ratio of the three cathode materials is based on research by cooperation partners at the University of Giessen, who have tried to determine the optimum composition for the battery material in terms of its performance, which is used for all the experiments in this contribution. For the investigations of the dispersion quality of the brush dispersers when varying their process parameters, CaCO3 was used. The reason for choosing this substance was, on the one hand, that it is easily available and inexpensive. On the other hand, its well-defined and reproducible particle size distribution (PSD) allows precise control of experimental conditions and accurate evaluation of the effects of process parameters on dispersion quality. NaCl, which is also easily available, was not so well suited for these investigations due to its broad PSD and especially its high proportion of coarser particles above 10 µm. With an average particle diameter of 3 µm (scattered light equivalent diameter), the CaCO3 used is in the small micron range. The findings obtained with this substance could thus be better transferred to finer substance systems.

2.2. Methods

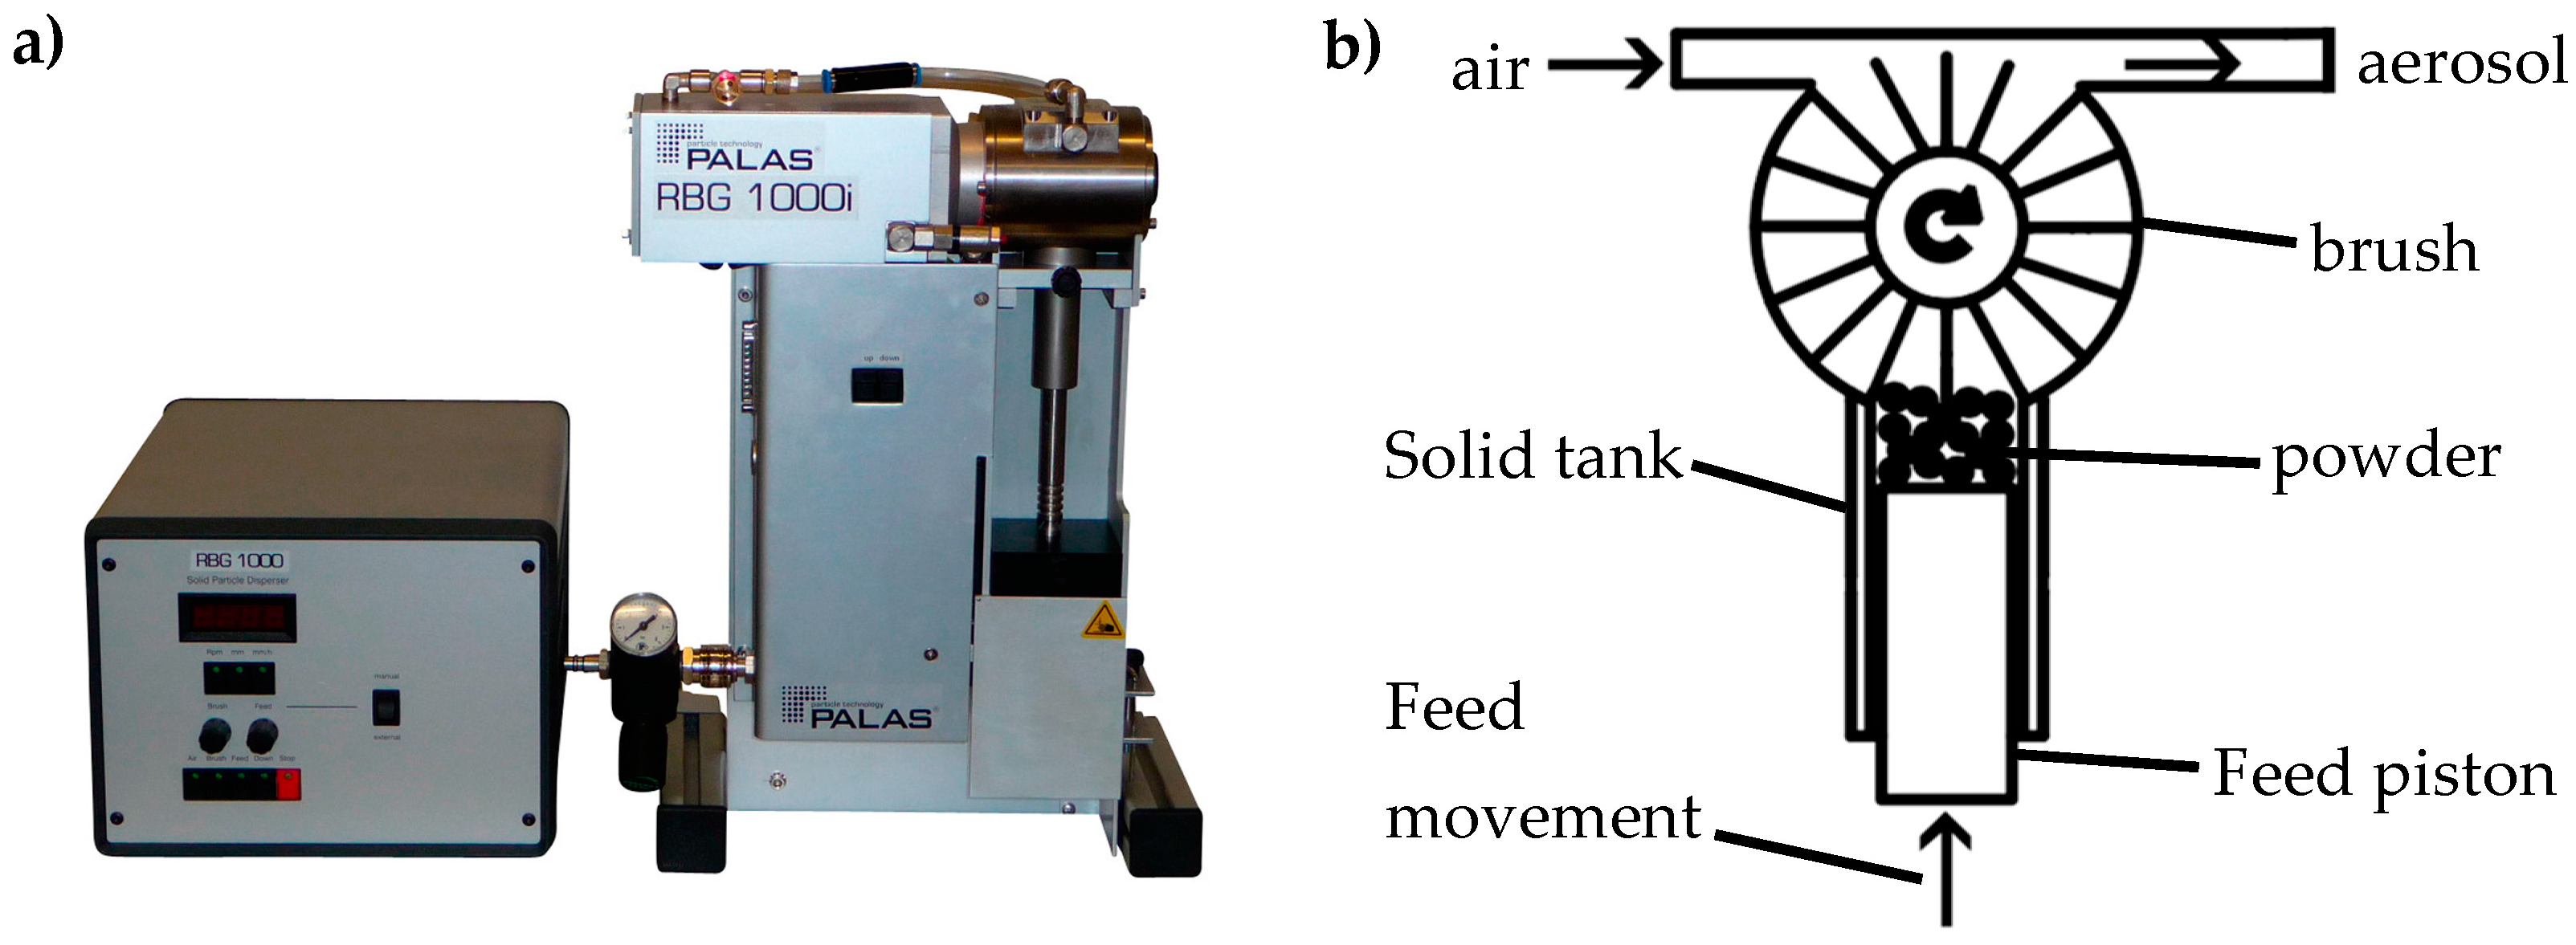
2.2.1. Operation of the Feeding Process

The starting materials described above were to be introduced into the mixing zone as an aerosol in a free jet. A separate dosing unit optimised with regard to the material properties was set up for each material. A “rotating brush feeder” with external control unit, the model RBG 1000 ISD from Palas (Karlsruhe, Germany), which is shown in Figure 2a, was used as the basic component. This device disperses and doses particles against an overpressure up to 300 kPa and can use nitrogen as a dispersing gas in addition to air. With our equipment and operating mode, the following sizes can be set in the specified ranges for the unit: gas volume flow from 2 to 5 m3/h, particle mass flow from 0.314 to 219 g/h (with a tamping density of 1 g/cm3), particle size range from 0.1 to 100 μm and particle number concentrations up to 107 cm−3. The functional principle of the dispersing unit is shown in Figure 2b. The feed unit moves upwards at an adjustable feed speed (0–700 mm/h) and pushes the feed piston upwards, feeding the powder to a rotating brush. The top layer of particles is removed from the brush and the particles and agglomerates are brought into the brush chamber, where they are transferred into the dispersing air stream, which is fed from the side. The particles can be given an additional acceleration by a beating movement of the brush bristles. Ideally, the rotating brush breaks up the particles down to the primary particle level (deagglomeration), which then leave the disperser as an aerosol jet.

2.2.2. Jet-Based Direct Mixing Process

A jet-based direct mixing process in the gas phase was proposed and realised. A photo (a) and a schematic drawing (b) of the experimental setup are shown in Figure 3. Two brush dispersers faced each other and dispersed the various particle components (LFP–CB mixture and NaCl). The generated aerosol jets then collided in a mixing zone, which was located in a vertical tube. In the mixing zone, we assume that particles and agglomerates adhere to each other due to adhesion forces and form hetero-agglomerates. After the collision, the particles can flow down the tube, mix further and continue to agglomerate. During the mixing process, the particle collective was sampled in situ at three different locations in the tube. This was performed using a scanning electron microscopy (SEM) stub (diameter = 12.7 mm), which is a sample holder used to mount and hold specimens for imaging with a scanning electron microscope. This was inserted into the flow to collect the sample. In this way, a sample could be taken directly from the gas stream and then analysed in the scanning electron microscope without further preparation. In order to investigate the properties of the agglomerates formed, further sampling took place in the lower part of the setup. On the one hand, the entire particle stream could be sampled by depositing it on a filter. This had the advantage that larger sample volumes (e.g., for conductivity measurements) could be obtained. A filter medium with an ePTFE membrane from the company Heimbach (Düren, Germany) was used for this process. Alternatively, the PSD of a partial stream could be investigated using a cascade impactor. In addition to sampling, this device also performed size fractionation of the particles and agglomerates formed. The sample collected on the filter or in the impactor could then be examined by SEM in combination with focussed ion beam (FIB). This allowed the particles to be characterised in terms of their shape, size, morphology and internal structure.
Figure 4 shows a flowchart of the experimental procedure for the proposed mixing process. All three investigated materials were first weighed out in the correct mass ratio for the desired cathode composite. After weighing, LFP was mixed together with CB. For this purpose, both materials were mixed dry for three minutes in a 3D motion mixer (Turbula®, Willy A. Bachofen AG, Muttenz, Switzerland). In this way, the active material could already be homogeneously mixed with the conductive additive. Before the mechanically premixed binary material system of LFP and CB was mixed in the gas phase with the model material for the solid electrolyte, it was broken up again in the brush disperser, ideally down to primary particle level, and dispersed in the gas phase. Since homogeneous mixing of all three cathode materials (active material, conductive additive and solid electrolyte) is important to achieve good electrochemical properties, effective mixing of these components in the gas phase is required in the mixing process proposed here. The solids tanks of the dispersing units were then each filled with the materials (LFP–CB mixture and NaCl). In order to maintain a constant dosing rate during operation of the dispersers, a constant tamping density in the solids’ container had to be ensured. For this purpose, a defined amount of solids was gradually filled into the tank, which had a constant volume, and slightly compacted each time by uniform tamping. The filled solids container was then placed in the dispersion unit and the jet-based direct mixing process was operated (see Figure 3). The ambient conditions in the laboratory were constantly recorded during these tests. The air temperature was approx. 21 °C, the humidity approx. 35% and the air pressure approx. 962 hPa. After sampling, the composites produced were analysed using various measurement techniques, which are described in detail in the next chapter.

2.2.3. Measurement Technology

Both the starting materials and the composites produced in the mixing process (see Figure 3) are examined using different measurement techniques. The measuring devices used in this work are shown in Figure 5.
In order to investigate the generated mixture in the setup, the low-pressure impactor DLPI+ from the company DEKATI (Finland) was used (see Figure 5a). Cascade impactors consist of a series of impactor stages in which the particles are separated according to their decreasing inertia, resulting in fractions with different particle sizes [40]. The cascade impactor separated particles in the size range between 16 nm and 10 µm into 14 fractions. After a gravimetric evaluation of the impactor stages, a mass-related PSD of the investigated particle collective related to the aerodynamic diameter could be determined.
A laser light diffractor (HELOS, Sympatec, Clausthal-Zellerfeld, Germany) was used to examine the aerosol jets generated by the dispersers. This device measured the PSD in relation to the scattered light equivalent diameter of the materials in the free jet after exiting the dispersers (see Figure 5b). A threefold measurement of the PSD of the investigated materials was carried out for each setting sample to improve statistical reliability.
The mixture formed could be analysed offline using imaging techniques such as SEM. In this way, the structure of the formed hetero-agglomerates could be evaluated in order to link the distribution of the particles within the agglomerate with the properties of the individual agglomerates. In this way, not only the shape, size and morphology, but also the distribution of the materials, could be characterised. The scanning electron microscope Zeiss Supra 55 VP from the company Zeiss (Oberkochen, Germany) was used for this purpose (see Figure 5c). In addition to this, FIB measurements of the materials were carried out. This measurement technique made it possible to selectively cut into a material in the smallest space (nanometre range) and directly map the material structure below the surface.
Electrical powder conductivity measurements of the produced samples were carried out to evaluate the electronic conductivity of the produced cathode material. In the measurement method, the material to be tested was examined for its electrical conductivity by applying a pressure, resulting in decreasing porosity and improved contact, resulting in a function of the electrical conductivity over applied pressure [41,42]. The Zwick Z020 materials tester from Zwick Roell (Ulm, Germany) was used to apply pressure in order to investigate the electrical conductivity in relation to the compaction of the composite materials (see Figure 5d). For the examination of one sample, three measurements were carried out with the Zwick. In each case, 1 g of the cathode powder mixture was weighed into a cylindrical specimen carrier. With the aid of the material testing machine, the powder mixture in the sample carrier was compacted with a cylinder of the same cross-sectional area between two electrically conductive plungers with increasing force (up to a maximum of 395 N) and a constant current was applied. The voltage between the plungers was measured so that the voltage drop could be investigated as a function of the force–path behaviour. By measuring the voltage, a resistance of the system was determined. This could be converted into a specific resistance. The specific conductivity was then calculated by dividing the measured path (length) by the product of the applied current and the determined resistance.

3. Results and Discussion

3.1. Characterisation of the Brush Disperser

In order to realise a comprehensive characterisation of the mixing process, the dosing and dispersing unit is first examined. For this purpose, the parameters to be set are varied and their influence on the size distribution of the generated aerosol jets is investigated by means of LLD. The gas volume flow (depending on the pre-pressure setting), the brush speed, the mass flow (depending on the feed speed setting) and the self-determined tamping density can be varied. The influence of the mass and volume flow on the measured PSD of CaCO3 is of particular interest here, and can ultimately provide information about the dispersion quality of the dosing unit. Table 2 shows an overview of the process parameters that are varied in the characterisation of the brush dispersers in order to investigate their influence on the PSD measured by LLD. In these experimental investigations, only one influencing variable is varied at a time while all other setting parameters remain constant. First, starting from case A, the mass flow was increased twice by increasing the feed rate (cases A–C). Then, starting from case D, the volume flow was reduced twice by reducing the pre-pressure (cases D–F). All measurements were carried out at the highest brush speed of 1200 rpm to achieve the best dispersion of the powders. The higher speed creates stronger mechanical forces that break up agglomerates in the powder. Furthermore, faster brush movement reduces the formation of new agglomerates, as particles have less time to reagglomerate. At the highest speed, a smaller volume of particles per rotation is also captured by the brush, which also promotes more effective dispersion. The constant tamping density in all measurements of CaCO3 is 1.17 g/cm3. The LLD measurements were carried out directly behind the outlet of the dispersers in order to avoid reagglomeration of the particles and a change in the PSD before they are measured.
Figure 6 shows the PSD of CaCO3 determined by means of LLD with variation of the mass flow (cases A–C). In the diagram, the x-axis indicates the particle size (scattered light equivalent diameter) in μm and the y-axis the mass-related distribution sum in %. In these experiments, the mass flow is varied from 110 to 257 g/h (see Table 2) and a constant volume flow of 3.5 m3/h is set. It can be seen that the PSD hardly changes when the mass flow is varied. The mass-related median is only in the particle size range of 3.6 to 3.8 µm. This suggests that the dispersion quality is largely maintained even at increased mass flows. Since a high mass flow probably promotes hetero-agglomeration (see [34]), it makes sense to choose a high feed rate, since this obviously hardly influences dispersion.
Figure 7 shows the PSD of CaCO3 determined by means of LLD with variation of the volume flow (cases D–F). For comparison, the primary PSD of the used CaCO3 measured by LLD by the producer (Eduard Merkle GmbH) is also shown. However, when varying the volume flow of the dispersers, clear differences in the PSD can be observed. Here, the volume flow is varied between 2.5 and 5 m3/h and a constant mass flow of 184 g/h is set (cases D–F). It can be seen that a lower gas supply results in a shift of the PSD to coarser particle sizes, particularly evident at a flow rate of 2.5 m3/h. At the highest volume flow, the median particle size is 3.3 µm, while at the lowest flow rate it is 4.75 µm. One reason for this could be the sharp increase in the particle number concentration, which increases the probability of collisions between the particles and thus homo-agglomerate formation. On the other hand, it may be due to the fact that a lower gas flow means that the particles exit the disperser more slowly due to the lower gas velocity and have more time to reagglomerate. In addition, a poorer distribution of particles in the gas phase occurs at a lower volume flow, which can lead to collisions between particles and agglomerate formation. Furthermore, dispersing air assists in breaking up agglomerates, so a lower gas supply could worsen deagglomeration, resulting in more coarse agglomerates exiting the disperser. When comparing the PSD at lowest volume flow (case D) with the producer’s PSD (see Figure 7), only a slight deviation can be observed. This is also underlined by the fact that the median particle size is in a similar range. This suggests that the dispersion of these materials with the brush dispersers works well, thus underlining the justification of their use in this mixing process.
The choice of the set parameters has a considerable influence on the formation of hetero-agglomerates. In addition to the particle concentration, the residence time of the particles in the mixing zone (depending on the volume flow) also plays an important role in promoting hetero-agglomeration (see [34]). To increase the particle concentration, it is therefore advisable to increase it via the mass flow, as it has a lower influence on the dispersing effect of the brush dispersers (see Figure 6). The residence time, on the other hand, can be increased via a lower volume flow, although this should not be selected too low to ensure good dispersion (see Figure 7). Therefore, the influencing parameters of the mixing process should be adjusted to maximise the promotion of hetero-agglomeration while ensuring acceptable dispersion and no excessive homoagglomeration prior to the mixing process.

3.2. Investigation of the Feed Material

A detailed understanding of the starting materials is essential before examining the mixing process. This enables valuable insights into their properties and composition, which are helpful for the analysis of the composites produced. For optical analysis, the materials are examined using SEM. This makes it possible to investigate them in terms of their size, shape and morphology in order to identify them later in the produced mixtures and compare them with the agglomerates formed. Figure 8 shows SEM images of the individual starting materials LFP (a), CB (b) and NaCl (c) as well as a LFP–CB mixture (d). Comparing the images with each other, differences can be seen with respect to the structure and size of the particles and agglomerates. The LFP particles exhibit a regular crystal structure and are predominantly in the submicron size range (a). CB, on the other hand, exhibits a porous, highly branched structure and its particles are predominantly in the nanometre size range (b). The difference in size between the two materials is evident from the SEM image of the LFP–CB mixture (d). NaCl consists of larger partly cubic crystals, whose particles are significantly larger (micrometre range) and have a wide particle size range. The aforementioned differences allow the three substances in the cathode composite to be distinguished microscopically.
Furthermore, it is important to examine both materials used in the dispersers individually with regard to their size distribution before they meet in the mixing zone. For this purpose, the PSD of the feed jets after leaving the dispersers is measured by means of LLD. Here, the PSD of the aerosol jet is not measured directly behind the outlet of the dispersers (as in Section 3.1), but after exiting the feed tubes (length = 210 mm), which are connected to the dispersers and represent the connecting piece to the large vertical tube in the mixing process. In this way, the aerosol entering the mixing zone can be examined.
Table 3 shows the settings and parameters of the feed materials NaCl (cases A–C) and LFP–CB (cases D–F) that were adjusted during the experiments to produce the cathode composites. In these experiments, the mass concentration of the aerosol is in the focus and is varied. Starting from a low mass concentration, the mass concentration is increased twice by increasing the mass flow and decreasing the gas volume flow. The choice of parameters aims to test and compare different settings with large variation in the influencing variables to cover a wide range and identify potential differences in the composites by means of impactor and SEM. Furthermore, it is important to compare the results of these tests with the findings from Section 3.1 to better understand correlations and deviations. The set parameters are adapted to the required mass ratio of the three cathode materials in the composite to be produced, which is always the same (see Table 1). As already mentioned, this is based on the findings of research partners at the University of Giessen on the optimal composition of the battery material with regard to its performance.
Figure 9 shows the PSD of the used NaCl measured by LLD at three different mass concentrations (cases A–C). In the diagram, the cumulative distribution is plotted as a function of the particle size x (scattered light equivalent diameter). In addition to the mass-related PSD at the three different mass concentrations, the mean number-related PSD of these three cases is also shown. The diagram shows that the mass-related PSD shifts slightly into the coarser range when the mass concentration is increased. At the lowest mass concentration of 2.7 g/m3, a median particle size of 10.5 µm is measured, whereas at the highest concentration (43.6 g/m3) it is 12.4 µm. In the LLD measurement of the LFP–CB mixture (see Figure 10), the shift of the mass-related PSD with increasing mass concentration (cases D–F) can be observed even more clearly. At the lowest mass concentration of 4.81 g/m3, the mass median is still 1.58 µm. When the mass concentration is increased to 74.3 g/m3, the median is 4.88 µm. This difference in PSD when varying the mass concentration can have different reasons. On the one hand, it is due to the influences on the dispersing effect of the brush dispersers described in Section 3.1. Increasing the mass concentration (especially reducing the volume flow) can cause a poorer dispersion of the starting materials. As a result, a higher proportion of coarser, unbroken agglomerates can exit the disperser, shifting the PSD into a coarser range. Especially the lower air supply has a clear influence on the dispersion quality (see Figure 7). On the other hand, the increased formation of agglomerates in the aerosol jet can also be a reason for the shift in PSD. After exiting the dispersers, the aerosol jets still flow through the feed tubes (length = 210 mm) before exiting as a free jet and being detected by the laser light diffractor. As the mass concentration increases, there is a greater chance of collisions between particles in the feed tubes. In these collisions, the particles can stick together and form larger agglomerates. This creates larger particles in the size distribution. Compared to the mixture of LFP and CB, the tests with NaCl show a less significant shift of the PSD into a coarser range with increasing mass concentration. This observation can be explained by the fact that agglomeration is less pronounced with NaCl. This is due to the already comparatively larger primary particles of NaCl. Since agglomeration tends to occur more strongly with smaller particles, the larger particle size of NaCl reduces the tendency to agglomeration. The additionally presented number-related PSD for the NaCl and LFP-CB mixture illustrate that a considerable proportion of fine particles is present in these materials. The number-related median is 1.15 µm for NaCl and 0.96 µm for the LFP-CB mixture. This is in marked contrast to the mass-related PSD, where the median is significantly higher. This difference is particularly pronounced in the case of NaCl. The mass-related PSD refers to the weight or mass of the particles in each size class. Larger particles, which have more mass, have a greater influence in the mass-based distribution. If there are few large particles, they can dominate the entire distribution, even if the number of these large particles is relatively small. Number-based distribution, on the other hand, looks at the number of particles in each size class, regardless of their mass. Smaller particles have a greater influence on the number-based PSD, as they tend to occur more frequently.

3.3. Examination of the Cathode Composite

3.3.1. Cascade Impactor
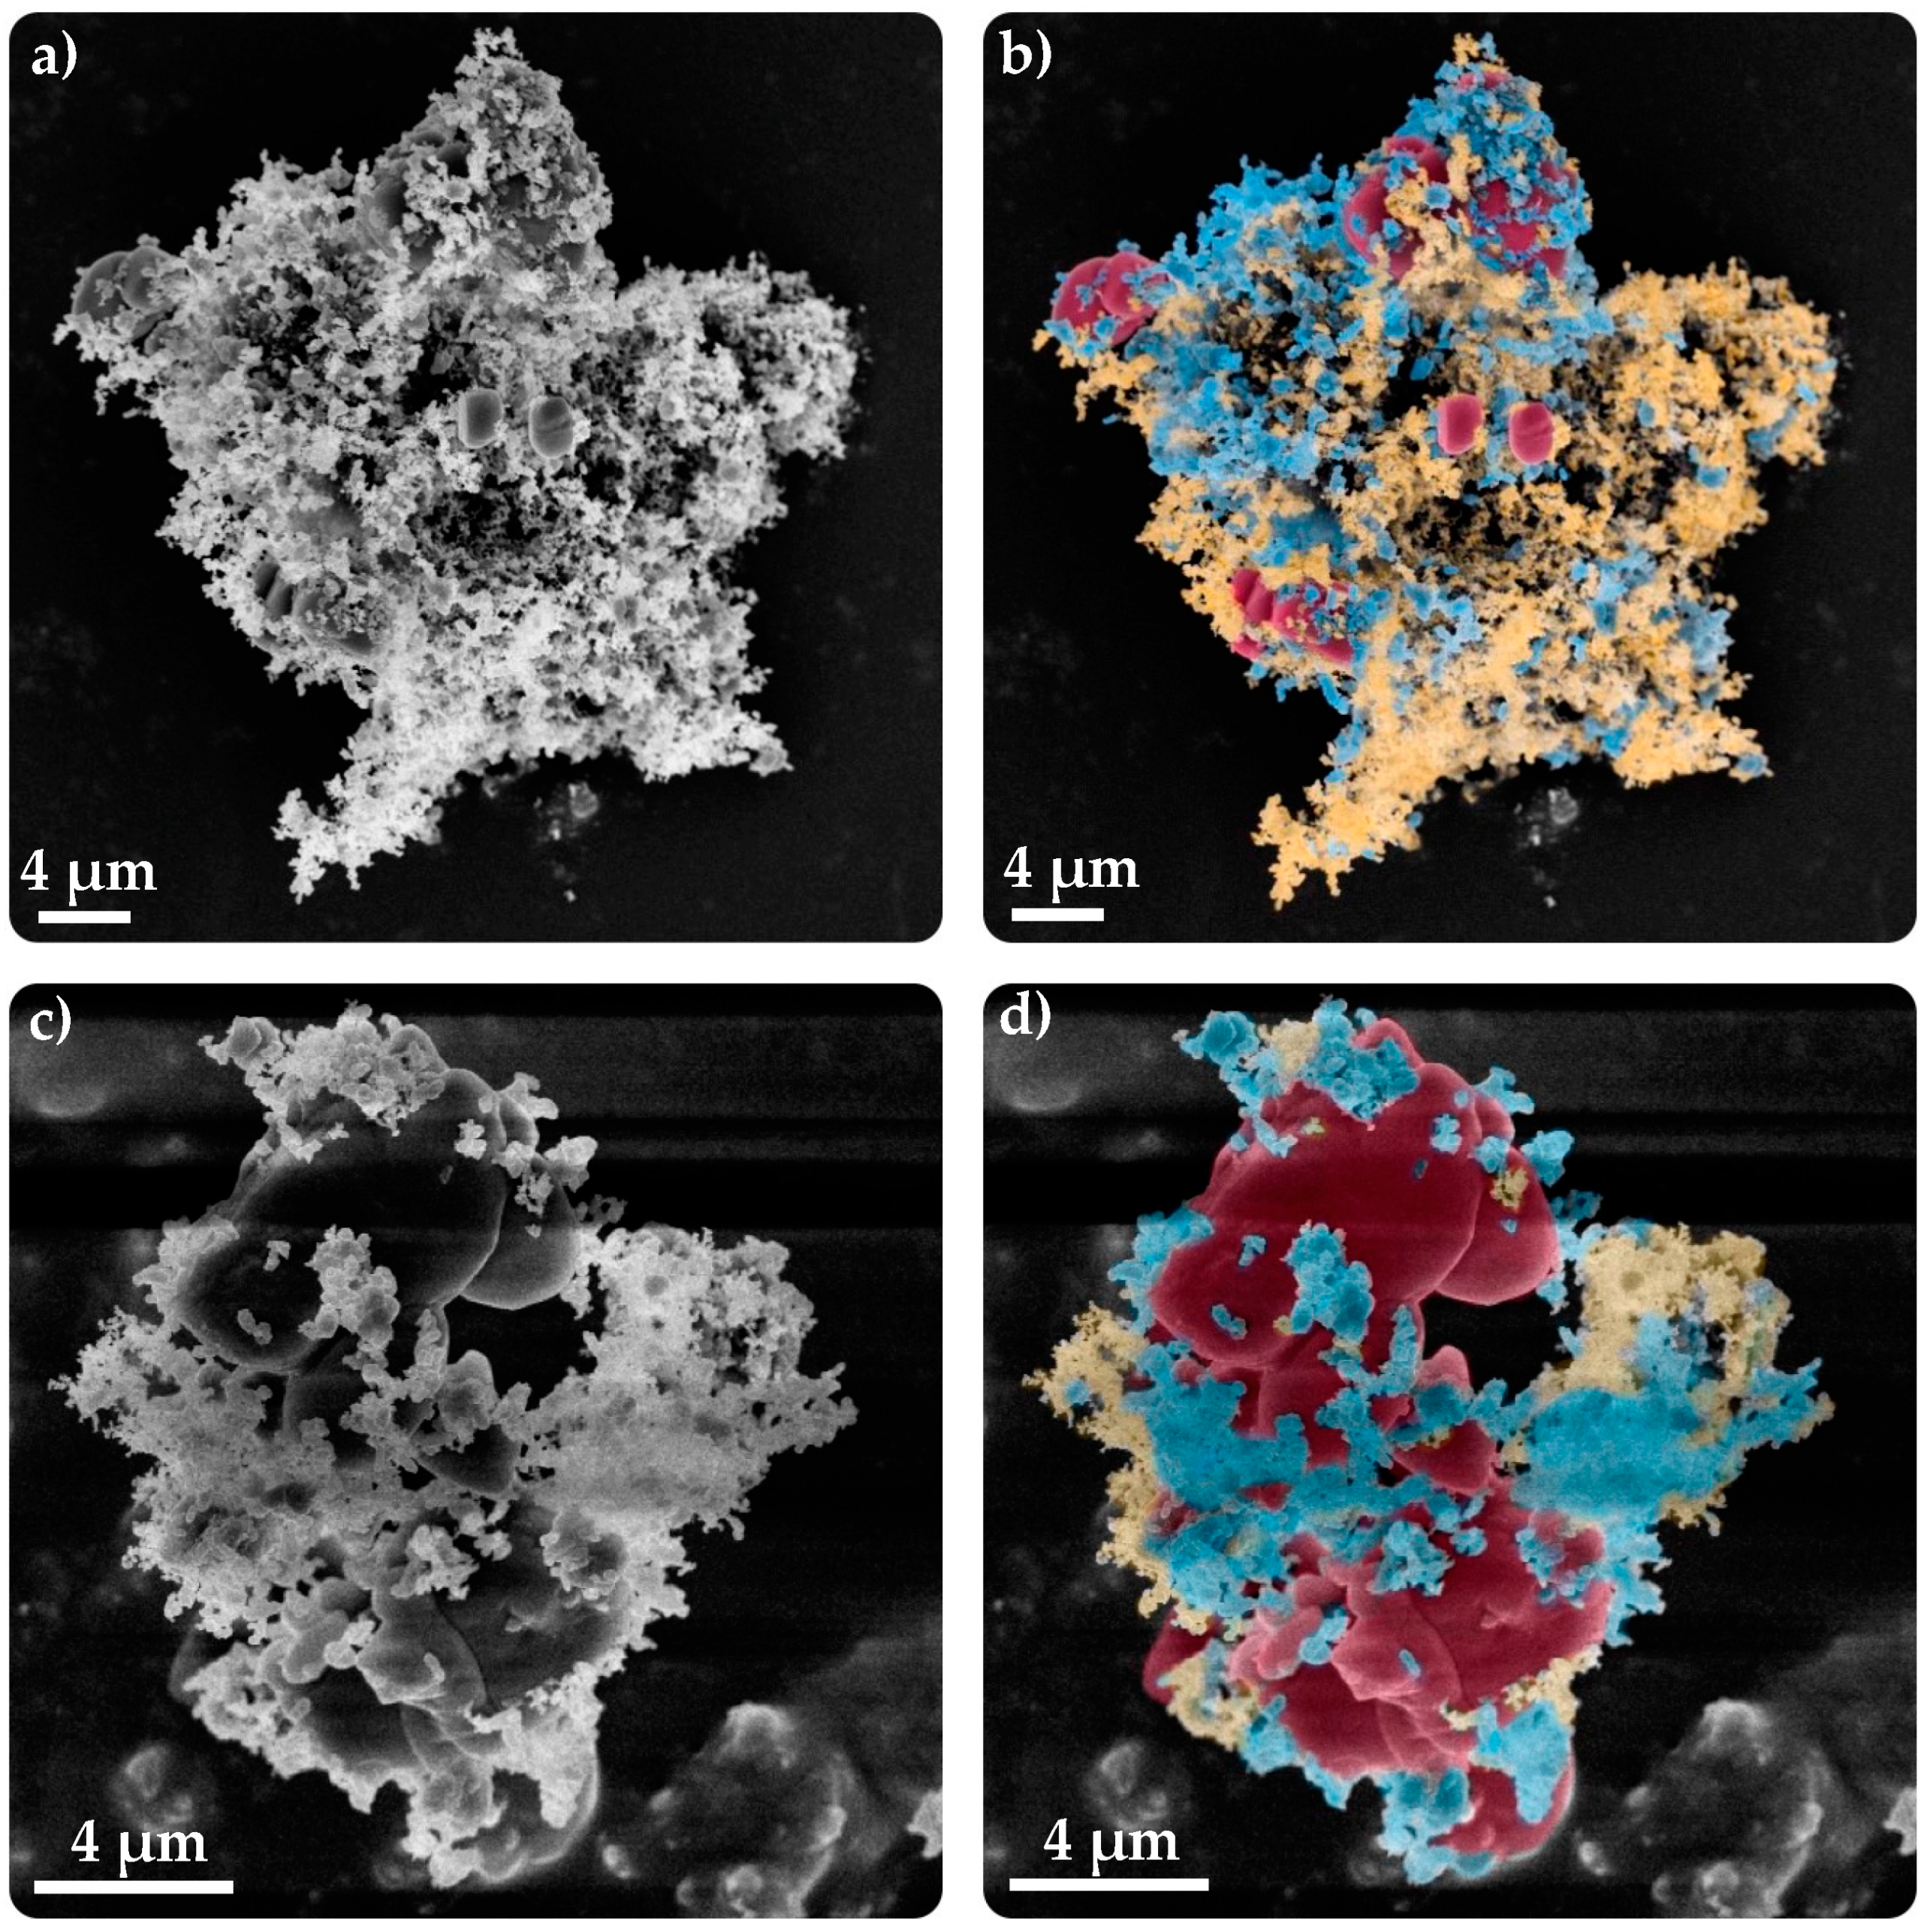
After the investigation of the dispersing units and the starting materials, the focus is on the operation of the jet-based mixing process for the production of the cathode material. The examination of the formed composite is an important and extensive part of this work. Table 4 shows the process parameters investigated in the production of the cathode composite in the mixing process (cases A–C). This refers to the cumulative values of all parameters that influence the mixing process. This means that the sum of the individual parameter values for NaCl and the LFP-CB mixture from Table 3 is meant for each case. These parameters are examined in all subsequent investigations of the cathode mixture.
To investigate the size distribution of the composite produced in the direct mixing process, a partial stream is taken from the process using a cascade impactor. During sampling, a size fractionation by inertial separation takes place at the same time, which can subsequently be evaluated gravimetrically. Figure 11 shows the mass-related PSD of the cathode composite produced when different mass concentrations (cases A–C) are set at the dispersers (see Table 4). In the diagram, the particle size (aerodynamic diameter) in µm is plotted on the x-axis and the mass-related cumulative distribution in % on the y-axis. As with the LLD measurements of the feed materials, a shift of the PSD into a coarser range can be observed when the mass concentration is increased. This is also shown by the determined mass medians of the experiments for the different mass concentrations, which range from 1.17 µm (at 3.81 g/m3) to 1.86 µm (at 59 g/m3). However, the shift in the PSD is not as large as in the LLD measurements (see Figure 10). The deviations from the PSD of the feed materials measured with LLD are mainly due to the different particle size ranges detected by the two measuring devices. The cascade impactor can measure particles in the range from 0.016 µm to 10 µm, while the laser light diffractor can detect particles between 0.9 µm and over 100 µm. When comparing the PSD determined with the impactor with the PSD of NaCl by means of LLD (see Figure 9), it can be seen that a large proportion of the NaCl particles are not detected with the impactor. Therefore, this is the main reason why the determined mass median of the materials in the impactor experiments is significantly lower than in the LLD measurements. In addition, the measurement methods used involve the detection of different particle diameters. The laser light diffractor measures the particle size based on the intensity of the scattered light, i.e., the scattered light equivalent diameter of the diffraction-equivalent sphere. In the cascade impactor, the size fractionation of particles is based on the aerodynamic diameter. It is defined as the diameter of a spherical particle with a unit density and the same settling velocity as the actual particle. In addition, the laser light diffractor captures the entire aerosol flow immediately after it leaves the feed tubes of the dispersers and analyses the individual feed materials. The impactor, on the other hand, takes a partial stream during the mixing process and examines the entire cathode composite sample.

3.3.2. SEM–FIB

The optical examination of the produced mixtures is carried out by means of SEM in combination with FIB. In this way, findings can be obtained about the size, morphology and structure as well as the internal structure of the particles. Figure 12 shows three SEM samples of the cathode composite taken directly from the flow at the second sampling point for the SEM stubs. These are one sample each with a low, medium and high mass concentration, corresponding to the investigations of the composites in the mixing process (see Table 4). It can be seen that, at the lowest mass concentration (see Figure 12a), the sample is very lightly loaded with particles and only a few agglomerates are visible. The particles in the air are relatively far apart, so the interactions between the particles are limited. As a result, the probability of particle collision is lower and fewer agglomerates are formed. As the mass concentration increases, the particle load on the samples increases, which favours increased interactions between the particles (see Figure 12b). The smaller the distance between them, the more likely they are to collide and form agglomerates. The agglomerates may also have a broader size distribution as more particles are involved in the agglomeration formation. At high mass concentrations, the probability of collision and agglomeration is significantly increased (see Figure 12c). The particles are close together and the number and size of the agglomerates formed increases as more particles contribute to the agglomeration. Poorer deagglomeration of the feed materials due to the high volume flow may also be a reason for the increased occurrence of larger agglomerates in the sample (see Figure 7). Although higher mass concentrations lead to increased particle agglomeration and thus favour the formation of complex structures, the volume flow should nevertheless not be chosen too low, as this can lead to a deterioration in the dispersion of the starting materials, resulting in a less homogeneous mixture. Therefore, it is better to increase the mass concentration via the mass flow (see Figure 6). The medium concentration (see Figure 12b) could represent a good compromise of high mass concentration with still good dispersion, as here, many agglomerates as well as some fine particles can be seen, indicating a previous good dispersion. In addition, the high loading of the samples at the highest mass concentration means that the details of the surface structure of the agglomerates formed can be obscured. This makes the interpretation of high loading SEM images more difficult as it can be difficult to distinguish between the particles and the agglomerates formed. For this reason, only the lowest and medium mass concentrations (cases A and B) are considered below for a more detailed SEM investigation of hetero-agglomeration.
In addition, SEM samples of the cathode composite from different sampling methods were compared (see Figure 13). The upper sample (a) and (b) was collected at the second position for SEM stubs directly in the flow at a set mass concentration of 3.81 g/m3 (case A), while the lower (c) and (d) was deposited on a filter at a mass concentration of 32 g/m3 (case B). The SEM images on the right (b) and (d) are false colour images of the respective sample on the left. These images were segmented by colour using an image processing programme in order to illustrate and clarify the differentiation of the heterogeneous particles in the mixture. When comparing the two sampling methods, differences in the structure of the cathode composite can be recognised. It is evident that the filter sample is more densely loaded with particles than the SEM sample from the flow due to the higher concentration. In addition, significantly more NaCl particles can be recognised there and the degree of mixing also appears to be higher. Furthermore, the NaCl agglomerates in the filter sample are more heavily coated with the LFP and CB particles. The differences between the samples are mainly due to the sampling method. With in situ sampling, only a small amount of sample is taken from the flow, while a much larger amount is deposited on the filter.
The formation of hetero-agglomerates in the mixing process was also investigated by SEM. Figure 14 shows exemplary SEM images of hetero-agglomerates formed from the starting materials NaCl, LFP and CB in the proposed mixing process and collected on a SEM stub in the flow. In addition, a false colour image of each sample (b) and (d) is shown to highlight the heterogeneous particles within the agglomerate and to show the relatively homogeneous distribution within the mixture. When comparing the different hetero-agglomerates, differences in size and structure can be observed. The upper hetero-agglomerate (a) and (b) was formed in the tests with the lowest mass concentration of 3.81 g/m3 (see Table 4). It is noticeable here that the individual primary particles and agglomerates that make up the total hetero-agglomerate are relatively small. This observation indicates a previously effective dispersion of the starting materials. The lower hetero-agglomerate (c) and (d) was produced in the experiments with the mean mass concentration of 32 g/m3 (see Table 4). This hetero-agglomerate is composed of larger LFP-CB agglomerates. This could be explained by the findings from the investigations of the starting materials using LLD (see Figure 10). Thus, an insufficient dispersion of the starting materials and a renewed agglomeration of the particles in the feed tube of the disperser would be the cause for the shift of the PSD into a coarser range. The significantly larger primary particles of NaCl in this agglomerate are due to random circumstances. NaCl shows a broad PSD ranging from fine to coarse particle sizes (see Figure 9). The hetero-agglomerates shown in Figure 14, which were collected directly in the flow, are only present on the SEM samples in isolation and at a considerable distance from other particles. From these observations, it can be concluded with a high degree of probability that the hetero-agglomerates were already formed in the flight phase and not only during contact with the SEM stub.
In order to also gain insight into the internal structure of the composites and agglomerates formed, FIB measurements were carried out with the samples. The aim of these measurements was to investigate the homogeneous distribution of the components inside the samples. Figure 15 shows an exemplary FIB cross-section of a sample of the cathode composite produced during the mixing process and collected on a SEM stub. This sample was produced at a mass concentration of 34 g/m3 (case B). The FIB image in Figure 15 gives an insight into the distribution of the different particles in the sample. It can be seen that all three materials (LFP, CB, NaCl) are relatively homogeneously distributed in the cathode composite, although a good differentiation of the heterogeneous materials is not possible in the FIB image, as for example in Figure 14.

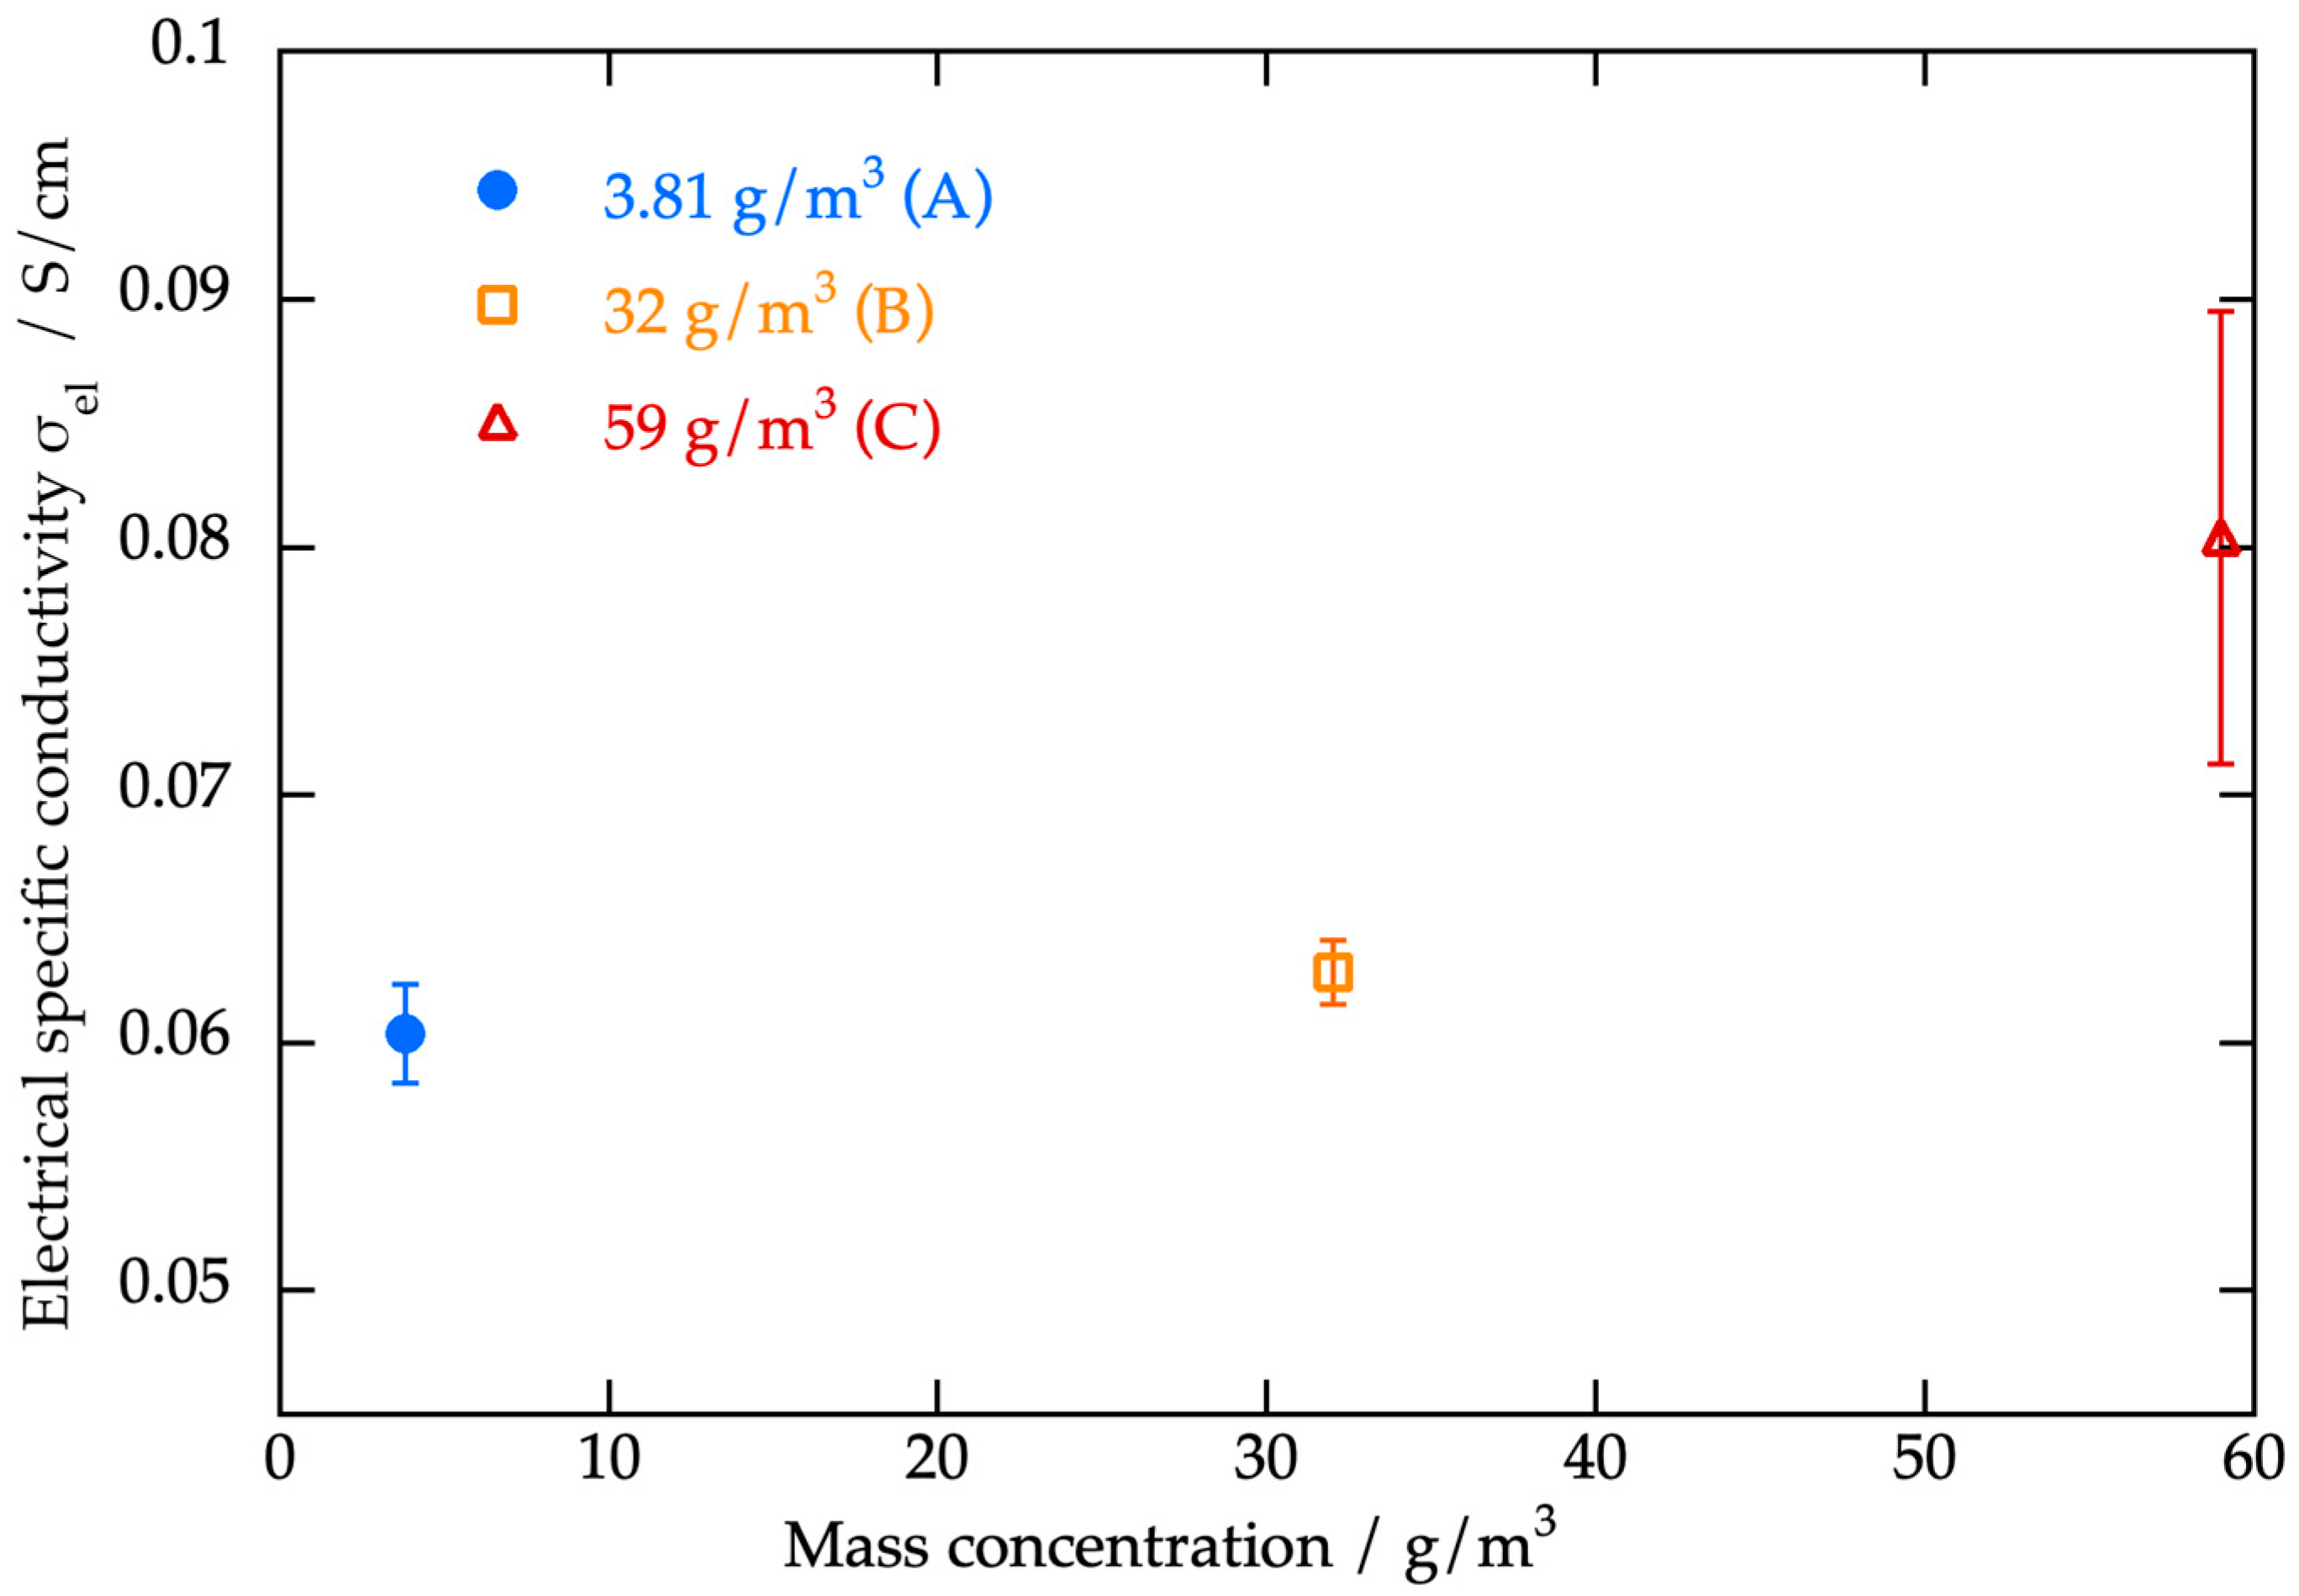
3.3.3. Electrical Conductivity Measurements

In the course of analysing the electrochemical properties of the composites produced, the electrical conductivity of the cathode materials is measured in this work. By measuring these values, the aim is to qualitatively assess the distribution of CB within the entire cathode material (active material, solid electrolyte). At the same time, it is intended to explore potential correlations between the parameters to be set in the mixing process and the measured values of electrical conductivity. As explained in Section 2.1, the Zwick Z020 materials tester is used to apply pressure to the specimen to investigate electrical conductivity in relation to compaction of the composites. The maximum compressive force in these measurements is 395 N.
Figure 16 shows the measured electrical conductivities (with standard deviation) of the produced cathode composites under variation of the mass concentration in the mixing process (cases A–C). It should be emphasised, that the input mass ratio of the three materials is always the same in the experiments. At the set mass concentrations, an electrical conductivity of approximately 0.06 to 0.08 S/cm was measured. For comparison, the electrical conductivity of the raw materials LFP and CB was also measured using the same measurement method. An electrical conductivity of 0.0123 S/cm was measured for LFP and 6.76 S/cm for CB. It can be seen in Figure 16 that the conductivity of the composite increases when the mass concentration is increased. On the one hand, this can be attributed to the increased particle interactions in the gas phase at the higher mass concentration (see Figure 12). Due to the many particle collisions and agglomerate formations in the gas phase, a better pre-structuring of the mixture can occur. This can have an influence on the percolation of the CB particles within the active material and thus on the electrical conductivity of the composite. On the other hand, the results can also be explained by sources of error during the mixing process. It is possible that during the process material losses of NaCl and LFP take place and finally a higher proportion of CB is present in the composite, which influences the measured electrical conductivity. These are also important findings that are taken into account when planning a new experimental setup.

4. Conclusions

With the aim of improving the structuring of conductive battery hetero-agglomerates for ASSBs, this work has addressed the use of a jet-based direct mixing process.
The investigations of the brush disperser by means of LLD provided important findings on the influence of the mass and especially the volume flow (dispersing air volume) on the dispersion quality of the particulate components. With a set high volume flow of 5 m3/h, the dispersion of the investigated materials works very well (see Figure 7). If this is reduced to 2.5 m3/h, the dispersing effect becomes worse and more coarse particles and agglomerates emerge from the aerosol jet of the disperser.
When the produced composites are examined by SEM, an increased formation of hetero-agglomerates and a uniform distribution of particles within the mixture can be observed. This indicates that the brush dispersers effectively break up and disperse the input materials and bring them together with the various primary particles. In the SEM samples at low mass concentration (3.81 g/m3), the particles are far apart in the process, reducing the probability of collisions and interactions between the particles, whereas as the mass concentration increases (up to 59 g/m3), particle interactions increase, leading to increased agglomerate formation.
Electrical conductivity measurements of the composites showed that an increase in mass concentration resulted in an increase in electrical conductivity (from 0.06 to 0.08 S/cm). This may be due to increased particle interactions as a result of the higher concentration in the gas phase, leading to an improvement in the conductive pathways of the CB particles within the active material.
The results suggest that the use of the jet-based direct mixing process can lead to significant improvements in the structure and conductivity of battery hetero-agglomerates, which can enhance the performance of batteries. Further research should be carried out to investigate the effects of the mixing process on other battery materials, particularly suitable solid electrolyte materials (e.g., Li3lnCl6 and Li6PS5Cl). The use of these materials opens up possibilities for comprehensive electrochemical characterisation of the produced composites, including the measurement of ionic conductivity and capacity.

Author Contributions

Conceptualization, J.W., Z.C.H., V.K., H.K.-E., S.H. and E.S.; methodology, J.W., V.K., H.K.-E. and E.S.; validation, J.W.; investigation, J.W. and Z.C.H.; writing—original draft preparation, J.W.; writing—review and editing, J.W., Z.C.H., V.K., H.K.-E., S.H. and E.S.; visualization, J.W. and Z.C.H.; supervision and project administration, E.S.; funding acquisition, H.K.-E., S.H. and E.S. All authors have read and agreed to the published version of the manuscript.

Funding

This research was funded by the Deutsche Forschungsgemeinschaft (DFG, German Research Foundation), project 462460600 and 462397288, and Open Access Publication Fund of the University of Wuppertal.

Data Availability Statement

Data are contained within the article.

Acknowledgments

The authors acknowledge support from the Open Access Publication Fund of the University of Wuppertal. We thank the staff of the TU Braunschweig for carrying out the electrical conductivity measurements of the samples and for providing the results.

Conflicts of Interest

The authors declare no conflict of interest.

References

  1. Liua, H.; Cheng, X.; Chong, Y.; Yuana, H.; Huanga, J.-Q.; Zhang, Q. Advanced electrode processing of lithium ion batteries: A review of powder technology in battery fabrication. Particuology 2021, 57, 56–71. [Google Scholar] [CrossRef]
  2. Chen, Q.; Gong, S.; Moll, J.; Zhao, D.; Kumar, S.K.; Colby, R.H. Mechanical Reinforcement of Polymer Nanocomposites from Percolation of a Nanoparticle Network. ACS Macro Lett. 2015, 4, 398–402. [Google Scholar] [CrossRef]
  3. Tahara, K. Pharmaceutical formulation and manufacturing using particle/powder technology for personalized medicines. Adv. Powder Technol. 2020, 31, 387–392. [Google Scholar] [CrossRef]
  4. Rhein, F.; Nirschl, H.; Kaegi, R. Separation of Microplastic Particles from Sewage Sludge Extracts Using Magnetic Seeded Filtration. Water Res. X 2022, 17, 100155. [Google Scholar] [CrossRef] [PubMed]
  5. Rhein, F.; Kaiser, S.; Rhein, M.; Nirschl, H. Agglomerate processing and recycling options in magnetic seeded filtration. Chem. Eng. Sci. 2021, 238, 116577. [Google Scholar] [CrossRef]
  6. Adin, H.; Adin, M.S. Effect of particles on tensile and bending properties of jute epoxy composites. Mater. Test. 2022, 64, 401–411. [Google Scholar] [CrossRef]
  7. Schmaltz, T.; Wicke, T.; Weymann, L.; Voß, P.; Neef, C.; Thielmann, A. Solid-State Battery Roadmap 2035+; Fraunhofer ISI: Karlsruhe, Germany, 2022. [Google Scholar] [CrossRef]
  8. Sveinbjörnsson, D.Þ.; Vegge, T.; Norby, P.; Mogensen, M.B. Design and Characterisation of Solid Electrolytes for All-Solid-State Lithium Batteries; Department of Energy Conversion and Storage, Technical University of Denmark: Kongens Lyngby, Denmark, 2014. [Google Scholar]
  9. Janek, J.; Zeier, W.G.A. Solid future for battery development. Nat. Energy 2016, 1, 16141. [Google Scholar] [CrossRef]
  10. Helmers, L.; Froböse, L.; Friedrich, K.; Steffens, M.; Kern, D.; Michalowski, P.; Kwade, A. Sustainable Solvent-Free Production and Resulting Performance of Polymer Electrolyte-Based All-Solid-State Battery Electrodes. Energy Technol. 2021, 9, 2000923. [Google Scholar] [CrossRef]
  11. Dixit, M.B.; Muralidharan, N.; Parejiya, A.; Amin, R.; Essehli, R.; Belharouak, I. Current Status and Prospects of Solid-State Batteries as the Future of Energy Storage. In Management and Applications of Energy Storage Devices; IntechOpen: London, UK, 2021. [Google Scholar] [CrossRef]
  12. Kartini, E.; Genardy, C.T. The Future of All Solid State Battery. IOP Conf. Ser. Mater. Sci. Eng. 2020, 924, 012038. [Google Scholar] [CrossRef]
  13. Hu, Y.-S. Batteries, Getting solid. Nat. Energy 2016, 1, 16042. [Google Scholar] [CrossRef]
  14. Bhalode, P.; Ierapetritou, M. A review of existing mixing indices in solid-based continuous blending operations. Powder Technol. 2020, 373, 195–209. [Google Scholar] [CrossRef]
  15. Lacey, P.M.C. Developments in the theory of particle mixing. J. Appl. Chem. 2007, 4, 257–268. [Google Scholar] [CrossRef]
  16. Poux, M.; Fayolle, P.; Bridoux, D.; Bousquet, J. Powder mixing: Some practical rules applied to agitated systems. Powder Technol. 1991, 68, 213–234. [Google Scholar] [CrossRef]
  17. Salameh, S.; Gómez-Hernández, J.; Goulas, A.; van Bui, H.; van Ommen, J.R. Advances in scalable gas-phase manufacturing and processing of nanostructured solids: A review. Particuology 2017, 30, 15–39. [Google Scholar] [CrossRef]
  18. Yao, W.; Guangsheng, G.; Fei, W.; Jun, W. Fluidization and agglomerate structure of SiO2 nanoparticles. Powder Technol. 2002, 124, 152–159. [Google Scholar] [CrossRef]
  19. Cerbelaud, M.; Videcoq, A.; Abélard, P.; Ferrando, R. Simulation of the heteroagglomeration between highly size-asymmetric ceramic particles. J. Colloid Interface Sci. 2009, 332, 360–365. [Google Scholar] [CrossRef]
  20. Gockeln, M.; Pokhrel, S.; Meierhofer, F.; Glenneberg, J.; Schowalter, M.; Rosenauer, A.; Fritsching, U.; Busse, M.; Mädler, L.; Kun, R. Fabrication and performance of Li4Ti5O12/C Li-ion battery electrodes using combined double flame spray pyrolysis and pressure-based lamination technique. J. Power Sources 2018, 374, 97–106. [Google Scholar] [CrossRef]
  21. Perez-Vaquero, J.; Valverde, J.M.; Quintanilla, M.A.S. Flow properties of CO2 sorbent powders modified with nanosilica. Powder Technol. 2013, 249, 443–455. [Google Scholar] [CrossRef]
  22. Grossmann, H.K.; Grieb, T.; Meierhofer, F.; Hodapp, M.-J.; Noriler, D.; Gröhn, A.; Meier, H.F.; Fritsching, U.; Wegner, K.; Mädler, L. Nanoscale mixing during double-flame spray synthesis of heterostructured nanoparticles. J. Nanopart. Res. 2015, 17, 174. [Google Scholar] [CrossRef]
  23. Eggersdorfer, M.L.; Kadau, D.; Herrmann, H.J.; Pratsinis, S.E. Fragmentation and restructuring of soft-agglomerates under shear. J. Colloid Interface Sci. 2010, 342, 261–268. [Google Scholar] [CrossRef] [PubMed]
  24. Endo, Y.; Hasebe, S.; Kousaka, Y. Dispersion of aggregates of fine powder by acceleration in an air stream and its application to the evaluation of adhesion between particles. Powder Technol. 1997, 91, 25–30. [Google Scholar] [CrossRef]
  25. Ammar, Y.; Dehbi, A.; Reeks, M.W. Break-Up of Aerosol Agglomerates in Highly Turbulent Gas Flow. Flow Turbul. Combust. 2012, 89, 465–489. [Google Scholar] [CrossRef]
  26. Froeschke, S.; Kohler, S.; Weber, A.P.; Kasper, G. Impact fragmentation of nanoparticle agglomerates. J. Aerosol Sci. 2003, 34, 275–288. [Google Scholar] [CrossRef]
  27. Seipenbusch, M.; Toneva, P.; Peukert, W.; Weber, A.P. Impact fragmentation of metal nanoparticle agglomerates. Part. Part. Syst. Charact. 2007, 24, 193–200. [Google Scholar] [CrossRef]
  28. Yang, J.; Sliva, A.; Banerjee, A.; Dave, R.N.; Pfeffer, R. Dry particle coating for improving the flowability of cohesive powders. Powder Technol. 2005, 158, 21–33. [Google Scholar] [CrossRef]
  29. Gudziol, H.; Blau, B.; Stadeler, M. Investigations of nasal deposition efficiency of wheaten flour and corn starch. Laryngorhinootologie 2009, 88, 398–404. [Google Scholar] [CrossRef]
  30. Myojo, T.; Oyabu, T.; Nishi, K.; Kadoya, C.; Tanaka, I.; Ono-Ogasawara, M.; Sakae, H.; Shirai, T. Aerosol generation and measurement of multi-wall carbon nanotubes. J. Nanopart. Res. 2009, 11, 91–99. [Google Scholar] [CrossRef]
  31. Holunga, D.M.; Flagan, R.C.; Atwater, H.A. A Scalable Turbulent Mixing Aerosol Reactor for Oxide-Coated Silicon Nanoparticles. Ind. Eng. Chem. Res. 2005, 44, 6332–6341. [Google Scholar] [CrossRef]
  32. Teleki, A.; Buesser, B.; Heine, M.C.; Krumeich, F.; Akhtar, M.K.; Pratsinls, S.E. Role of Gas-Aerosol Mixing during in Situ Coating of Flame-Made Titania Particles. Ind. Eng. Chem. Res. 2009, 48, 85–92. [Google Scholar] [CrossRef]
  33. Minnermann, M.; Grossmann, H.K.; Pokhrel, S.; Thiel, K.; Hagelin-Weaver, H.; Bäumer, M.; Mädler, L. Double flame spray pyrolysis as a novel technique to synthesize alumina-supported cobalt Fischer-Tropsch catalysts. Catal. Today 2013, 214, 90–99. [Google Scholar] [CrossRef]
  34. Kolck, V.; Witte, J.; Schmidt, E.; Kruggel-Emden, H. Analysis of process parameter sensitivities of jet-based direct mixing gas phase hetero-agglomeration by DEM/CFD-modelling. Powder Technol. 2023, 429, 118963. [Google Scholar] [CrossRef]
  35. Molaiyan, P.; Mailhiot, S.E.; Voges, K.; Kantola, A.M.; Hu, T.; Michalowski, P.; Kwade, A.; Telkki, V.-V.; Lassi, U. Investigation of the structure and ionic conductivity of a Li3InCl6 modified by dry room annealing for solid-state Li-ion battery applications. Mater. Des. 2023, 227, 111690. [Google Scholar] [CrossRef]
  36. Wang, G.; Chen, L.; Mathur, G.N.; Varadan, V.K. Lithium Iron Phosphates as Cathode Materials in Lithium Ion Batteries for Electric Vehicles. Proc. SPIE Nanosen. Biosens. Info-Tech Sens. Syst. 2012, 8344, 122–129. [Google Scholar] [CrossRef]
  37. Padhi, A.K.; Nanjundaswamy, K.S.; Goodenough, J.B. Phospho-olivines as Positive-Electrode Materials for Rechargeable Lithium Batteries. J. Electrochem. Soc. 1997, 144, 1188. [Google Scholar] [CrossRef]
  38. Wang, J.; Sun, X. Understanding and recent development of carbon coating on LiFePO4 cathode materials für lithium-ion batteries. Energy Environ. Sci. 2012, 5, 5163–5185. [Google Scholar] [CrossRef]
  39. Oh, S.W.; Myung, S.-T.; Oh, S.-M.; Oh, K.H.; Amine, K.; Scrosati, B.; Sun, Y.-K. Double Carbon Coating of LiFePO4 as High Rate Electrode for Rechargeable Lithium Batteries. Adv. Mater. 2010, 22, 4842–4845. [Google Scholar] [CrossRef] [PubMed]
  40. Verein Deutscher Ingenieure, e.V. Richtlinie VDI 2066 Blatt 5: Particulate Matter Measurement. Dust Measurement in Flowing Gases. In Particle Size Selective Measurement by Impaction Method–Cascade Impactor; Beuth: Berlin, Germany, 1994. [Google Scholar]
  41. Appelhans, C. Zur Frage der drucklosen Messung der elektrischen Leitfähigkeit von pulverförmigen Werkstoffen. Mater. Werkst. 1980, 11, 205–208. [Google Scholar] [CrossRef]
  42. Haselrieder, W.; Ivanov, S.; Tran, H.Y.; Theil, S.; Froböse, L.; Westphal, B.; Wohlfahrt-Mehrens, M.; Kwade, A. Influence of formulation method and related processes on structural, electrical and electrochemical properties of LMS/NCA-blend electrodes. Prog. Solid State Chem. 2014, 42, 157–174. [Google Scholar] [CrossRef]
Figure 1. Idealised schematic of the functional mixing of microparticle agglomerates (a) and nanoparticle agglomerates (b) to form a hetero-agglomerate (c).
Processes 11 03243 g001
Figure 2. Photo (a) and schematic illustration of the functional principle (b) of the rotating brush disperser.
Processes 11 03243 g002
Figure 3. Photo (a) and schematic illustration (b) of the experimental setup.
Processes 11 03243 g003
Figure 4. Flowchart of experimental procedure for cathode composite production.
Processes 11 03243 g004
Figure 5. Cascade impactor (a), laser light diffraction (LLD) measurement of aerosol jet (b), scanning electron microscope used (c) and material tester for electrical conductivity measurements (d).
Processes 11 03243 g005
Figure 6. Cumulative particle size distribution (PSD) by mass of CaCO3 with variation of mass flow (cases A–C) determined with LLD.
Processes 11 03243 g006
Figure 7. Cumulative PSD by mass with variation of disperser volume flow (cases D–F) and producer-determined primary PSD of CaCO3 measured with LLD.
Processes 11 03243 g007
Figure 8. SEM images of the starting materials LFP (a), CB (b), NaCl (c) and LFP–CB mixture (d).
Processes 11 03243 g008
Figure 9. Cumulative PSD of NaCl with variation of mass concentration (cases A–C) determined with LLD.
Processes 11 03243 g009
Figure 10. Cumulative PSD of LFP–CB mixture with variation of mass concentration (cases D–F) determined with LLD.
Processes 11 03243 g010
Figure 11. Cumulative PSD by mass of the generated cathode composite with variation of mass concentration (cases A–C) determined with cascade impactor.
Processes 11 03243 g011
Figure 12. SEM sample at low (a), medium (b) and high mass concentration (c) (cases A–C).
Processes 11 03243 g012
Figure 13. Comparison of samples collected with SEM stub for case A (a,b) and with filter for case B (c,d), consisting of NaCl (red), LFP (blue) and CB (yellow).
Processes 11 03243 g013
Figure 14. SEM images of hetero-agglomerates formed in case A (a,b) and case B (c,d), consisting of NaCl (red), LFP (blue) and CB (yellow), collected on a SEM stub in the flow.
Processes 11 03243 g014
Figure 15. Focussed ion beam (FIB) cross-section of a sample of the cathode composite formed at mass concentration of 32 g/m3 (case B) collected on a SEM stub in the flow.
Processes 11 03243 g015
Figure 16. Electrical conductivity of the produced composites under different adjusted mass concentrations (cases A–C) measured at a compressive force of 395 N.
Processes 11 03243 g016
Table 1. Material properties of the particles used in the experiments.
MaterialLimestone (CaCO3)Cathode Material
Lithium Iron Phosphate (LFP)Carbon Black (CB)Sodium Chloride (NaCl)
Mean particle diameter [µm]3.00.80.059.22
Density [kg/m3]2700389021002200
Weight per cent [%]/58438
Table 2. Set and resulting (result.) parameters for characterising the dispersers.
Variation ofMass FlowVolume Flow
CaseABCDEF
Set pre-pressure [kPa]15015015025015085
Result. volume flow [m3/h]3.53.53.553.52.5
Set feed speed [mm/h]300500700500500500
Result. mass flow [g/h]110184257184184184
Result. mass concentration [g/m3]31.452.673.436.852.673.6
Table 3. Set and resulting (result.) parameters to increase the mass concentration (by increasing the mass flow and decreasing the volume flow) for the investigation of the feed materials.
MaterialNaClLFP + CB
CaseABCDEF
Set pre-pressure [kPa]2501508525015085
Result. Volume flow [m3/h]53.52.553.52.5
Set feed speed [mm/h]5130039591535703
Result. Mass flow [g/h]14.182.710924.04141186
Result. Mass concentration [g/m3]2.8123.643.64.8140.474.3
Tamping density [g/cm3]0.878 (constant)0.841 (constant)
Table 4. Process parameters of the composites in the mixing process in the three cases investigated.
MaterialNaCl and LFP–CB Mixture
CaseABC
Volume flow [m3/h]1075
Mass flow [g/h]38.1224295
Mass concentration [g/m3]3.813259
Disclaimer/Publisher’s Note: The statements, opinions and data contained in all publications are solely those of the individual author(s) and contributor(s) and not of MDPI and/or the editor(s). MDPI and/or the editor(s) disclaim responsibility for any injury to people or property resulting from any ideas, methods, instructions or products referred to in the content.

