Article

Analysis of the Unintended Effects of the Bacillus thuringiensis Insecticidal Protein in Genetically Modified Rice Using Untargeted Transcriptomics

1
State Key Laboratory for Managing Biotic and Chemical Threats to the Quality and Safety of Agro-Products, Key Laboratory of Traceability for Agricultural Genetically Modified Organisms, Ministry of Agriculture and Rural Affairs, Zhejiang Academy of Agricultural Sciences, Hangzhou 310021, China
2
State Key Laboratory for Managing Biotic and Chemical Threats to the Quality and Safety of Agro-Products, Key Laboratory of Biotechnology in Plant Protection of MARA and Zhejiang Province, Institute of Plant Virology, Ningbo University, Ningbo 315211, China
3
College of Life Sciences, Zhejiang Normal University, Jinhua 321004, China
*
Authors to whom correspondence should be addressed.
These authors contributed equally to this work.
Processes 2023, 11(11), 3202; https://doi.org/10.3390/pr11113202
Submission received: 11 August 2023 / Revised: 11 October 2023 / Accepted: 23 October 2023 / Published: 9 November 2023

Abstract

:
The safety and unintended effects of genetically modified (GM) crops have been the focus of public attention. Transcriptome analysis is a powerful tool to assess the potential impact of genetic modification on plant genomes. In this study, three transgenic (KMD, KF6, and TT51-1) and three non-transgenic (XS11, MH86, and MH63) rice varieties were assessed at the genomic and protein levels. The results of polymerase chain reaction (PCR) and Cry1Ab/1Ac speed test strips showed that the Bt gene was successfully expressed in transgenic rice. The results of RNA-seq analysis to analyze the unintended effects of transgenic Bt rice showed fewer differentially expressed genes (DEGs) between the transgenic and non-transgenic rice varieties than among the different varieties. Meanwhile, the results of principal component analysis and cluster analysis found no significant genetic variation between the transgenic and non-transgenic rice varieties, except for the presence of Bt in transgenic rice. There were only two co-upregulated DEGs and no co-downregulated DEGs among three comparison groups. Although there were various DEGs among the groups, the two co-upregulated DEGs were not related to any significantly enriched gene ontology (GO) term or Kyoto Encyclopedia of Genes and Genomes (KEGG) pathway, indicating that the differences among the subgroups were more likely caused by complex environmental or genetic factors, rather than unintended effects due to Bt expression. This study provides useful information to further explore the unexpected effects and safety of GM rice.

1. Introduction

Rice is the main food crop of almost half of the global population and has been historically important to the survival and development of human civilization [1]. However, insect pests often cause huge losses to rice production and negatively impact food security [2,3], especially lepidopterans, such as the Asiatic rice borer (Chilo suppressalis), the yellow stem borer (Tryporyza incertulas), and the brown planthopper (Nilaparvata lugens).
Chemical pesticides are conventionally applied to control pests of rice crops, but these products are environmental pollutants that have been linked to drug resistance, destruction of ecosystems, and rampant pest re-infestation. Therefore, various strategies have been proposed to improve rice production without the use of chemical pesticides [4].
Transgenic technologies have been applied as cost-effective methods to increase crop production by improving resistance to insect pests and diseases, tolerance to herbicides, and nutritional value [5,6]. An insecticidal crystal protein derived from the Bt protoxin produced by Bacillus thuringiensis exhibits highly specific insecticidal activity and is commonly used in research of transgenic insect-resistant rice [7]. The crystal protein derived from the Bt protoxin penetrates the intestine of insect pests. From 1996 to 2019, Bt maize was the first large-scale genetically modified (GM) crop and is currently grown on an estimated 190.4 million hectares in more than 70 countries worldwide [8,9]. However, the rapid increase in cultivation of GM crops has led to increasing global concern about food safety [10]. It is generally agreed that biosafety assessment of GM crops and related products should also include potential long-term unintended effects, such as genomic instability and random integration of transgenes [11,12,13]. Therefore, before planting GM crops, such as Bt rice, risk evaluations should be conducted to assess potential harmful effects on agroecosystems [14,15].
Genomic characterization is typically employed to assess the safety of GM crops. The development of omics techniques, including transcriptomics [6,16,17,18], proteomics [19,20], and metabolomics [21,22,23], has facilitated comprehensive analyses of the expected and unintended effects of transgenic events in GM crops at the transcript, protein, and metabolite levels [24]. Based on this information, the expected and unintended effects of transgenes can be easily identified [25,26], and risk assessments can be conducted in a timely manner to assess the safety of GM crops and related products.
Transcriptomics is the systematic study of transcriptional profiles, which aims to elucidate the molecular mechanisms of complex biological pathways and trait regulatory networks. Transcriptomics not only detects transcripts corresponding to existing genome sequences, but also discovers and quantifies new transcripts, making it more advantageous for the study of selective splicing events, new genes, and transcripts. Currently, commonly used techniques for transcriptomics sequencing analysis include hybridization-based techniques, such as DNA microarray [27]; label-based techniques, such as serial analysis of gene expression (SAGE) [28]; and direct sequencing-based techniques, such as RNA sequencing (RNA-seq) [29]. DNA microarray technology is mature and has a large database, but it is only suitable for detecting known sequences and has low sensitivity; SAGE technology has a high demand for mRNA, while RNA-seq does not require known sequences and is able to detect the overall transcriptional activity of any species at the single nucleotide level [30]. In recent years, RNA sequencing (RNA-seq) analysis has been widely applied in omics studies of the unintended expression of transgenes. For example, Peng et al. used RNA-seq analysis to compare the miRNA profiles of transgenic Bt and 5-enolpyruvylshikimate 3-phosphate synthase (EPSPS) varieties and non-transgenic rice varieties [31]. Using transcriptome analysis, Guo et al. revealed differences in the response and tolerance mechanisms of EPSPS and GAT in transgenic soybeans [32]. Moreover, a study by Wang et al. using RNA-seq analysis found fewer DEGs between transgenic and non-transgenic maize than among the different varieties [24].
The aim of the present study was to detect Bt protein levels in samples with the use of Bt-Cry1Ab/1Ac detection test strips. Specific primers were designed for three transgenic rice varieties (KMD, KF6, and TT51-1) and three non-transgenic rice varieties (XS11, MH86, and MH63). Total RNA of transgenic Bt rice was collected for RNA-seq analysis to identify DEGs. The biological processes, cellular locations, and molecular functions of the DEGs were determined through gene ontology (GO) analysis in reference to the Kyoto Encyclopedia of Genes and Genomes (KEGG) database. An experimental flow chart is shown in Figure 1. The results of this study provide valuable references for genomics-based evaluation of the safety of GM rice.

2. Materials and Methods

2.1. Plant Materials

Samples of three transgenic varieties (KMD, KF6, and TT51-1) and three non-transgenic rice varieties (XS11, MH86, and MH63) were provided by our laboratory. Ke Ming Dao (KMD) is a transgenic Bt rice obtained using Agrobacterium-mediated transformation technology with Xiu Shui 11 (XS11) as the receptor [33,34,35]. Ke Feng 6 (KF6) is a transgenic Bt rice obtained using Agrobacterium-mediated transformation technology with Ming Hui 86 (MH86) as the receptor [36]. TT51-1 is a transgenic Bt rice obtained using particle bombardment with Ming Hui63 (MH63) as the receptor [37].
The rice seeds were selected with full shape and soaked in 70% alcohol for 1 min for surface disinfection. The seeds were then soaked in 2% sodium hypochlorite solution for 15 min and rinsed with water 4 times. The seeds were placed in an incubator at 28 °C for germination. The better germinated seeds were selected and sown in 3 plastic pots (10 seeds per pot) for each variety (three transgenic varieties and three non-transgenic rice varieties) and placed in the incubator. The incubation conditions were set to 28 ℃/16 h light, 24 ℃/8 h dark, and 80% humidity. Thirty days later, each sample was pooled from the leaves collected from three plastic pots (each pot needs to be collected) for each variety. The same sample was taken for DNA, RNA, and protein extraction, respectively.

2.2. DNA Extraction, PCR Analysis, and Test Strips

DNA was extracted from rice samples using Plant Genomic DNA Extraction Kit (Tiangen Biochemical Technology Co., Ltd. Beijing, China), and the purity of DNA was determined using the ratio of the absorbance at 260 and 280 nm using a spectrophotometer (Nanodrop 2000, ThermoFisher Scientific, Waltham, MA, USA). The DNA samples were amplified using qualitative polymerase chain reaction (PCR). The 25 uL PCR amplification system comprised 10 × PCR buffer (Mg2+ Plus) 2.5 µL, dNTP mixture 2 µL, 0.5 µL each of forward and reverse primers (10 µmol/L) at the final concentration of 200 nmol/L, rTaq DNA polymerase (5 U/µL) 0.15 µL, and DNA solution 2 µL; the reaction mixture was supplemented with ddH2O to make up the volume to 25 µL. The amplification program for each primer set is listed in Supplementary Table S1.
Target proteins were detected by test strips. Leaves were placed in a 1.5 mL centrifuge tube, the leaves were triturated, 1 mL buffer was added, and a test strip (Shanghai Youlong Biotechnology Co., Ltd. Shanghai, China) was inserted into the sample mixture; observe the results after 5 min.

2.3. RNA Extraction, Library Preparation, and Sequencing

Total RNA from rice leaves was extracted using an RNAprep pure Plant kit (TIANGEN Biotech, Beijing, China), and digested at 37 °C for 1 h using DNaseI (Ambion, Austin, TX, USA); the purified RNA was assayed for RNA quality using Qubit® 2.0. The quality of the extracted RNA was assessed using an Agilent 2100 Bioanalyzer (Agilent Technologies, Santa Clara, CA, USA). Library preparation with Illumina sequencing was performed by following the protocol plan. Extracted total RNA was subjected to mRNA enrichment, followed by short fragmentation of the enriched mRNA, cDNA first-strand synthesis with random primers, followed by cDNA second-strand synthesis, end repair, and addition of poly A after purification using a QiaQuick PCR kit (Qiagen, Duesseldorf, Germany), and ligation to Illumina sequencing adapters. The ligated products were subjected to agarose gel electrophoresis, PCR amplification, and sequencing using Illumina HiSeqTM4000.

2.4. RNA-Seq Data Analysis

The rice genome was aligned with the reference genome using bowtie2.
Differential expression analysis of XS11 vs. KMD, MH86 vs. KF6, and MH63 vs. TT51-1 data was performed using the software GFOLD [38], the screening conditions for differential expression genes were set at |GFOLD_value| > 1.
GO is an international standardized gene function classification system, which is a database applicable to each species to qualify and describe the functions of genes and proteins. Using the GO database, genes are classified according to the biological processes, cellular components, and molecular functions. GO enrichment analysis of DEGs was performed using the R package (clusterProfiler, Vienna, Austria), and GO terms with p < 0.05 were considered significantly enriched in DEGs [39,40].
KEGG is an integrated database resource for biological interpretation of genomic sequences and other high-throughput data. Molecular functions of genes and proteins are associated with immediate homology groups and stored in the KEGG Orthology (KO) database. The R package (clusterProfiler) was used to detect the statistical enrichment of DEGs in the KEGG pathway. KEGG pathways with p < 0.05 were considered significantly enriched in DEGs [40,41].

3. Results

3.1. Bt Protein Expression in GM Rice

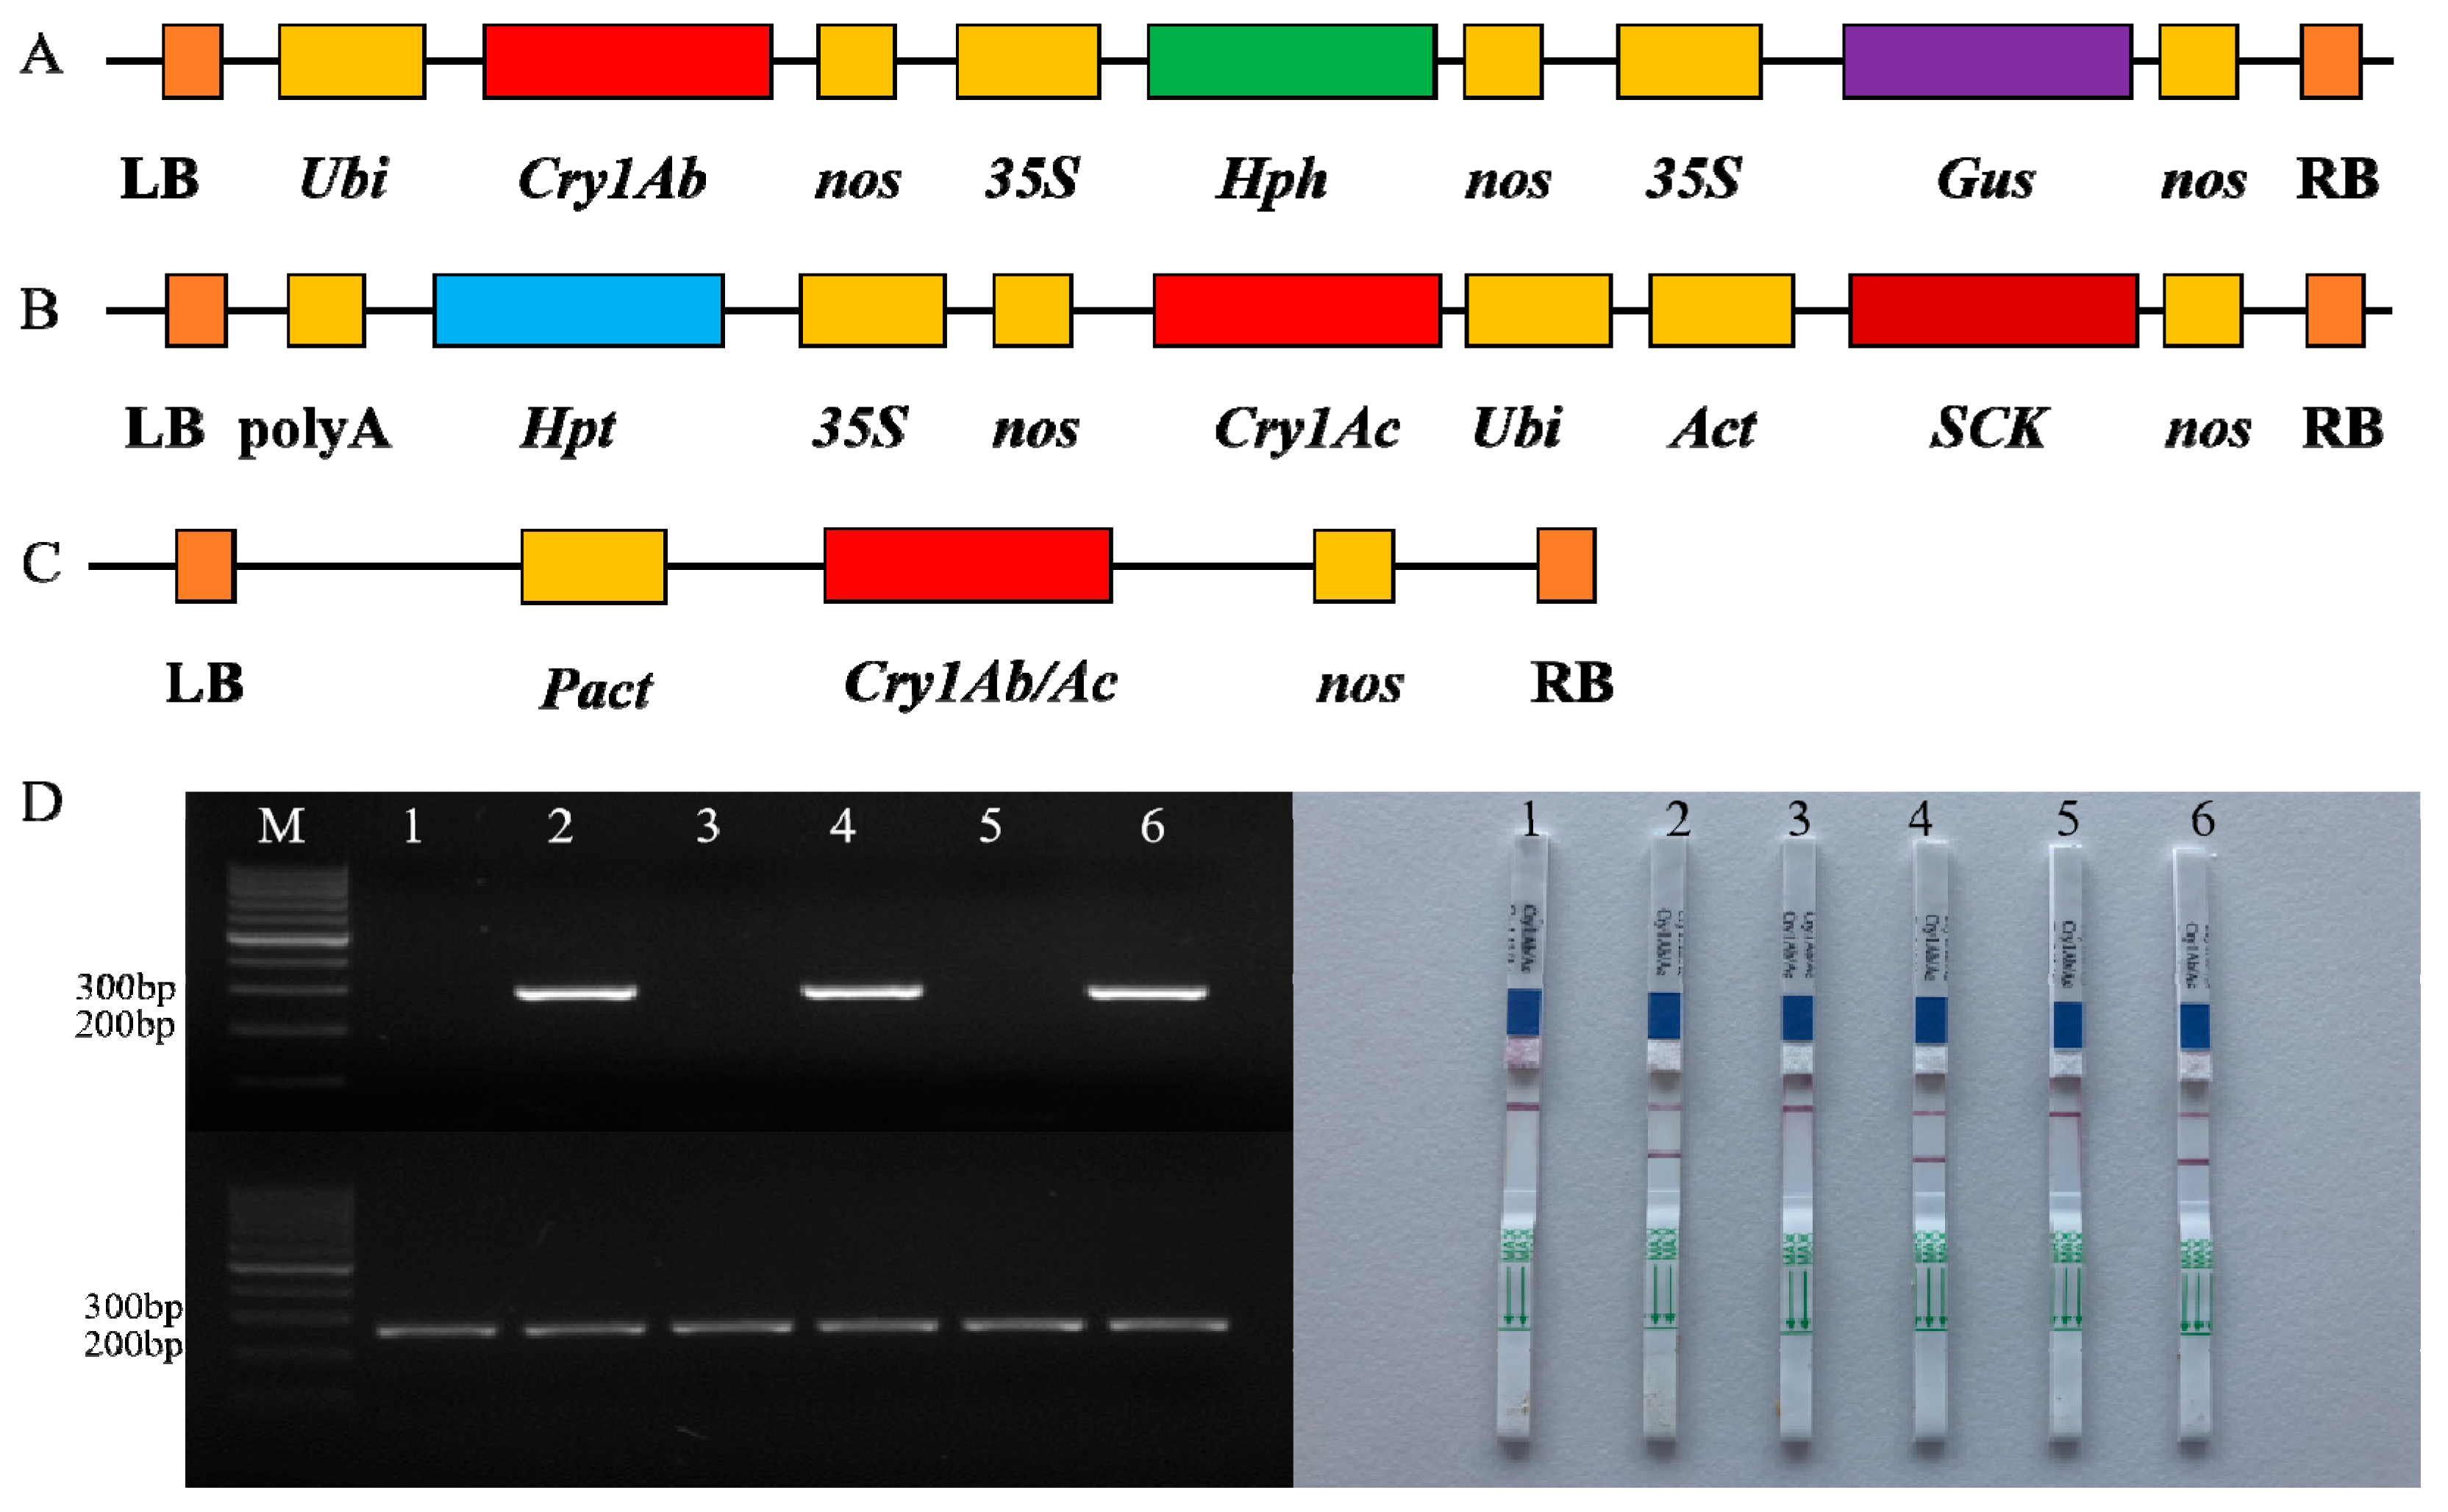
The synthetic Cry1Ab/Ac gene encodes an insecticidal protein of B. thuringiensis and is the most widely used exogenous protein for insecticide genetic engineering worldwide. The Bt crystal protein is a δ-endotoxin derived from the Bt protoxin produced by B. thuringiensis in the early stage of endospore formation. Diagrams of the vectors encoding the transgenes of the three transgenic rice varieties are shown in Figure 2A–C. Primers to detect exogenous genes were based on the Cry1Ab/Ac sequence. The rice sucrose phosphate synthase (SPS) gene was used as an internal reference. The SPS sequences of all transgenic and non-transgenic (control) samples were amplified by PCR. Target fragments of the exogenous genes of the three transgenic rice varieties were successfully amplified, but not those of the non-transgenic rice. Further, all six samples were examined using Cry1Ab/Ac test strips. Notably, the test strips of transgenic rice exhibited two red lines, while those of the non-transgenic rice had only one red line, indicating Bt protein expression by the three transgenic varieties (Figure 2D). The relative RNA expression of Bt obtained from RNA-seq is shown in Supplementary Figure S1.

3.2. Evaluation of Rice Transcriptome Sequencing Data

Transcriptome sequencing of rice leaves was performed to identify difference in gene expression patterns between transgenic (KMD, KF6, and TT51-1) and non-transgenic (XS11, MH86, and MH63) rice varieties. RNA-seq analysis of filtered quality data of the six samples yielded 12112186–12390376 raw reads with a GC content of 47–52%. As shown in Table 1, the clean reads of each sample shared similarity of 83.24–87.06% with the Oryza sativa Japonica Group (Japanese rice) genome assembly IRGSP-1.0 from National Institute of Agrobiological Sciences (GCA_001433935.1 GCF_001433935.1). The gene expression levels of the rice samples are expressed as fragments per kilobase of transcript per million mapped fragments (FPKM). As shown in Supplementary Figure S2, gene expression levels were similar among the six samples. The measured data were accurate with good quality and sufficient for further analysis.

3.3. DEGs between the Transgenic and Non-Transgenic Rice Varieties

Principal component analysis (PCA) was performed to assess the genetic variation between the transgenic and non-transgenic rice varieties. Three-dimensional plots of the PCA results of the different rice varieties are presented in Figure 3. Notably, XS11 and KMD were significantly separated from MH86, KF6, MH63, and TT51-1 (PC1 axis), accounting for 72.70% of the variability among the samples. Notably, XS11 and KMD are Japonica varieties, while MH86, KF6, MH63, and TT51-1 are Indica varieties. As shown in Figure 3, MH86 clustered with KF6 and MH63 with TT51-1 along the PC2 axis. In addition, XS11 and KMD, which accounted for 12.04% of the variability among the samples, were clustered together at the most negative range of the PC2 axis. Through combined analysis, there was no significant difference between the transgenic and non-transgenic (control) groups. The clustering plot in Supplementary Figure S3A shows clear differences among the samples. Although all six samples belonged to the same category, XS11 was closely related to KMD, while MH86, KF6, MH63, and TT51-1 were closely related to one another. As shown in Supplementary Figure S3B, the Pearson’s correlation coefficient(r) was 0.94 for XS11 and KMD, 0.98 for MH86 and KF6, and 0.95 for MH86 and TT51-1, indicating no significant difference between the transgenic and non-transgenic (control) groups.

3.4. Identification of DEGs

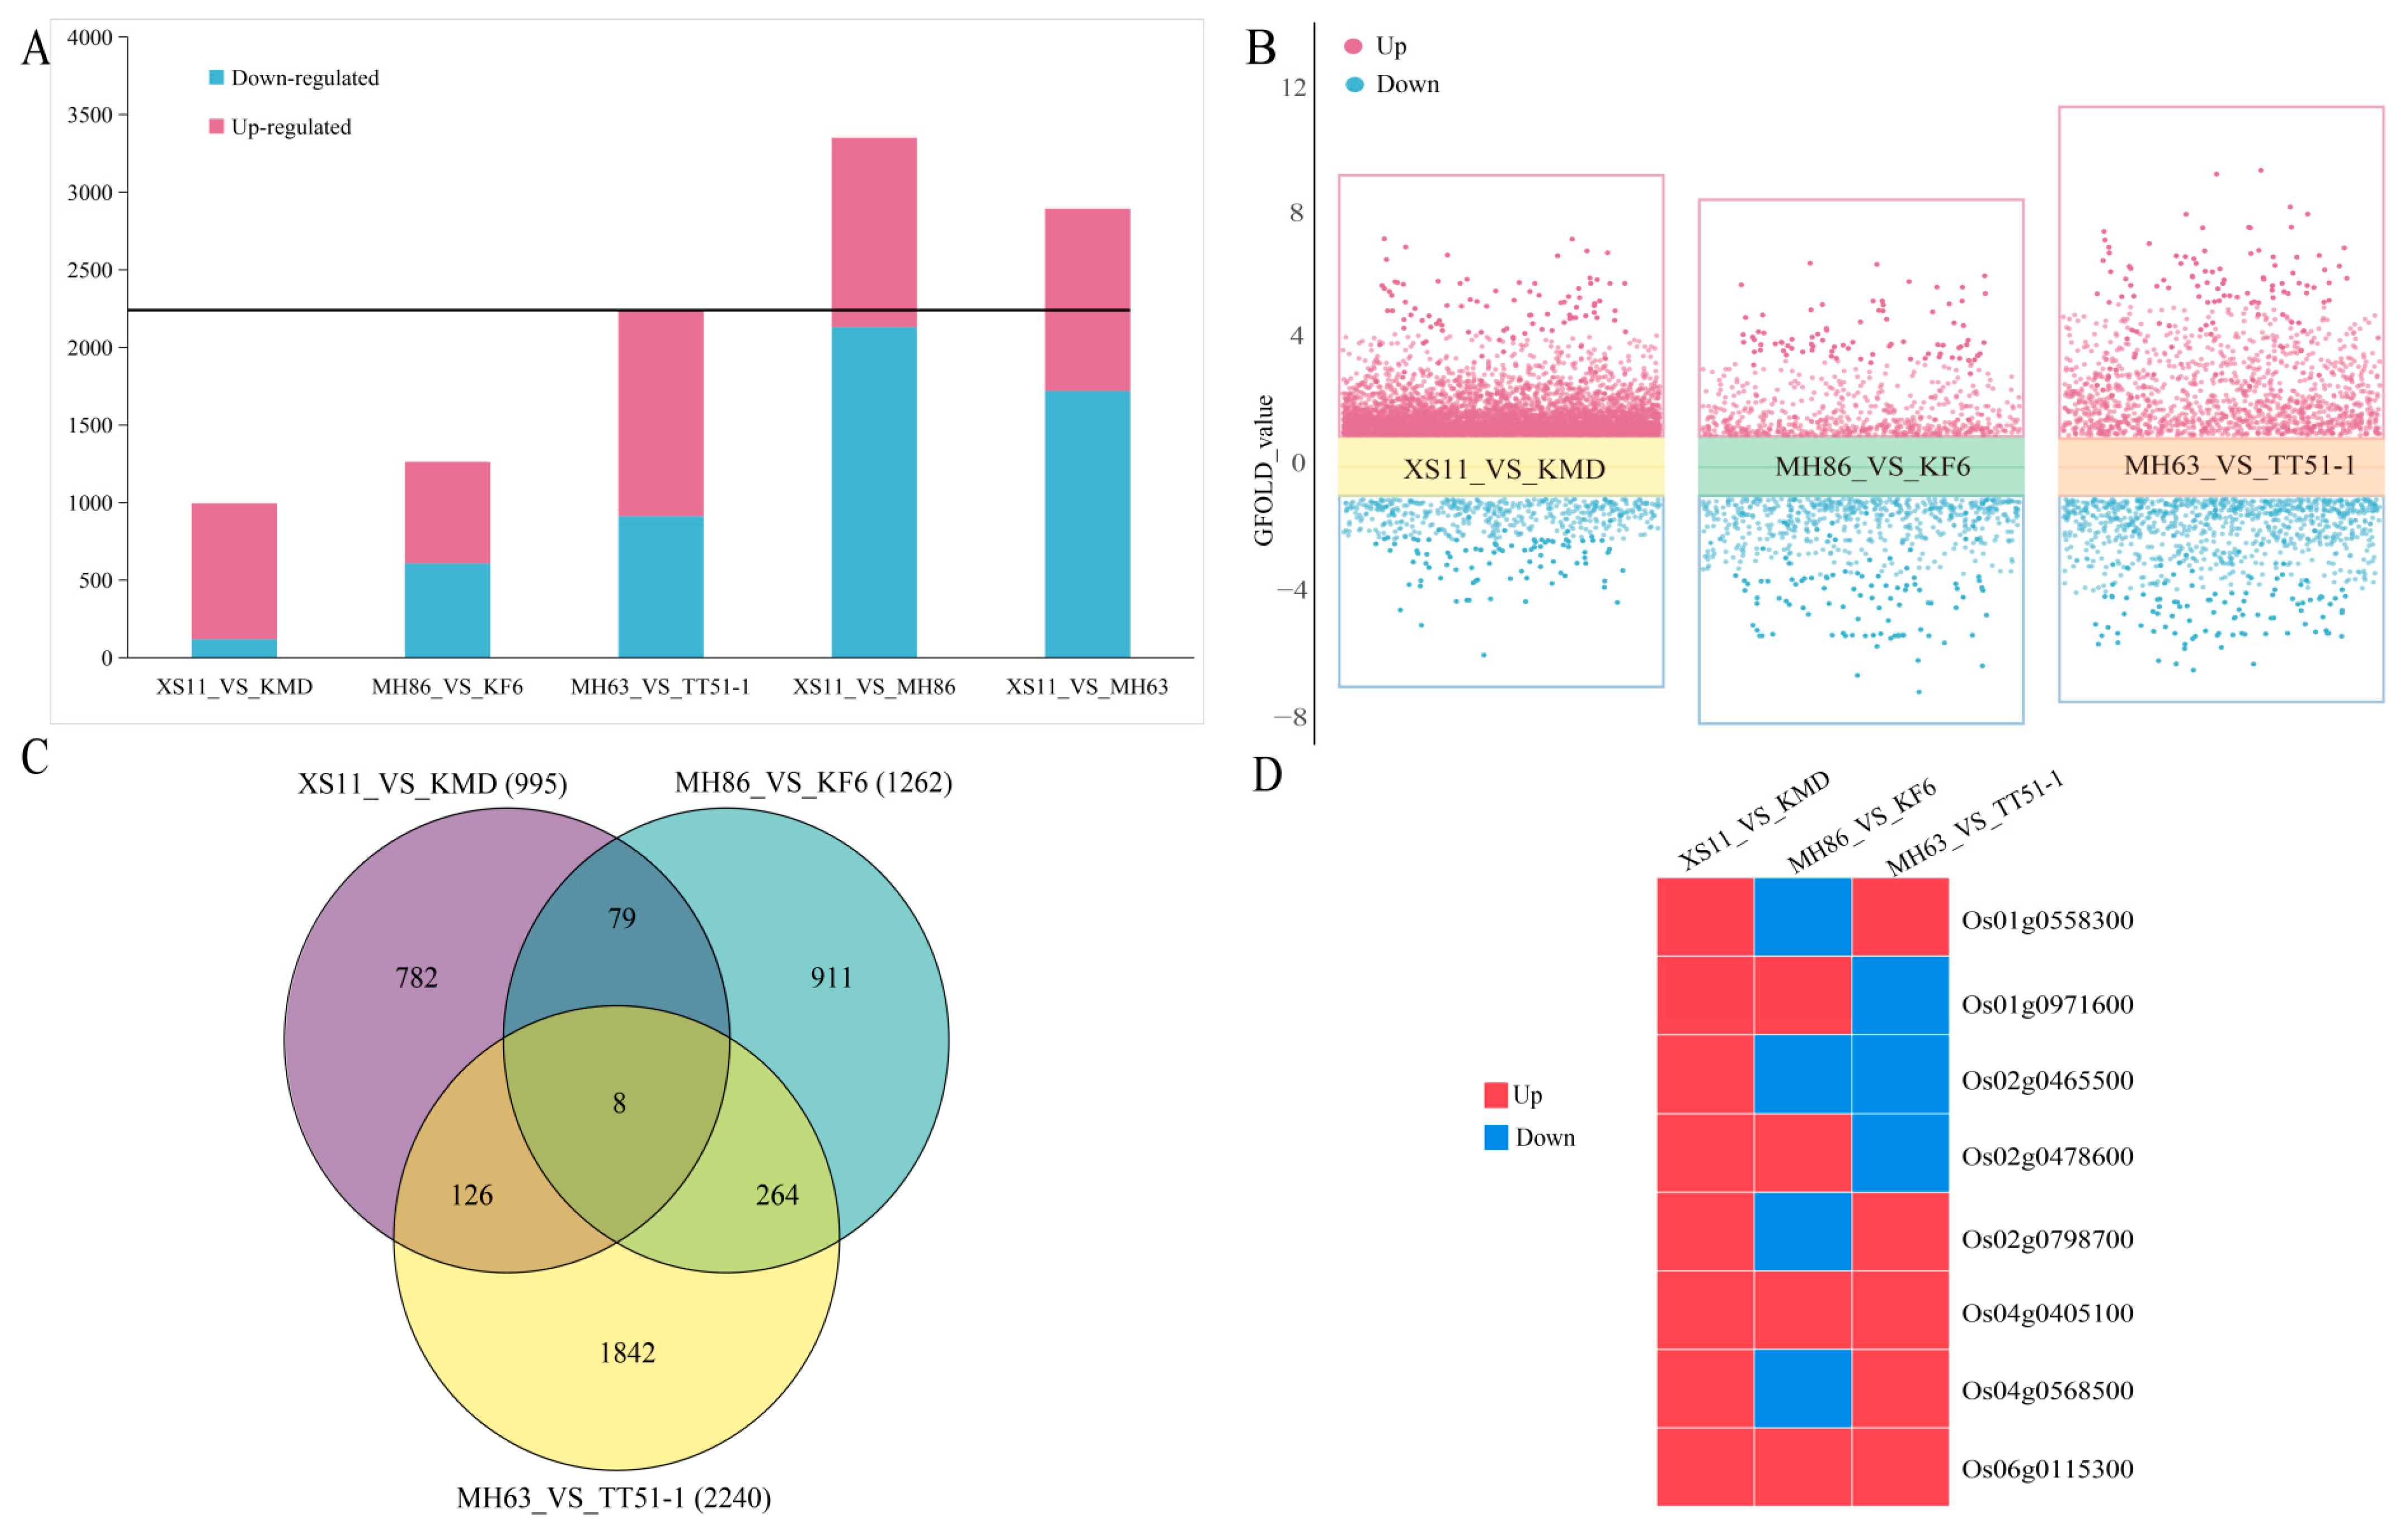
DEGs among the six rice samples are shown in Figure 4A. In total, there were 995 DEGs (875 upregulated and 120 downregulated) between KMD and XS11, 1262 DEGs (653 upregulated and 609 downregulated) between KF6 and MH86, and 2240 DEGs (1327 upregulated and 913 downregulated) between TT51-1 and MH63. Volcano plots of the DEGs are shown in Figure 4B. Further analysis of XS11 vs. KMD, MH86 vs. KF6, and MH63 vs. TT51-1 identified 8 overlapping DEGs (Figure 4C). Of these DEGs, two were co-upregulated (Os04g0405100 and Os06g0115300), while none were co-downregulated (Figure 4D). Os04g0405100 was annotated as a SAM domain family protein and Os06g0115300 as acyl coenzyme A binding. In addition, 3351 DEGs were identified between XS11 and MH86, while 2893 DEGs were identified between XS11 and MH63. The number of DEGs was lower between transgenic and non-transgenic rice varieties than among the different varieties.

3.5. GO and KEGG Analysis of DEGs

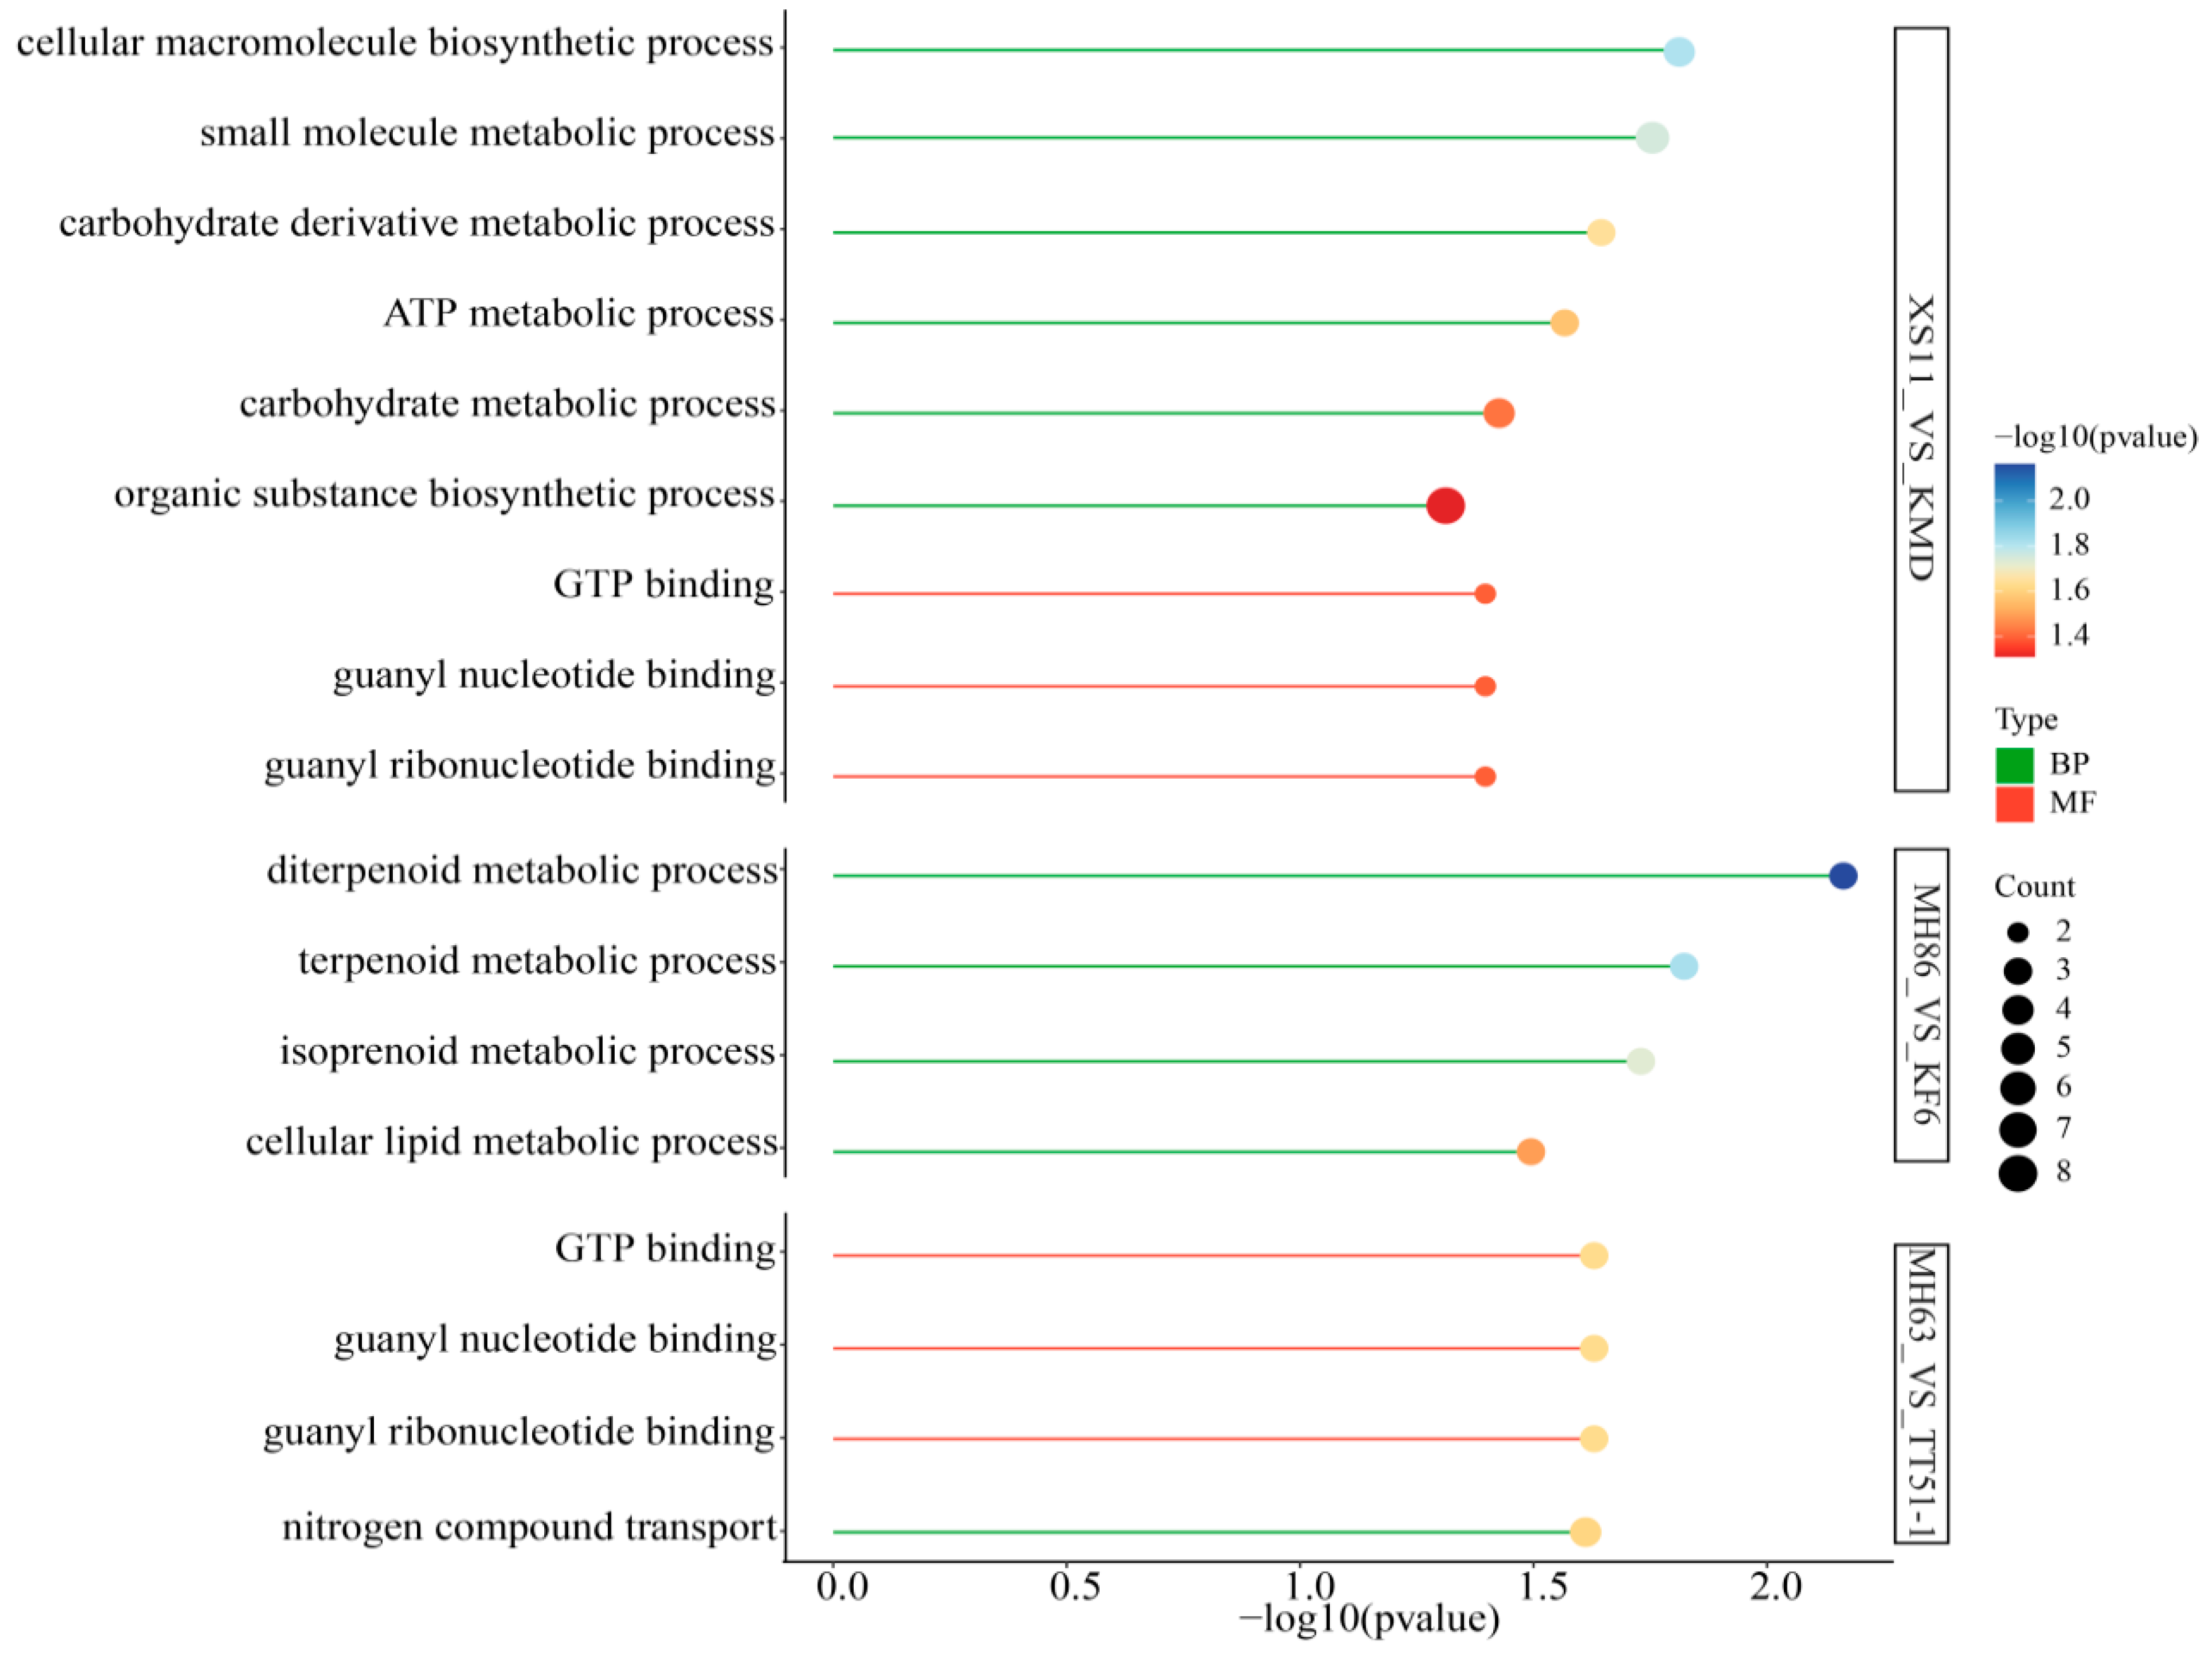
GO describes three distinct functional classes of gene products: molecular function, cellular component, and biological process. GO and KEGG enrichment analysis was performed to explore the biological functions of the DEGs of transgenic and non-transgenic rice varieties. The two co-upregulated DEGs were not associated with any GO terms. The biological functions of DEGs for XS11 vs. KMD included “cellular macromolecular biosynthetic processes” and “small molecule metabolic processes”. The biological functions of DEGs for MH86 vs. KF6 included “diterpenoid metabolic processes” and “terpenoid metabolic processes”. The biological functions of DEGs for MH63 vs. TT51-1 included “GTP binding” and “guanyl nucleotide binding” (Figure 5). Notably, there were no common significantly enriched GO terms among the three pairs of rice varieties.
KEGG pathways associated with the DEGs are shown in Figure 6. The two co-upregulated genes were not significantly enriched in any KEGG pathway. The DEGs for XS11 vs. KMD were significantly enriched in 13 KEGG pathways, which included “genetic information processing”, “metabolism”, “ribosome”, “biosynthesis of cofactor”, and “photosynthesis”. The DEGs for MH86 vs. KF6 were significantly enriched in 10 KEGG pathways, which included “cellular processes”, “genetic information processing”, “metabolism”, “diterpenoid biosynthesis”, “motor protein”, and “DNA replication”. The DEGs for MH63 vs. TT51-1 were significantly enriched in 10 KEGG pathways, which included “metabolism”, “genetic information processing”, “biotin metabolism”, “glutathione metabolism”, and “linoleic acid metabolism”. These pathways are involved in basic plant metabolism. None of the significantly enriched pathways were shared among the three pairs of rice varieties.

4. Discussion

Transgenic technology is increasingly used to improve crop quality and yield. At present, GM crops are farmed in more than 70 countries worldwide. However, the safety of GM crops and related products remains a major concern. Hence, the risks of GM crops to human health and potential environmental impacts must be carefully assessed. Nonetheless, it is difficult to predict the unintended effects of transgenes [24,25,26], such as genetic disruptions leading to sequence changes and the production of new proteins or metabolites, which could impair the safety of GM crops [12,42]. To address these issues, omics technologies, such as transcriptomics, proteomics, and metabolomics, can facilitate the analysis of the unintended effects of GM crops [43,44,45,46]. The emergence of Omics provides a new method for evaluating the safety of GM foods, and transcriptomics can be used for low-abundance transcripts, deep exploration of new genes, identification of gene families, determination of metabolic pathways, and other analyses, which have been widely used in many fields [47,48].
Omics technologies generate large volumes of data, and thus, PCA was conducted to simplify presentation of relevant information. Here, three transgenic (KMD, KF6, and TT51-1) and three non-transgenic (XS11, MH86, and MH63) rice varieties were analyzed to identify potential unintended effects of GM rice. The selected samples included Japonica (XS11 and KMD) and Indica (MH68, KF6, MH63, and TT51-1) rice varieties. The PCA results showed similarity of the transgenic and non-transgenic rice varieties, while the results of cluster analysis demonstrated the separation of the Japonica and Indica varieties, as XS11 clustered with KMD, while MH86, KF6, MH63, and TT51-1 clustered together, consistent with expectations and in agreement with the results of a previous study [3]. Notably, there was no significant separation of the transgenic and non-transgenic Indica or Japonica rice varieties, in accordance with previous studies of GM barley [49].
Overall, there were fewer DEGs between the transgenic and non-transgenic (XS11 vs. KMD, MH86 vs. KF6, and MH63 vs. TT51-1) than between the Japonica and Indica rice varieties (XS11 vs. MH86 and XS11 vs. MH63), similarly to the results of previous studies of GM maize, rice and soybean [24,43,50]. Another study found more DEGs between rice roots and leaves than between transgenic and non-transgenic rice varieties [51]. The Os04g0405100 and Os06g0115300 (OsACBP2) genes, which were co-upregulated in XS11 vs. KMD, MH86 vs. KF6, and MH63 vs. TT51-1, were annotated to SAM domain family protein and acyl coenzyme A binding, respectively. The evolutionary conserved and ubiquitous family of acyl-CoA-binding proteins (ACBPs) are involved in basal cellular functions [52]. ACBP1 and ACBP2 of Arabidopsis thaliana play important roles in phospholipid membrane repair in response to heavy metal stress and are critical to early embryonic development [53,54,55,56]. Unlike ACBPs of members of the Arabidopsis genus, which are involved in different pathways in response to both biotic and abiotic stressors, ACBP2 of Oryza sativa is not induced by stressors [57].
The two co-upregulated genes were not associated with enriched GO terms or KEGG pathways. Some of the DEGs identified in this study were enriched in various biological processes, including cellular macromolecular biosynthesis, small molecule metabolic processes, carbohydrate derivative metabolic processes, diterpene metabolic processes, GTP binding, and among others. The DEGs of XS11 and KMD were significantly enriched in various KEGG pathways, including ribosome and cofactor biosynthesis, while those of MH86 and KF6 were significantly enriched in motor protein and DNA replication pathways, and the DEGs of MH63 and TT51-1 were significantly enriched in biotin metabolism and glutathione metabolism, which are basic metabolic pathways in plants. These data on the profiling of transgenic rice reveal that some differences exist compared to non-transgenic rice. This may be due to the fact that the selection process for transgenic rice is based on phenotypic and compositional equivalence with a close comparator line, and then the introduction of the new trait into a superior line by a number of crosses, rather than the proper expression of the new trait [58]. Some environmental factors and insertional effects of transgenic genes have also been shown to have a greater influence than transgenic gene expression [59,60]. In the future, we plan to sow transgenic and non-transgenic crops in different environments at different years to reveal the environmental and genetic effects.
In summary, transcriptomics is an effective method to assess the unexpected effects of GM crops. In the present study, RNA-seq analysis was conducted to analyze gene expression levels in transgenic vs. non-transgenic rice varieties. Previous studies have reported that the expression levels of DEGs in transgenic vs. non-transgenic rice were within expected ranges as compared to inter-varietal differences. Moreover, although attempts were made to exclude environmental factors as much as possible, other factors, such as natural variation and genetic background, could have influenced the differences in insertional expression of Bt. Overall, trans-BT GM rice had no widespread unintended effects. The results of this study provide new perspectives for safety evaluation of GM rice.

Supplementary Materials

The following supporting information can be downloaded at: https://www.mdpi.com/article/10.3390/pr11113202/s1. Supplementary Table S1. The information of primers used in qualitative PCR. Supplementary Figure S1. The relative RNA expression of Bt from RNA-seq in samples. Supplementary Figure S2. Gene expression analysis. Supplementary Figure S3. Correlation analysis of samples.

Author Contributions

Conceived and designed the experiments: L.D., C.P. and J.X. Performed the experiments: G.C. and X.W. Analyzed the data: X.C. and J.X. Contributed reagents/materials/analysis tools: C.P., Z.L. and Y.L. Wrote the manuscript: L.D. and C.P. Read and gave suggestions on the manuscript: G.C., X.C., X.W., Y.L., Z.L., C.P. and J.X. All authors have read and agreed to the published version of the manuscript.

Funding

This work was supported by the National R&D Project of Agricultural Biological Breeding (2022ZD0401907 and 2022ZD0401908), the Zhejiang Science and Technology Major Program on Agricultural New Variety Breeding (2021C02064-6), and the Science and Technology Innovation Leading Talent Project of Zhejiang (2021R52046).

Data Availability Statement

Data are contained within the article.

Conflicts of Interest

The authors declare no conflict of interest.

References

  1. Li, Y.; Hallerman, E.M.; Liu, Q.; Wu, K.; Peng, Y. The development and status of Bt rice in China. Plant Biotechnol. J. 2016, 14, 839–848. [Google Scholar] [CrossRef] [PubMed]
  2. Li, X.; Huang, K.; He, X.; Zhu, B.; Liang, Z.; Li, H.; Luo, Y. Comparison of nutritional quality between Chinese indica rice with sck and cry1Ac genes and its nontransgenic counterpart. J. Food Sci. 2007, 72, S420–S424. [Google Scholar] [CrossRef] [PubMed]
  3. Liu, Q.; Hallerman, E.; Peng, Y.; Li, Y. Development of Bt Rice and Bt Maize in China and Their Efficacy in Target Pest Control. Int. J. Mol. Sci. 2016, 17, 1561. [Google Scholar] [CrossRef] [PubMed]
  4. Tang, L.; Tan, Y.; Han, X.; Sun, Z.; Duan, M. Research Progress and Developing Tendency in Insect-resistant Transgenic Rice. Hybrid Rice 2011, 26, 1–6. [Google Scholar] [CrossRef]
  5. Chen, M.; Shelton, A.; Ye, G.Y. Insect-resistant genetically modified rice in China: From research to commercialization. Annu. Rev. Entomol. 2011, 56, 81–101. [Google Scholar] [CrossRef]
  6. Barros, E.; Lezar, S.; Anttonen, M.J.; van Dijk, J.P.; Rohlig, R.M.; Kok, E.J.; Engel, K.H. Comparison of two GM maize varieties with a near-isogenic non-GM variety using transcriptomics, proteomics and metabolomics. Plant Biotechnol. J. 2010, 8, 436–451. [Google Scholar] [CrossRef]
  7. McGaughey, W.H. Insect Resistance to the Biological Insecticide Bacillus thuringiensis. Science 1985, 229, 193–195. [Google Scholar] [CrossRef]
  8. Snow, A.A.; Palma, P.M. Commercialization of transgenic plants: Potential ecological risks. Bioscience 1997, 47, 86–96. [Google Scholar] [CrossRef]
  9. ISAAA. Global Status of Commercialized Biotech/GM Crops in 2019: Biotech Crops Drive SocioEconomic Development and Sustainable Environment in the New Frontier. In ISAAA Brief; No. 55; ISAAA: Ithaca, NY, USA, 2019. [Google Scholar]
  10. Li, P.; Xue, Y.; Shi, J.; Pan, A.; Tang, X.; Ming, F. The response of dominant and rare taxa for fungal diversity within different root environments to the cultivation of Bt and conventional cotton varieties. Microbiome 2018, 6, 184. [Google Scholar] [CrossRef]
  11. Deng, P.J.; Zhou, X.Y.; Yang, D.Y.; Hou, H.L.; Yang, X.K.; Li, Y.H.; Yang, Y.C.; Wang, X.L.; Fang, S.S.; Wu, S.Q.; et al. The definition, source, manifestation and assessment of unintended effects in genetically modified plants. J. Sci. Food Agric. 2008, 88, 2401–2413. [Google Scholar] [CrossRef]
  12. Kuiper, H.A.; Kleter, G.A.; Noteborn, H.P.; Kok, E.J. Assessment of the food safety issues related to genetically modified foods. Plant J. 2001, 27, 503–528. [Google Scholar] [CrossRef] [PubMed]
  13. Cellini, F.; Chesson, A.; Colquhoun, I.; Constable, A.; Davies, H.V.; Engel, K.H.; Gatehouse, A.M.; Karenlampi, S.; Kok, E.J.; Leguay, J.J.; et al. Unintended effects and their detection in genetically modified crops. Food Chem. Toxicol. 2004, 42, 1089–1125. [Google Scholar] [CrossRef] [PubMed]
  14. Li, P.; Ye, S.; Chen, J.; Wang, L.; Li, Y.; Ge, L.; Wu, G.; Song, L.; Wang, C.; Sun, Y.; et al. Combined metagenomic and metabolomic analyses reveal that Bt rice planting alters soil C-N metabolism. ISME Commun. 2023, 3, 4. [Google Scholar] [CrossRef] [PubMed]
  15. Krause, S.M.B.; Nather, A.; Ortiz Cortes, V.; Mullins, E.; Kessel, G.J.T.; Lotz, L.A.P.; Tebbe, C.C. No Tangible Effects of Field-Grown Cisgenic Potatoes on Soil Microbial Communities. Front. Bioeng. Biotechnol. 2020, 8, 603145. [Google Scholar] [CrossRef] [PubMed]
  16. Batista, R.; Saibo, N.; Lourenco, T.; Oliveiro, M.M. Microarray analyses reveal that plant mutagenesis may induce more transcriptomic changes than transgene insertion. Proc. Natl. Acad. Sci. USA 2008, 105, 3640–3645. [Google Scholar] [CrossRef]
  17. Coll, A.; Nadal, A.; Collado, R.; Capellades, G.; Kubista, M.; Messeguer, J.; Pla, M. Natural variation explains most transcriptomic changes among maize plants of MON810 and comparable non-GM varieties subjected to two N-fertilization farming practices. Plant Mol. Biol. 2010, 73, 349–362. [Google Scholar] [CrossRef]
  18. Kawakatsu, T.; Kawahara, Y.; Itoh, T.; Takaiwa, F. A Whole-Genome Analysis of a Transgenic Rice Seed-Based Edible Vaccine Against Cedar Pollen Allergy. DNA Res. 2013, 20, 623–631. [Google Scholar] [CrossRef]
  19. Coll, A.; Nadal, A.; Rossignol, M.; Puigdomenech, P.; Pla, M. Proteomic analysis of MON810 and comparable non-GM maize varieties grown in agricultural fields. Transgenic Res. 2011, 20, 939–949. [Google Scholar] [CrossRef]
  20. Koh, J.; Chen, G.; Yoo, M.J.; Zhu, N.; Dufresne, D.; Erickson, J.E.; Shao, H.; Chen, S. Comparative Proteomic Analysis of Brassica napus in Response to Drought Stress. J. Proteome Res. 2015, 14, 3068–3081. [Google Scholar] [CrossRef]
  21. Okazaki, Y.; Saito, K. Recent advances of metabolomics in plant biotechnology. Plant Biotechnol. Rep. 2012, 6, 1–15. [Google Scholar] [CrossRef]
  22. Catchpole, G.S.; Beckmann, M.; Enot, D.P.; Mondhe, M.; Zywicki, B.; Taylor, J.; Hardy, N.; Smith, A.; King, R.D.; Kell, D.B.; et al. Hierarchical metabolomics demonstrates substantial compositional similarity between genetically modifiedand conventional potato crops. Proc. Natl. Acad. Sci. USA 2005, 102, 14458–14462. [Google Scholar] [CrossRef]
  23. Zhou, J.; Ma, C.; Xu, H.; Yuan, K.; Lu, X.; Zhu, Z.; Wu, Y.; Xu, G. Metabolic profiling of transgenic rice with cryIAc and sck genes: An evaluation of unintended effects at metabolic level by using GC-FID and GC-MS. J. Chromatogr. B Analyt Technol. Biomed. Life Sci. 2009, 877, 725–732. [Google Scholar] [CrossRef]
  24. Wang, X.J.; Zhang, X.; Yang, J.T.; Wang, Z.X. Effect on transcriptome and metabolome of stacked transgenic maize containing insecticidal cry and glyphosate tolerance epsps genes. Plant J. 2018, 93, 1007–1016. [Google Scholar] [CrossRef]
  25. Ladics, G.S.; Bartholomaeus, A.; Bregitzer, P.; Doerrer, N.G.; Gray, A.; Holzhauser, T.; Jordan, M.; Keese, P.; Kok, E.; Macdonald, P.; et al. Genetic basis and detection of unintended effects in genetically modified crop plants. Transgenic Res. 2015, 24, 587–603. [Google Scholar] [CrossRef] [PubMed]
  26. Schnell, J.; Steele, M.; Bean, J.; Neuspiel, M.; Girard, C.; Dormann, N.; Pearson, C.; Savoie, A.; Bourbonniere, L.; Macdonald, P. A comparative analysis of insertional effects in genetically engineered plants: Considerations for pre-market assessments. Transgenic Res. 2015, 24, 1–17. [Google Scholar] [CrossRef] [PubMed]
  27. Bednář, M. DNA microarray technology and application. Diagn. Med. Technol. 2000, 6, 796–800. [Google Scholar]
  28. Velculescu, V.E.; Zhang, L.; Vogelstein, B.; Kinzler, K.W. Serial Analysis of Gene Expression. Science 1995, 270, 484–487. [Google Scholar] [CrossRef] [PubMed]
  29. Wang, Z.; Gerstein, M.; Snyder, M. RNA-Seq: A revolutionary tool for transcriptomics. Nat. Rev. Genet. 2009, 10, 57–63. [Google Scholar] [CrossRef] [PubMed]
  30. Xue, S.; Zhu, T.; Li, B.; Li, T. Application research of combined transcriptome with metabolome in plants. J. Shanxi Agric. Univ. 2022, 42, 1–13. [Google Scholar] [CrossRef]
  31. Peng, C.; Chen, X.; Wang, X.; Xu, X.; Wei, W.; Wang, C.; Xu, J. Comparative analysis of miRNA expression profiles in transgenic and non-transgenic rice using miRNA-Seq. Sci. Rep. 2018, 8, 338. [Google Scholar] [CrossRef]
  32. Guo, B.F.; Hong, H.L.; Sun, L.P.; Guo, Y.; Qiu, L.J. Transcriptome analysis reveals differing response and tolerance mechanism of EPSPS and GAT genes among transgenic soybeans. Mol. Biol. Rep. 2021, 48, 7351–7360. [Google Scholar] [CrossRef]
  33. Shu, Q.; Ye, G.; Cui, H.; Xiang, Y.; Gao, M. Development of Transgenic Bacillus thuriengiensis Rice Resistant to Rice Stem Borers and Leaf Folders. J. Zhejiang Agric. Univ. 1998, 24, 579–580. [Google Scholar]
  34. Shu, Q.; Ye, G.; Cui, H.; Cheng, X.; Xiang, Y.; Wu, D.; Gao, M.; Xia, Y.; Hu, C.; Sardana, R.; et al. Transgenic rice plants with a synthetic cry1Ab gene from Bacillus thuringiensis were highly resistant to eight lepidopteran rice pest species. Mol. Breed. 2000, 6, 433–439. [Google Scholar] [CrossRef]
  35. Xiang, Y.; Liang, Z.; Gao, M.; Shu, Q.; Ye, G.; Cheng, X.; Altosaar, I. Agrobacterium-mediated Transformation of Insecticidal Bacillus thuringiensis cryIA(b) and cryIA(c) Genes and Their Expression in Rice. Chin. J. Biotechnol. 1999, 15, 495–500. [Google Scholar] [CrossRef]
  36. Rong, J.; Song, Z.; Su, J.; Xia, H.; Lu, B.R.; Wang, F. Low frequency of transgene flow from Bt/CpTI rice to its nontransgenic counterparts planted at close spacing. New Phytol. 2005, 168, 559–566. [Google Scholar] [CrossRef]
  37. Tu, J.; Zhang, G.; Datta, K.; Xu, C.; He, Y.; Zhang, Q.; Khush, G.S.; Datta, S.K. Field performance of transgenic elite commercial hybrid rice expressing Bacillus thuringiensis δ-endotoxin. Nat. Biotechnol. 2000, 18, 1101–1104. [Google Scholar] [CrossRef]
  38. Feng, J.; Meyer, C.A.; Wang, Q.; Liu, J.S.; Shirley Liu, X.; Zhang, Y. GFOLD: A generalized fold change for ranking differentially expressed genes from RNA-seq data. Bioinformatics 2012, 28, 2782–2788. [Google Scholar] [CrossRef]
  39. Botstein, D.; Butler, H.; Cherry, J.M.; Davis, A.P.; Dolinski, K.; Dwight, S.S.; Eppig, J.T.; Harris, M.A.; Hill, D.P.; Issel-Tarver, L.; et al. Gene Ontology: Tool for the unification of biology. Nat. Genet. 2000, 25, 25–29. [Google Scholar] [CrossRef]
  40. Yu, G.; Wang, L.; Han, Y.; He, Q. clusterProfiler: An R Package for Comparing Biological Themes Among Gene Clusters. OMICS J. Integr. Biol. 2012, 16, 284–287. [Google Scholar] [CrossRef]
  41. Ogata, H.; Goto, S.; Sato, K.; Fujibuchi, W.; Bono, H.; Kanehisa, M. KEGG: Kyoto Encyclopedia of Genes and Genomes. Nucleic Acids Res. 1999, 27, 29–34. [Google Scholar] [CrossRef]
  42. Miki, B.; Abdeen, A.; Manabe, Y.; MacDonald, P. Selectable marker genes and unintended changes to the plant transcriptome. Plant Biotechnol. J. 2009, 7, 211–218. [Google Scholar] [CrossRef] [PubMed]
  43. Liu, Q.; Yang, X.; Tzin, V.; Peng, Y.; Romeis, J.; Li, Y. Plant breeding involving genetic engineering does not result in unacceptable unintended effects in rice relative to conventional cross-breeding. Plant J. 2020, 103, 2236–2249. [Google Scholar] [CrossRef] [PubMed]
  44. Ogawa, T.; Kato, K.; Asuka, H.; Sugioka, Y.; Mochizuki, T.; Nishiuchi, T.; Miyahara, T.; Kodama, H.; Ohta, D. Multi-omics Analyses of Non-GM Tomato Scion Engrafted on GM Rootstocks. Food Safety 2023, 11, 41–53. [Google Scholar] [CrossRef] [PubMed]
  45. Miyahara, T.; Nishiuchi, T.; Fujikawa, N.; Oguchi, T.; Kikuchi, A.; Taoka, K.-I.; Ogawa, T.; Honda, K.; Yamaguchi, Y.; Mochizuki, T.; et al. Omics Profiles of Non-GM Tubers from Transgrafted Potato with a GM Scion. Food Saf. 2023, 11, D-22-00010. [Google Scholar] [CrossRef]
  46. Liu, Y.; Wang, W.; Li, Y.; Liu, F.; Han, W.; Li, J. Transcriptomic and proteomic responses to brown plant hopper (Nilaparvata lugens) in cultivated and Bt-transgenic rice (Oryza sativa) and wild rice (O. rufipogon). J. Proteom. 2021, 232, 104051. [Google Scholar] [CrossRef]
  47. Wang, C.; Lu, W.; Lin, Y.; Luo, J. Development and Application of Transcriptome Sequencing. Eucalypt Sci. Technol. 2018, 35, 20–26. [Google Scholar] [CrossRef]
  48. Zhang, X.; Zhang, R.; Li, L.; Yang, Y.; Ding, Y.; Guan, H.; Wang, X.; Zhang, A.; Wen, H. Negligible transcriptome and metabolome alterations in RNAi insecticidal maize against Monolepta hieroglyphica. Plant Cell Rep. 2020, 39, 1539–1547. [Google Scholar] [CrossRef]
  49. Kogel, K.H.; Voll, L.M.; Schafer, P.; Jansen, C.; Wu, Y.; Langen, G.; Imani, J.; Hofmann, J.; Schmiedl, A.; Sonnewald, S.; et al. Transcriptome and metabolome profiling of field-grown transgenic barley lack induced differences but show cultivar-specific variances. Proc. Natl. Acad. Sci. USA 2010, 107, 6198–6203. [Google Scholar] [CrossRef]
  50. Long, Y.; Xu, W.; Liu, C.; Dong, M.; Pei, X.; Chen, R.; Jin, W.; Liu, W.; Li, L. Genetically modified soybean lines exhibit less transcriptomic variation compared to natural varieties. GM Crops Food 2023, 14, 1–11. [Google Scholar] [CrossRef]
  51. Zhang, W.; Zhao, J.; Li, Y.; Chen, X.; Jian, G.; Peng, Y.; Qi, F. Transcriptome Analysis Revealing the Absence of Unintended Effects Both in Aerial and Underground Portions of Transgenic Rice (Oryza sativa L.) Huahui 1. J. Agric. Biotechnol. 2015, 23, 876–887. [Google Scholar]
  52. Faergeman, N.J.; Wadum, M.; Feddersen, S.; Burton, M.; Kragelund, B.B.; Knudsen, J. Acyl-CoA binding proteins; structural and functional conservation over 2000 MYA. Mol. Cell Biochem. 2007, 299, 55–65. [Google Scholar] [CrossRef] [PubMed]
  53. Gao, W.; Xiao, S.; Li, H.Y.; Tsao, S.W.; Chye, M.L. Arabidopsis thaliana acyl-CoA-binding protein ACBP2 interacts with heavy-metal-binding farnesylated protein AtFP6. New Phytol. 2009, 181, 89–102. [Google Scholar] [CrossRef] [PubMed]
  54. Xiao, S.; Gao, W.; Chen, Q.F.; Ramalingam, S.; Chye, M.L. Overexpression of membrane-associated acyl-CoA-binding protein ACBP1 enhances lead tolerance in Arabidopsis. Plant J. 2008, 54, 141–151. [Google Scholar] [CrossRef]
  55. Chye, M.L.; Huang, B.Q.; Zee, S.Y. Isolation of a gene encoding Arabidopsis membrane-associated acyl-CoA binding protein and immunolocalization of its gene product. Plant J. 1999, 18, 205–214. [Google Scholar] [CrossRef] [PubMed]
  56. Chen, Q.F.; Xiao, S.; Qi, W.; Mishra, G.; Ma, J.; Wang, M.; Chye, M.L. The Arabidopsis acbp1 acbp2 double mutant lacking acyl-CoA-binding proteins ACBP1 and ACBP2 is embryo lethal. New Phytol. 2010, 186, 843–855. [Google Scholar] [CrossRef]
  57. Meng, W.; Su, Y.C.F.; Saunders, R.M.K.; Chye, M.L. The rice acyl-CoA-binding protein gene family: Phylogeny, expression and functional analysis. New Phytol. 2011, 189, 1170–1184. [Google Scholar] [CrossRef] [PubMed]
  58. Coll, A.; Nadal, A.; Collado, R.; Capellades, G.; Messeguer, J.; Mele, E.; Palaudelmas, M.; Pla, M. Gene expression profiles of MON810 and comparable non-GM maize varieties cultured in the field are more similar than are those of conventional lines. Transgenic Res. 2009, 18, 801–808. [Google Scholar] [CrossRef]
  59. Metzdorff, S.B.; Kok, E.J.; Knuthsen, P.; Pedersen, J. Evaluation of a non-targeted “omic” approach in the safety assessment of genetically modified plants. Plant Biol. 2006, 8, 662–672. [Google Scholar] [CrossRef]
  60. Ricroch, A.E.; Berge, J.B.; Kuntz, M. Evaluation of genetically engineered crops using transcriptomic, proteomic, and metabolomic profiling techniques. Plant Physiol. 2011, 155, 1752–1761. [Google Scholar] [CrossRef]
Figure 1. Experimental flow chart (Created with BioRender.com).
Processes 11 03202 g001
Figure 2. Diagrams of the transgene vectors and expression profiles of the transgenes. LB: Left border. RB: Right border. Ubi: UBI-promoter. Pact: Act-promoter. Cry1Ab, Cry1Ac, Cry1Ab/Ac: Insect-resistant gene. nos: nos terminator. 35S: 35S promoter. Hph, Hpt: Hygromycin B phosphotransferase. Gus: β-glucuronidase. SCK for the modified (Cowpea trypsin inbibter. CpTI). Transgenic Vector Information: (A) KMD vector. (B) KF6 vector. (C) TT51-1 vector. (D) Detection of the Bt and SPS genes. 1, XS11 (receptor of KMD). 2, KMD (transgenic rice). 3, MH86 (receptor of KF6). 4, KF6 (transgenic rice). 5, MH63 (receptor of TT51-1). 6, TT51-1(transgenic rice). M: DNA molecular weight marker Ladder H1 (100–1000 bp).
Processes 11 03202 g002
Figure 3. Principal component analysis of samples. PCA results showing similarity of the transgenic and non-transgenic rice varieties. The Japonica varieties were separated from the Indica varieties.
Processes 11 03202 g003
Figure 4. Identification of DEGs. (A) Number of DEGs between different groups (transgenic varieties: KMD, KF6, and TT51-1; non-transgenic varieties: XS11, MH86, and MH63). Upregulated and downregulated DEGs are indicated in pink and blue, respectively. (B) Volcano plots of DEGs. (C) Venn diagram showing eight overlapping DEGs. (D) Upregulated and downregulated DEGs are indicated in red and blue, respectively.
Processes 11 03202 g004
Figure 5. GO analysis of DEGs. The significantly enriched GO terms of the DEGs among the three groups are shown (p < 0.05, from small to large). The size of the dots represents the number of genes. Biological processes are indicated by green lines and molecular function by orange lines.
Processes 11 03202 g005
Figure 6. KEGG pathways of the DEGs identified in this study. (A) For XS11 vs. KMD, 13 KEGG pathways were significantly enriched (p < 0.05). (B) For MH86 vs. KF6, 10 KEGG pathways were significantly enriched (p < 0.05). (C) For MH63 vs. TT51-1, 10 KEGG pathways were significantly enriched (p < 0.05). Red, genetic information processing; green, metabolism; purple, cellular processes. The size of the dots indicates the number of genes.
Processes 11 03202 g006
Table 1. RNA-sequencing and transcriptome mapping results.
SamplesXS11KMDMH86KF6MH63TT51-1
Raw reads12,112,18612,632,87612,336,91412,370,72212,390,37612,301,398
Clean reads10,463,20811,262,97411,164,71812,213,47011,011,24810,927,996
Clean reads rate (%)86.3989.1690.5098.7388.8788.84
Mapped reads8,936,0999,805,0739,361,27310,411,6879,166,1359,184,202
Mapped rate (%)85.4087.0683.8585.2583.2484.04
Unmapped reads1,527,1091,457,9011,803,4451,801,7831,845,1131,743,794
Unmapped rate (%)14.6012.9416.1514.7516.7615.96
GC (%)524752515252
Disclaimer/Publisher’s Note: The statements, opinions and data contained in all publications are solely those of the individual author(s) and contributor(s) and not of MDPI and/or the editor(s). MDPI and/or the editor(s) disclaim responsibility for any injury to people or property resulting from any ideas, methods, instructions or products referred to in the content.