1. Introduction
In recent years, there has been a noticeable disparity worldwide between the demand for petroleum and natural gas and the production from conventional oil and gas fields. Consequently, both domestically and internationally, there has been a heightened focus on the exploration and development of unconventional oil and gas resources. China, endowed with substantial reserves of low-permeability tight gas reservoirs, has witnessed the emergence of tight gas as a pivotal component of the nation’s oil and gas production. At the individual well level, low-permeability gas reservoirs inherently exhibit very low natural productivity, owing to their low porosity and permeability characteristics. However, recent advancements in hydraulic fracturing and reservoir enhancement technologies have made the development of low-permeability gas reservoirs economically viable, playing a crucial role in alleviating global energy challenges [
1,
2,
3]. In the later stages of tight gas reservoir exploitation, the transition of fluids within the reservoir and fractures from a single-phase to a two-phase state (gas and water) significantly impacts the stress sensitivity (SS) and threshold pressure gradient (TPG) of a tight reservoir. This, in turn, has a profound effect on gas well productivity [
4,
5,
6,
7,
8,
9,
10,
11]. To address these challenges and effectively exploit tight gas reservoirs while enhancing gas production capacity, experts both domestically and internationally have undertaken extensive research efforts.
Compared to conventional gas reservoirs, the permeation mechanisms in tight gas reservoirs are notably more intricate and influenced by a multitude of factors, such as non-Darcy flow and reservoir SS. Researchers like W. Wen, through the analysis of SS experiments and production data, have delved into the impact of SS on reservoir properties and gas well production [
12]. Based on a modified SS equation and the characteristics of reservoir permeation, they have established a binomial equation suitable for the geological attributes of oil and gas reservoirs. Their findings underscore the significance of SS effects in the development of abnormally high-pressure gas reservoirs. In essence, the more pronounced the SS within a given reservoir, the greater the SS effects during development, leading to more substantial gas well productivity losses. In a related vein, H. Song, considering the initiation pressure gradient, has developed a productivity equation for vertically fractured wells in water-bearing tight gas reservoirs [
13]. Meanwhile, X. Huang has conducted research on gas well productivity models in water-bearing inclined gas reservoirs that incorporate SS [
14]. They have formulated a new equation for gas well productivity, elucidating the relationship between gas well productivity, SS, and water production. Furthermore, Zhang H. has proposed an analytical approach for the productivity of gas–water wells in abnormally high-pressure gas reservoirs, accounting for factors like changes in the permeation capacity of gas–water two-phase flow, reservoir and fluid elasticity, and reservoir SS [
15]. Through practical case analyses, their study examined the influence of various factors on gas production. Ning Bo, focusing on the double-porosity permeation theory for horizontal wells in tight gas reservoirs, has considered both SS and initiation pressure gradients [
16]. This comprehensive approach has led to the development of a permeation model for horizontal wells in tight gas reservoirs, ultimately concluding that initiation pressure gradients or SS must be factored in when assessing tight gas reservoirs. Otherwise, substantial discrepancies may arise in initial production predictions for horizontal wells, affecting decision-making processes.
Li Jing conducted experimental research on the gas slippage phenomenon in single-phase and two-phase permeation within tight rocks. The results directly indicate that the gas slippage coefficient increases with an increase in water saturation [
17]. As water saturation increases, the SS effect intensifies, leading to a rapid decline in natural gas production. Furthermore, with increasing water saturation, the nonlinear gas phase flow becomes more pronounced [
18]. Tian W, through experimental research, conclusively established that reservoir water content is the fundamental factor responsible for generating TPG during gas permeation processes [
19]. Zhu W conducted a sensitivity analysis of two influencing factors on initiation pressure gradients: permeability and water saturation. The study results indicate that initiation pressure gradients are power-functionally related to both factors, decreasing with increasing permeability and increasing with higher water saturation [
20].
Many scholars have primarily focused on the impact of single-phase gas or single-factor gas–water interactions on well productivity, with relatively fewer studies considering the simultaneous influence of multiple factors in gas–water two-phase conditions. However, in real-world tight sandstone gas reservoirs, during the later stages of development, both gas and water coexist. Research has indicated that variations in water saturation significantly affect the permeation mechanisms of gas reservoirs. Conventional productivity models often overlook this influence. Furthermore, tight gas reservoirs typically exhibit low production rates, necessitating hydraulic fracturing to enhance well output. After hydraulic fracturing, the permeation mechanisms and influencing factors inside and outside the fracturing zone differ considerably. Conventional productivity calculation models struggle to accurately describe these regional variations in permeation characteristics. In light of these challenges, this study builds upon research into zonal permeation mechanisms in hydraulically fractured gas wells within tight gas reservoirs and accomplishes the following: (1) Development of a multifactorial permeation model: The study establishes a complex permeation model that considers the influence of water saturation on permeation mechanisms in the context of tight gas reservoirs under multifactorial conditions. (2) Model validation: The developed model’s accuracy is validated by comparing it with unrestricted gas flow rates obtained through productivity testing. This validation process provides a basis for predicting the productivity of tight sandstone gas reservoirs, thereby enhancing our understanding and predictive capabilities in this complex context. This research contributes to the advancement of knowledge in the field of tight gas reservoir development by addressing the challenges posed by gas–water coexistence, regional permeation variations, and the influence of water saturation on productivity, ultimately facilitating more accurate assessments and predictions in this complex domain.
2. Seepage Characteristics of Tight Water-Bearing Gas Reservoirs
2.1. Characteristics of Gas Slippage Effect in High-Water-Cut Tight Sandstone Gas Reservoirs
Gas experiences slip flow when passing through a porous medium due to the relatively weak molecular forces between gas molecules and the solid material. Some gas molecules near the wall of the medium remain in a state of motion, and adjacent layers of gas molecules also flow along the wall due to momentum exchange. This molecular velocity, manifested as slip flow, occurs at the microscopic level near the wall during gas permeation. It results in apparent permeability values measured in laboratory gas tests being greater than the true permeability values of the reservoir. The phenomenon of gas slip is particularly pronounced in tight reservoirs. Researchers have conducted physical simulation experiments to elucidate that gas slip is primarily influenced by reservoir permeability, water saturation, and temperature. The degree of slip flow effect diminishes gradually with increasing reservoir permeability, water saturation, and temperature [
21,
22,
23].
The influence of water saturation on the slippage factor can be fitted as follows:
where
α and
γ are fitting coefficients of water saturation to the slip factor;
β is the slippage factor.
The reduction in gas slippage effects in low-permeability rock formations with increasing water saturation can be attributed to several intricate mechanisms. As the average free path of gas molecules approximates the pore diameter, collision frequencies between gas molecules and the porous medium’s walls escalate. This heightened collision frequency prompts slip flow along the sidewalls, resulting in increased gas velocities. Consequently, when measuring permeability using gas as the medium, non-Darcy flow phenomena emerge, causing the measured gas permeability to exceed the actual permeability.
During the circulation of gas within water-bearing rock samples, water often adheres to pore walls or infiltrates smaller pores in the form of a water film due to the interplay of gas and capillary pressures. In the pore network of rock samples, where gas molecules continuously flow, they predominantly collide with water molecules rather than solid pore walls. This preference for water-molecule collisions restricts the occurrence of slip flow, which typically necessitates direct gas–pore wall interactions. With increasing water saturation, more water molecules are driven to coat the pore walls, as depicted in
Figure 1. Consequently, the collision frequency between gas molecules and solid pore walls further diminishes, intensifying the constraints on slip flow. As a result, gas slippage effects decrease with increasing water saturation. Prior research often treated gas slippage factors as constants, but it is imperative to consider the GSFECWS when establishing productivity equations for tight sandstone reservoirs.
2.2. Characteristics of High-Speed Non-Darcy Effect (HSNDE) High-Water-Cut Tight Sandstone Gas Reservoirs
Gas slippage is a seepage phenomenon that occurs under low-pressure and low-velocity conditions. As flow velocity increases, gas molecules continuously undergo acceleration and deceleration as they navigate through convoluted pathways with varying diameters. This results in a gradual increase in inertial forces. When the velocity reaches a certain threshold, the relationship between flow velocity and pressure gradient departs from the linear pattern of Darcy flow. This phenomenon is referred to as high-velocity non-Darcy flow.
Cornel proposed that this non-Darcy flow phenomenon, characterized by the nonlinear relationship between the pressure gradient and flow velocity, is primarily attributed to turbulence [
24]. However, this nonlinear flow behavior is not solely due to turbulence but is also influenced by inertia [
25,
26,
27].
Numerous scholars have reached conclusions through the analysis of the seepage equation and physical simulation experiments: The greater the permeability of the reservoir, the larger the pore throat radius. Gas molecules flow more easily in the reservoir, and the gas flow rate is higher. Therefore, the seepage characteristic curve of gas in the reservoir deviates more from the linear characteristics of Darcy seepage [
28,
29,
30].
2.3. Stress Sensitivity Characteristics of High-Water-Cut Tight Sandstone Gas Reservoirs
The study of stress sensitivity in reservoirs has a long history. As early as 1957, Geert defined the rock volume compressibility coefficient to quantitatively describe the phenomenon of pore volume changes caused by changes in reservoir pore pressure. Scholars have clearly established that stress sensitivity falls within the domain of deformation media in reservoir mechanics, referring to the phenomenon where reservoir permeability changes with variations in effective stress [
31].
SS has a significant impact on the development of tight oil and gas fields. Scholars have conducted extensive research on the stress sensitivity characteristics of tight reservoirs and their effects on gas well productivity [
32,
33]. In low-permeability tight reservoirs, as the reservoir permeability gradually decreases, the degree of stress sensitivity becomes more pronounced. Higher water saturation also leads to increased stress sensitivity [
34]. Through experimental studies on reservoir stress sensitivity under movable water conditions, researchers have indicated that the change in permeability with effective pressure can be described using a power-law relationship [
35]:
where
is the SS factor parameter;
is the effective pressure of the formation, MPa;
is the gas permeability, mD;
is the formation conditions gas permeability, mD.
The SS of core samples is significantly influenced by the degree of water saturation, primarily due to changes in pore structure. Water affects the mechanical properties of rocks through mechanisms such as wedging, lubrication, and erosion. When water enters the rock matrix due to interfacial tension, it forms water wedges or films that reduce pore throat radii, leading to a decrease in reservoir permeability. Additionally, this intensifies the sensitivity of reservoir stress (as illustrated in
Figure 2a). The lubricating effect of water reduces the compressive strength of the rock framework, causing further compression of particles and pore throats. As effective stress continues to increase, the chemical potential of the water film on the surface of quartz particles within the rock becomes unbalanced, resulting in pressure dissolution or chemical compaction. This leads to the precipitation of SiO
2, reducing pore throat radii (as shown in
Figure 2b) and permeability, ultimately affecting gas well productivity. Therefore, when studying the productivity of high-water-cut tight sandstone gas reservoirs, it is essential to consider the influence of water saturation on SS.
2.4. Dynamic Threshold Pressure Gradient (DTPG) Characteristics of High-Water-Cut Tight Sandstone Gas Reservoirs
The initiation pressure gradient represents the minimum pressure gradient required for the non-wetting phase to establish continuous flow within the pores of rock. For tight sandstone gas reservoirs, the primary reason for the existence of initiation pressure gradients is the Jamin effect. Due to the small throat radius in tight reservoirs, when gas bubbles flow from larger pores into narrower throats, they encounter resistance. Overcoming the capillary pressure resulting from the deformation of gas bubbles is necessary to continue the flow. When the driving pressure is insufficient to counteract the capillary forces, gas bubbles aggregate at the throat and block it. After a certain period of energy accumulation, gas and water phases can break through these constraints and initiate flow. Thus, a certain pressure difference acting on both sides of the gas bubble’s surface is a necessary condition for the gas to start flowing [
36].
Since the concept of initiation pressure gradients was introduced, numerous foreign scholars have conducted experimental studies confirming the existence of initiation pressure gradients in the fluid flow through low-permeability tight reservoirs. In recent years, domestic researchers have also conducted extensive research. Zafar conducted experiments on tight sandstone core samples, conclusively establishing the influence pattern of water saturation on the initiation pressure gradient: with increasing water saturation, the initiation pressure gradient steadily amplifies. In the presence of water in tight gas reservoirs, gas flow exhibits nonlinear characteristics, resulting in the formation of initiation pressure gradients. The TPG of the gas phase shows a highly correlated power-law relationship with water saturation [
37].
The higher the water saturation, the greater the TPG in the core. This is primarily due to the higher viscosity resistance of liquids compared to gases, impeding the flow of gas. Additionally, as the pore throat confinement water saturation increases, the capillary forces for both gas and water phases become stronger, resulting in greater flow resistance for the gas phase and, consequently, a higher initiation pressure gradient. Therefore, when formulating the productivity equation for tight water-bearing gas reservoirs, it is essential to consider the influence of water saturation on the TPG.
2.5. Characteristics of Two-Phase Flow in High-Water-Cut Tight Sandstone Gas Reservoirs
Currently, the equations governing two-phase gas–water flow are primarily derived based on the generalized two-phase Darcy flow theory. Numerous scholars worldwide have investigated the flow behavior of gas and water in various ways [
38,
39,
40]. The relative permeability of gas and water is related to the thickness of the bound water film, pore structure parameters, and the viscosity ratio of gas to water. As the thickness of the bound water film increases, the relative permeability curve of gas and water shifts to the right [
41]. As the thickness of the capillary water film increases, the relative permeability curves for gas and water shift to the right. The relative permeability curves for gas and water increase with an increase in pore fractal dimension but decrease with an increase in tortuosity fractal dimension. “Permeability barriers”, as proposed by Shanley, describe the flow characteristics of gas and water in tight sandstone gas reservoirs: (1) Conventional gas reservoirs typically have relatively good reservoir properties, with a broad two-phase flow region during gas–water flow. (2) In contrast, tight sandstone gas reservoirs with poorer reservoir properties exhibit unusual gas–water relative permeability curves and may lack a distinct two-phase flow region. This macroscopically manifests as a condition where, at a certain level of water saturation, neither gas nor water production occurs. It is evident that water saturation has a significantly adverse impact on the two-phase gas–water flow behavior [
42].
Therefore, characterizing the influence of water saturation and its impact on gas well productivity is crucial for the theoretical development and research of tight sandstone gas reservoirs.
3. Characteristics and Methods
In the context of gas migration within low-permeability reservoirs, gas migration is typically associated with four key phenomena: slip flow effects, SS, TPG, and HSNDE. This article, building upon the conventional gas–water co-production well deliverability equation, integrates the impact of water saturation on various permeation mechanisms, leading to the derivation of a comprehensive permeation equation for tight water-saturated gas reservoirs that accounts for multiple influencing factors simultaneously.
3.1. Subsection
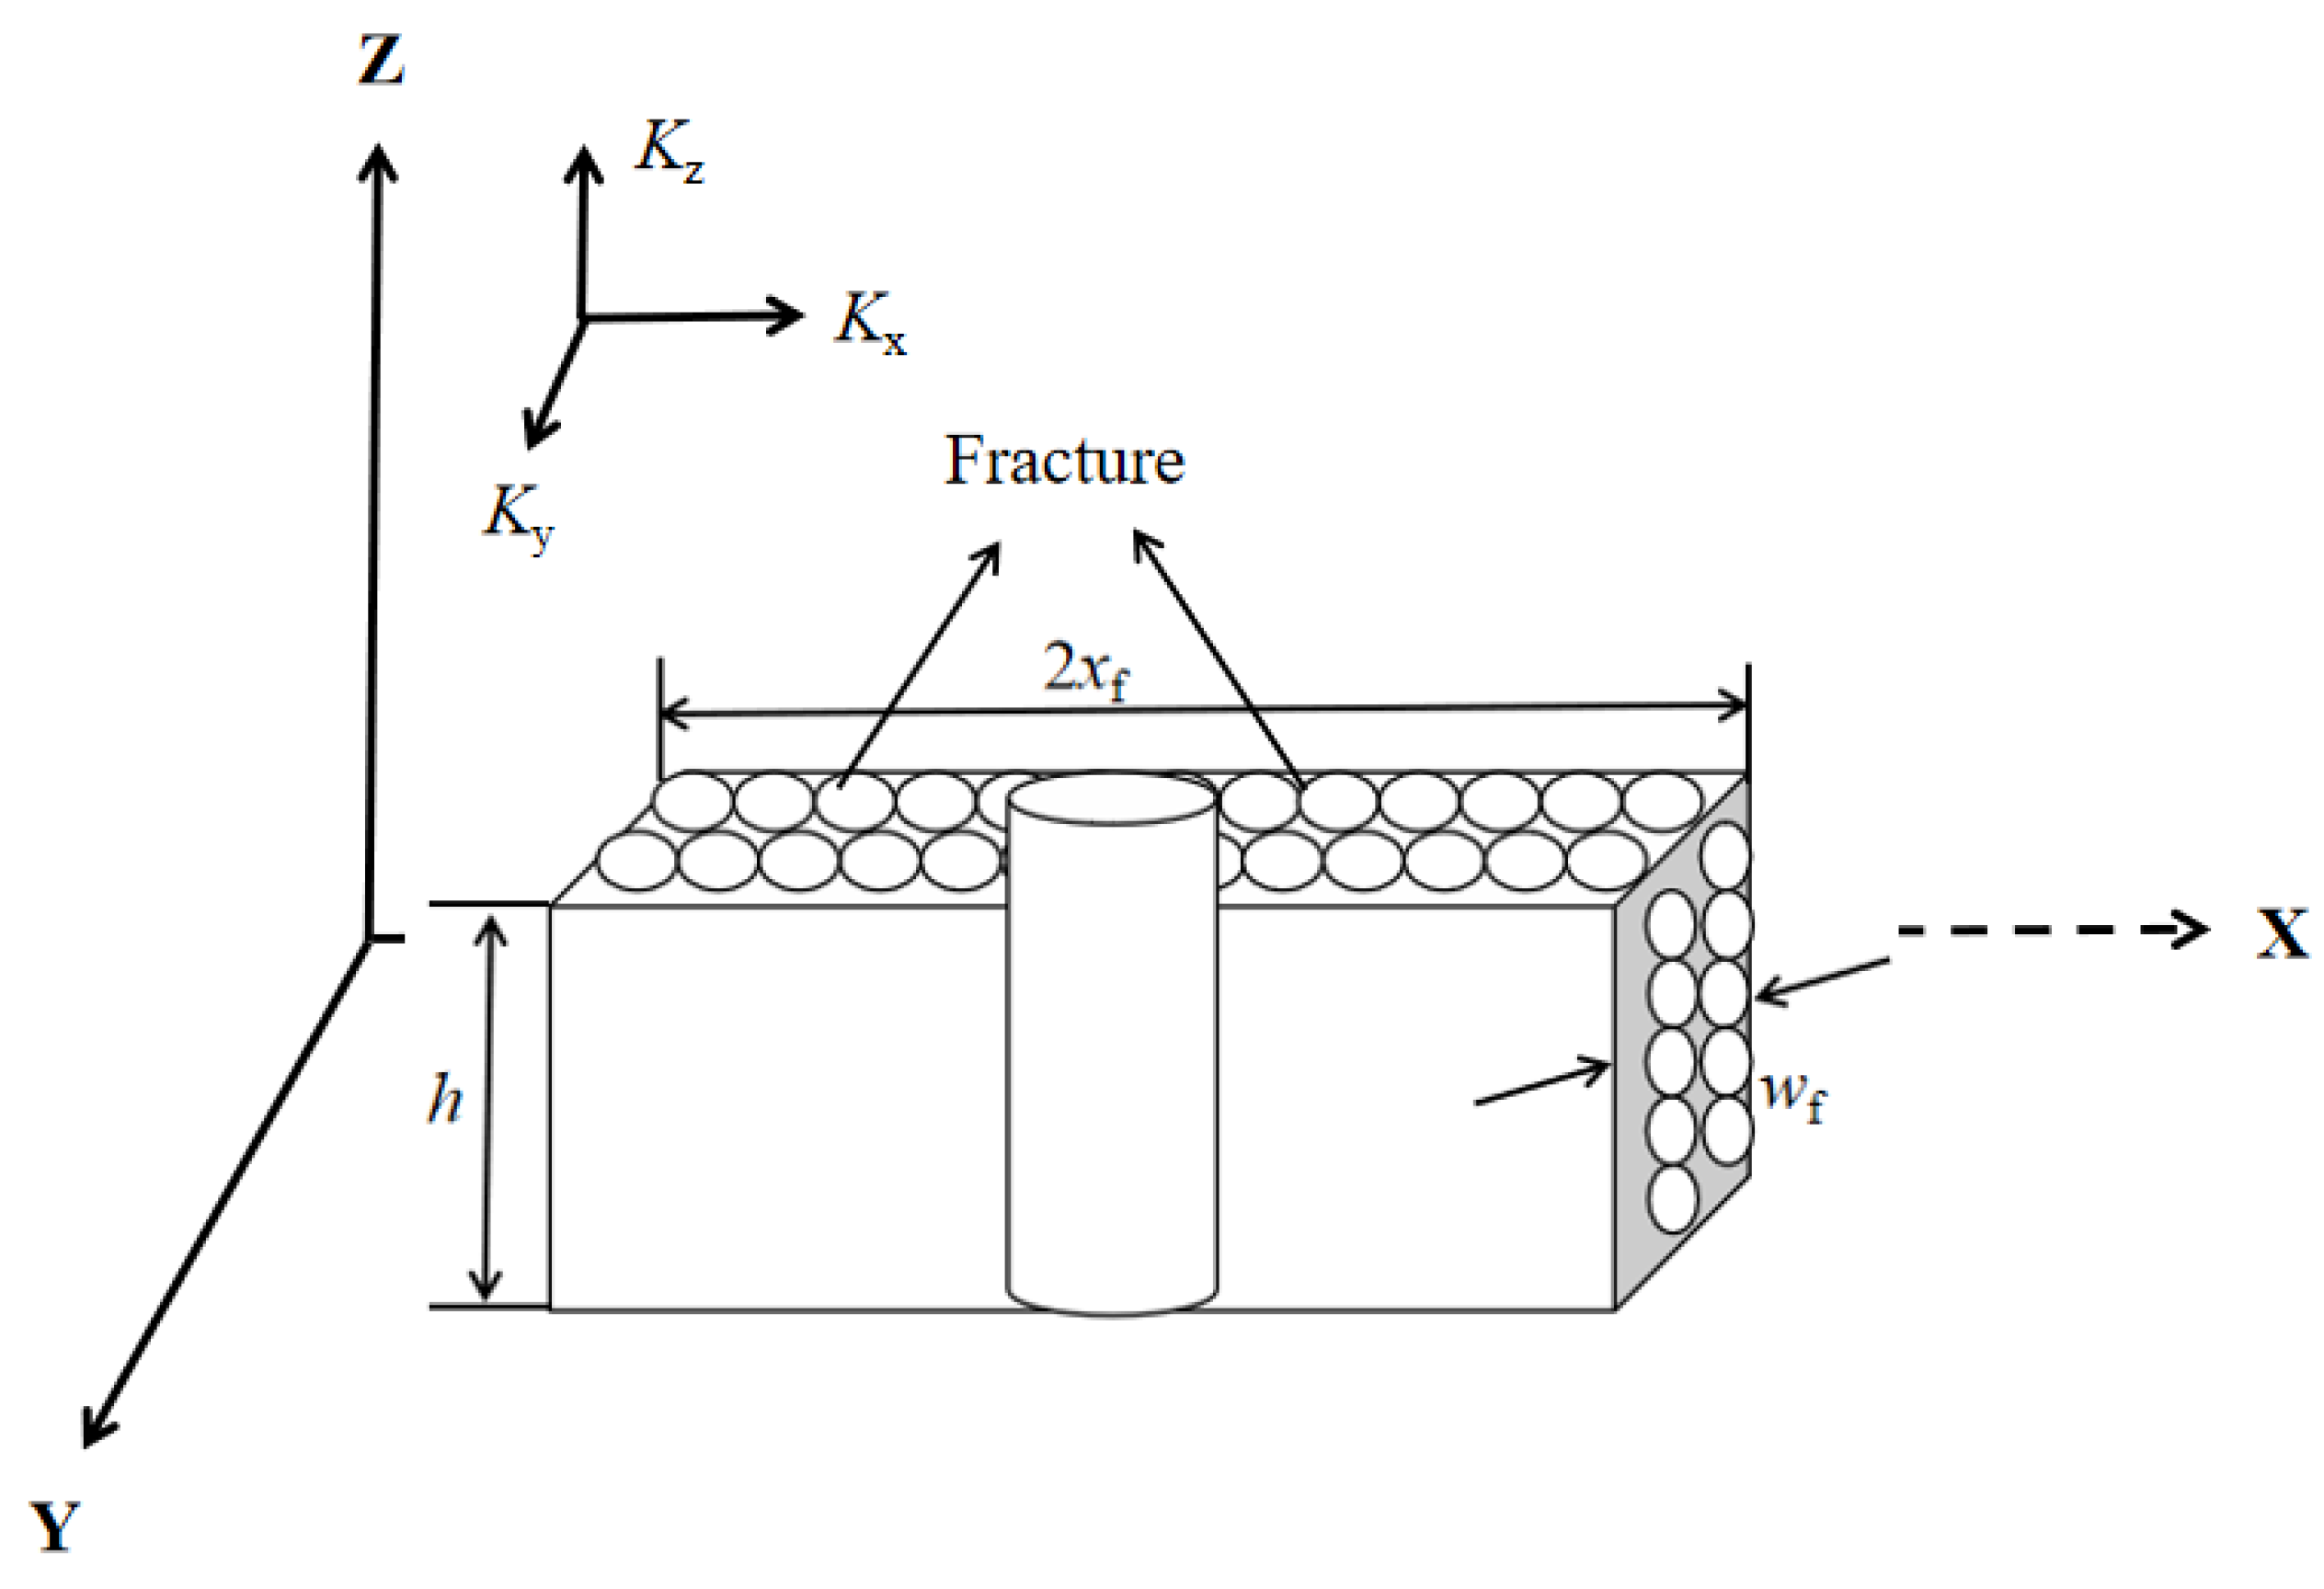
Assuming that the well is located in a low-permeability gas reservoir with a reservoir thickness of
h, the well is vertically fractured and put into production. The fractures completely penetrate the reservoir, and the equal width of the fractures is
wf. The fractures are symmetrically distributed along the wellbore and are limited-conductivity fractures. The single well control radius of the gas well is
, the wellbore radius is
, and the half-length of the fractures is
. At present, the formation pressure is
Pe, and the bottom-hole flow pressure is
, without considering the mutual dissolution of gas and water, ignoring the influence of gravity and capillary force. The physical model of the fractured well is shown in
Figure 3.
The assumption conditions are as follows: the gas phase and water phase will not dissolve each other; gas–water two-phase flow in the formation is a plane and radial stable seepage; the productivity of vertical fracturing wells is contributed by artificial fracturing, and the fluid flows from the matrix into the fractures and then into the wellbore; steady-state seepage of gas–water two-phase homogeneous fluid, ignoring temperature changes and special physical and chemical phenomena; the model considers the influence of permeability SS, slippage effect, TPG and HSNDE; the influence of capillary force is ignored.
After hydraulic fracturing of a vertical well, the seepage in the reservoir changes from a single formation seepage to a seepage in the formation and fractures. Therefore, it is usually divided into two seepage fields to study separately. The seepage in the formation exhibits planar radial seepage characteristics (Zone II), while the seepage in the fractures exhibits linear seepage characteristics (Zone I) (as shown in
Figure 4).
3.2. Transformation of Heterogeneity
In the heterogeneous space
O-XYZ, coordinate transformation is used to equivalently transform a permeability heterogeneous gas reservoir into a homogeneous gas reservoir.
The following non-uniform coordinate transformation is performed:
After coordinate transformation, the seepage problem in the heterogeneous space
O-XYZ is transformed into a problem in the homogeneous space
O-X1Y1Z1. At this point, in space
O-X1Y1Z1, the average permeability is
K1, the half-length of the fracture is
Lf1, the width of the fracture is
, the gas release radius is
, the gas reservoir thickness is
h1, and the wellbore radius is
.
After a coordinate transformation, the horizontal cross-section of the hydraulic fracturing wellbore in the
O-XYZ space has transitioned from a circle with a radius of
to an ellipse within the
O-X1Y1Z1 space, characterized by two semi-axes
and
. When the fluids near the wellbore reach a state of equilibrium, the wellbore radius is equal to the arithmetic mean of the major and minor semi-axes. Therefore, the wellbore diameter of the hydraulic fracturing well after the coordinate transformation is as follows:
3.3. Derivation of Production Capacity Model
Due to the hydraulic fracturing well’s flow field being composed of two distinct flow regimes, separate permeability models are established for the fractures and the reservoir formation. The coupling of these models yields the comprehensive productivity model for the entire hydraulic fracturing well.
3.3.1. Derivation of Seepage Model within the Formation
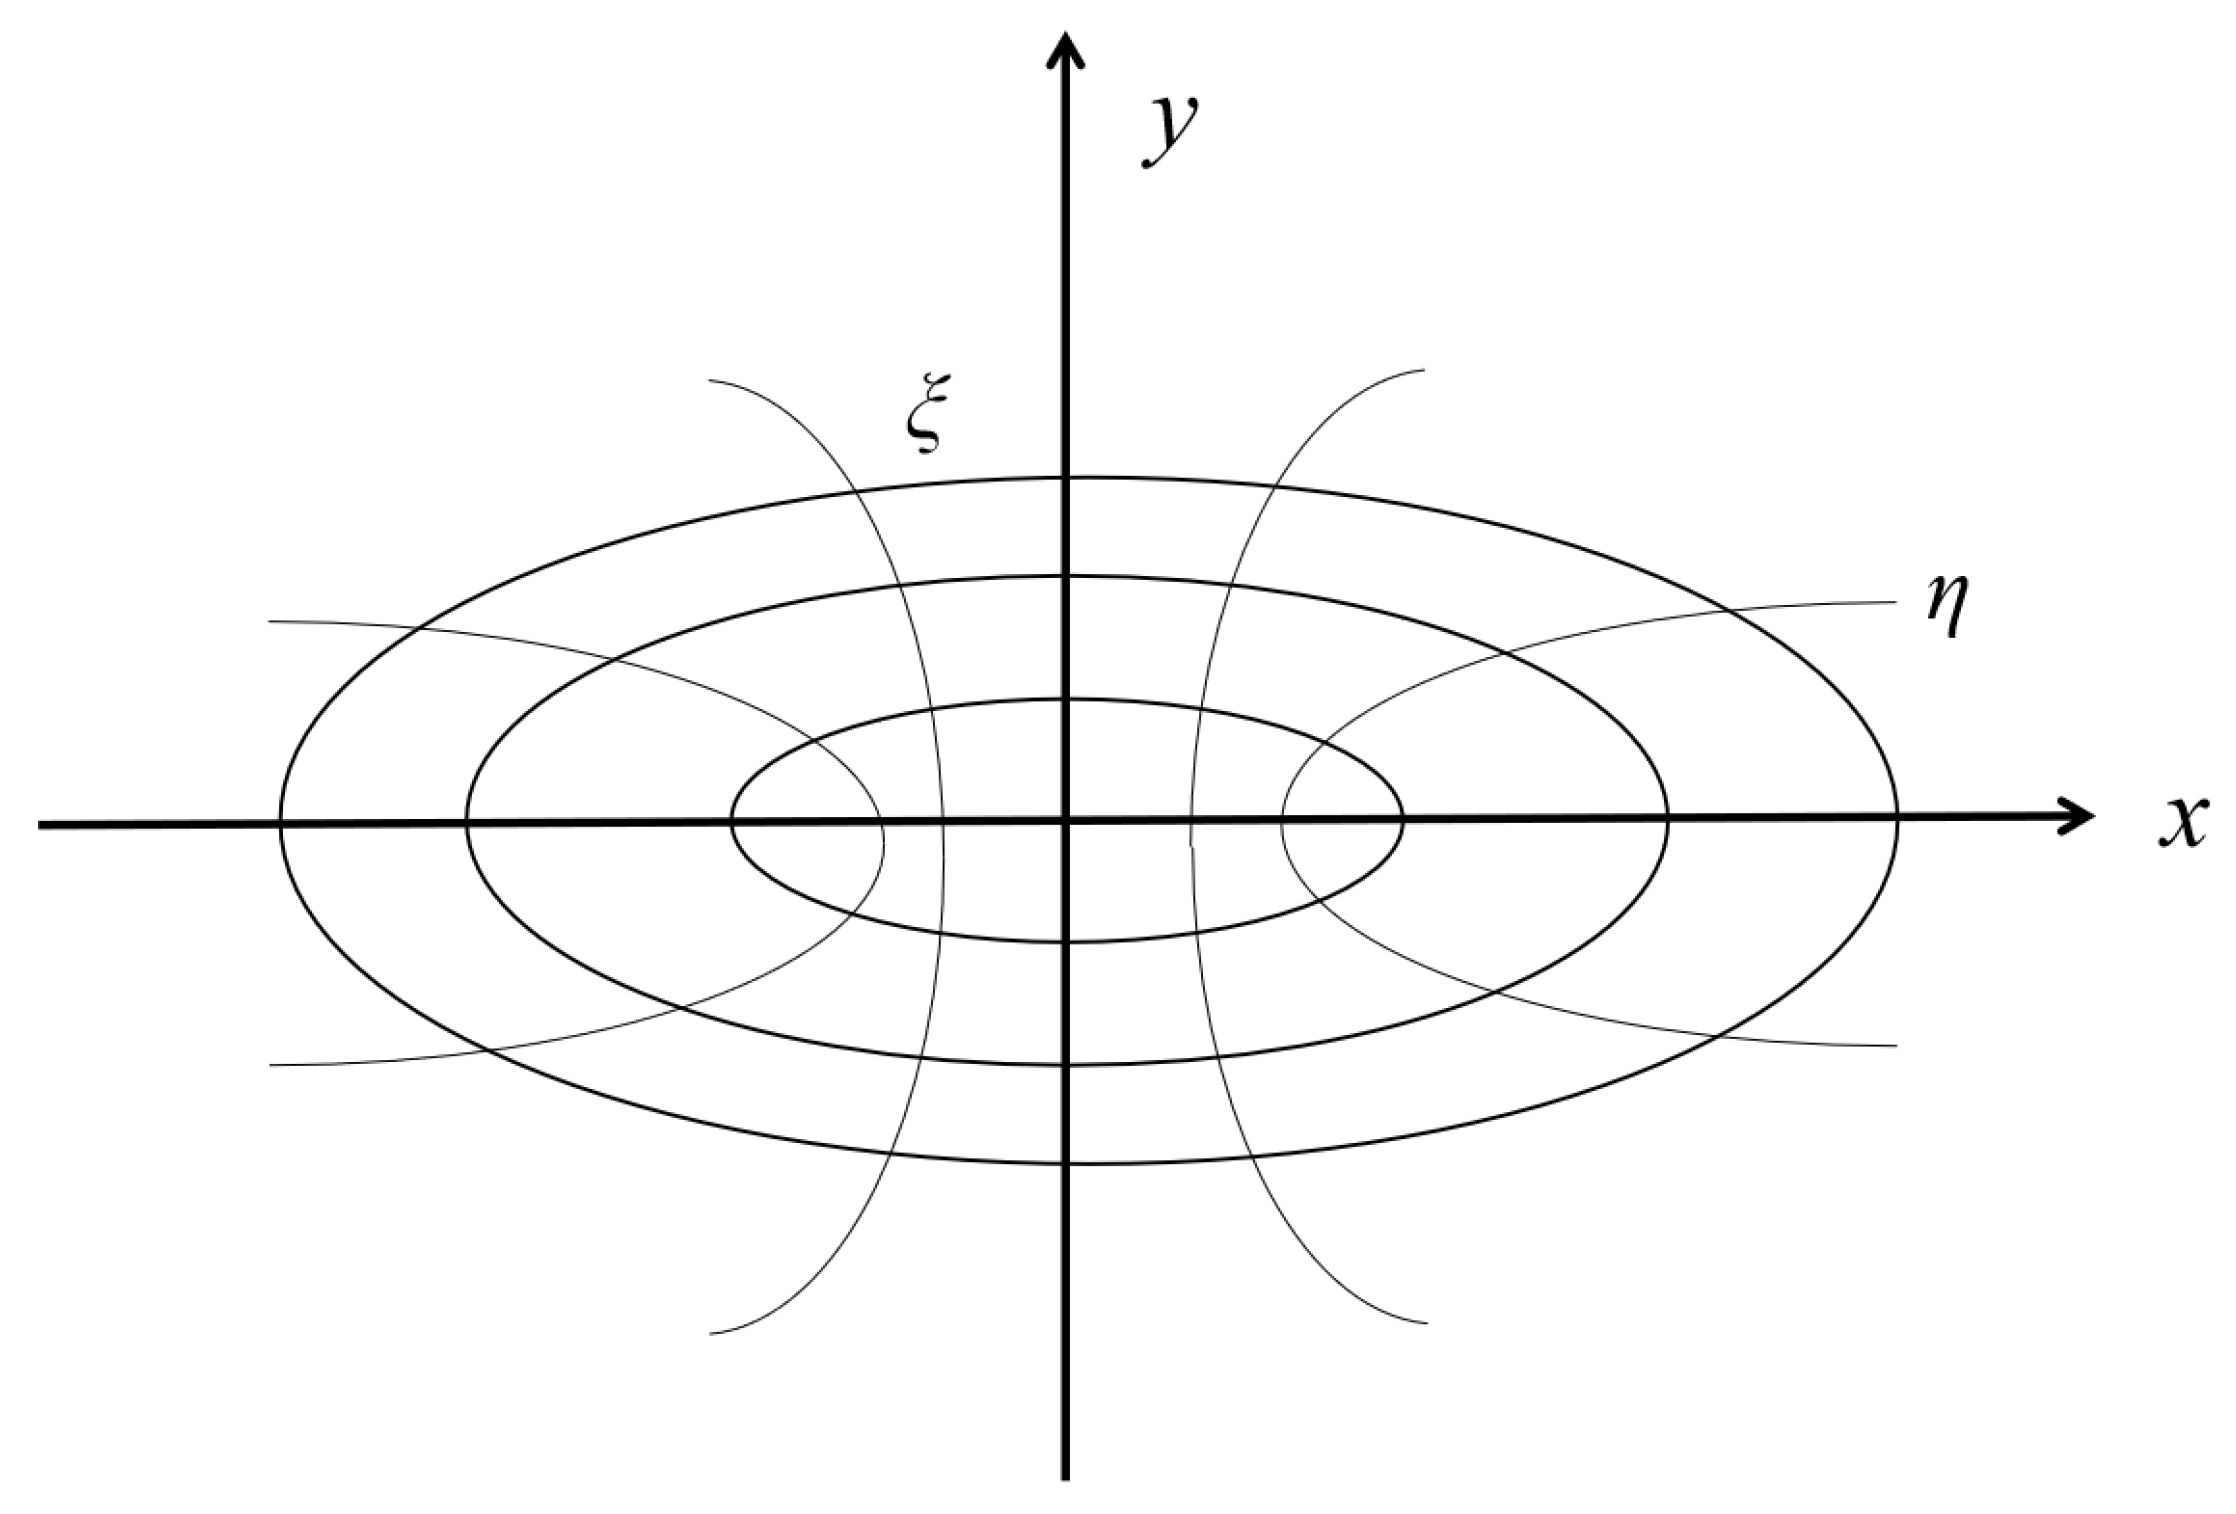
The external seepage field around the fractured vertical well is a cluster of elliptical curves (
Figure 5), and the seepage from the formation to the fracture is an elliptical seepage. The seepage characteristics can be described using the elliptical seepage law. The relationship between elliptical coordinates and the Cartesian coordinate system is as follows:
where
is the half-axis length of the elliptical seepage field, m;
is the short half-axis length of the elliptical seepage field, m.
The seepage field of elliptical seepage is usually described by a developing family of rectangles, so the average short half-axis is as follows:
The pressure gradient in the elliptical coordinate system is as follows:
In gas–water two-phase percolation, the continuity equations are as follows:
Water phase:
where
is the formation pressure, MPa;
is the radial radius, m;
is the viscosity of gas, MPa·s;
is the viscosity of water, MPa·s;
is the gas phase relative permeability, 10
−3 μm
3;
is the relative permeability of water phase, 10
−3 μm
3.
Considering the influence of water saturation on SS and the slippage effect, the permeability is revised as follows:
where
is the average formation pressure, MPa.
The simultaneous solution of Equations (13)–(15) gives the following equations:
Oil and gas fluids can only flow when the pressure gradient is greater than a critical value, which is used as the TPG. As the water saturation increases, the TPG of the core also increases. There is an exponential relationship between the TPG and the water saturation:
where
is the fitting coefficient parameter of the TPG and
is the fitting base parameter of the TPG.
Therefore, on the basis of considering the influence of water saturation on the gas TPG, gas phase permeability, and SS effect, the gas–water two-phase flow equation considering the SS effect, gas slip effect, and TPG can be modified as follows:
The simultaneous solution of Equations (19) and (20) gives the following equation:
The definition of two-phase pseudo-pressure within the reservoir is as follows:
The definition of two-phase pseudo-threshold pressure is as follows:
The volumetric flow rate ratio of water to gas in a two-phase system is formally defined as the water–gas ratio (WRG). There is the following equation:
Integrating the equation resulting from the combination of Equations (21)–(24) results in the following equation:
where
is the pressure at the crack tip, MPa;
is the pressure at present formation, MPa.
3.3.2. Derivation of Seepage Model within Cracks
In the fractures, considering the presence of the wellbore, both gas and water exhibit relatively high flow velocities, especially with a more pronounced non-Darcy flow characteristic in the gas phase, while the water phase still demonstrates Darcy flow characteristics. Consequently, within the fractures, the equations governing the motion of gas and water phases are as follows:
Water phase:
where
r is the cracks in linear seepage distance, m;
is the absolute permeability of the crack, mD;
is the gas turbulence factor, m
−1;
is the gas flow rate in the crack, m/d;
is the water phase flow rate in the crack, m/d;
is the relative permeability of the gas phase under gas–water two-phase seepage conditions in the fracture;
is the relative permeability of the water phase under gas–water two-phase seepage conditions in the fracture;
is the crack width, m; and
is the fracture height, m.
Under conditions where different proppants are used, the
a and
b values are as shown in
Table 1.
Considering the effect of water saturation on SS,
where
is the crack initial permeability, mD;
is the coefficient of water saturation on SS parameters;
is the index of water saturation on SS of the system parameters.
In conclusion, it can be concluded that during the linear flow phase in fractures, gas exhibits stress sensitivity and high-speed non-Darcy flow characteristics in hydraulic fracturing wellbore flow equations as follows:
The simultaneous solution of Equations (29) and (30) gives the following equation:
The definition of two-phase pseudo-pressure within the fracture is as follows:
Integrating the equation resulting from the combination of Equations (31) and (32) results in the following equation:
where
is the pressure at the crack tip, MPa;
is the bottom-hole pressure, MPa;
is the fracture half-length, m; and
is the wellbore radius, m.
3.3.3. Establishment of Productivity Equation for Fractured Vertical Wells
The process of fluid production within the formation is the outcome of a sequential gas supply mechanism connecting the permeable reservoir matrix’s flow field with the linear flow field within fractures. As the fluid flow rates in these two flow fields are equal, the simultaneous combination of Equations (25) and (33) results in a multifactor-based prediction equation for the production capacity of hydraulically fractured vertical wells.
3.4. Case Calculation
A fractured well in a tight sandstone water-bearing gas reservoir was treated with large-scale sand fracturing. The proppant type of the fractured well was 70/140 mesh quartz sand mixed with 40/70 mesh coated sand. The original formation pressure was 50 MPa, the discharge radius of the gas reservoir was 200 m, the bottom-hole pressure was 25 MPa, the slip-off factor was 0.5, the formation water salinity was 1.06, the reservoir thickness was 20 m, the water density was 1 g/cm3, the water viscosity was 1 mPa·s, the formation temperature was 340 K, the fracture width was 0.008 m, the half-length of the fracture was 106.2 m, and the absolute fracture permeability was 50 D.
It is known that the WRG at the beginning of production is 1.0 m
3/10
4 m
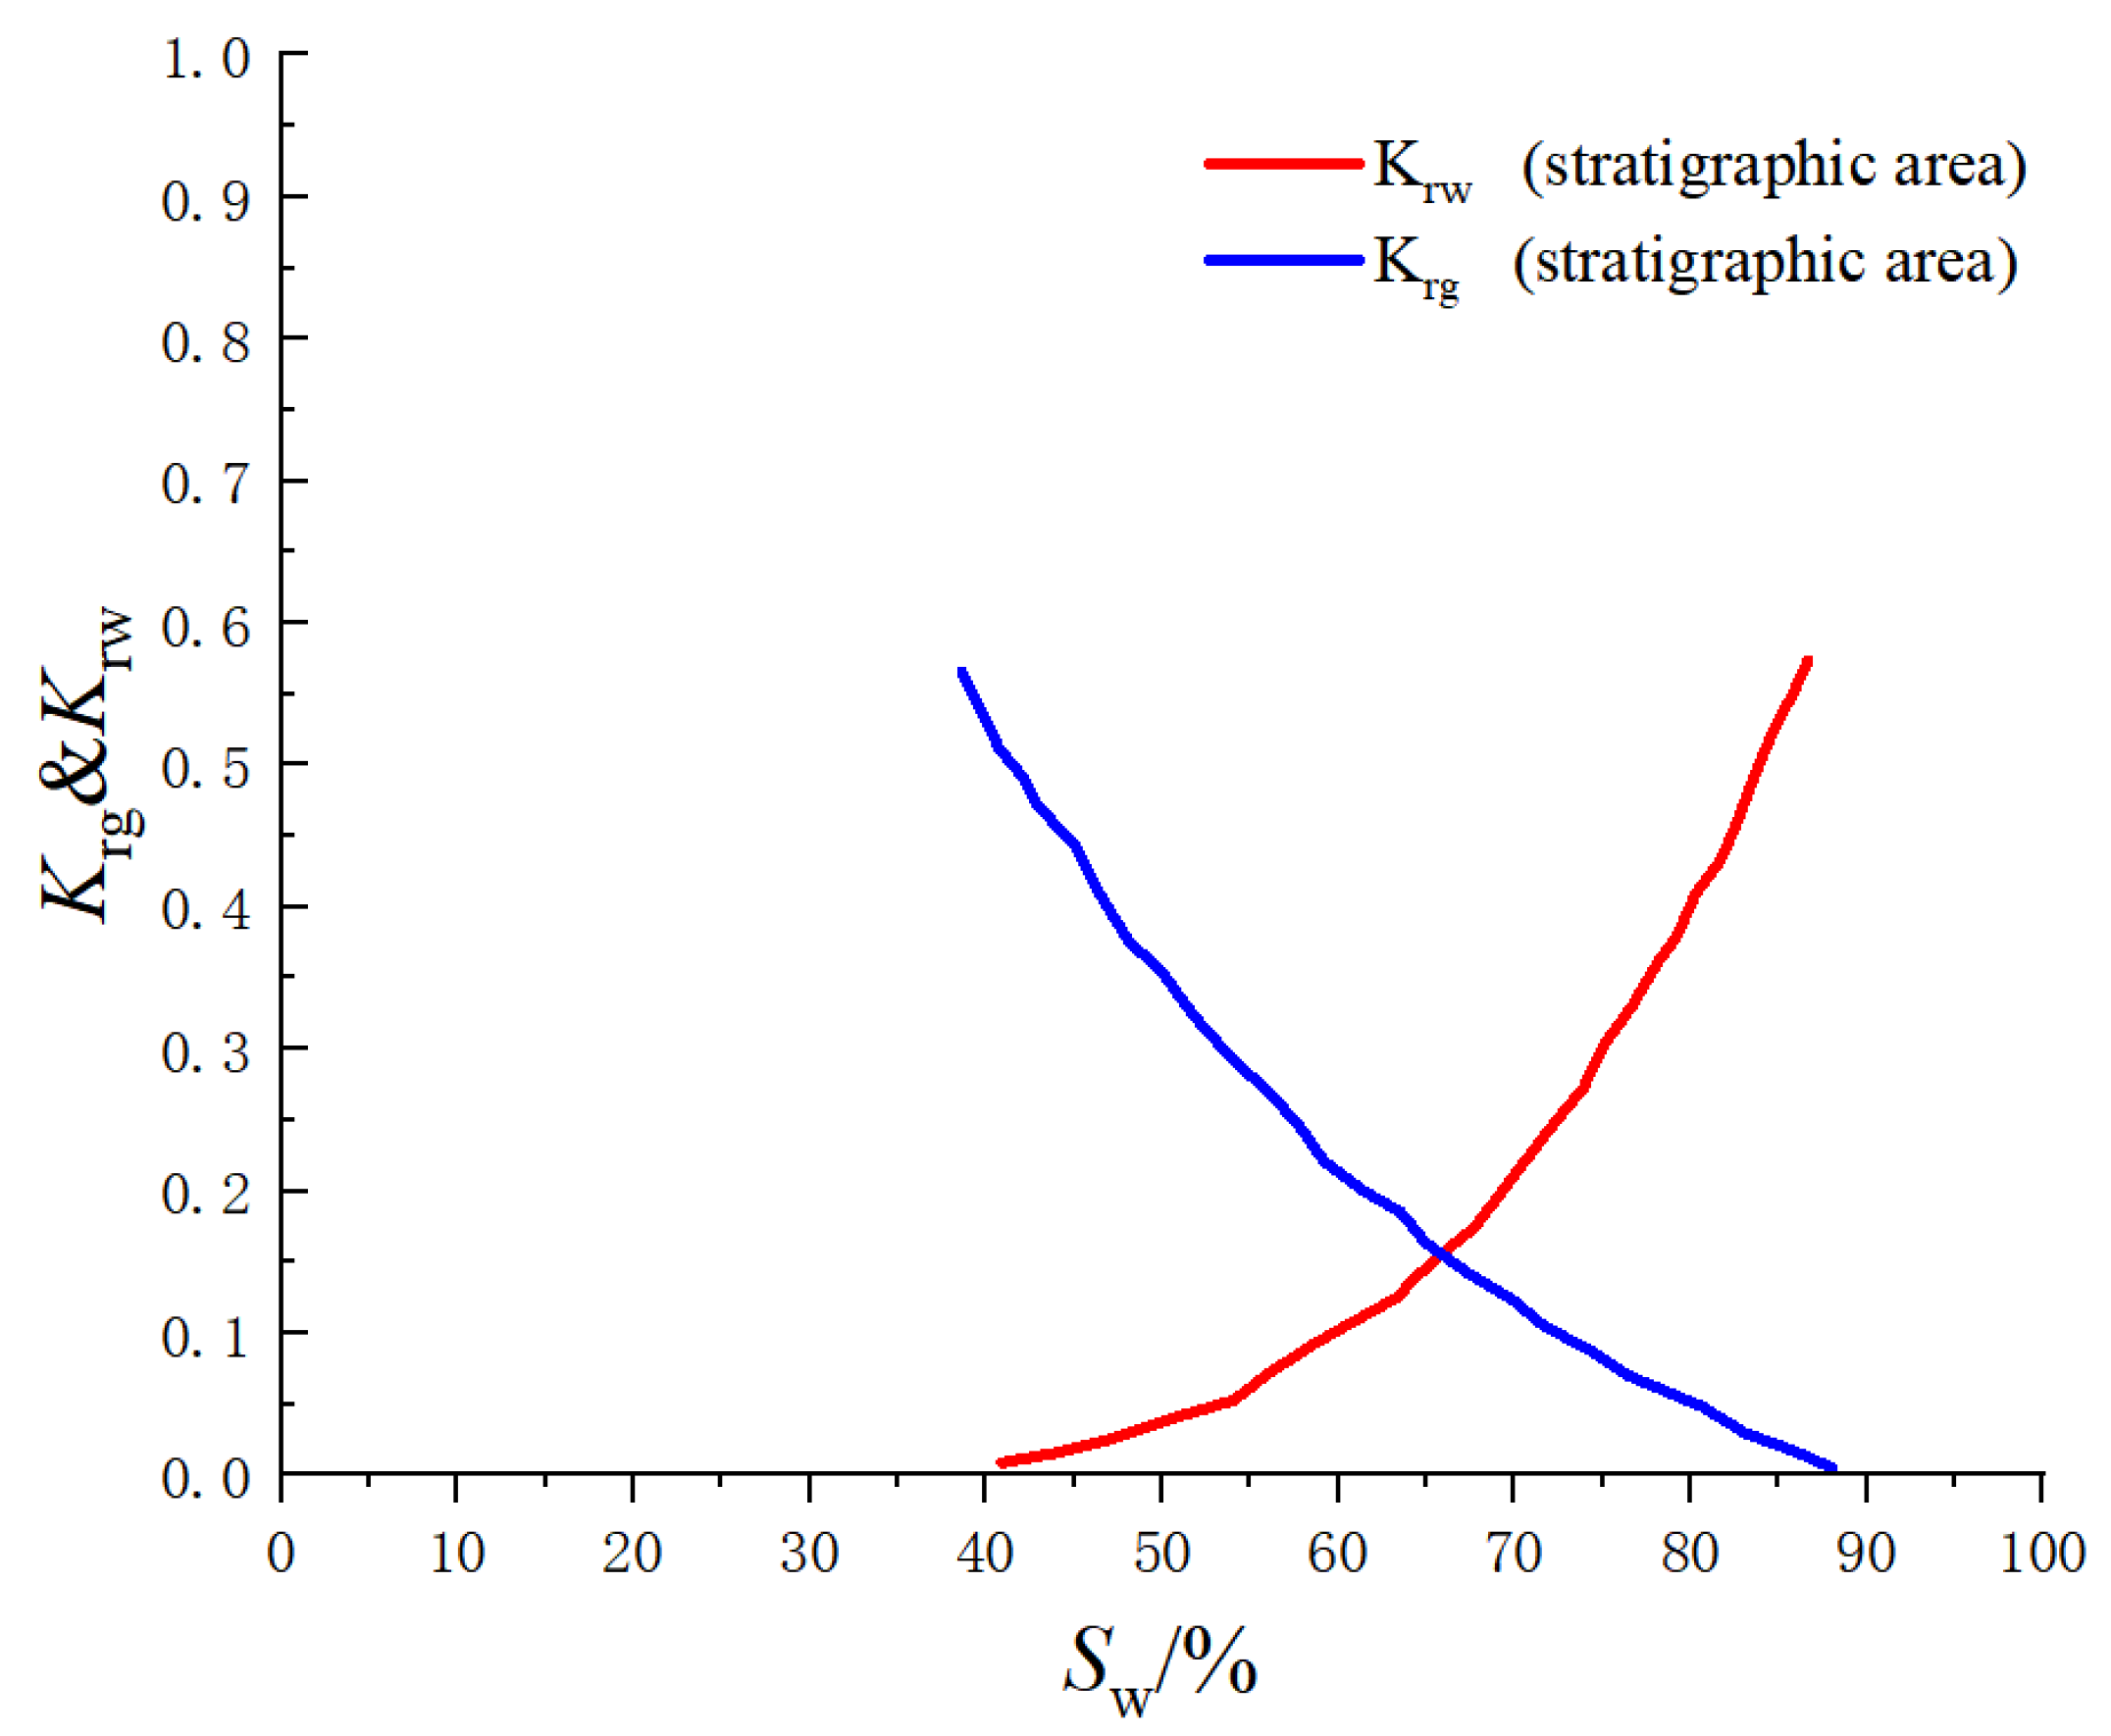
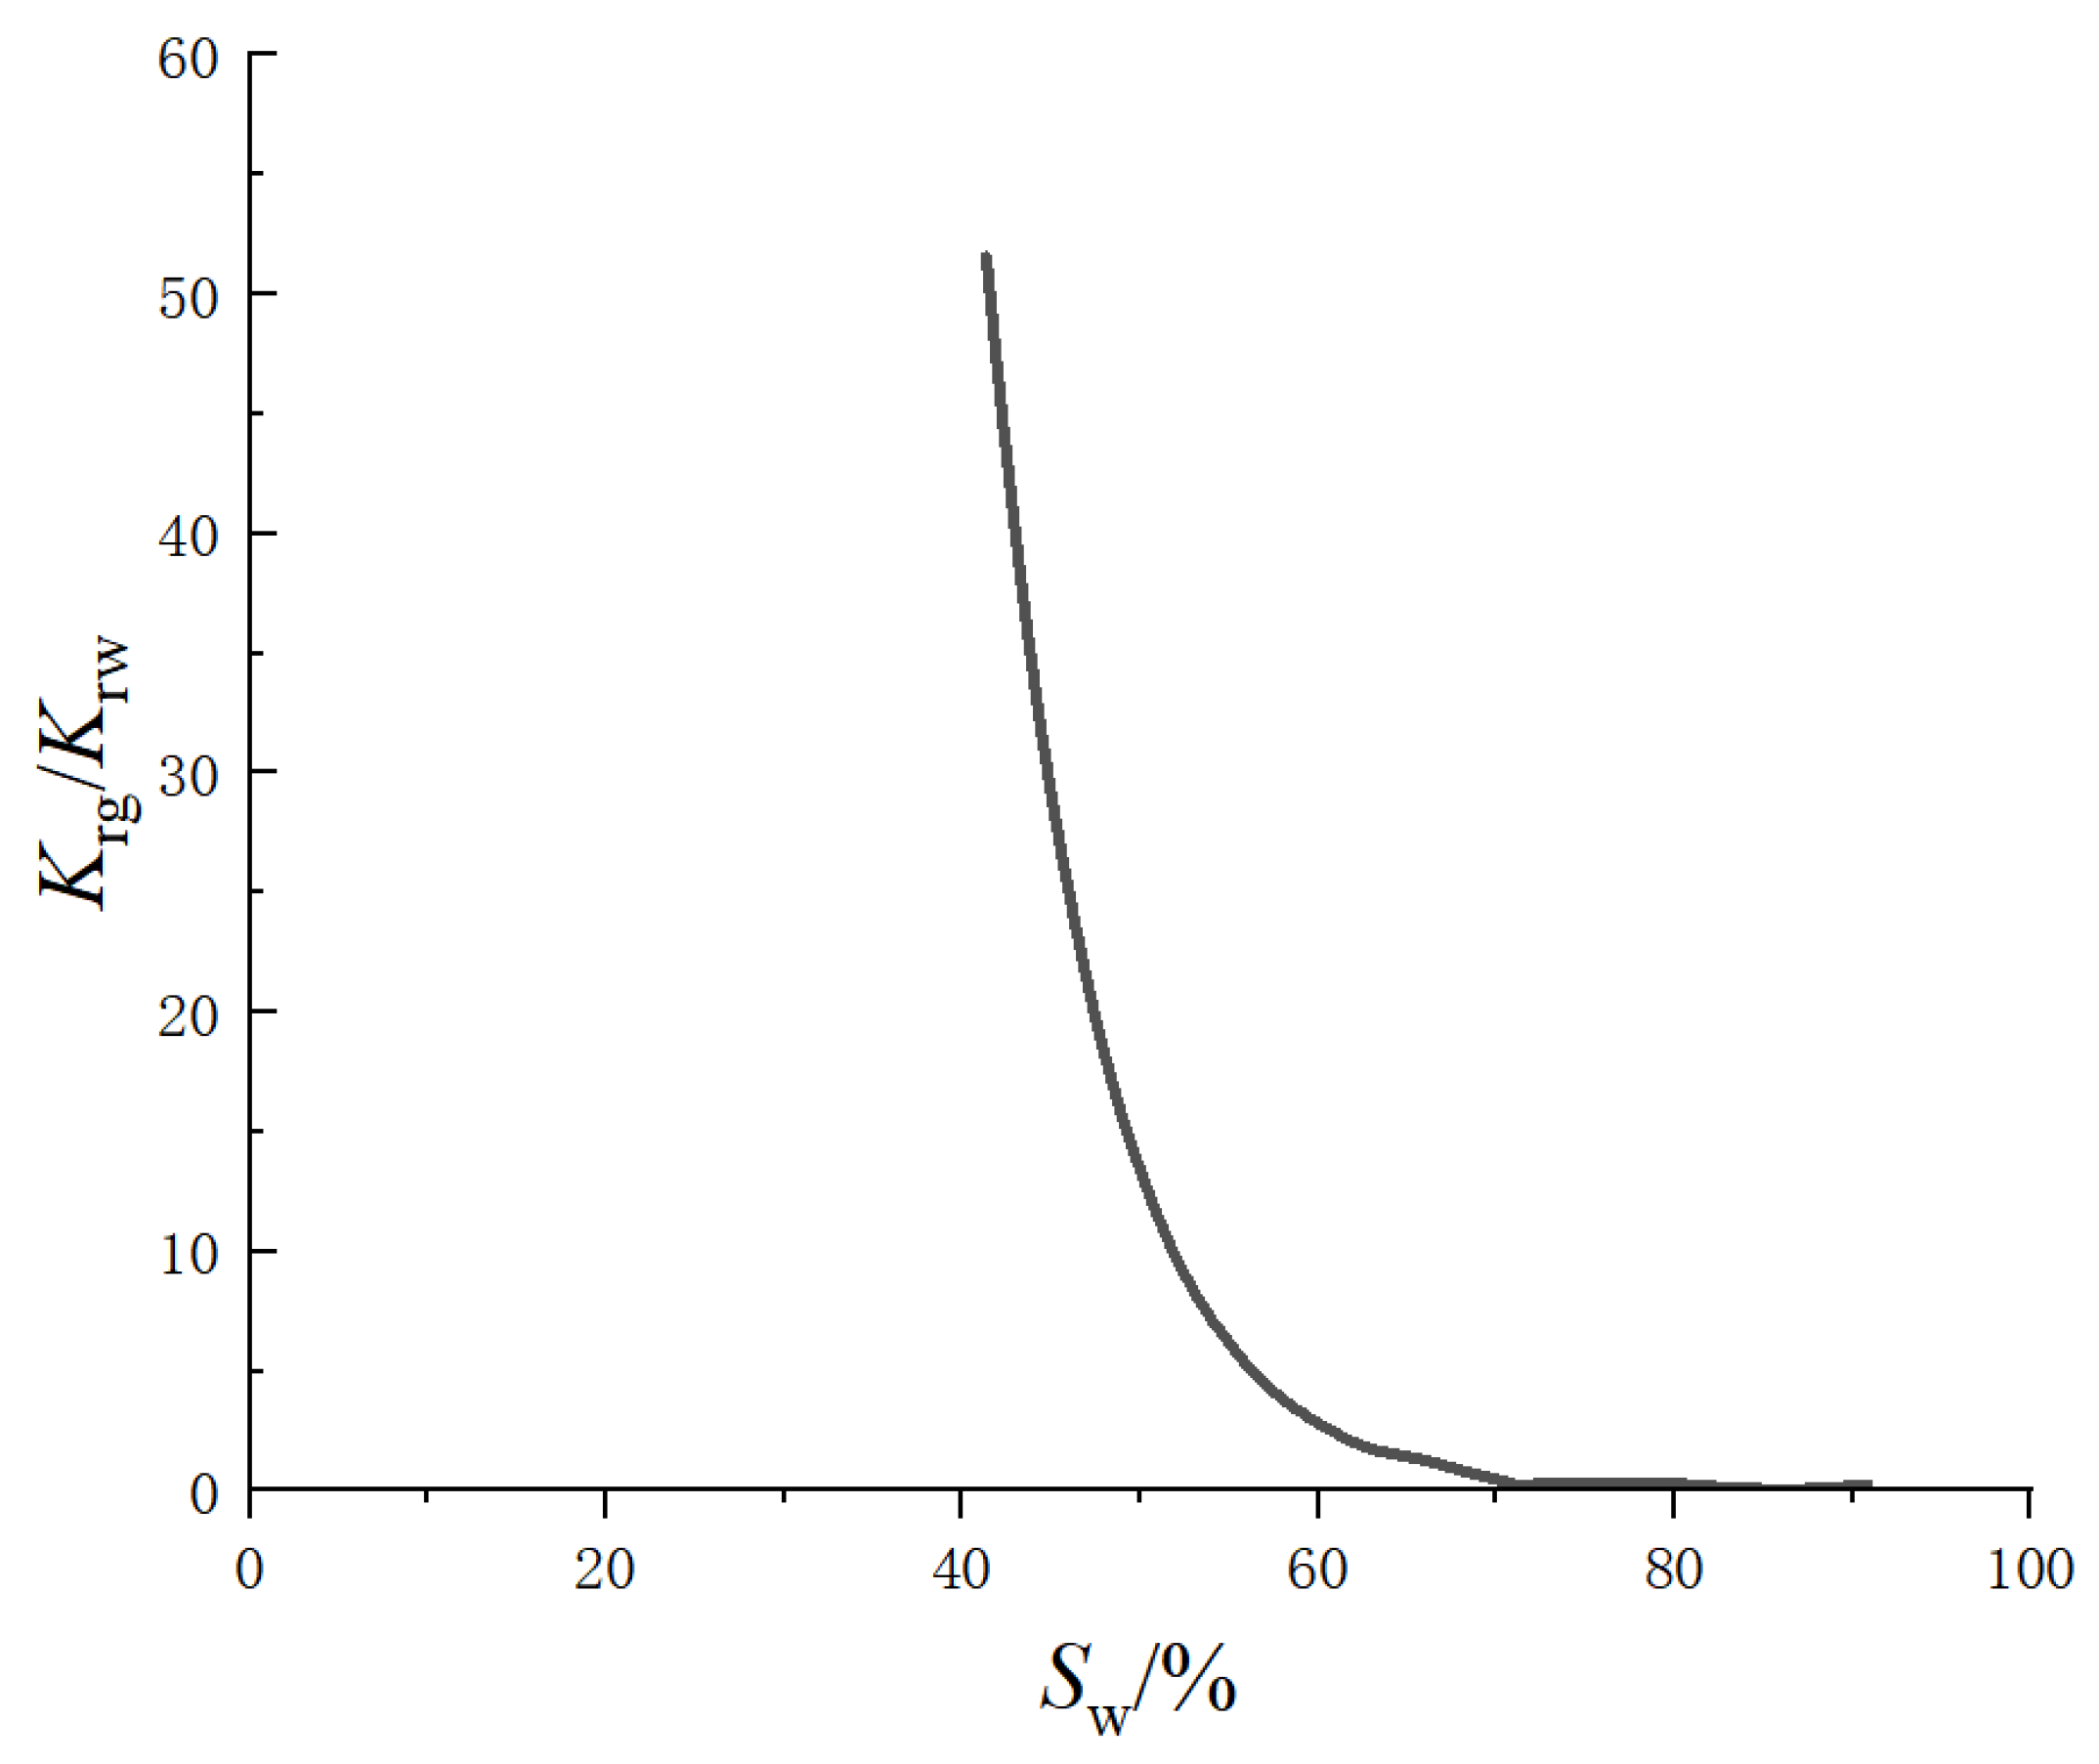
3, and the relative permeability ratio of the gas and water phases is calculated to be 1.2208; by comparing
Figure 6 and
Figure 7, it can be seen that the water saturation is 65%. The gas phase relative permeability
in the formation is 0.18, the water phase relative permeability
in the formation is 0.2, the gas phase relative permeability in the fracture is 0.3, and the water phase relative permeability in the fracture is 0.6 according to
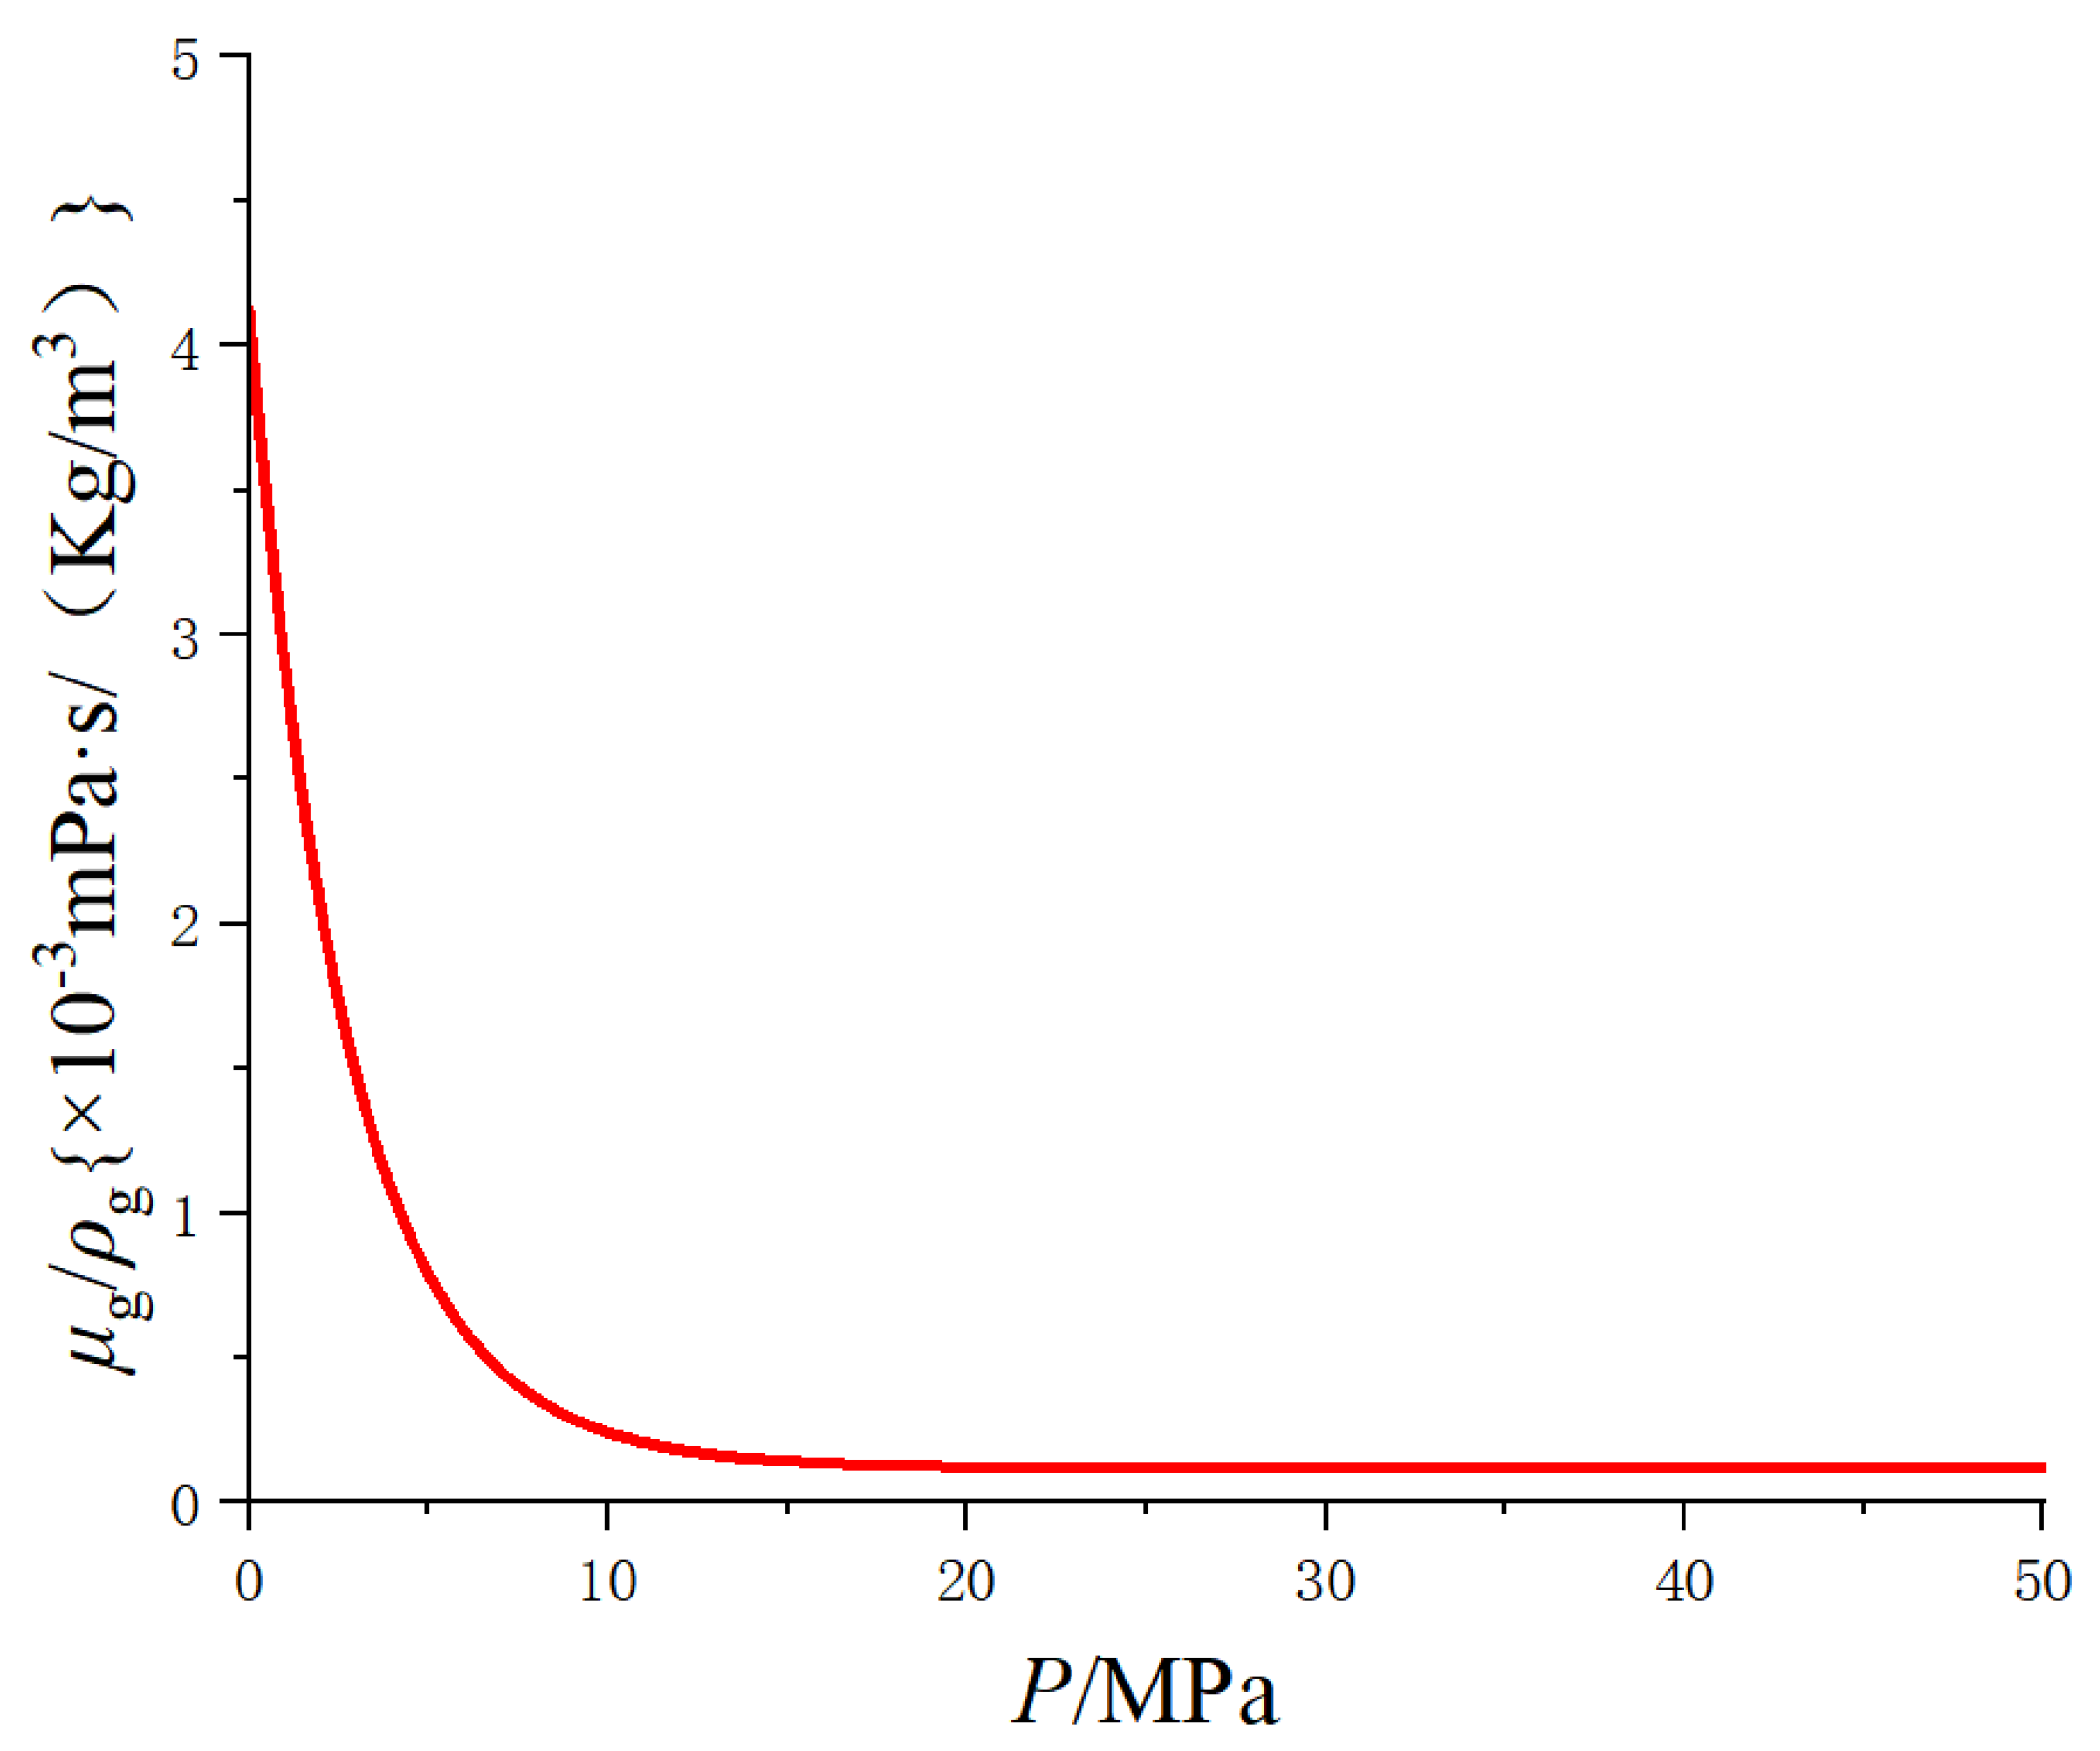
Figure 8. Considering
Figure 9, the corresponding gas viscosity and density under different pressure conditions can be obtained. By substituting different bottom-hole flow pressures into the productivity equation established in this paper for a dense hydraulic fracturing straight well, the corresponding gas production can be obtained. Finally, the inflow performance relationship (IPR) curve of gas–water two-phase flow obtained by different calculation methods can be obtained.
Generally, the way to obtain the gas-water relative permeability curve is a laboratory test, but the diversity of the obtained gas-water relative permeability curve mainly depends on the reservoir permeability. For this reason, firstly, the gas-water relative permeability curve is unified according to different permeability levels, and the gas-water relative permeability curve of the target gas field with certain representativeness is obtained as shown in the figure.
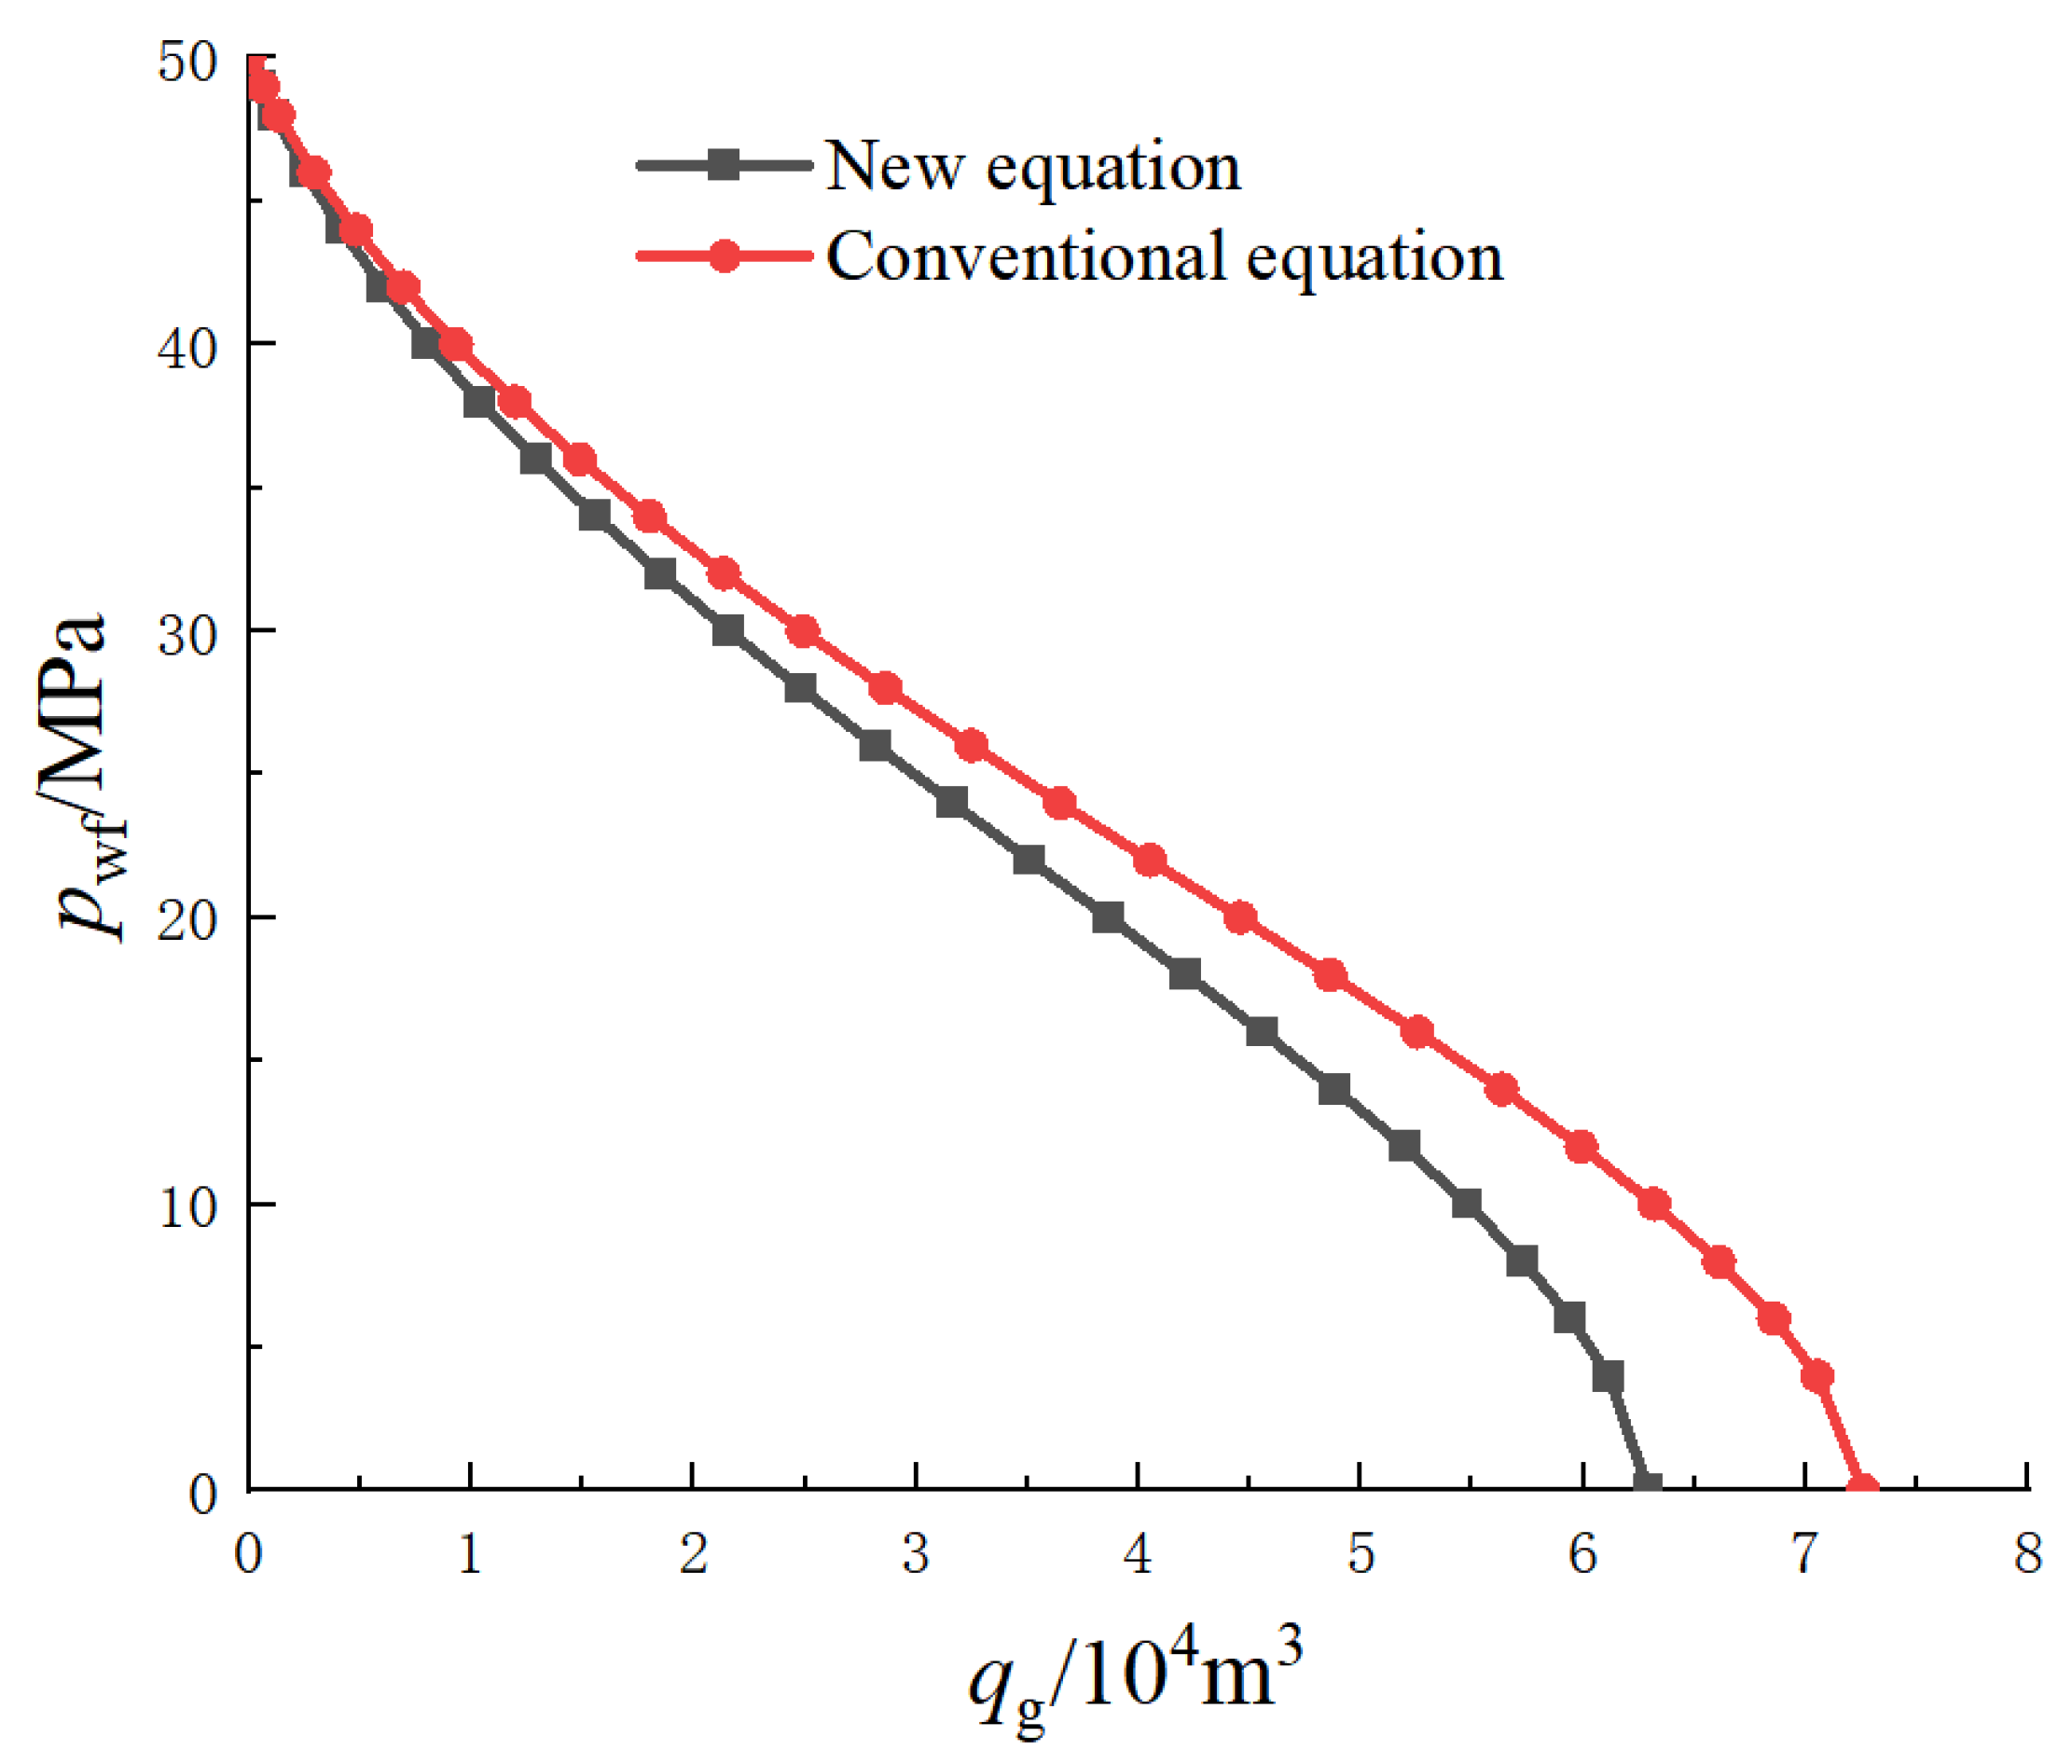
According to the data, the absolute open flow of the well in the stable well test is 60,300 m
3/day, as can be seen from
Figure 10, the open flow obtained by using the conventional equation is 72,500 m
3/day, and the open flow calculated by using the new equation is 62,900 m
3/day. The results show that the calculated productivity of the model presented in this paper is closer to that of the actual gas well, and the model presented in this paper is more accurate and reliable than the existing model.
4. Analysis of Influencing Factors
4.1. Influence of Formation Thickness on Gas Well Productivity
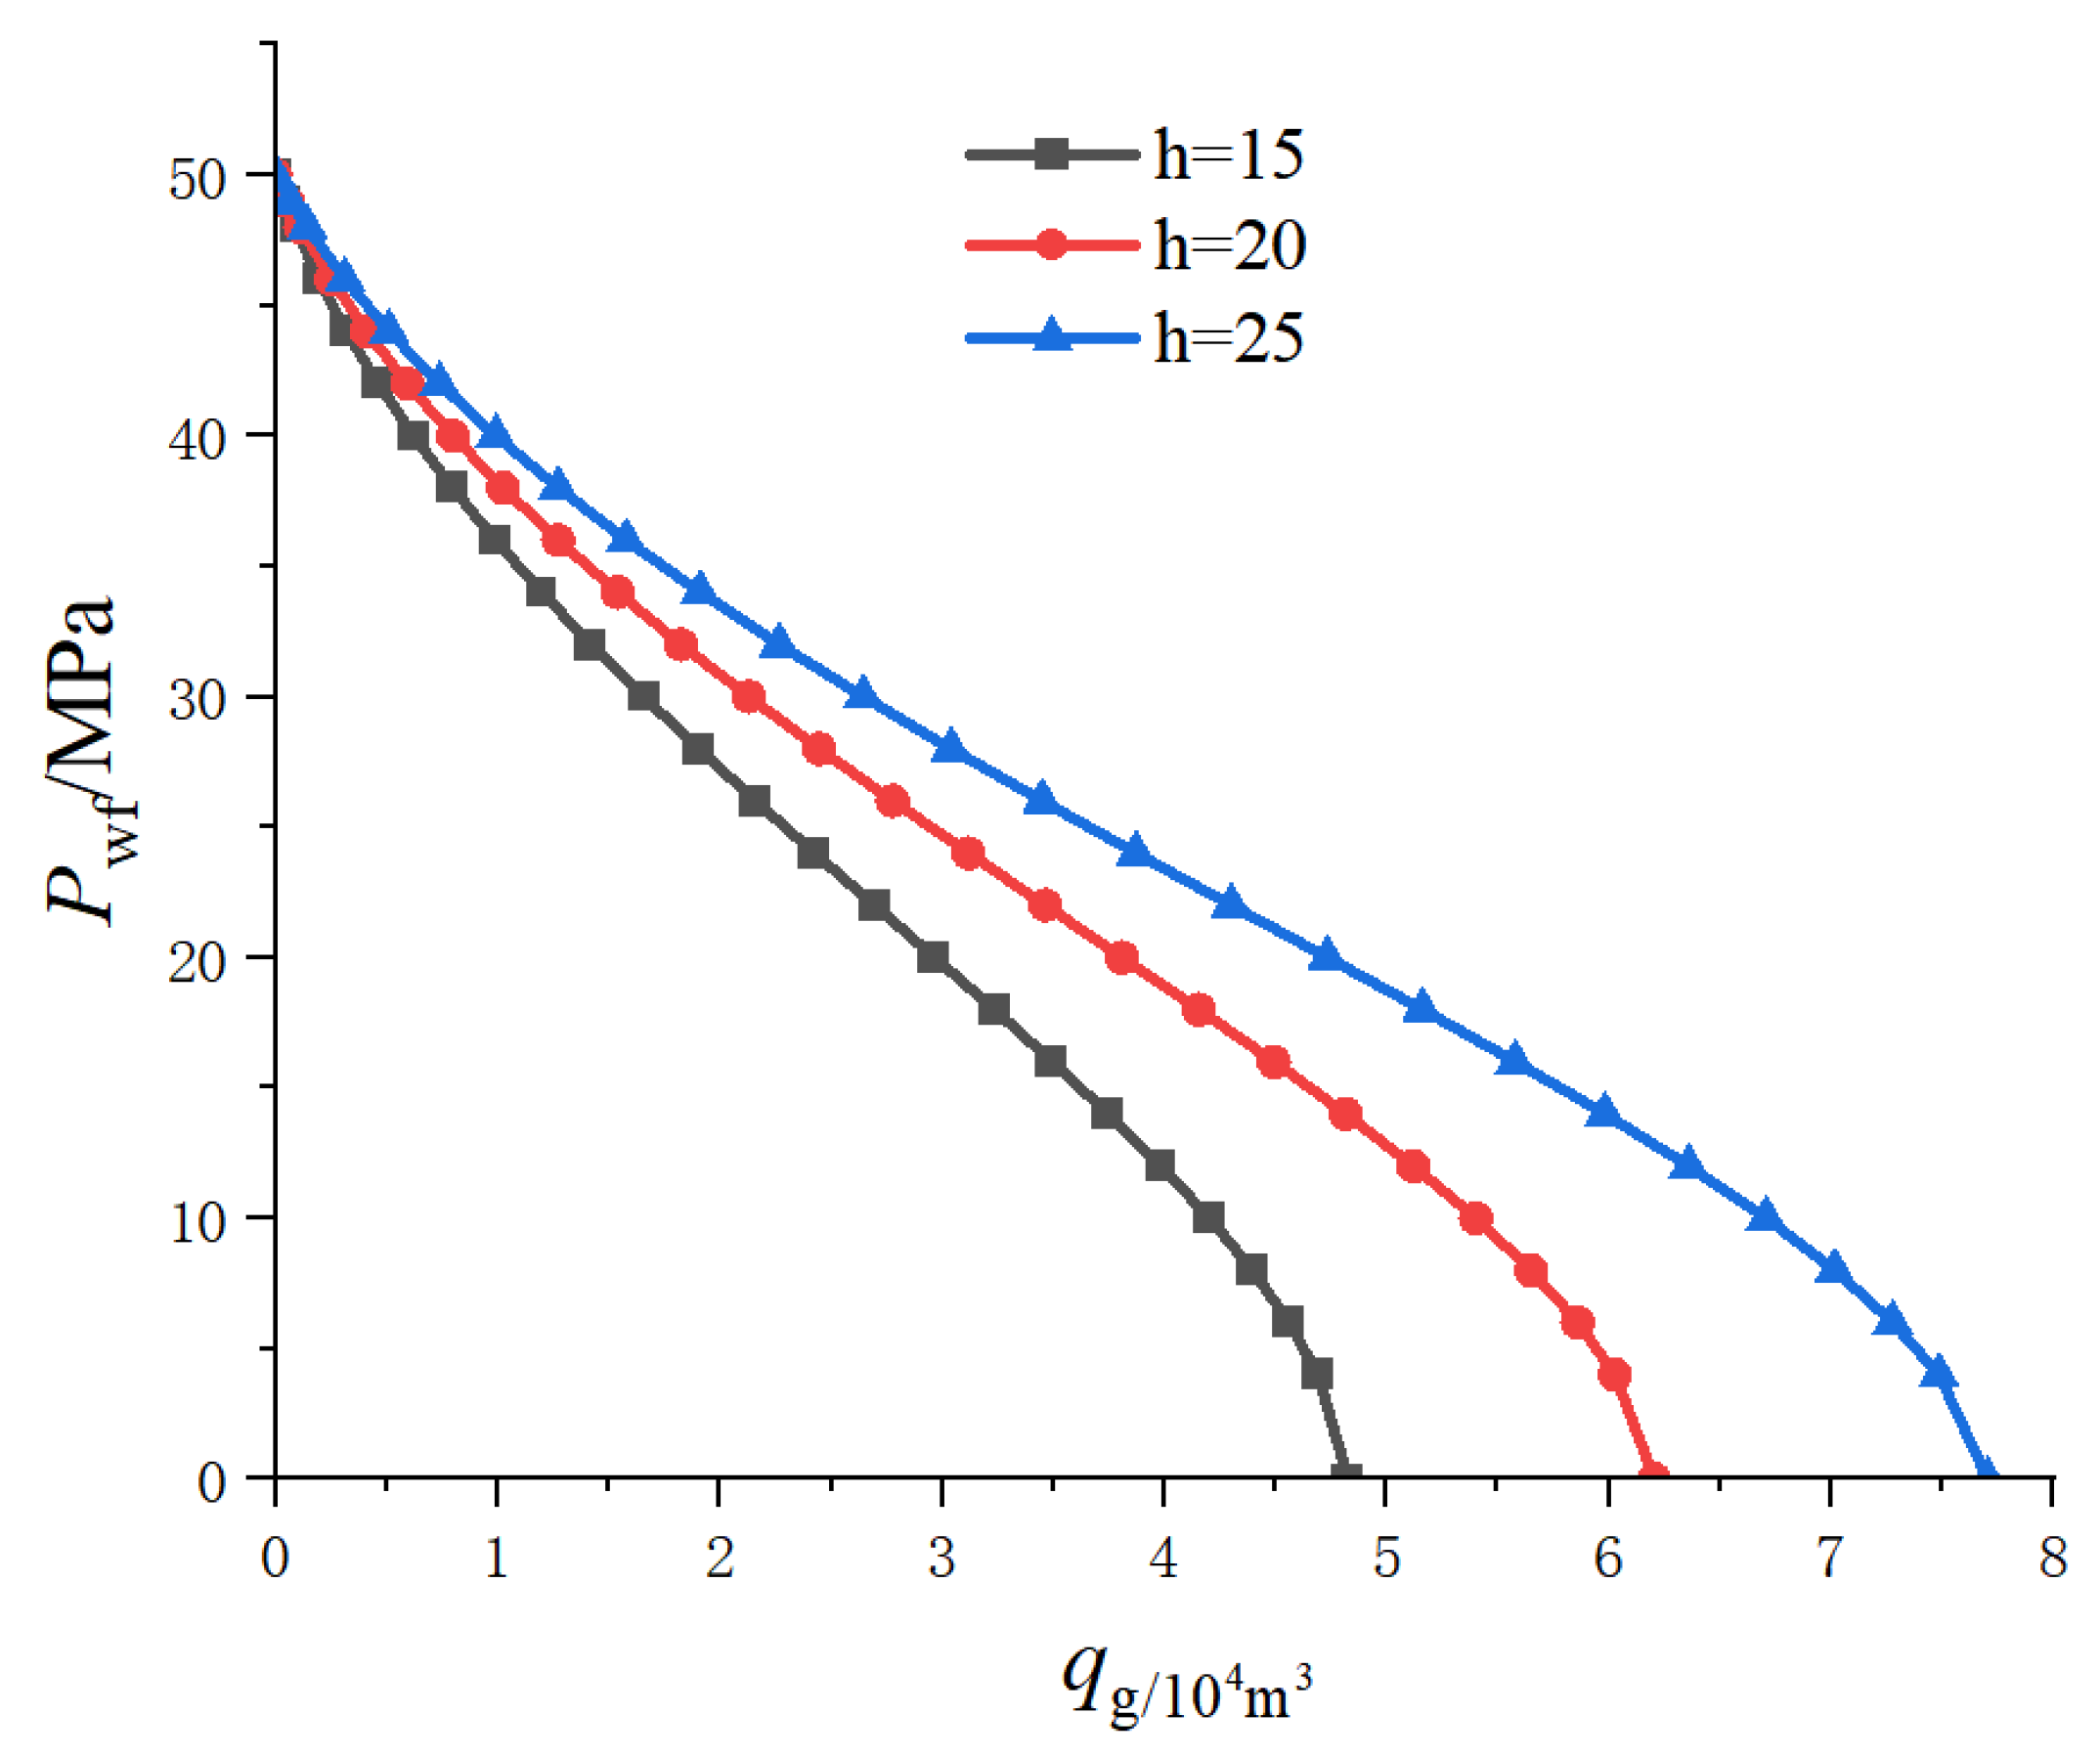
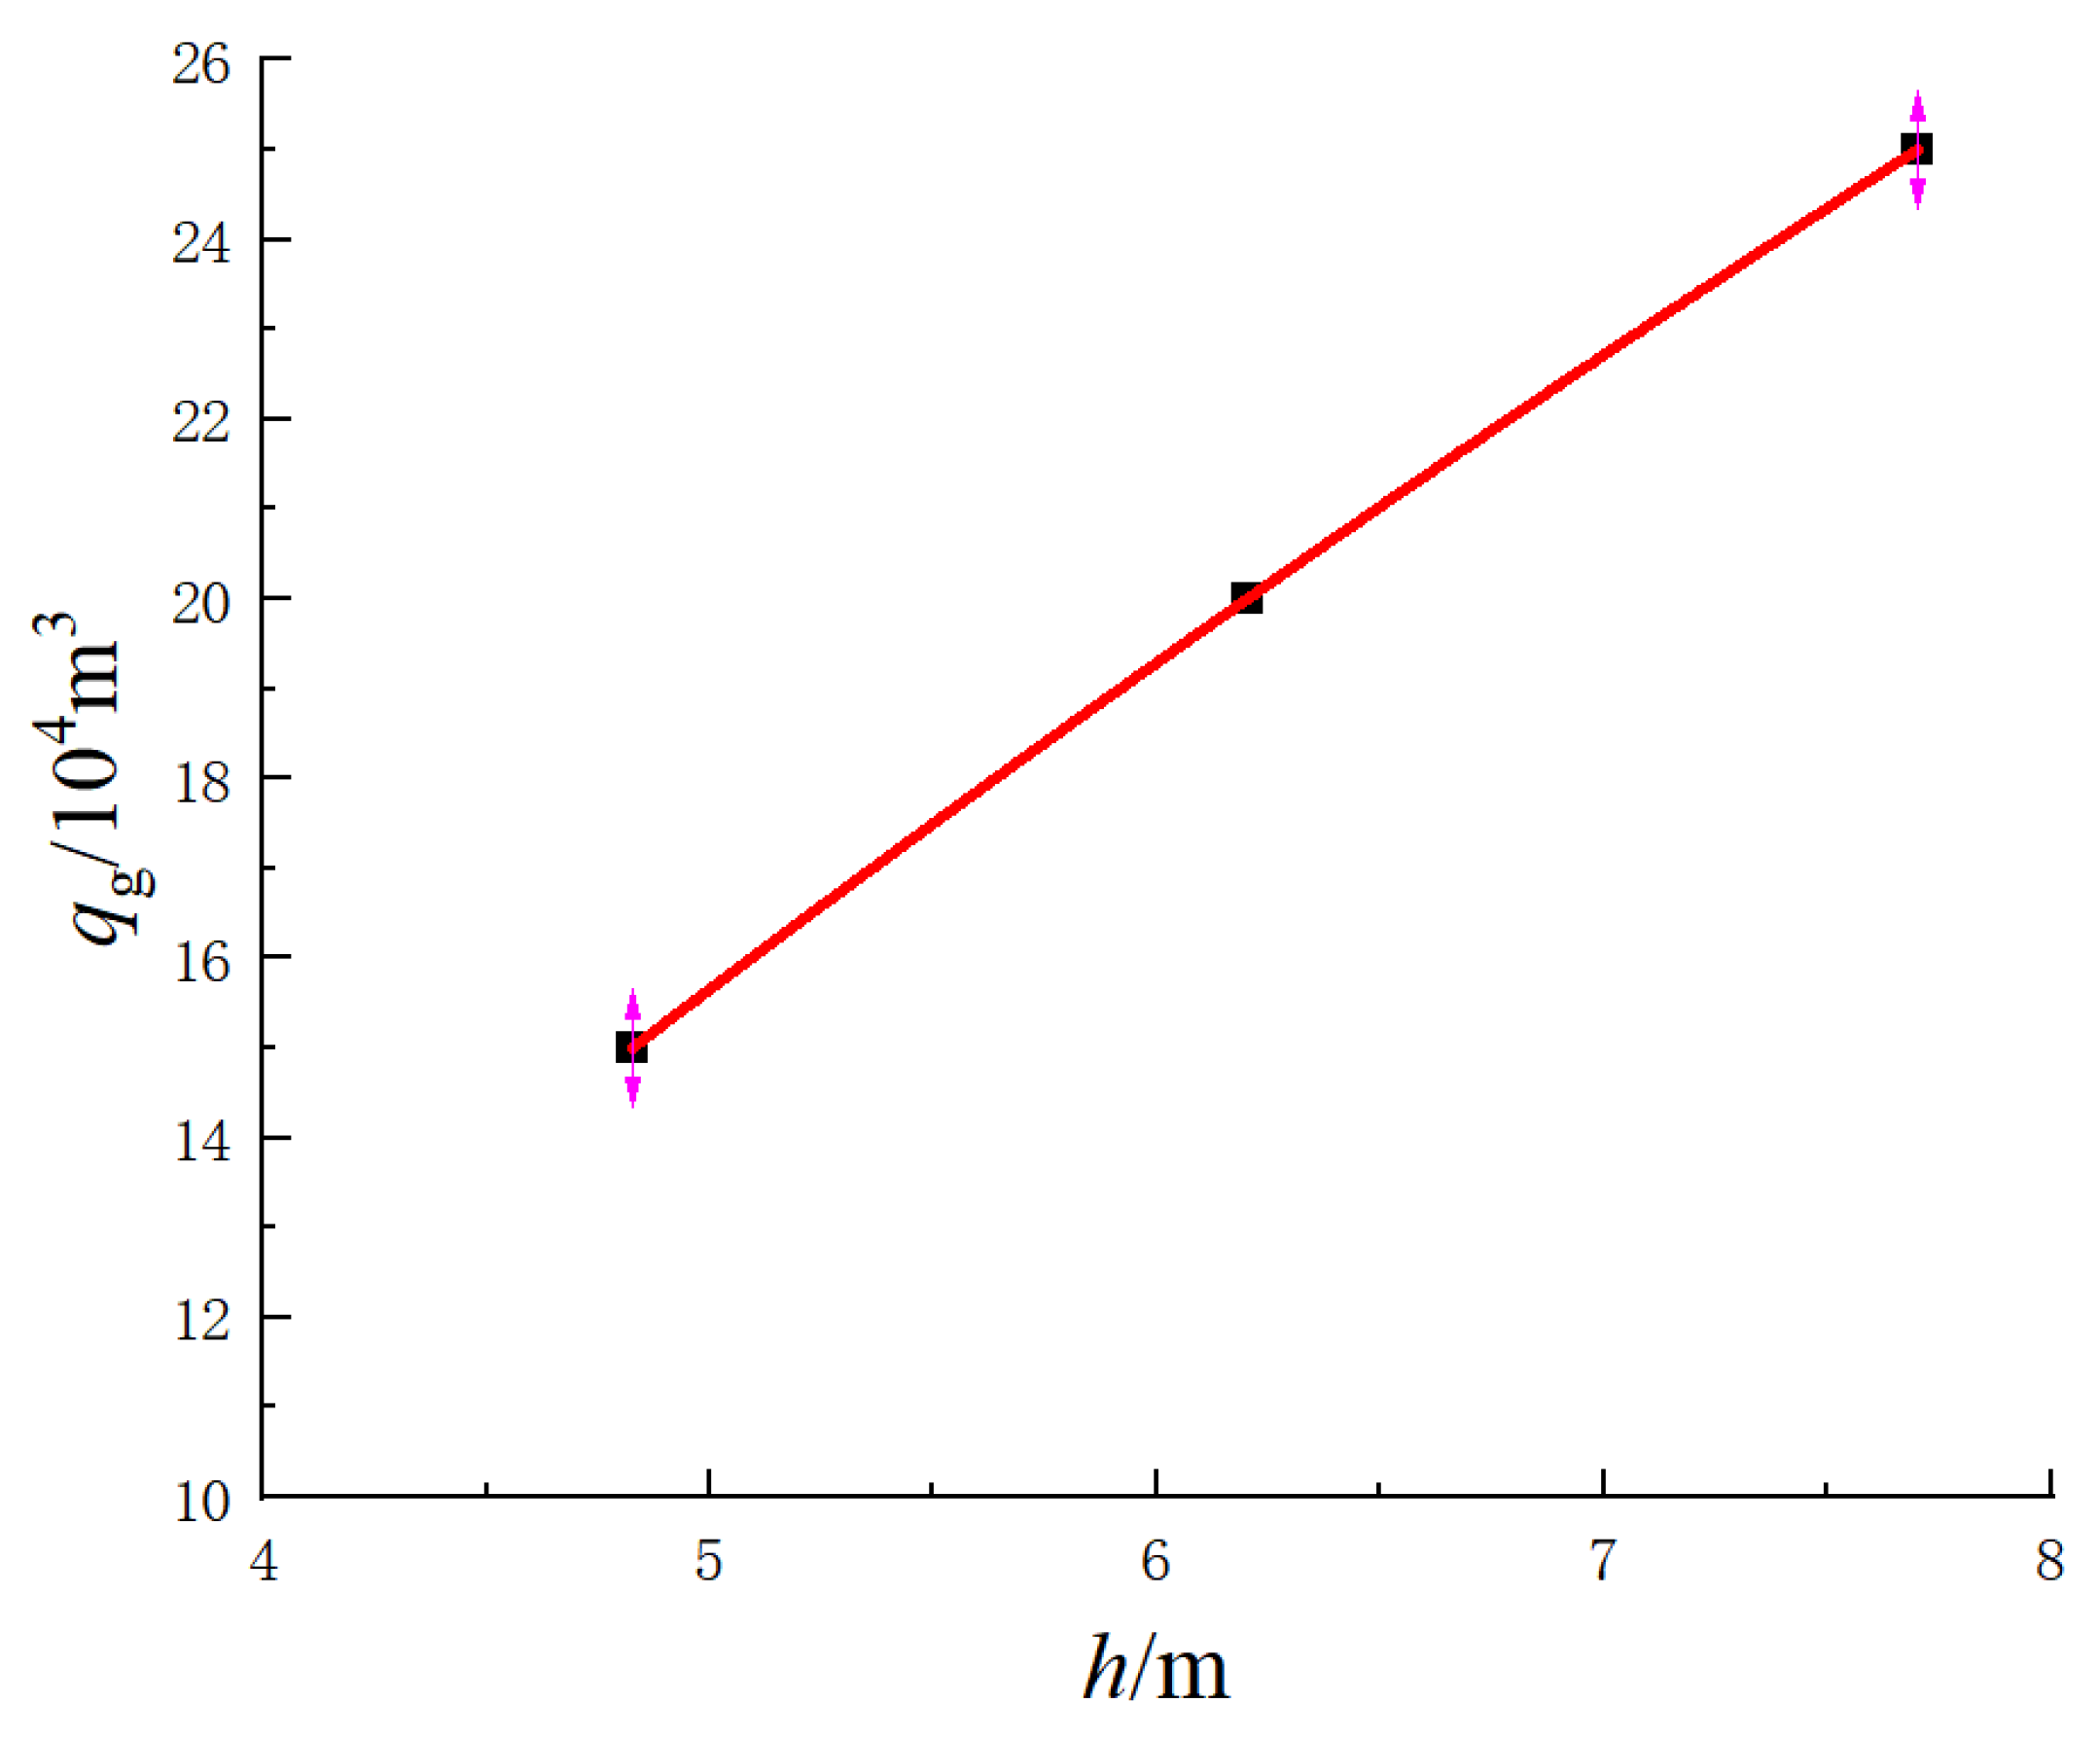
With all other parameters held constant, the gas reservoir thickness is set to 15 m, 20 m, and 25 m for the fractured gas well, and the corresponding IPR curves are shown in
Figure 11. From the figure, it can be observed that as the reservoir thickness increases, the productivity of the fractured gas well also increases, as indicated by the trend in
Figure 12. As the reservoir thickness increases, the IPR curve of the fractured gas well gradually shifts to the right. The model presented in this paper assumes that the fracture height is the same as the gas reservoir height. Therefore, with the increase in reservoir thickness, the height of the fracture also increases accordingly, leading to increased contact area between the fracture and the reservoir, consequently enhancing the productivity of the fractured gas well.
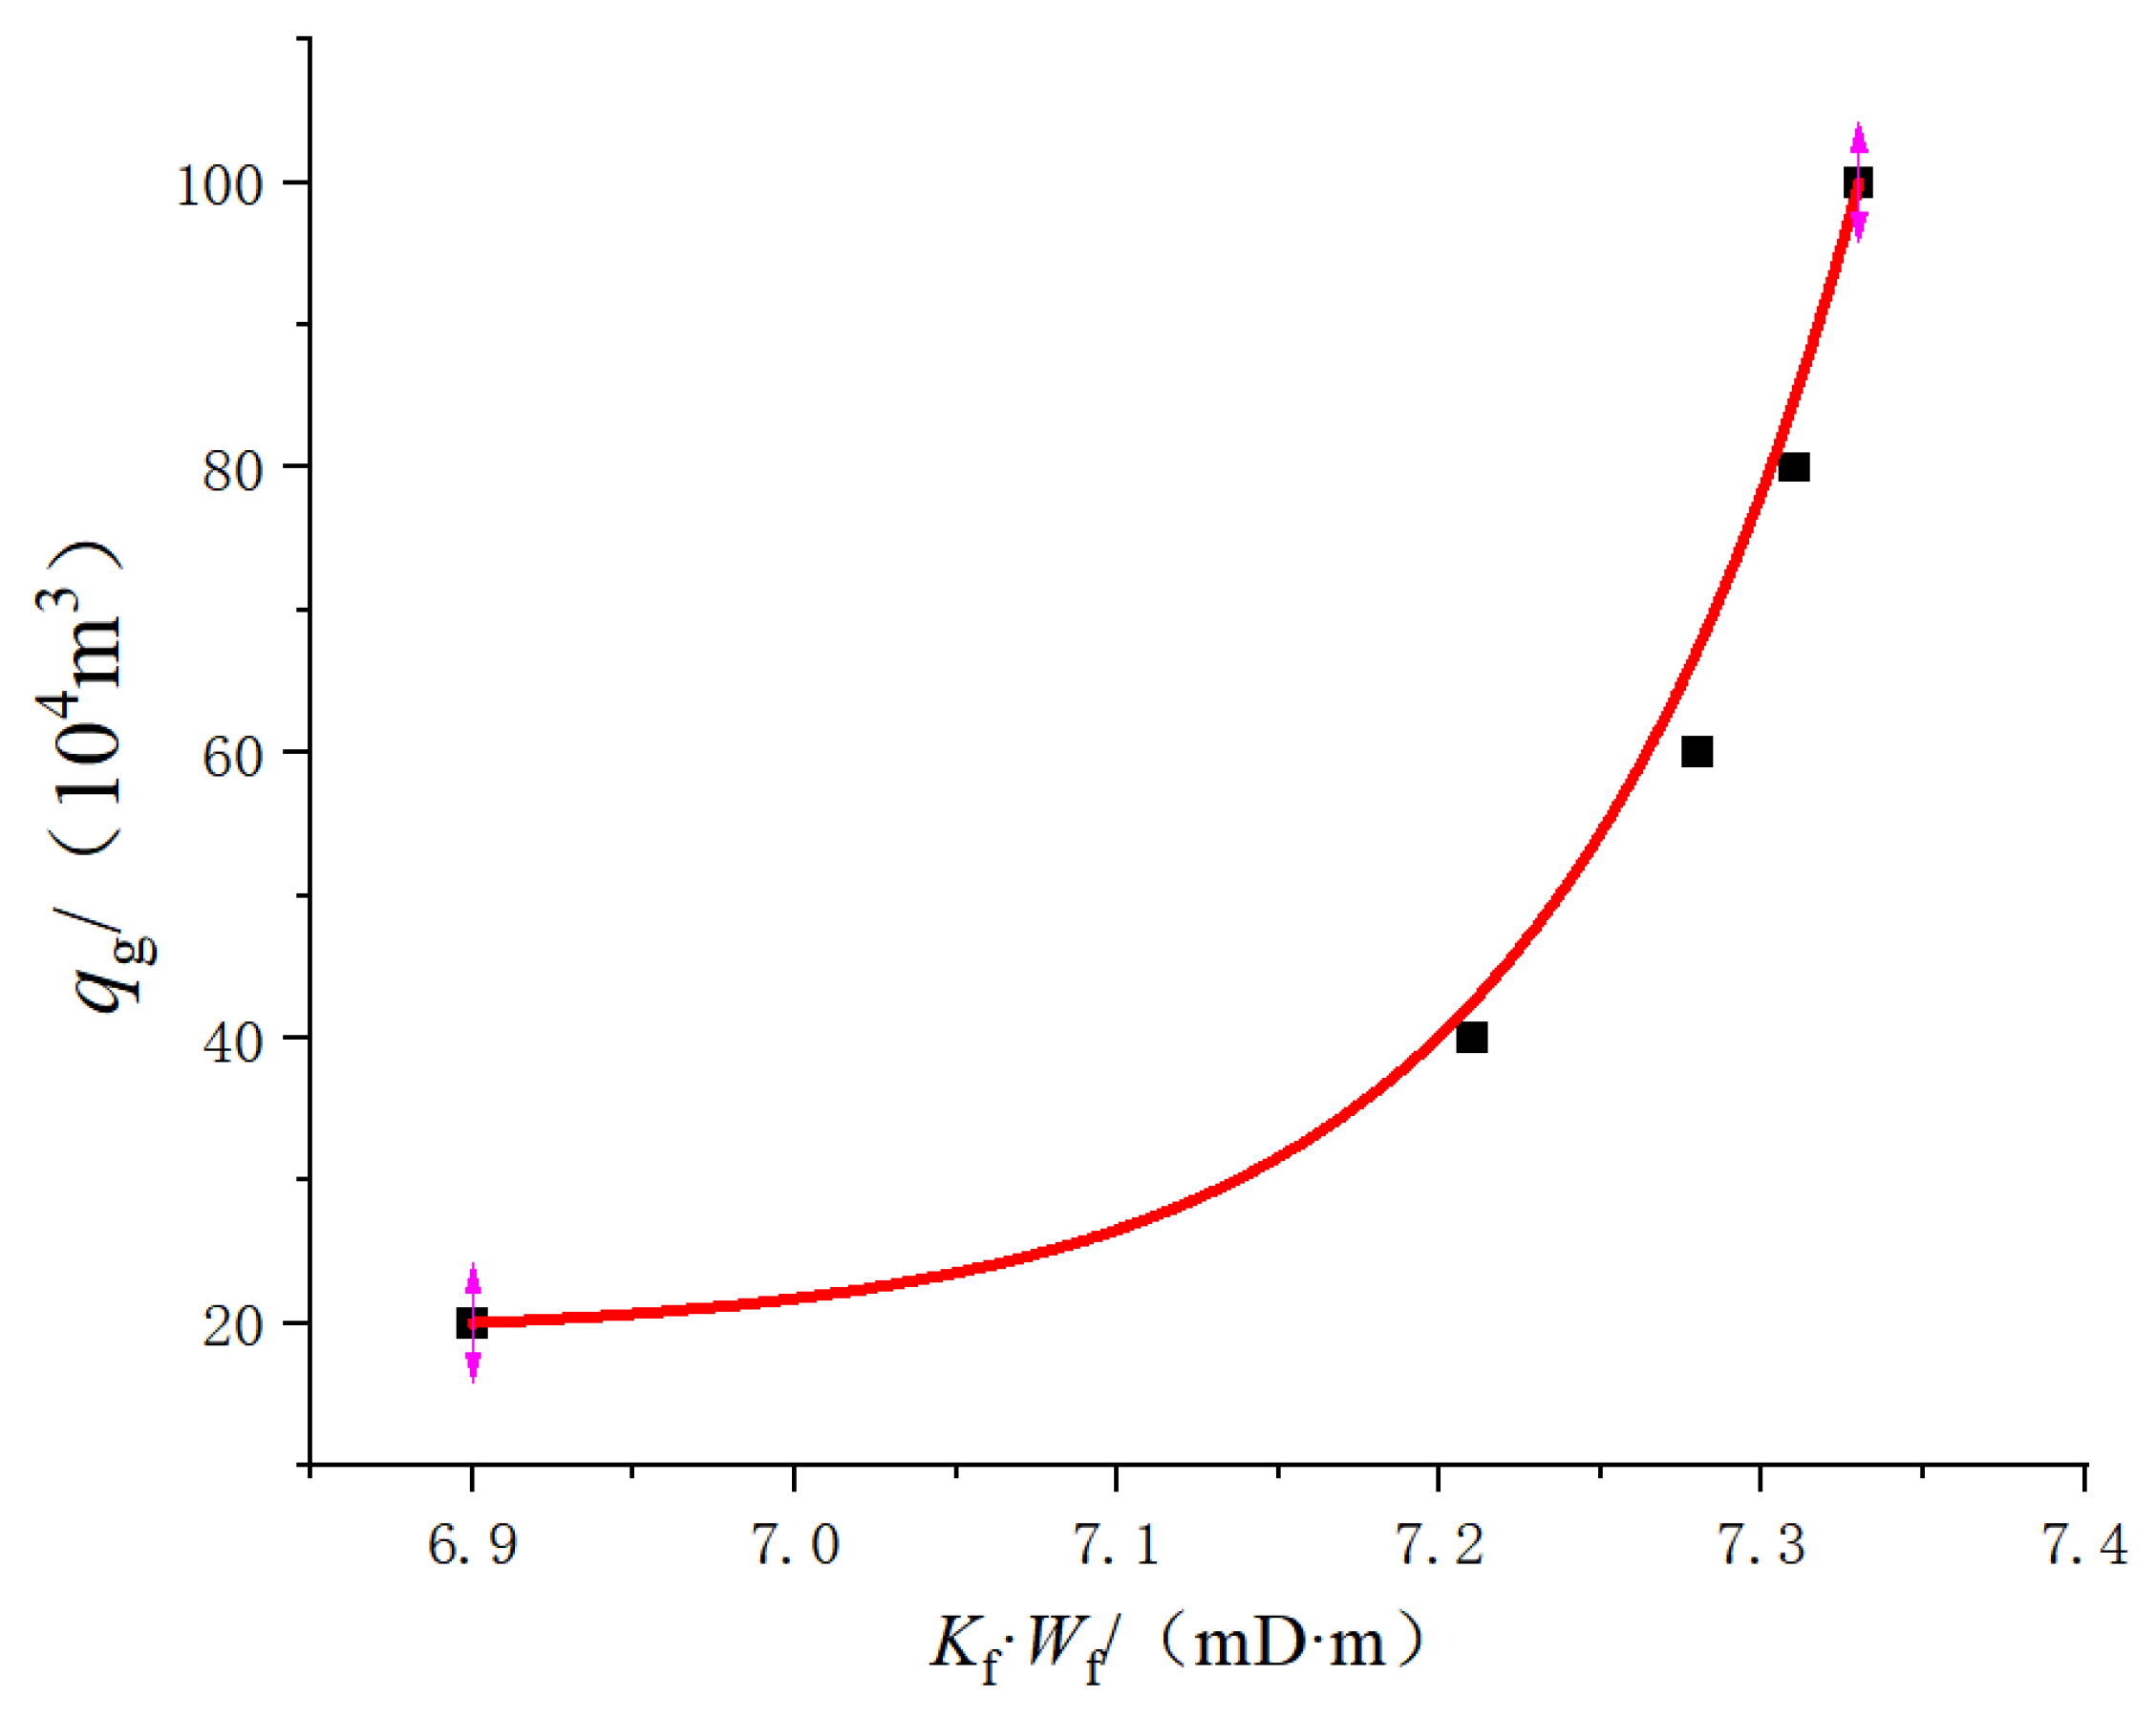
4.2. Influence of Fracture Conductivity on Gas Well Productivity
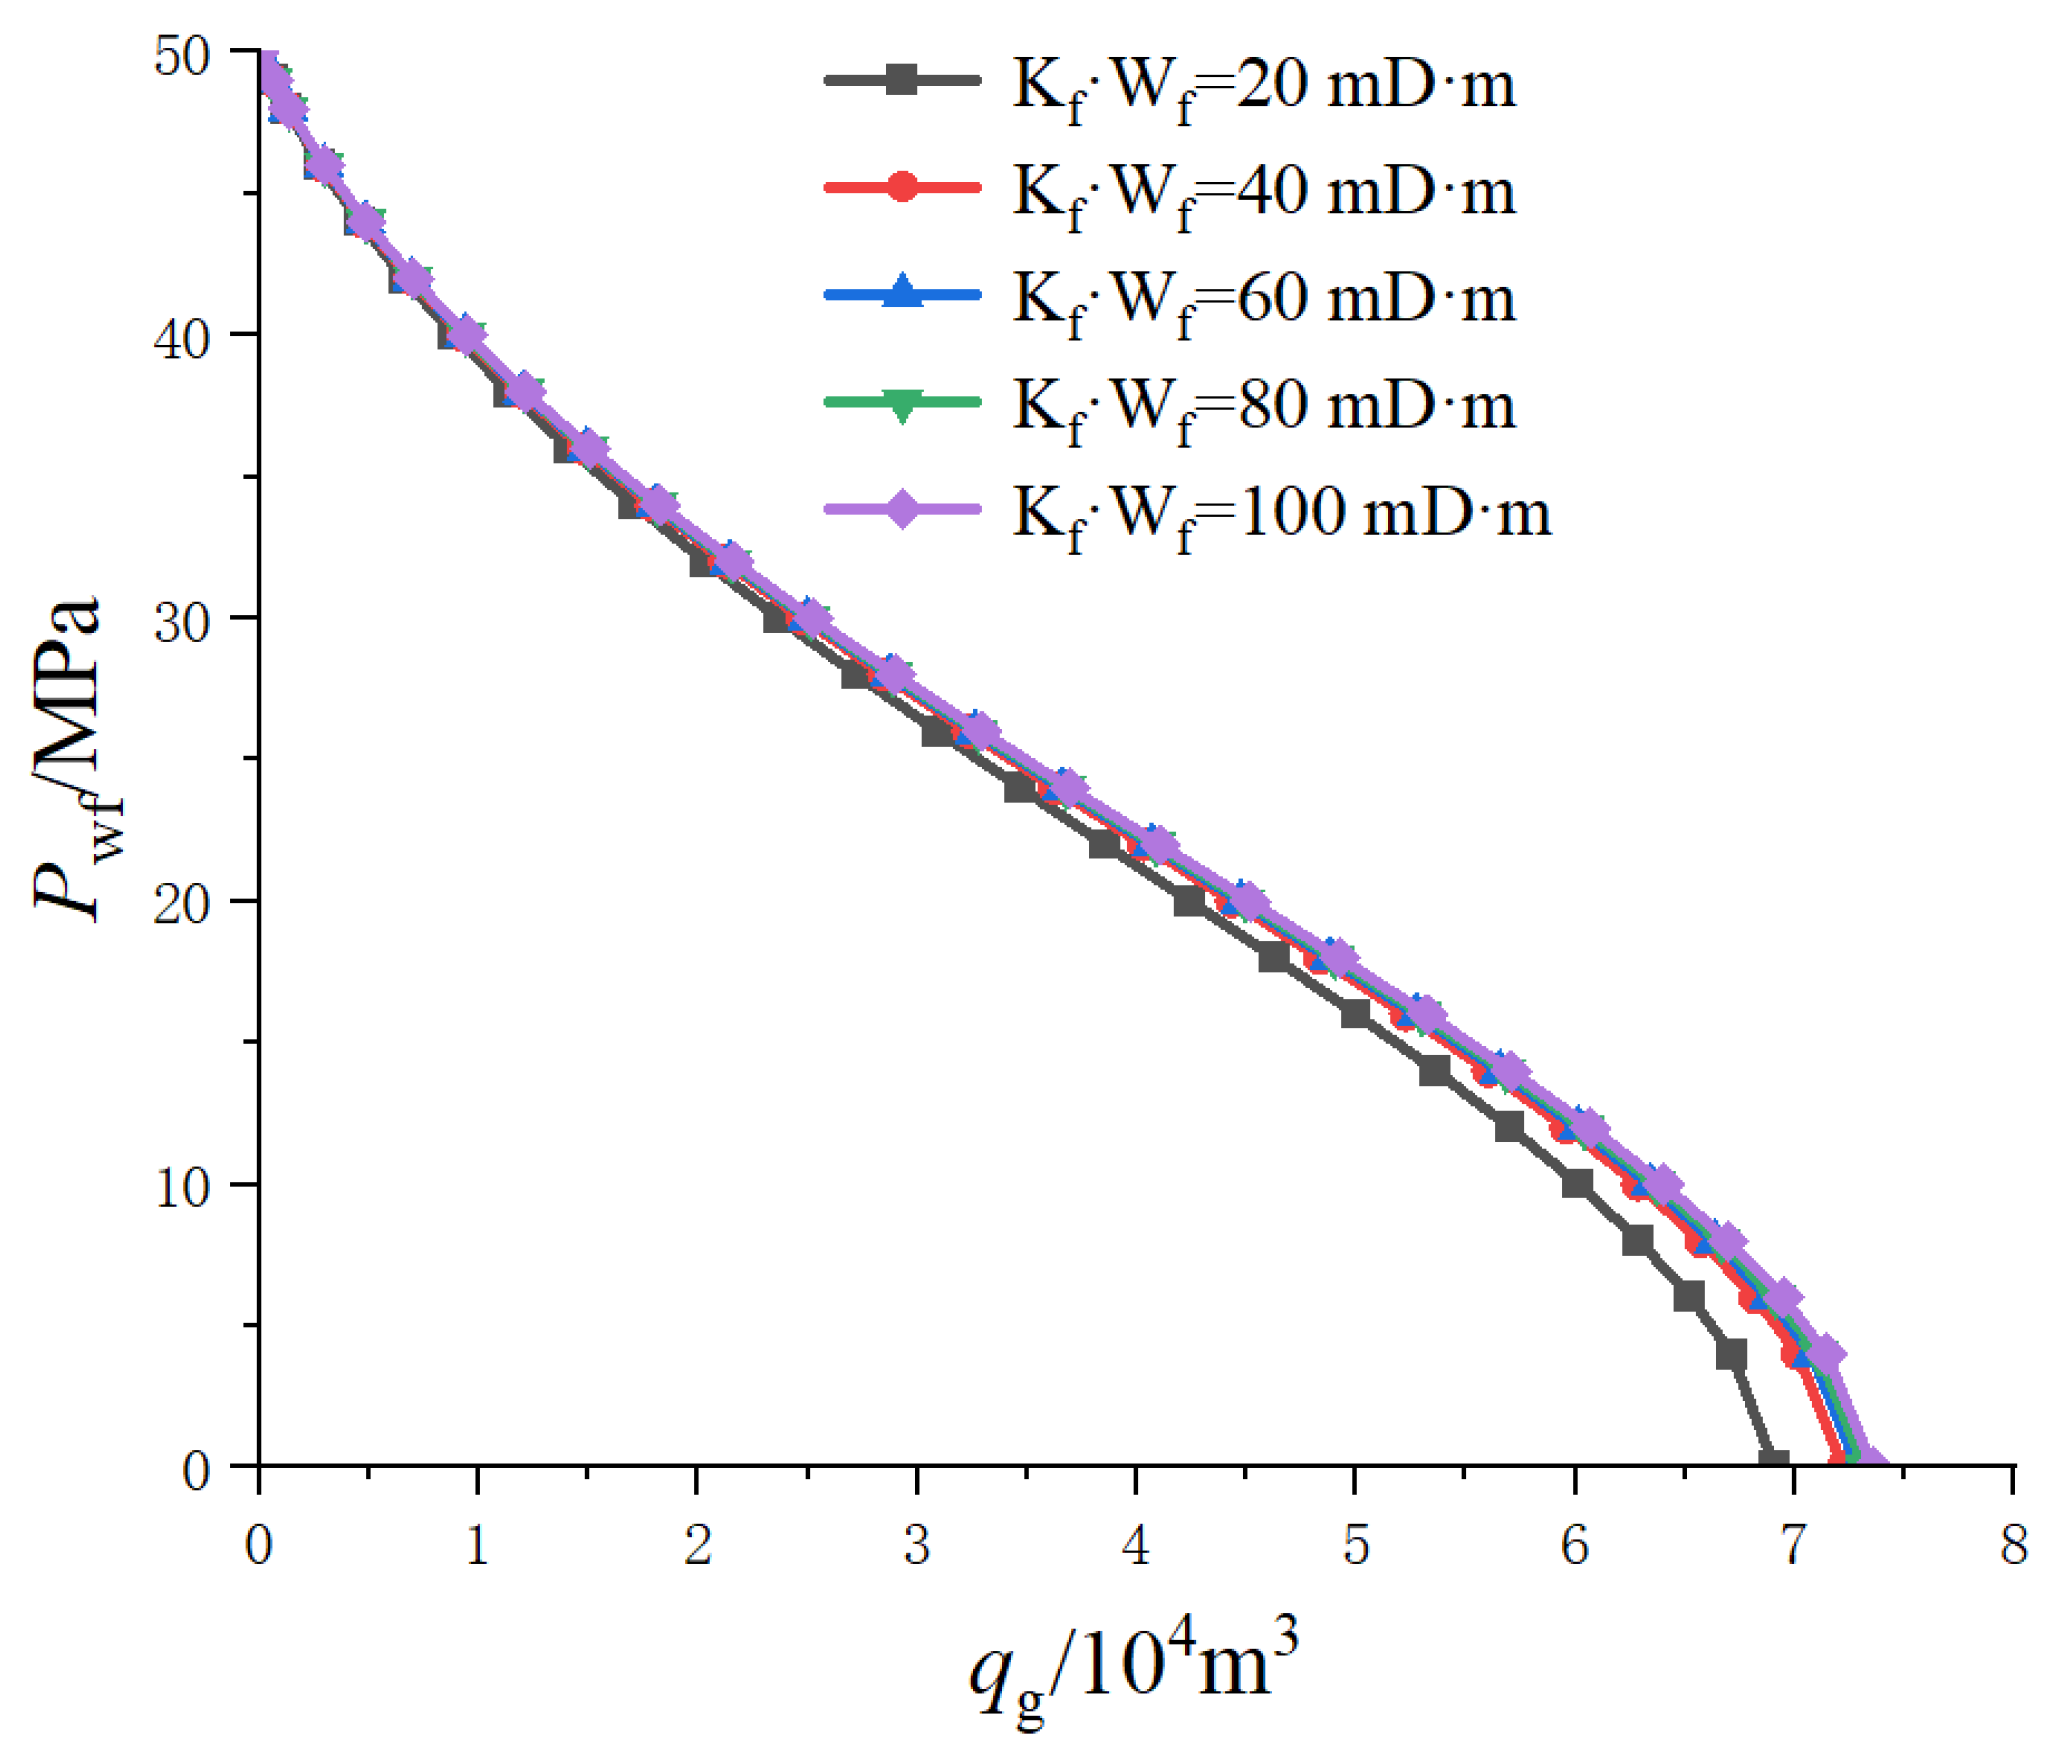
Other parameters are unchanged, and the fracture inflow capacity is set to 20~100 mD·m. The IPR curves of the fractured gas wells under the corresponding conditions are shown in
Figure 13. The analysis shows that with the increase in fracture inflow capacity, the IPR curve shifts to the direction of increasing production capacity, and the gas well production capacity increases, but its increase is becoming smaller and smaller (as shown in
Figure 14). This is because the increase in the inflow capacity reduces the resistance of the gas flow, and the gas well production capacity increases, but the increase is limited. The results show that there is an optimal value of fracture inflow capacity with other parameters constant.
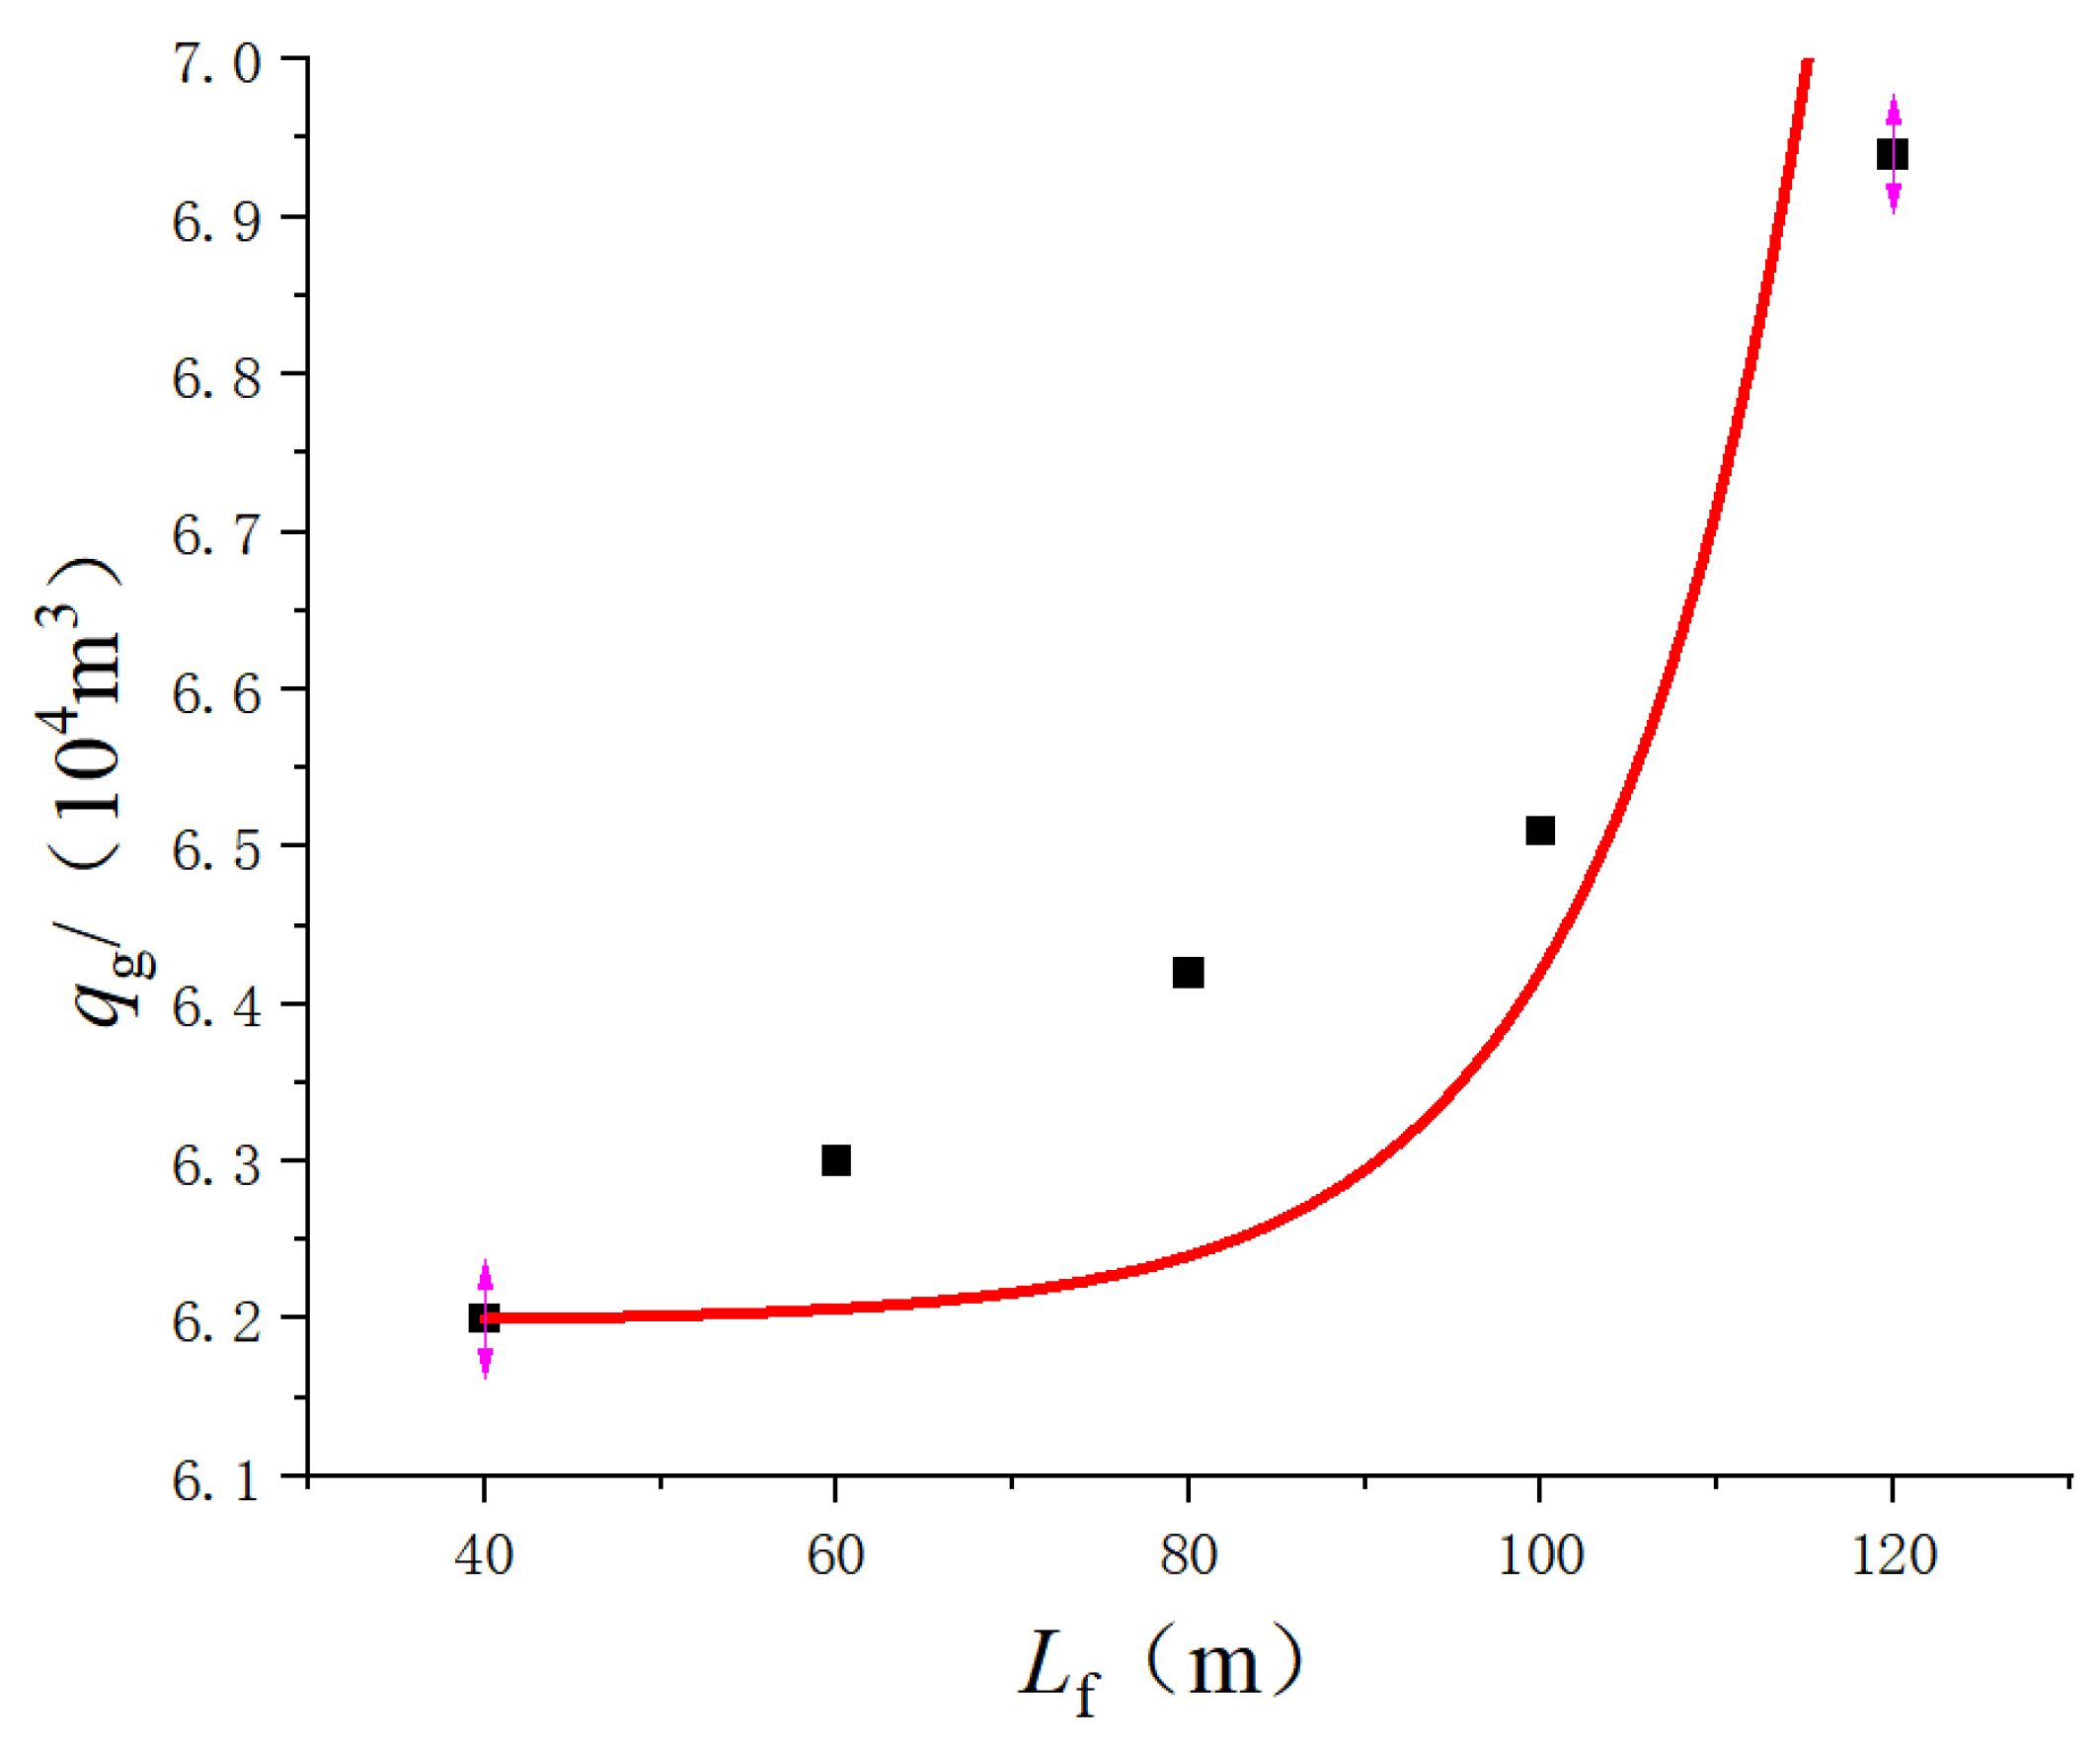
4.3. Influence of Fracture Half-Length on Gas Well Productivity
Other parameters are unchanged, and the fracture half-lengths of fractured straight wells are set to 40 m, 60 m, 80 m, 100 m, and 120 m; the IPR curves of fractured gas wells under the corresponding conditions are shown in
Figure 15. The analysis shows that with the increase in fracture half-length, the IPR curve shifts to the direction of capacity increase, and the gas well capacity increases, but its increase is becoming smaller and smaller. With the increase in the fracture length, the extension range of the fracture becomes wider, and the wave range of fracturing modification increases. However, as the fracture length increases, the differential pressure per unit length of a single fracture gradually decreases with the same differential pressure at both ends (as shown in
Figure 16). When this production differential pressure is not sufficient to support fluid flow, seepage is impeded, which in turn affects gas well production, indicating that there is an optimal value for the fracture length. Therefore, the fracture length should be reasonably optimized in the actual production process.
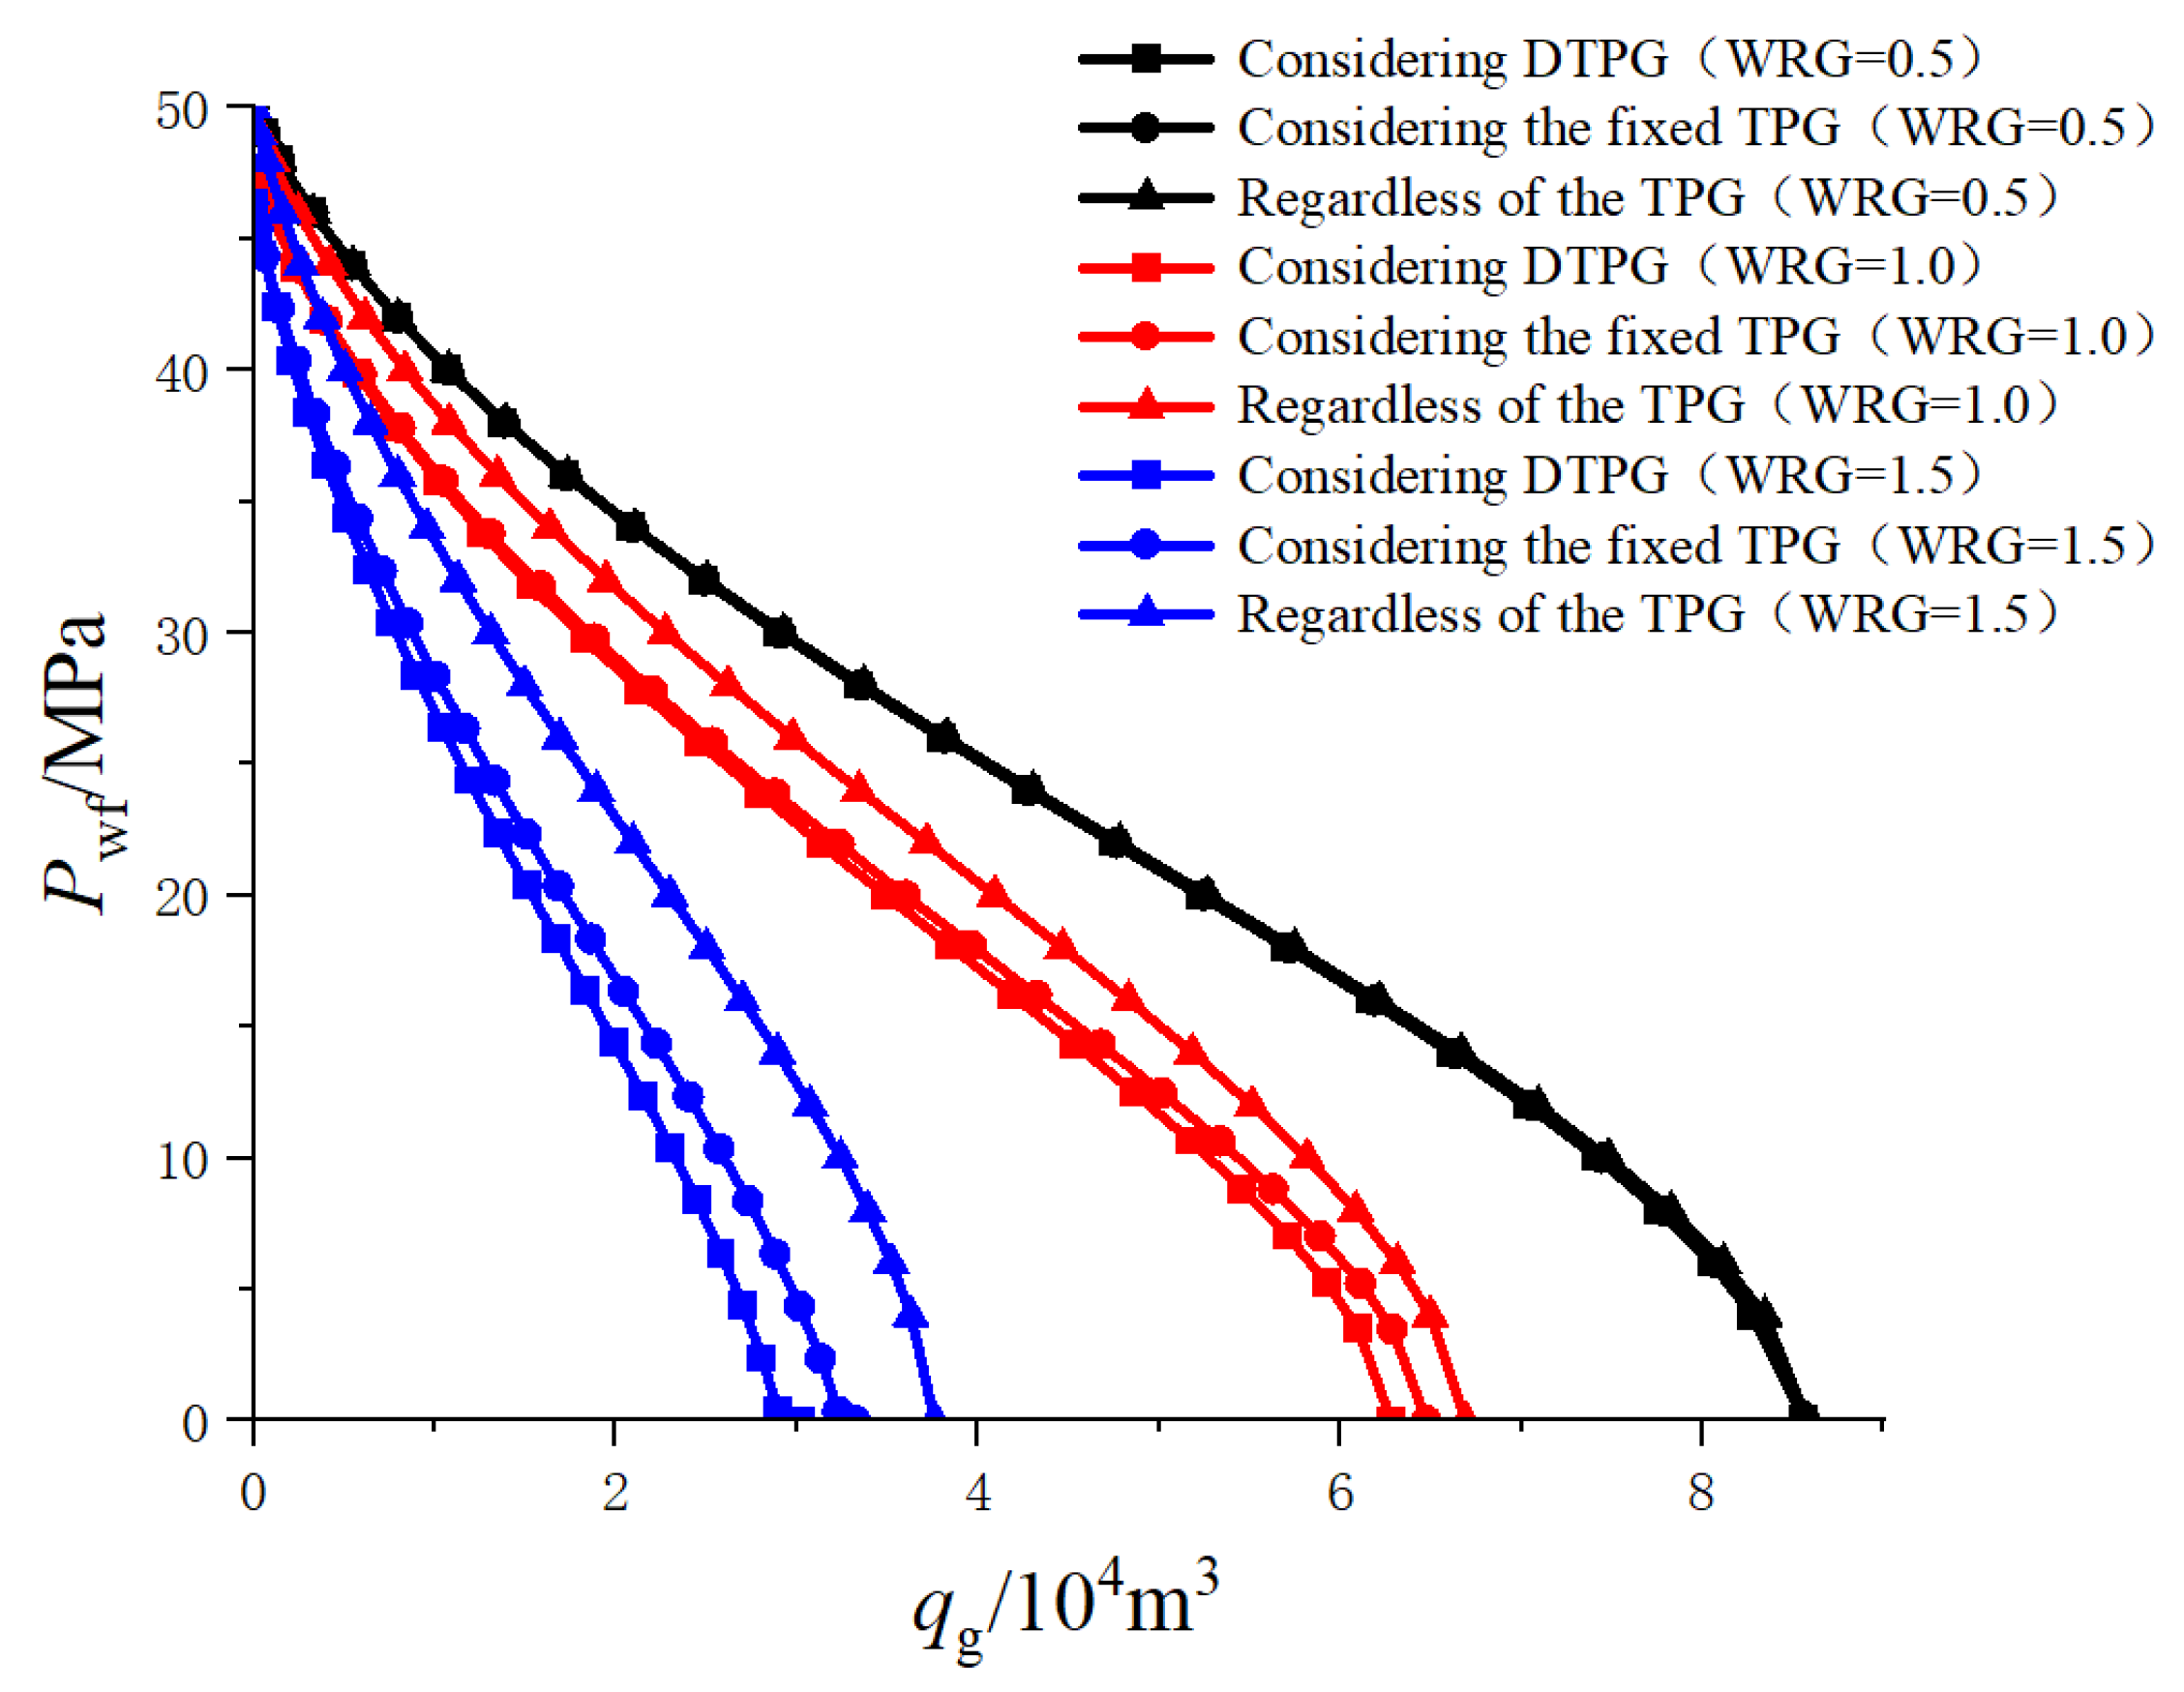
4.4. Effect of Dynamic TPG (DTPG) on Gas Well Productivity under Different WRG Conditions
Three different gas–water ratios are set as 0.5 m
3/10
4 m
3, 1.0 m
3/10
4 m
3, and 1.5 m
3/10
4 m
3, and the corresponding water saturation values can be obtained through calculation, combined with
Figure 6 and
Figure 7; the corresponding relative permeability of the gas–water two-phase can be obtained as shown in
Table 2, and the corresponding gas production can be obtained by substituting each parameter into Equation (34).
With all other parameters held constant, the WRGs are set to 0.5 m
3/10
4 m
3, 1.0 m
3/10
4 m
3, and 1.5 m
3/10
4 m
3, and the corresponding IPR curves for fractured gas wells are generated under the conditions considering the impact of water saturation on the TPG and without considering it, as shown in
Figure 17. The analysis reveals that gas well productivity decreases after water production, and as the water production ratio increases, the curve shifts to the left. After water breakthrough, the water phase enters the large pores initially occupied by the gas phase, causing more and more gas to become discontinuous, resulting in a reduction in the relative gas phase permeability, which impacts gas well productivity.
The results from
Figure 17 also demonstrate that when considering the fixed TPG, gas well productivity decreases significantly compared to when regardless of the TPG. This is because considering the fixed TPG increases the additional resistance to fluid flow, leading to reduced productivity. Furthermore, when considering the DTPG, gas well productivity decreases even further compared to the conventional fixed TPG. This is primarily because when accounting for the dynamic TPG, the TPG of the reservoir gradually increases as development progresses. As reservoir pressure decreases, the TPG becomes larger, resulting in a more pronounced reduction in productivity. The curve showing the unrestricted flow rate of gas wells under the influence of DTPG with varying WRG is also shown.
The results in
Figure 17 also indicate that as the WRG increases, the TPG increases, but the extent of the rightward shift in the curve becomes smaller. With lower flowing pressure, the impact of the TPG on gas well productivity becomes more significant. Therefore, when calculating productivity in the model, the influence of water saturation on the TPG should be considered. In practical production processes, it is advisable to use appropriate operational procedures to avoid or delay water breakthrough in gas wells.
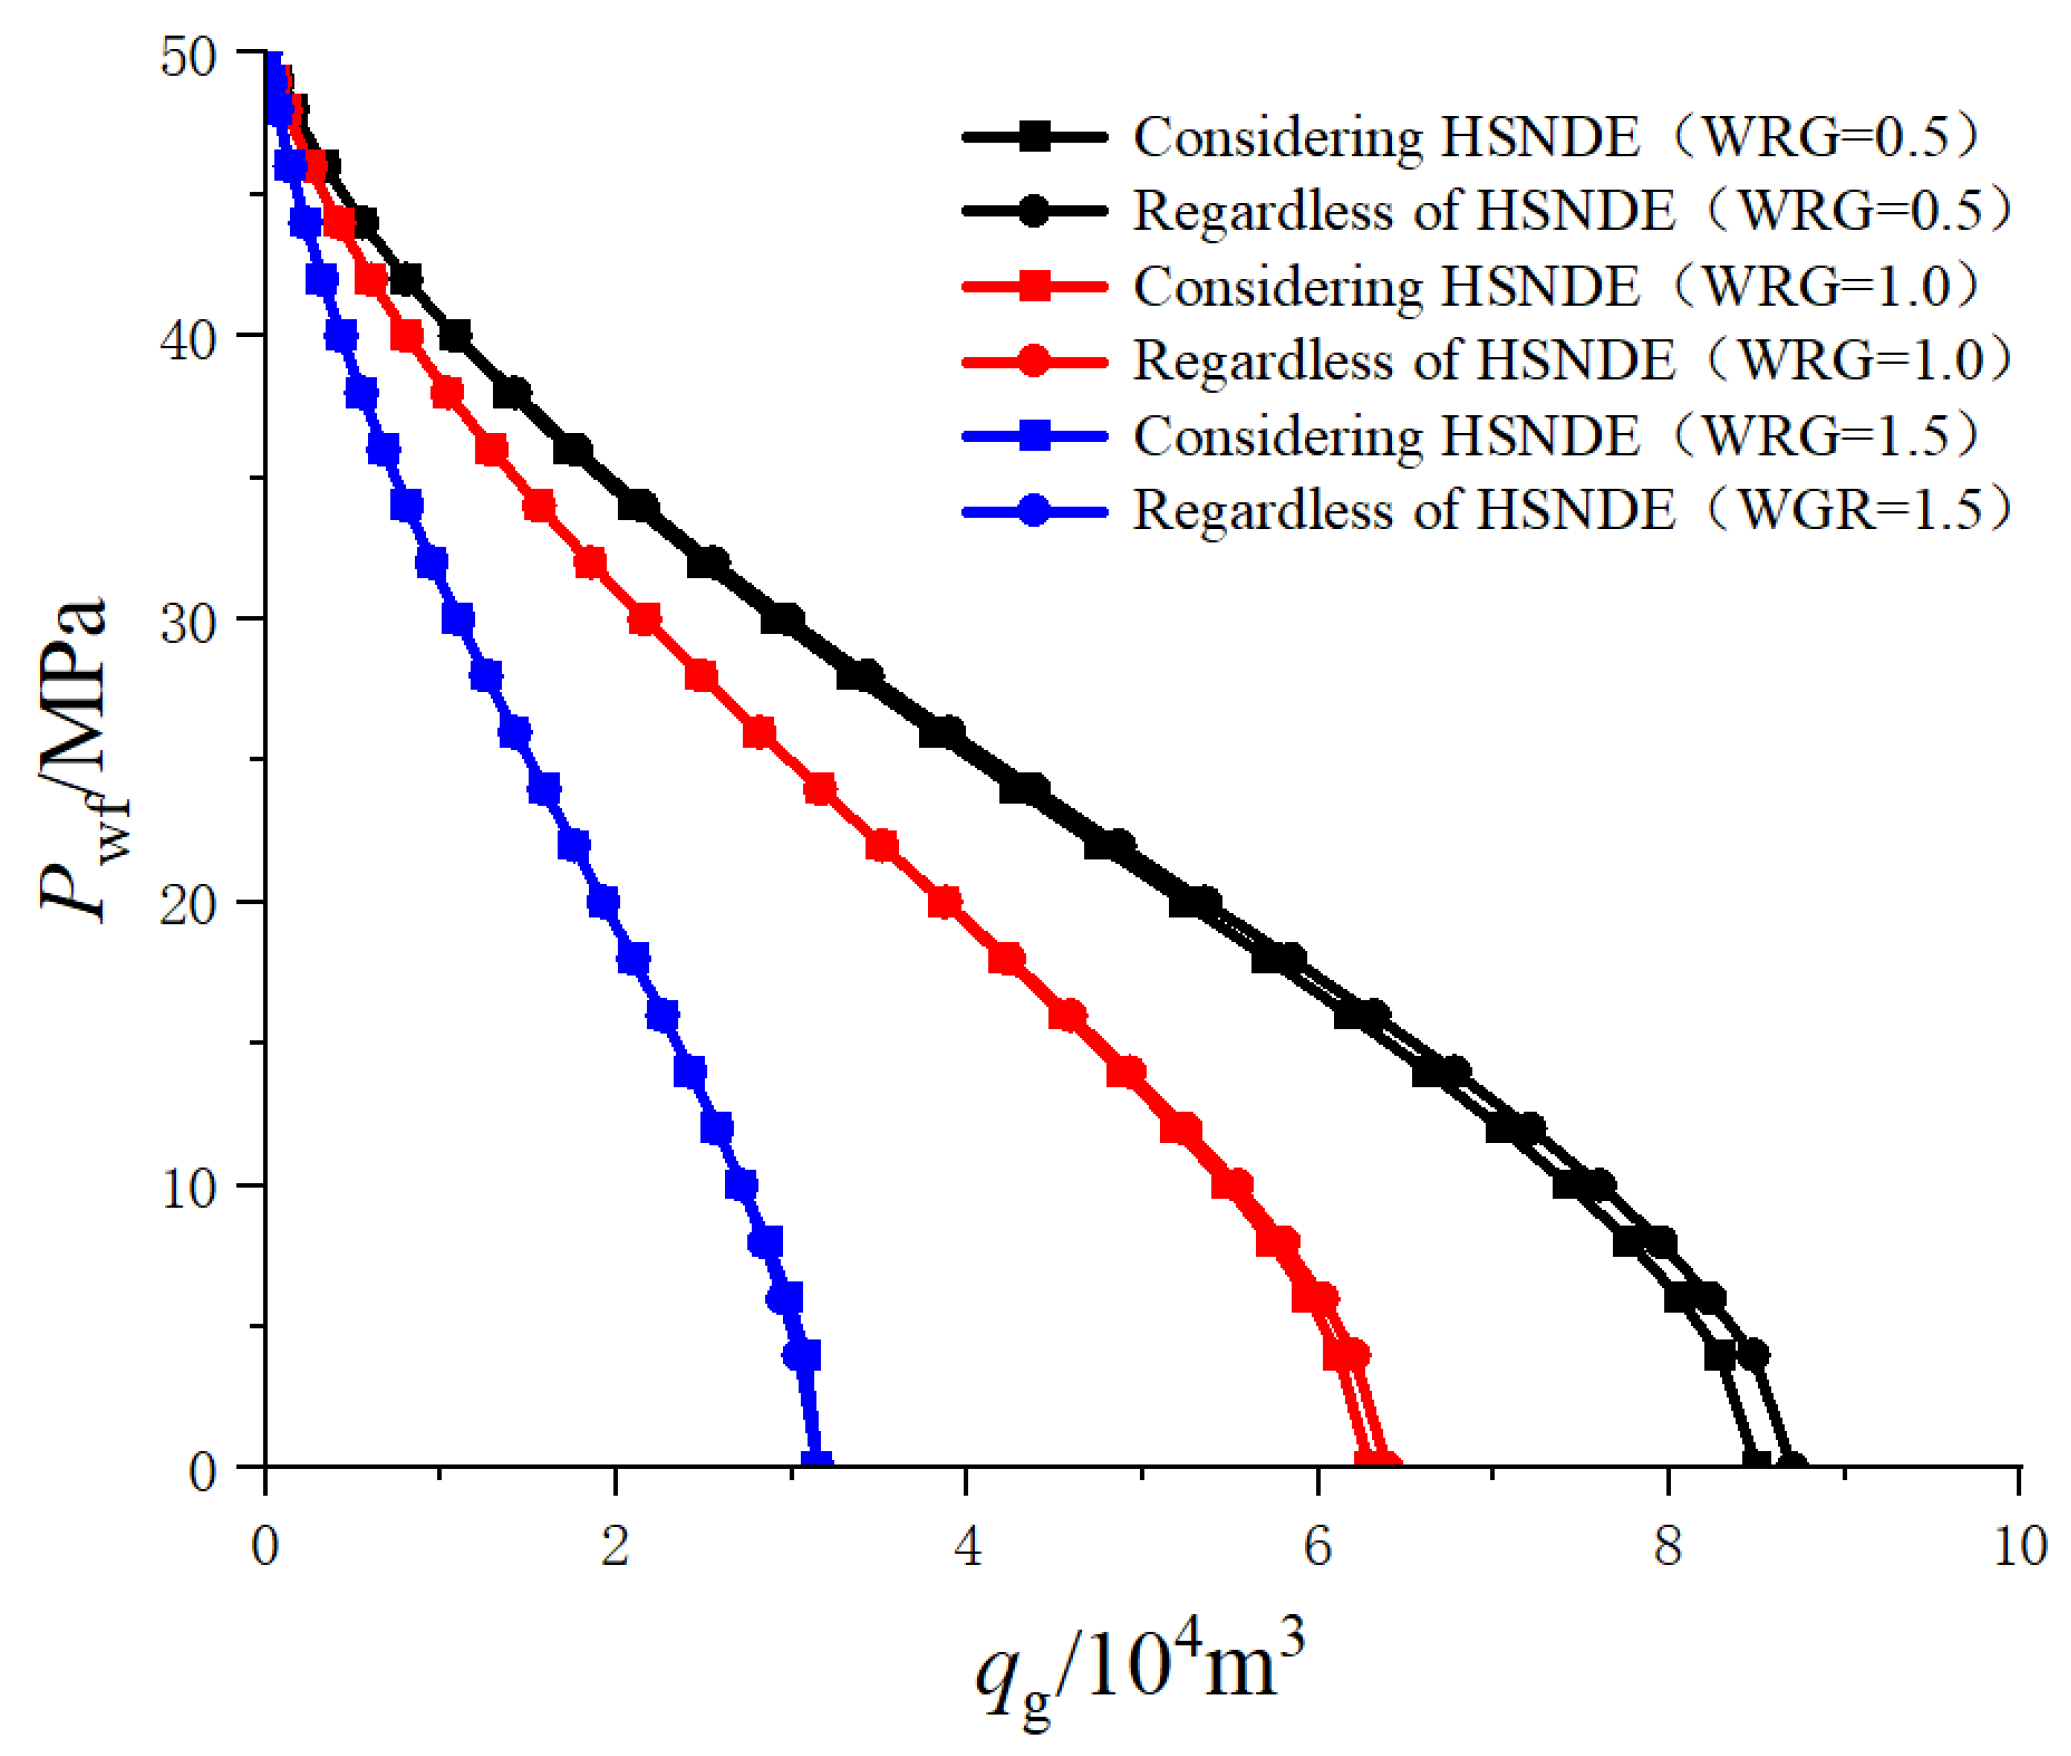
4.5. Influence of HSNDE on Gas Well Productivity
Under the condition of keeping other parameters constant, IPR curves for gas–water co-production in fractured vertical wells under different WRGs are generated, considering HSNDE and regardless HSNDE. From the
Figure 18, it can be observed that when considering the HSNDE, the unrestricted flow rate of gas wells decreases slightly. This is because the involvement of the water phase slows down the high-speed gas flow in the near-wellbore zone, thereby reducing the HSNDE of the gas. When gas well production is relatively low, the HSNDE can be neglected. However, when gas well production is high, the HSNDE cannot be ignored.
4.6. The Impact of Gas Slip Flow Effects Considering Water Saturation (GSFECWS) on Gas Well Productivity under Different WRGs
Under the condition of keeping other parameters constant, dynamic inflow curves for gas wells, considering and not considering the influence of water saturation on the slip factor, have been created for different WRGs (
Figure 19). From the figure, it can be observed that the gas well production when not considering the slip effect, is lower than that when considering the slip effect. This is because the slip effect increases the reservoir’s permeability, reducing the threshold pressure drop for gas flow within the reservoir, ultimately increasing the gas well’s productivity. When considering GSFECWS, the gas well’s productivity further increases compared to the conventional fixed slip effect. Additionally, as the water–gas ratio decreases, the slip factor gradually increases, resulting in a smaller rightward shift in the IPR curve and increased productivity.
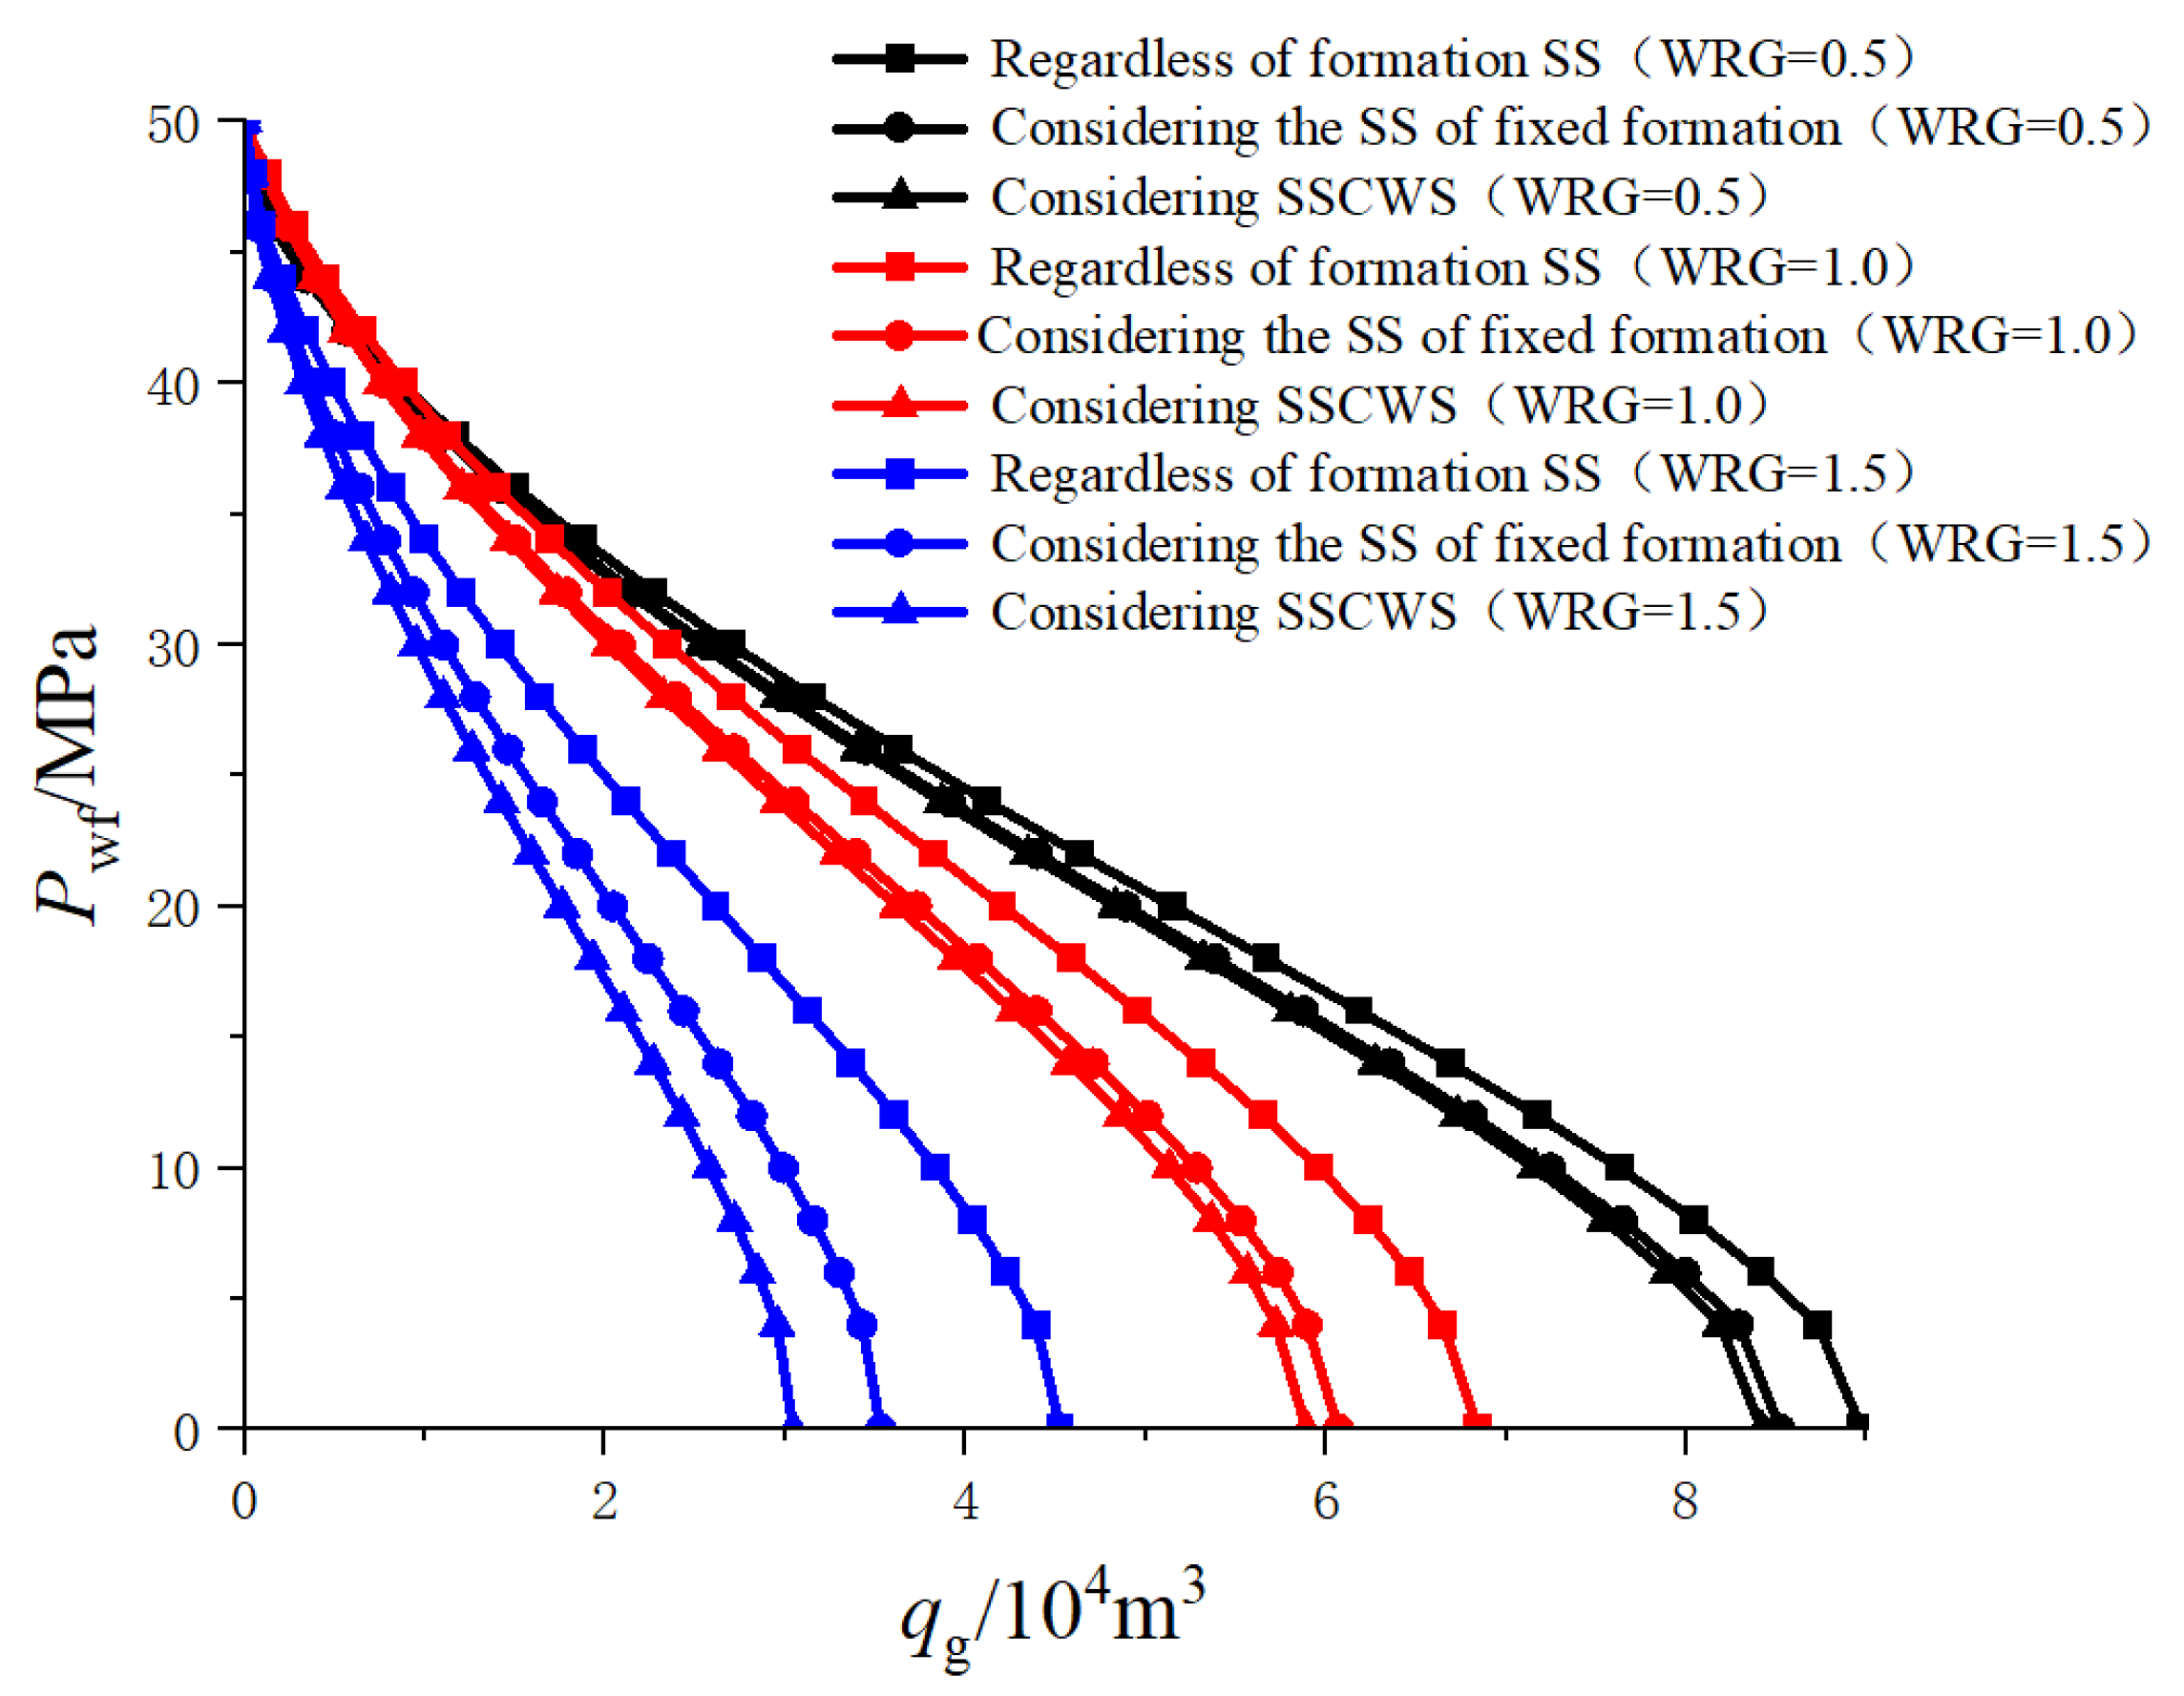
4.7. The Impact of SS Considering Water Saturation (SSCWS) on Gas Well Productivity under Different WRGs
The stress-sensitivity effects in both the formation and the fractures have an impact on the productivity of a fractured gas well and will be analyzed separately below.
- (1)
Influence of formation SS
Under the condition of keeping other parameters constant, dynamic inflow curves for fractured gas wells considering and not considering the influence of water saturation on reservoir SS, as well as curves not considering SS, have been generated for different WRGs (see
Figure 20). The analysis reveals that IPR curves for fractured gas wells considering the impact of reservoir SS are shifted more to the left and correspond to smaller unrestricted flow rates compared to curves not considering SS. This is because when SS is taken into account, the reservoir’s permeability continuously decreases with the progression of development, significantly affecting fluid flow capacity and leading to a notable reduction in well productivity. When considering the influence of water saturation on reservoir SS, well productivity further decreases compared to considering conventional reservoir SS. Additionally, as the WRG and reservoir SS coefficient increase, the curves shift even further to the left, resulting in a decrease in unrestricted flow rates. When the production pressure drop is relatively low, the curves are more dispersed, indicating that SS has a greater impact on productivity. Therefore, in the actual production process of gas wells, it is important to control production pressure differentials and mitigate the effects of SS.
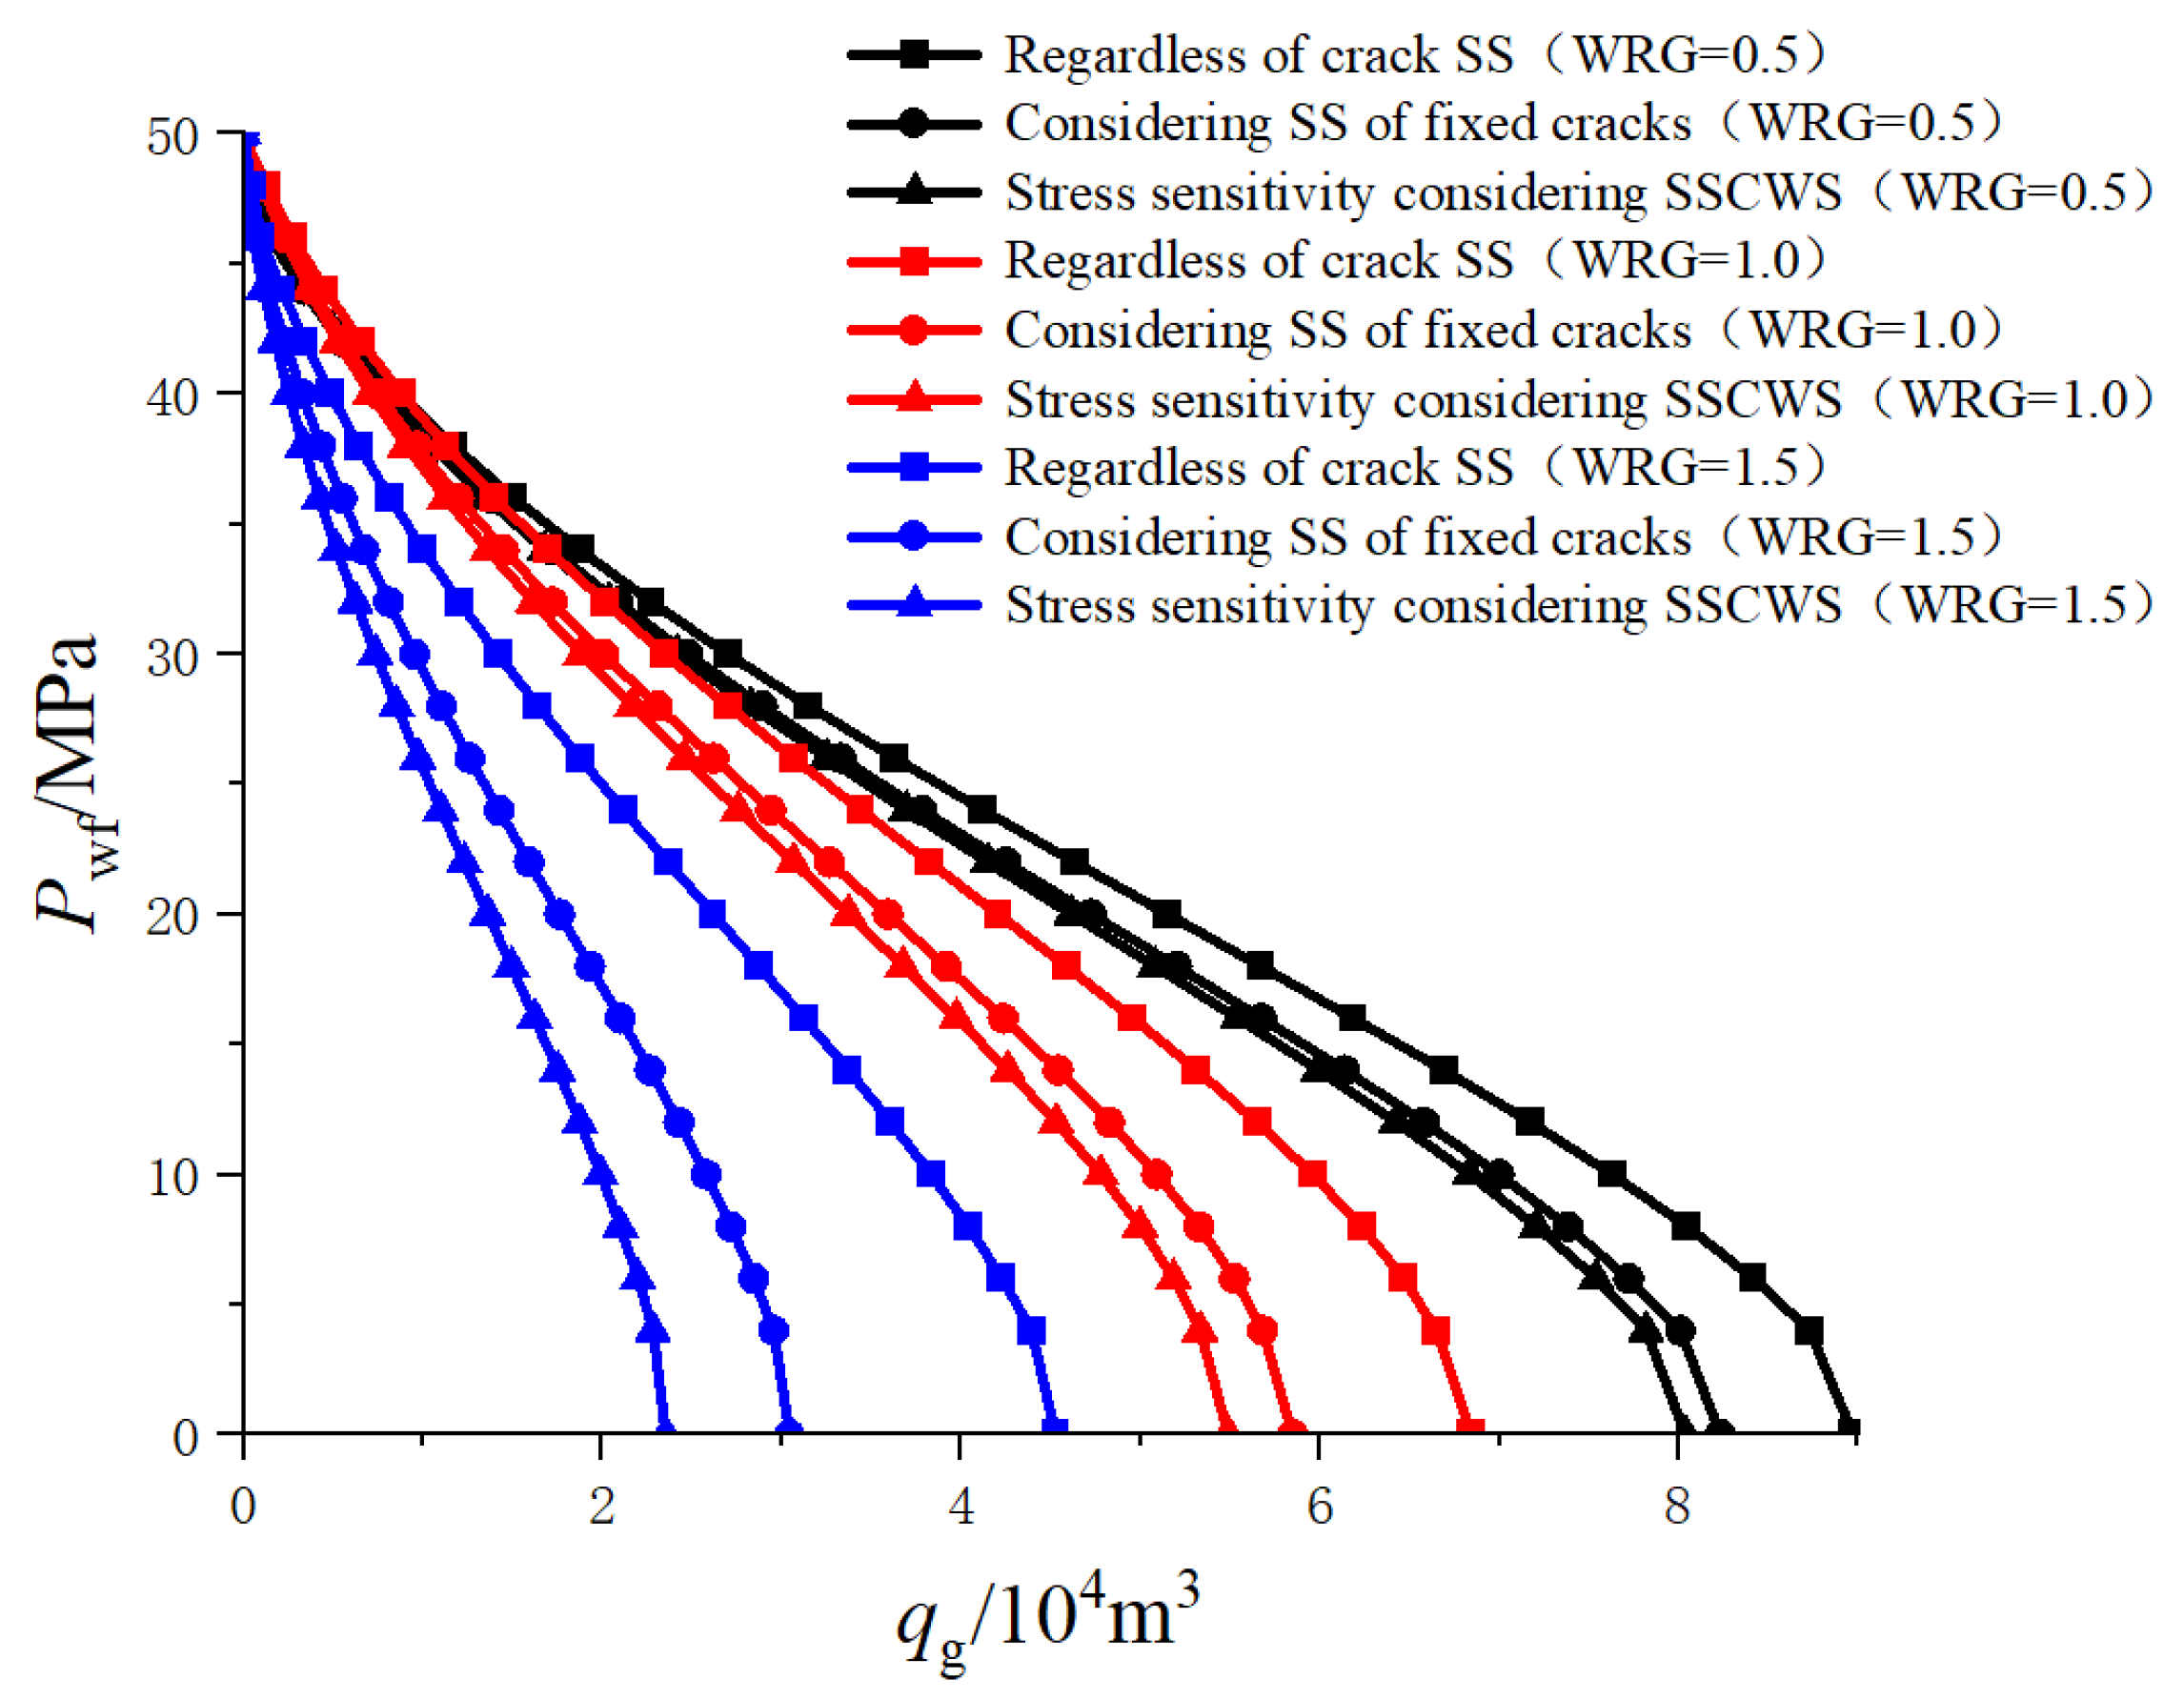
- (2)
The influence of crack SS
IPR curves were made for fractured SS and gas well production under different WRG conditions (as shown in
Figure 21). Comparing the analysis results of reservoir and fracture SS on productivity, it is evident that fracture SS has a more significant adverse impact on productivity. This is because in tight gas reservoirs, compared to the reservoir itself, the permeability is extremely low, while fractures have much higher flow capacity. Therefore, changes in fracture permeability have a more substantial impact on fluid flow capacity.
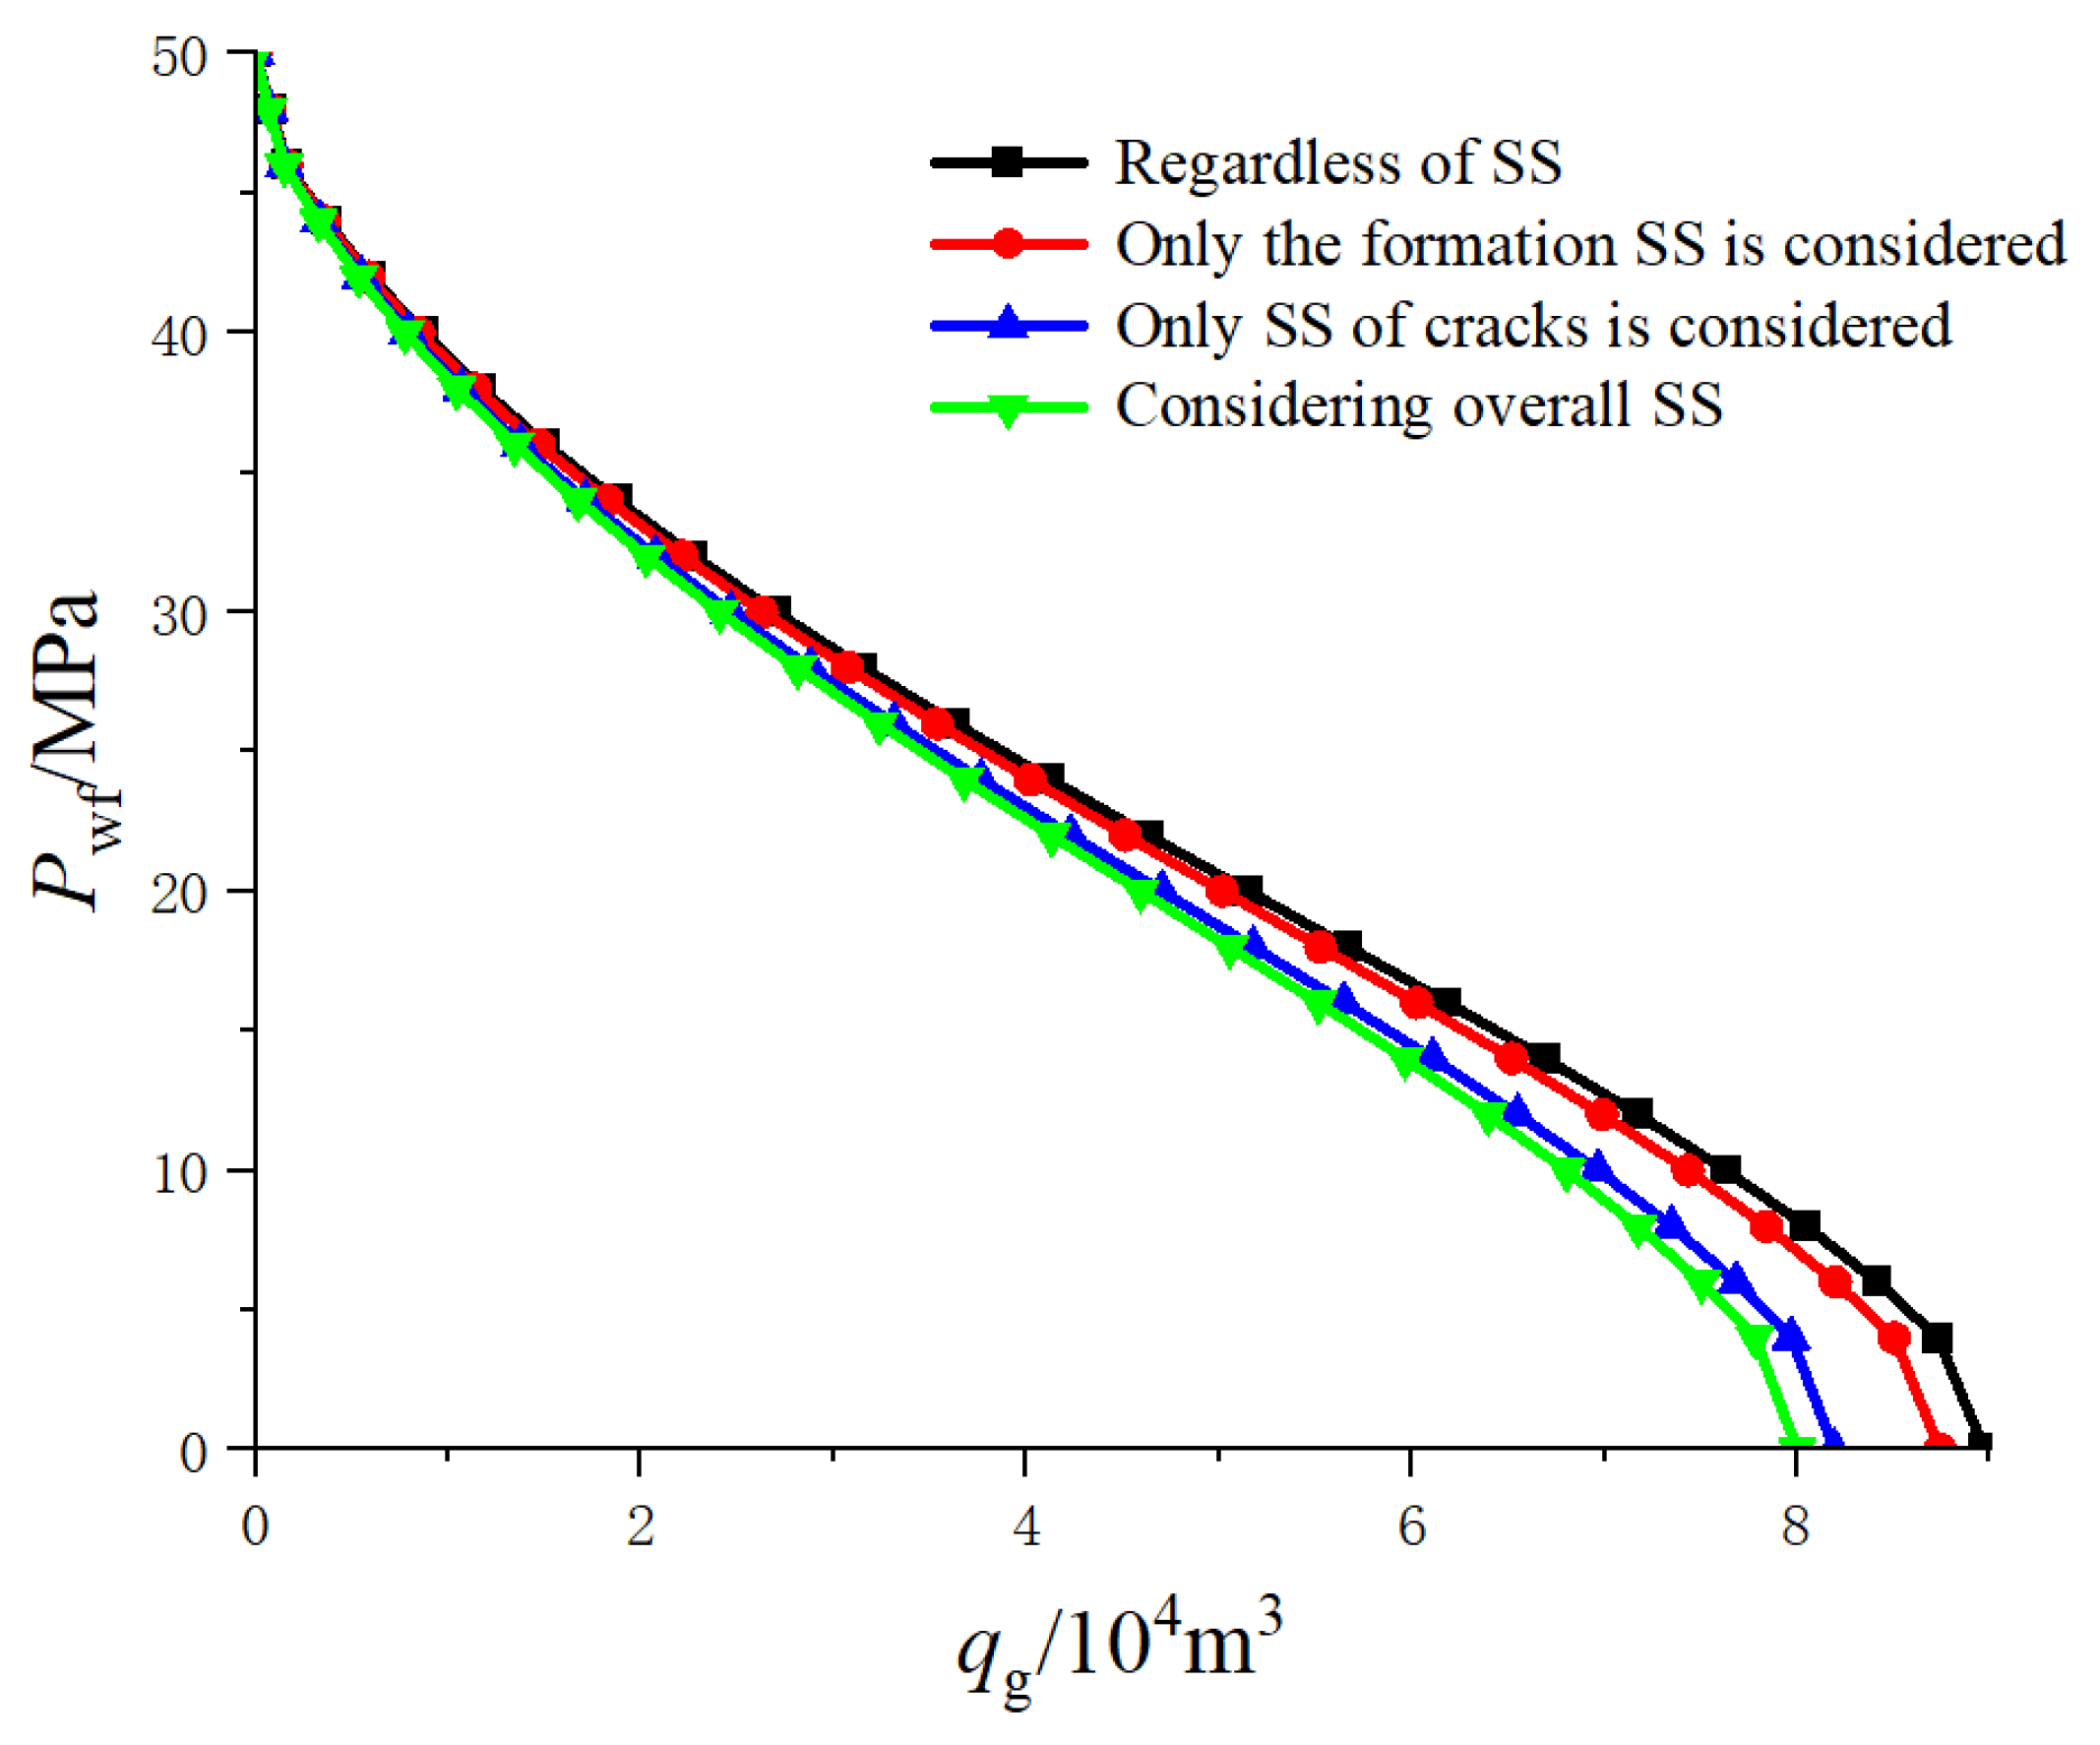
- (3)
Effect of regional SS
The impact of varying SS coefficients in the hydraulic fracturing zone inside and outside was investigated, studying the differential SS effects on the productivity of tight gas reservoirs. The results are shown in
Figure 22.
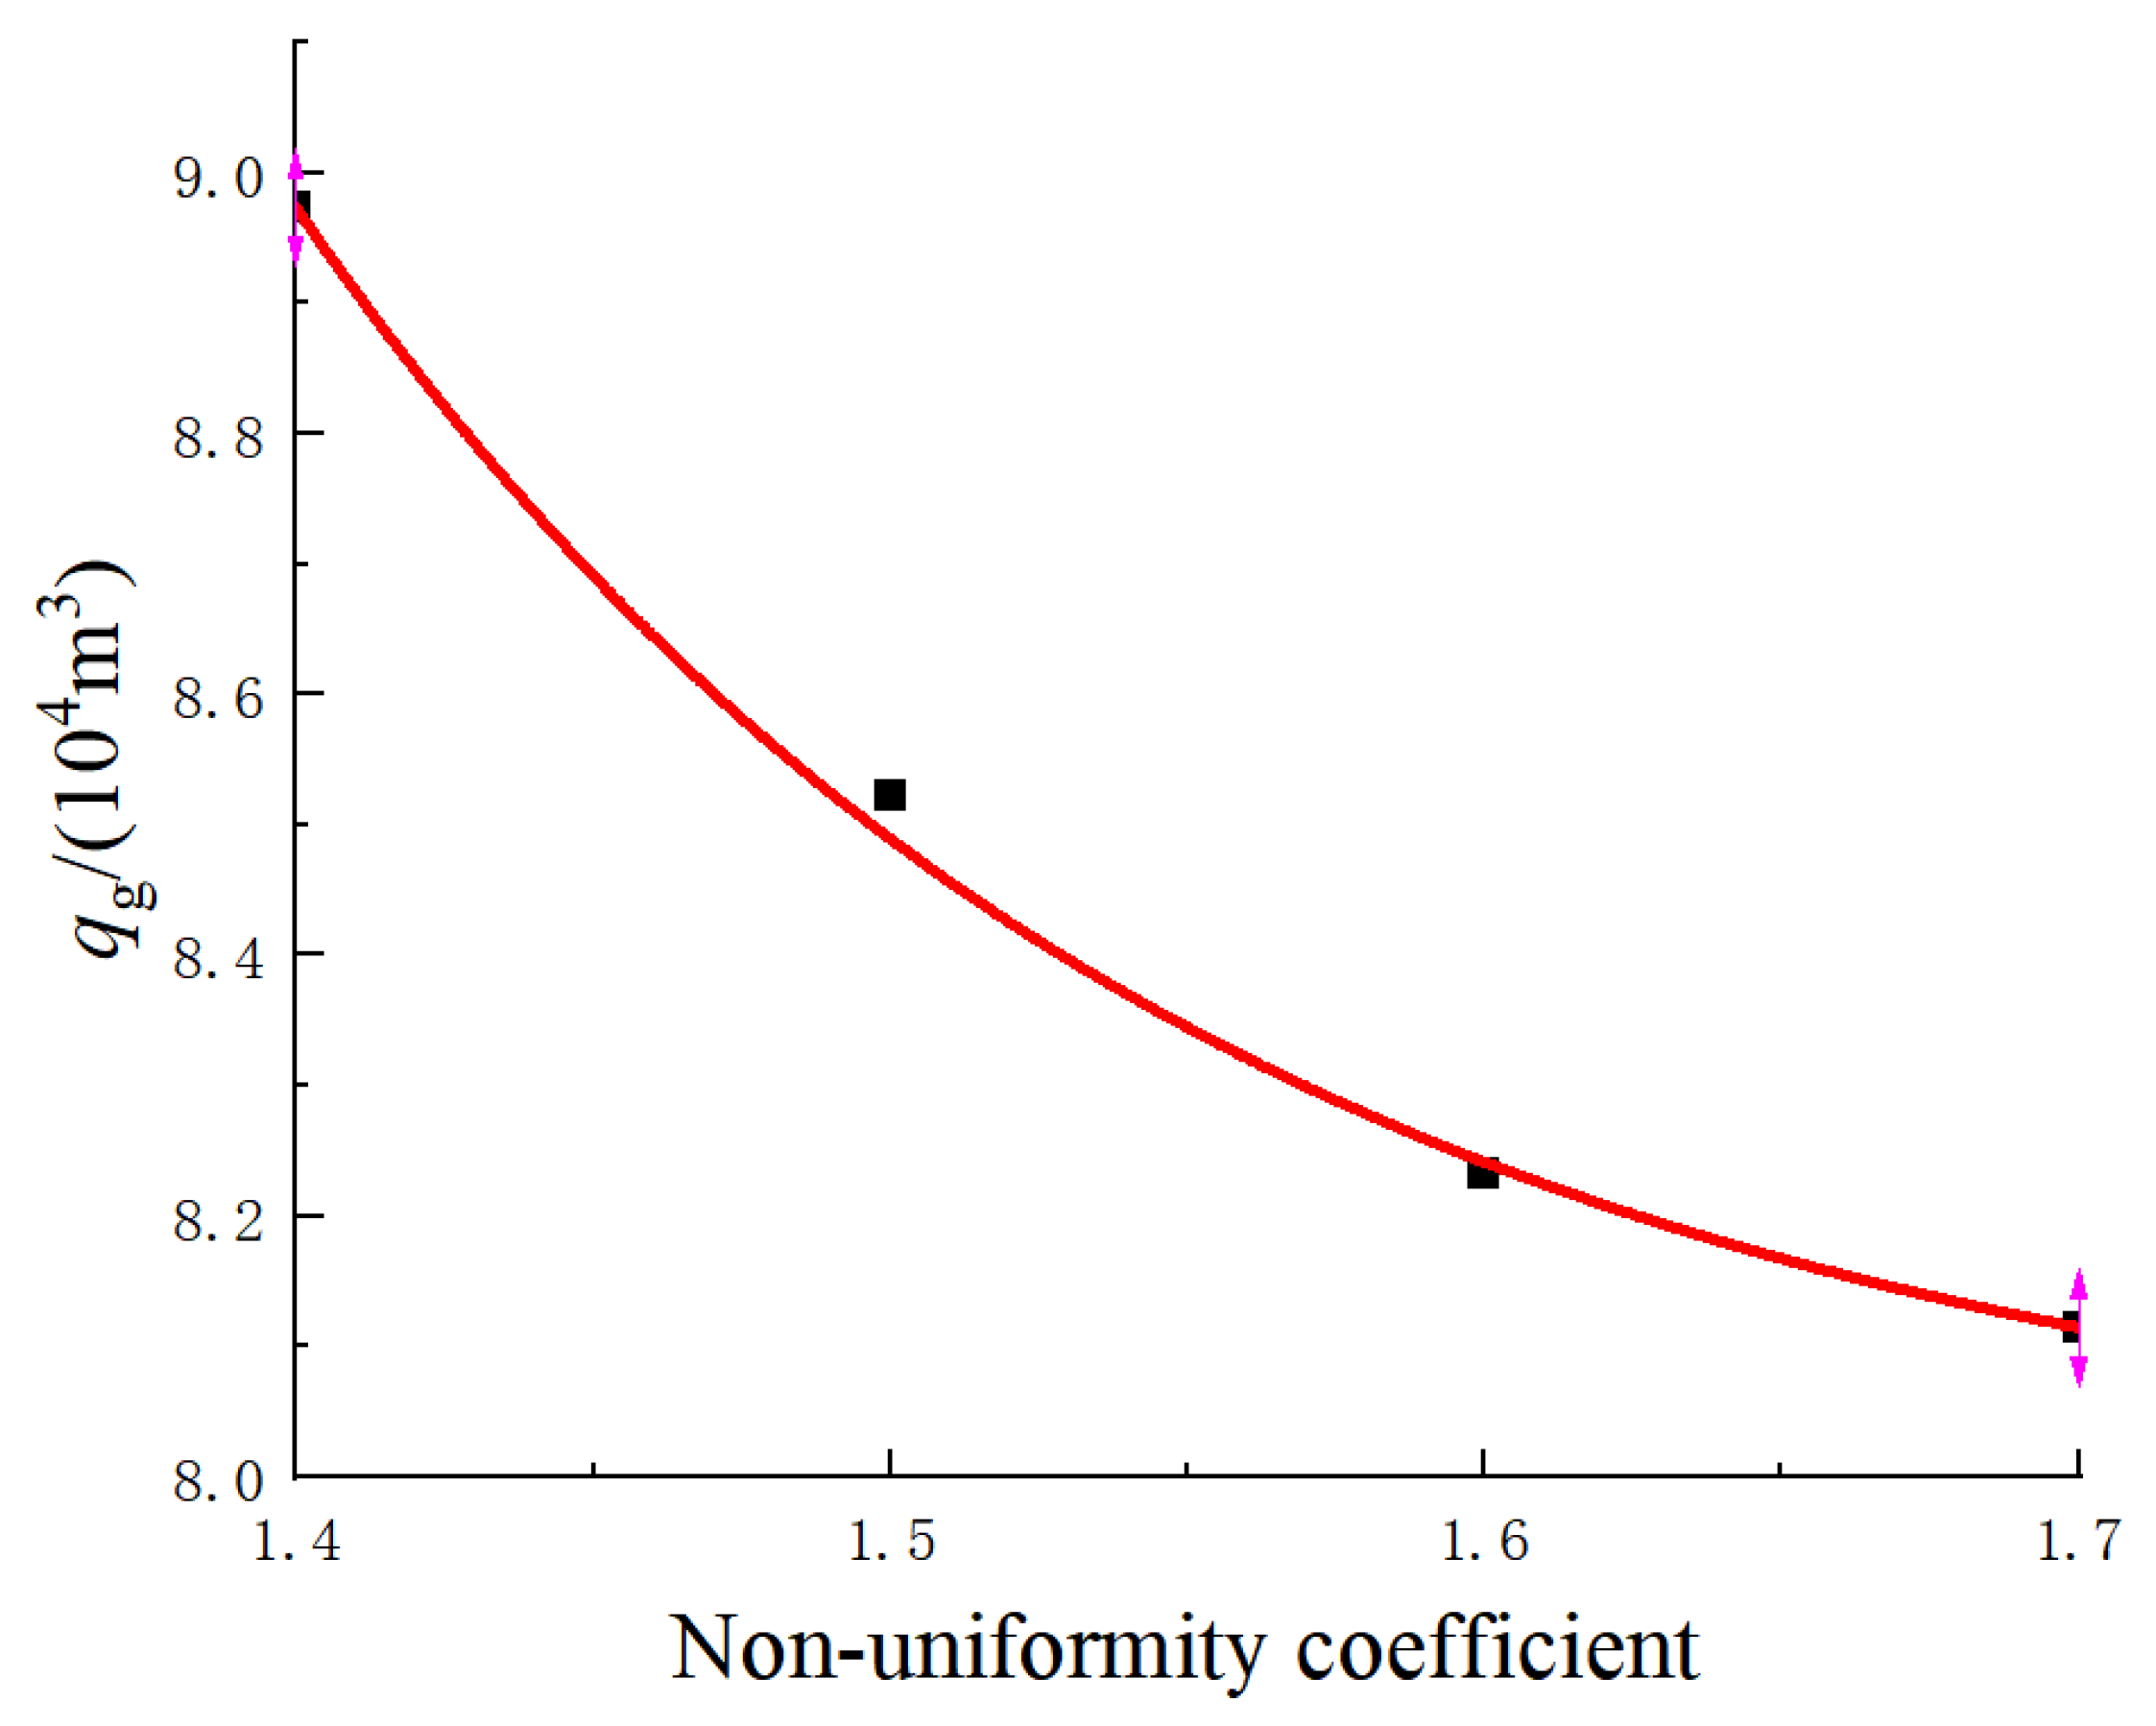
4.8. The Impact of Reservoir Heterogeneity on Gas Well Productivity
With other parameters unchanged, the non-homogeneity coefficient of fractured gas wells is set to be 1.4, 1.5, 1.6, and 1.7, and the graphs of IPR curves of the production of fractured wells and gas wells affected by the non-homogeneity coefficient under the corresponding conditions are generated. From
Figure 23, it can be seen that with the increase in non-homogeneity, the fracturing gas well IPR curve gradually moves to the left, and the reduction in production capacity is reduced. From
Figure 24, it can be seen that the stronger the formation non-homogeneity is, the smaller the fracturing gas well production capacity is.
5. Discussion
From the discussion, one may conclude that when assessing the productivity of tight gas reservoirs, it is imperative to consider multiple factors, including reservoir properties, fracture parameters, permeation effects, and heterogeneity. Building upon the research into the zonal permeation mechanisms of hydraulically fractured gas wells in tight gas reservoirs, this paper establishes a multifactorial and complex productivity calculation method that takes into account the influence of water saturation on permeation mechanisms. This method offers greater precision compared to conventional approaches and forms the basis for predicting the productivity of tight gas reservoirs. It is essential to emphasize that the evaluation of tight gas reservoir productivity is a multifaceted task that necessitates the comprehensive consideration of various factors and parameters.
Our study provides a framework for better understanding these influencing factors and can guide practical exploration and development decisions. Future research endeavors can further refine these models to predict and optimize the productivity of tight gas reservoirs with greater accuracy.
6. Conclusions
Based on the principles of gas permeation theory, an analysis of zonal permeation mechanisms in hydraulically fractured gas wells within tight gas reservoirs has been conducted. The study highlights the influence of high water saturation, a characteristic feature of tight gas reservoirs, on various permeation mechanisms within gas wells. Building upon this foundation, a complex permeation equation for the zonal productivity of hydraulically fractured vertical wells in tight gas reservoirs has been established. Computational results from practical examples demonstrate that the model presented in this paper closely approximates real gas well behavior, offering greater accuracy and reliability compared to existing models.
Using the predictive model for hydraulically fractured vertical wells in tight sandstone gas reservoirs, an analysis of the impact of nine categories of factors on well productivity has been conducted. The results reveal the following: ① When reservoir thickness increases by 66.67%, the unrestricted gas flow rate from the well increases by 59.55%. Additionally, a 400% increase in fracture conductivity leads to a 6.23% increase in unrestricted gas flow rate, while a 200% increase in fracture half-length results in an 11.93% increase in unrestricted gas flow rate. Furthermore, slip flow effects are positively correlated with gas well productivity. ② An increase in reservoir heterogeneity coefficient by 21.42% leads to a 9.57% reduction in gas well productivity. Moreover, HSNDE, SS effects, initiation pressure gradients, and the gas-to-water production ratio are negatively correlated with gas well productivity. ③ Fracture SS has a greater impact on the productivity of hydraulically fractured gas wells compared to reservoir heterogeneity. ④ There are optimal values for fracture conductivity and fracture half-length. ⑤ Water saturation is negatively correlated with slip factors and positively correlated with SS and initiation pressure gradients.
Utilizing the newly established methodology for assessing zonal productivity in tight gas reservoirs with hydraulic fracturing wells, we conducted calculations and analyses of the impact of regional variations in SS and dynamic initiation pressure gradients on well productivity. This study provides robust support for subsequent work, aiding in a better comprehension of reservoir characteristics, the optimization of production operations, and the implementation of measures to maximize recovery rates, ultimately facilitating the efficient extraction of gas reservoir resources.
Author Contributions
Drafting of manuscript and formal analysis, B.W.; writing—review and editing, R.S.; methodology and data curation, Z.Z. and J.D.; supervision and project administration, X.N. and P.N.; funding acquisition, D.D. and Y.C. All authors have read and agreed to the published version of the manuscript.
Funding
This research was funded by National Natural Science Foundation of China (52004217; 52104022); Scientific Research Program Funded by Shaanxi Provincial Education Department (Program No. 22JS030); the Postgraduate Innovation and Practice Ability Development Fund of Xi’an Shiyou University (No. YCS23113030); and the Foundation of State Key Laboratory of Petroleum Resources and Prospecting, China University of Petroleum, Beijing (No. PRP/open-2112). We would like to express our appreciation to the other members of the laboratory for help provided in experiments and language editing.
Data Availability Statement
The experimental data are unavailable due to privacy restrictions.
Conflicts of Interest
The authors declare no conflict of interest.
References
- Brown, N.M.; Dejam, M. Tracer dispersion due to non-Newtonian fluid flows in hydraulic fractures with different geometries and porous walls. J. Hydrol. 2023, 622, 129644. [Google Scholar] [CrossRef]
- Kar, S.; Chaudhuri, A.; Singh, A. Phase field method to model hydraulic fracturing in saturated porous reservoir with natural fractures. Eng. Fract. Mech. 2023, 286, 109289. [Google Scholar] [CrossRef]
- Bosikov, I.I.; Klyuev, R.V.; Mayer, A.V. Comprehensive assessment of hydraulic fracturing technology efficiency for well construction during hydrocarbon production. J. Min. Inst. 2022, 258, 1018–1025. [Google Scholar] [CrossRef]
- Guang, J.I.; Jia, A.; Meng, D. Technical strategies for effective development and gas recovery enhancement of a large tight gas field: A case study of Sulige gas field, Ordos Basin, NW China. Pet. Explor. Dev. 2019, 46, 629–641. [Google Scholar]
- Medici, G.; West, L.J.; Mountney, N.P.; Welch, M. Permeability of rock discontinuities and faults in the Triassic Sherwood Sandstone Group (UK): Insights for management of fluvio-aeolian aquifers worldwide. Hydrogeol. J. 2019, 27, 2835–2855. [Google Scholar] [CrossRef]
- Mitchell, J.; Lyons, K.; Howe, A.M.; Clarke, A. Viscoelastic polymer flows and elastic turbulence in three-dimensional porous structures. Soft Matter 2016, 12, 460–468. [Google Scholar] [CrossRef] [PubMed]
- Zhang, H.; Zhong, Y.; Kuru, E.; Kuang, J.; She, J. Impacts of permeability stress sensitivity and aqueous phase trapping on the tight sandstone gas well productivity—A case study of the Daniudi gas field. J. Pet. Sci. Eng. 2019, 177, 261–269. [Google Scholar] [CrossRef]
- He, J.; Liu, X.; Zhu, X. Experimental study on the two-phase seepage law of tight sandstone reservoirs in Ordos Basin. J. Energy Eng. 2021, 147, 04021056. [Google Scholar] [CrossRef]
- Huo, M.H.; Lan, Y.F.; Yu, Z.H.; Yue, J.A. Calculation Method for the Time of Pressure Change of Tight Sandstone Gas Well to Reach Seepage Boundary. In Proceedings of the International Field Exploration and Development Conference 2020, Chengdu, China, 23–25 September 2020; Springer: Singapore, 2021; pp. 640–648. [Google Scholar]
- Zou, C.; Yang, Z.; He, D.; Wei, Y.; Li, J.; Jia, A.; Chen, J.; Zhao, Q.; Li, Y.; Li, J.; et al. Theory, technology and prospects of conventional and unconventional natural gas. Pet. Explor. Dev. 2018, 45, 604–618. [Google Scholar]
- Sander, R.; Pan, Z.; Connell, L.D. Laboratory measurement of low permeability unconventional gas reservoir rocks: A review of experimental methods. J. Nat. Gas Sci. Eng. 2017, 37, 248–279. [Google Scholar] [CrossRef]
- Weiming, W.E.N.; Shaopeng, Z.H.U.; Mao, L.I. Stress sensitivity features and productivity equations of offshore abnormal high-pressure gas reservoirs: A case study from the Yinggehai Basin. Nat. Gas Ind. 2014, 34, 59–63. [Google Scholar]
- Song, H.; Liu, Q.; Yang, D.; Yu, M.; Lou, Y.; Zhu, W. Productivity equation of fractured horizontal well in a water-bearing tight gas reservoir with low-velocity non-Darcy flow. J. Nat. Gas Sci. Eng. 2014, 18, 467–473. [Google Scholar] [CrossRef]
- Zhang, H.; Wang, L.; Wang, X.; Zhou, W.; Zeng, X.; Liu, C.; Zhao, N.; Wang, L.; Wang, X.; Wang, W. Productivity analysis method for gas-water wells in abnormal overpressure gas reservoirs. Pet. Explor. Dev. 2017, 44, 280–285. [Google Scholar] [CrossRef]
- Huang, X.; Guo, X.; Zhou, X.; Lu, X.; Shen, C.; Qi, Z.; Li, J. Productivity model for water-producing gas well in a dipping gas reservoir with an aquifer considering stress-sensitive effect. J. Energy Resour. Technol. 2019, 141, 022903. [Google Scholar] [CrossRef]
- Bo, N.; Zuping, X.; Xianshan, L.; Zhijun, L.; Zhonghua, C.; Bocai, J.; Xiaolong, C. Production prediction method of horizontal wells in tight gas reservoirs considering threshold pressure gradient and stress sensitivity. J. Pet. Sci. Eng. 2020, 187, 106750. [Google Scholar] [CrossRef]
- Li, J.; Chen, Z.; Wu, K.; Li, R.; Xu, J.; Liu, Q.; Li, X. Effect of water saturation on gas slippage in tight rocks. Fuel 2018, 225, 519–532. [Google Scholar] [CrossRef]
- Cao, R.; Ye, L.; Lei, Q.; Chen, X.; Ma, Y.Z.; Huang, X. Gas-water flow behavior in water-bearing tight gas reservoirs. Geofluids 2017, 2017, 9745795. [Google Scholar] [CrossRef]
- Tian, W.; Li, A.; Ren, X.; Josephine, Y. The threshold pressure gradient effect in the tight sandstone gas reservoirs with high water saturation. Fuel 2018, 226, 221–229. [Google Scholar] [CrossRef]
- Zhu, W.; Liu, Y.; Shi, Y.; Zou, G.; Zhang, Q.; Kong, D. Effect of dynamic threshold pressure gradient on production performance in water-bearing tight gas reservoir. Adv. Geo-Energy Res. 2022, 6, 286–295. [Google Scholar] [CrossRef]
- Li, K.; Horne, R.N. Experimental study of gas slippage in two-phase flow. SPE Reserv. Eval. Eng. 2004, 7, 409–415. [Google Scholar] [CrossRef]
- Herkelrath, W.N.; Moench, A. Laboratory Investigations of the Physics of Steam Flow in a Porous Medium; USGS: Reston, VA, USA, 1982. [Google Scholar] [CrossRef]
- Jones, F.O.; Owens, W.W. A laboratory study of low-permeability gas sands. J. Pet. Technol. 1980, 32, 1631–1640. [Google Scholar] [CrossRef]
- Cornell, D.; Katz, D.L. Flow of gases through consolidated porous media. Ind. Eng. Chem. 1953, 45, 2145–2152. [Google Scholar] [CrossRef]
- Geertsma, J. Estimating the coefficient of inertial resistance in fluid flow through porous media. Soc. Pet. Eng. J. 1974, 14, 445–450. [Google Scholar] [CrossRef]
- Ruth, D.; Ma, H. On the derivation of the Forchheimer equation by means of the averaging theorem. Transp. Porous Media 1992, 7, 255–264. [Google Scholar] [CrossRef]
- Liu, X.; Civan, F.; Evans, R.D. Correlation of the Non-Darcy Flow Coefficient. J. Can. Pet. Technol. 1995, 34, 50–54. [Google Scholar] [CrossRef]
- Guppy, K.H.; Cinco-Ley, H.; Ramey, H.J., Jr. Pressure buildup analysis of fractured wells producing at high flow rates. J. Pet. Technol. 1982, 34, 2656–2666. [Google Scholar] [CrossRef]
- Gldley, J.L. A method for correcting dimensionless fracture conductivity for non-Darcy flow effects. SPE Prod. Eng. 1991, 6, 391–394. [Google Scholar] [CrossRef]
- Fancher, G.H.; Lewis, J.A. Flow of simple fluids through porous materials. Ind. Eng. Chem. 1933, 25, 1139–1147. [Google Scholar] [CrossRef]
- Geertsma, J. The effect of fluid pressure decline on volumetric changes of porous rocks. Trans. AIME 1957, 210, 331–340. [Google Scholar] [CrossRef]
- Wu, J.; Li, Y.; Cao, J.; Lu, D. A study on seepage characteristics and productivity of fractured tight reservoir Chang 3 in Weibei. J. Southwest Pet. Univ. 2021, 43, 136. [Google Scholar]
- Fu, J.; Su, Y.; Li, L.; Wang, W.; Wang, C.; Li, D. Productivity model with mechanisms of multiple seepage in tight gas reservoir. J. Pet. Sci. Eng. 2022, 209, 109825. [Google Scholar] [CrossRef]
- Zhaopeng, Y.; Zhiwei, W.; Yinghua, L.; Heng, Y.; Tianyuan, L. Effect of connate water on stress sensitivity of tight gas reservoirs. Energy Sources Recovery Util. Environ. Eff. 2021, 43, 1227–1241. [Google Scholar] [CrossRef]
- Miller, R.J.; Low, P.F. Threshold gradient for water flow in clay systems. Soil Sci. Soc. Am. J. 1963, 27, 605–609. [Google Scholar] [CrossRef]
- Zafar, A.; Su, Y.L.; Li, L.; Fu, J.G. Tight gas production model considering TPG as a function of pore pressure, permeability and water saturation. Pet. Sci. 2020, 17, 1356–1369. [Google Scholar] [CrossRef]
- Wang, Y.; Long, Y.; Sun, Y.; Zhang, S.; Song, F.; Wang, X. Threshold Pore Pressure Gradients in Water-Bearing Tight Sandstone Gas Reservoirs. Energies 2019, 12, 4578. [Google Scholar] [CrossRef]
- Wang, J.; Zhou, F.J. Cause analysis and solutions of water blocking damage in cracked/non-cracked tight sandstone gas reservoirs. Pet. Sci. 2021, 18, 219–233. [Google Scholar] [CrossRef]
- Zhao, Y.; Liu, X.; Zhang, L.; Tang, H.; Xiong, Y.; Guo, J.; Shan, B. Laws of gas and water flow and mechanism of reservoir drying in tight sandstone gas reservoirs. Nat. Gas Ind. B 2021, 8, 195–204. [Google Scholar] [CrossRef]
- Liu, X.; Kang, Y.; Luo, P.; You, L.; Tang, Y.; Kong, L. Wettability modification by fluoride and its application in aqueous phase trapping damage removal in tight sandstone reservoirs. J. Pet. Sci. Eng. 2015, 133, 201–207. [Google Scholar] [CrossRef]
- Lei, G.; Dong, P.; Cai, Z.; Zhang, Z.; Dong, R.; Yang, S.; Cao, N. Gas-water relative permeability of tight sandstone gas reservoirs. Zhongnan Daxue Xuebao (Ziran Kexue Ban)/J. Cent. South Univ. (Sci. Technol.) 2016, 47, 2701–2705. [Google Scholar]
- Shanley, K.W.; Cluff, R.M.; Robinson, J.W. Factors controlling prolific gas production from low-permeability sandstone reservoirs: Implications for resource assessment, prospect development, and risk analysis. AAPG Bull. 2004, 88, 1083–1121. [Google Scholar] [CrossRef]
Figure 1.
A schematic representation of changes in rock pore structure as the water saturation level increases.
Figure 1.
A schematic representation of changes in rock pore structure as the water saturation level increases.
Figure 2.
The impact of increased water saturation on the pore structure of tight sandstone. (The arrow is the direction of interfacial tension).
Figure 2.
The impact of increased water saturation on the pore structure of tight sandstone. (The arrow is the direction of interfacial tension).
Figure 3.
The physical flow model of hydraulic fracturing wells.
Figure 3.
The physical flow model of hydraulic fracturing wells.
Figure 4.
Diagram illustrating the division of horizontal flow field in hydraulic fracturing wells. (Arrows indicate the direction of fluid flow).
Figure 4.
Diagram illustrating the division of horizontal flow field in hydraulic fracturing wells. (Arrows indicate the direction of fluid flow).
Figure 5.
Conceptual diagram of elliptical flow field within the formation.
Figure 5.
Conceptual diagram of elliptical flow field within the formation.
Figure 6.
Relative permeability curve of gas–water phases in the reservoir formation.
Figure 6.
Relative permeability curve of gas–water phases in the reservoir formation.
Figure 7.
The curve representing the relative permeability ratio of gas–water phases in the reservoir formation.
Figure 7.
The curve representing the relative permeability ratio of gas–water phases in the reservoir formation.
Figure 8.
The relative permeability curve of gas–water phases within fractures.
Figure 8.
The relative permeability curve of gas–water phases within fractures.
Figure 9.
The variation curve of gas viscosity−to−density ratio with reservoir pressure changes.
Figure 9.
The variation curve of gas viscosity−to−density ratio with reservoir pressure changes.
Figure 10.
Comparison chart of gas–water two-phase IPR curves obtained using different calculation methods.
Figure 10.
Comparison chart of gas–water two-phase IPR curves obtained using different calculation methods.
Figure 11.
IPR curve diagrams for different reservoir thicknesses.
Figure 11.
IPR curve diagrams for different reservoir thicknesses.
Figure 12.
The curve depicting changes in gas well production with varying reservoir thickness.
Figure 12.
The curve depicting changes in gas well production with varying reservoir thickness.
Figure 13.
IPR curves under different fracture conductivity conditions.
Figure 13.
IPR curves under different fracture conductivity conditions.
Figure 14.
The curve depicting the variation in gas well production with changes in fracture conductivity.
Figure 14.
The curve depicting the variation in gas well production with changes in fracture conductivity.
Figure 15.
IPR curves under different fracture half-lengths.
Figure 15.
IPR curves under different fracture half-lengths.
Figure 16.
The curve showing the variation in gas well production with fracture half-length.
Figure 16.
The curve showing the variation in gas well production with fracture half-length.
Figure 17.
The impact of DTPG on gas well productivity under different WRG.
Figure 17.
The impact of DTPG on gas well productivity under different WRG.
Figure 18.
IPR curves considering HSNDE and not considering HSNDE.
Figure 18.
IPR curves considering HSNDE and not considering HSNDE.
Figure 19.
The IPR curves of gas slip flow effects considering water saturation on gas well productivity under different WRGs.
Figure 19.
The IPR curves of gas slip flow effects considering water saturation on gas well productivity under different WRGs.
Figure 20.
IPR curves of formation SS and gas well productivity under different WRGs.
Figure 20.
IPR curves of formation SS and gas well productivity under different WRGs.
Figure 21.
IPR curves of fracture SS and gas well productivity under different WRG conditions.
Figure 21.
IPR curves of fracture SS and gas well productivity under different WRG conditions.
Figure 22.
Effect of zonal SS on gas well productivity.
Figure 22.
Effect of zonal SS on gas well productivity.
Figure 23.
IPR curves for hydraulically fractured vertical wells under different non-uniformity coefficients.
Figure 23.
IPR curves for hydraulically fractured vertical wells under different non-uniformity coefficients.
Figure 24.
The figure of gas well production variation with non-homogeneity coefficient.
Figure 24.
The figure of gas well production variation with non-homogeneity coefficient.
Table 1.
Under different proppants, m, n value table.
Table 1.
Under different proppants, m, n value table.
| Proppant Size (mm) | a | b |
|---|
| 2.12~3.18 | 1.21 | 3.23 |
| 1.27~2.54 | 1.34 | 2.63 |
| 0.64~1.27 | 1.65 | 1.65 |
| 0.42~0.64 | 1.60 | 1.10 |
Table 2.
The gas–water two-phase relative permeability corresponding to different WRGs.
Table 2.
The gas–water two-phase relative permeability corresponding to different WRGs.
| WRG/(m3/104 m3) | Water Saturation | Gas Phase Relative
Permeability | Water Phase Relative Permeability |
|---|
| 1.5 | 72% | 0.095 | 0.22 |
| 1.0 | 65% | 0.18 | 0.20 |
| 0.5 | 58% | 0.20 | 0.18 |
| Disclaimer/Publisher’s Note: The statements, opinions and data contained in all publications are solely those of the individual author(s) and contributor(s) and not of MDPI and/or the editor(s). MDPI and/or the editor(s) disclaim responsibility for any injury to people or property resulting from any ideas, methods, instructions or products referred to in the content. |
© 2023 by the authors. Licensee MDPI, Basel, Switzerland. This article is an open access article distributed under the terms and conditions of the Creative Commons Attribution (CC BY) license (https://creativecommons.org/licenses/by/4.0/).


