Article

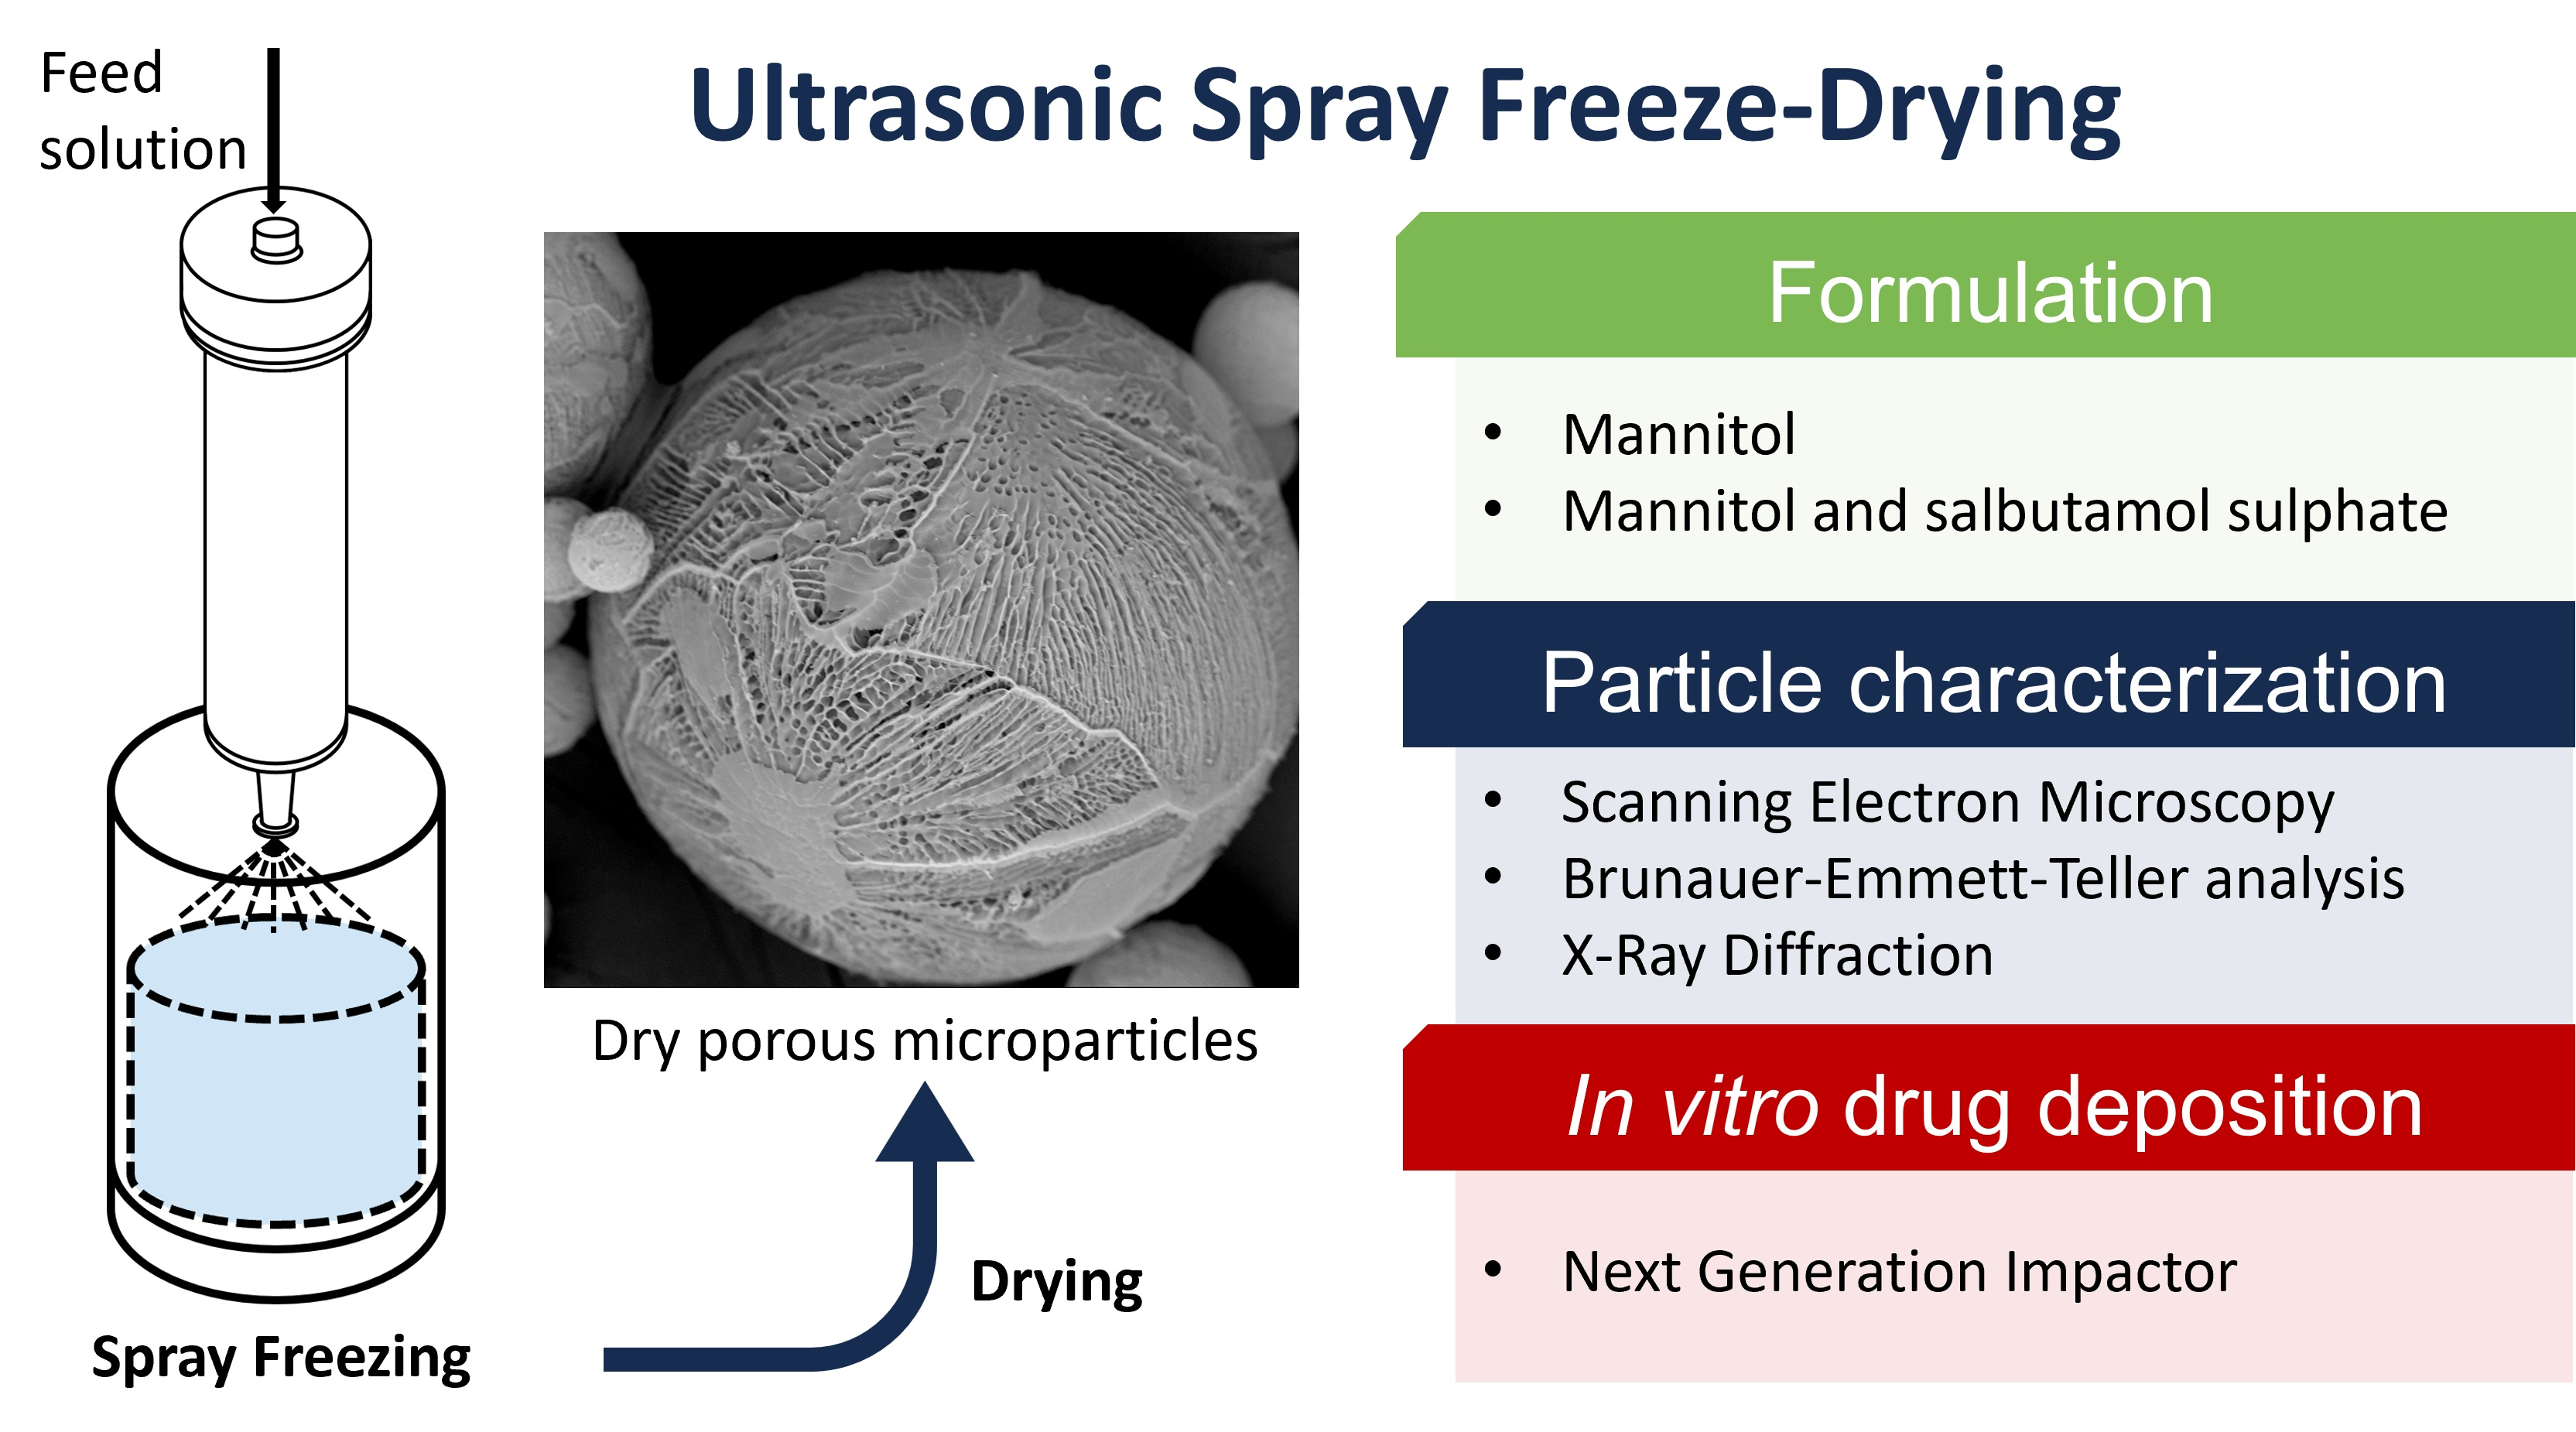
Tailoring Dry Microparticles for Pulmonary Drug Delivery: Ultrasonic Spray Freeze-Drying with Mannitol and Salbutamol Sulphate

1
Department of Applied Science and Technology, Politecnico di Torino, 24 Corso Duca Degli Abruzzi, 10129 Torino, Italy
2
R&D Department, Chiesi Farmaceutici S.p.A, Largo F. Belloli 11/A, 43122 Parma, Italy
*
Author to whom correspondence should be addressed.
These authors contributed equally to this work.
Processes 2023, 11(11), 3096; https://doi.org/10.3390/pr11113096
Submission received: 29 September 2023 / Revised: 21 October 2023 / Accepted: 26 October 2023 / Published: 27 October 2023

Abstract

:
Spray freeze-drying has emerged as a valid alternative to traditional spray drying to produce therapeutic dry microparticles. In particular, the spherical shape and high porosity of spray freeze-dried microparticles make them suitable for pulmonary drug delivery through dry powder inhalers. However, an appropriate particle size and fine particle fraction are required to guarantee lung deposition. This study used ultrasonic spray freeze-drying to generate dry microparticles composed of mannitol either alone or added with the bronchodilator salbutamol sulphate. The influence of the solid concentration and the feed flow rate on the particle size, morphology, surface area, porosity, and crystallinity was investigated. Growing particle size was observed, increasing the concentration and feed flow rate. Similarly, the addition of the drug led to a larger particle size and surface area. The in vitro simulation of drug deposition highlighted the dependence of the aerodynamic properties on the solid concentration and feed flow rate. Due to the lower density and particle geometric size, the highest fine particle fraction (26%) and smallest mass median aerodynamic diameter (4.4 μm) were reached at the lowest solid concentration and feed flow rate.

Graphical Abstract

1. Introduction

The pulmonary delivery of drugs is attracting widespread interest in the pharmaceutical field for the treatment of both respiratory and systemic diseases. The high targeting efficiency, low drug dose required, and huge alveolar surface area available for drug absorption represent the main striking features of inhalation therapy. Moreover, the therapeutic effectiveness of drugs is enhanced by pulmonary administration since first-pass metabolism is bypassed [1,2,3]. Both liquid and solid formulations are used for inhalation treatments, the former being delivered through nebulisers and pressurised metered-dose inhalers and the latter through dry powder inhalers (DPIs) [4]. Inhalable dry powders are emerging as the most advantageous formulation owing to their long-term stability and sterility [5,6]. However, an efficient drug deposition must be ensured to make pulmonary delivery effective [2,7]. Size, density, shape, and charge are the main factors affecting the deposition of particles in the lung, which also depends on their aerodynamic properties [8]. The key feature of these particles is their aerodynamic diameter ( d ae ), which is the diameter of a sphere with unitary mass density and the same settling velocity as the particle of interest [9]. In order to effectively reach the deepest regions of the lung, inhaled particles should possess  d ae  between 1 and 5 µm, ensuring optimal flowability [10,11].
The mass median aerodynamic diameter (MMAD) and geometric standard deviation (GSD) are commonly used to characterise a powder-based aerosol. MMAD defines the particle size with respect to which half of the powders is smaller and the other half is larger, while GSD quantifies the degree of variability of particle diameters with respect to the MMAD [4]. The efficiency of deposition is described by the fine particle fraction (FPF), which represents the fraction of particles with an aerodynamic size below 5 µm [12].
Inhalable fine powders can be produced by means of several techniques, including milling [13], spray-drying (SD) [14], spray freeze-drying (SFD) [15], thin film freezing [16], and supercritical fluid technology [17]. SFD is a promising approach consisting of three steps, i.e., atomisation, freezing, and drying [18]. During the first two stages, a solution of drug and excipients is fed to a nozzle, atomised in small droplets, and rapidly frozen using liquid nitrogen [19]. The atomisation step is responsible for the final particle size and shape [20] and can be performed by pneumatic [21] and ultrasonic [22,23] nozzles. Among the different types of atomisers, ultrasonic ones offer high control of size distribution and an efficient entrapment of particles in liquid nitrogen [24]. Freezing promotes the formation of ice crystals, which sublime during drying, giving the particles a porous structure [25]. The high porosity of spray freeze-dried particles allows for the reduction of particle density, dramatically improving the aerodynamic properties.
Additionally, SFD can be exploited to increase the dissolution of poorly water-soluble drugs owing to the high surface area of the final particles [26]. Various studies highlighted the superiority of SFD over SD for the generation of inhalable particles with unique aerosolization features and perfect spherical shape [27]. SFD can also be preferred to SD for thermolabile substances (i.e., biopharmaceuticals) since low temperatures are involved and thermal degradation is less likely to occur [28]. Moreover, the biomolecular structure is protected from phase separation since the crystallisation of excipients, solutes partitioning, and pH changes are reduced due to the high freezing rate [18,26,29,30]. Consequently, the drug is efficiently embedded into the excipient, increasing both the API bioavailability and the aerodynamic properties of particles [30]. Also, the excipient is well distributed into SFD particles owing to the limited diffusion of solute within droplets [31] [32].
SFD has been used in the formulation of different drugs for pulmonary delivery, including rizatriptan benzoate [29], voriconazole [33], cyclosporine A [32], clarithromycin [15], budesonide [34], proteins [22,35], and small interfering RNA [36]. This technique is especially suitable for generating carrier-free inhalable particles, an attractive formulation which does not require a coarse carrier (lactose) to have adequate flowability. Among these formulations, increasing interest has been given to large porous particles (LPPs), i.e., particles with low density ( ~ 0.1 g/cm3) and large geometric diameter (5–30 µm), which possess outstanding aerodynamic performance and reduced macrophage uptake [37]. Although LPPs are commonly obtained by SD, the possibility of producing these particles via SFD has been explored [30].
In this work, porous microparticles (MPs) of mannitol were produced by ultrasonic SFD. Mannitol is one of the most-used excipients in SFD since it is easy to lyophilise and, having a high mannitol-ice eutectic temperature, the drying temperature can be increased without inducing macroscopic collapse [36,38]. Additionally, the formation of a crystalline mannitol structure during freezing enhances powders’ stability in DPIs [36]. This study aimed to comprehensively analyse SFD mannitol MPs, investigating the impact of the solid concentration and feed flow rate on MPs’ morphology, size, porosity, and crystallinity. The variation of such properties was also assessed upon the addition of salbutamol sulphate (SAS), a bronchodilator commonly used for the treatment of asthma. Furthermore, the aerodynamic behaviour of SAS-mannitol MPs was evaluated to assess their suitability for inhalation purposes. To the best of the authors’ knowledge, this study introduces for the first time the production of SAS-loaded MPs via ultrasonic SFD.

2. Materials and Methods

2.1. Solution Preparation

To produce spray freeze-dried MPs, different solutions containing D-mannitol (C6H14O6, 98+%. Chem-Lab NV, Zedelgem, Belgium) at a concentration of 5, 10, 15, and 20% (w/w) were prepared using bidistilled water. Some of these formulations (5, 10, and 15%) were further tested by adding 1% (w/w) of SAS (C13H21NO3·0.5H2SO4, Teva Pharmaceutical Industries Ltd., Petah Tikva, Israel) to the mannitol solution.

2.2. Spray Freeze-Drying

This study used spray freezing into vapour over liquid at different feed flow rates (1, 2.5, 5, 7.5, and 10 mL min−1) to produce frozen MPs. A syringe pump (Model KDS 200, KD Scientific, Holliston, MA, USA) was used to deliver the solution to an ultrasonic nozzle (60-kHz atomising frequency, Buchi, Flawil, Switzerland) placed at approximately 7–10 cm above a Dewar containing liquid nitrogen. A magnetic stirrer was placed inside the Dewar to maintain the sprayed MPs under gentle agitation. After SF, frozen MPs were collected into a beaker, covered with a Phase Separator 1 PS (Whatman, Maidstone, UK), and put into a freeze-dryer precooled at −50 °C. Primary drying was conducted at 10 °C and 20 Pa until the unitary ratio between the pressures detected by a Pirani and a capacitance (Baratron®, MKS, Andover, MA, USA) manometer had been reached. Secondary drying was performed at 20 °C and 20 Pa for 5 h. Afterwards, the resulting dried powders were inserted into vials, which were sealed and stored over silica gel in a desiccator at room temperature.

2.3. Morphological Characterisation

Scanning electron microscopy (SEM) was employed to analyse particle size and morphology. To this end, powders were first spread over the surface of double-sided carbon tape (NEM TAPE, Nisshin Ltd., Tokyo, Japan), stuck on top of an aluminium stub, and then coated with platinum for 20 s at 30 mA with a sputter coater Quorum Q150T S (2M Instruments, Rome, Italy). Image acquisition was performed at 15 kV voltage using a Desktop SEM Phenom XL (Waltham, MA, USA). These images were then used to determine the geometric particle size by means of open-source ImageJ software (NIH, Bethesda, MD, USA) by measuring the diameter of 200 MPs. The particles’  d ae  was calculated as follows:
d ae = d g ρ ρ a λ
where  d g  is the particle geometric diameter,  ρ  is the particle mass density,  ρ a  is the unitary mass density (1 g cm−3), and  λ  is the shape factor (assumed as equal to 1). To assess the homogeneity of the powders, the span value was also calculated as follows:
Span   =   D 90 D 10 D 50
where  D 90 D 10 , and  D 50  are the diameters at 90%, 10%, and 50% of the particle size distribution.

2.4. Surface Area and Pore Size Analysis

MPs’ surface area and porosity were determined using the gas physisorption equilibrium isotherms of nitrogen. The analysis was carried out with Micromeritics ASAP 2020 (Micromeritics Instrument Corporation, Norcross, GA, USA). Around 200 mg of powder was inserted into a glass sample tube and degassed at 40 °C for 3 h. Subsequently, the analysis was performed at 77 K using gaseous nitrogen as an adsorbate. The Brunauer–Emmett–Teller theory (BET) was used to estimate the specific surface area as follows:
a s   =   n m a La m m
where  a s  is the specific surface area of the adsorbent,  n m a  is the monolayer capacity,  L  is the Avogadro constant,  a m  is the molecular cross-sectional area occupied by the adsorbate in the monolayer, and  m    is the mass of the adsorbent. Instead, the pore size distribution was calculated through the Barrett–Joyner–Halenda (BJH) method, based on the Kelvin equation, which combines the pore radius with the adsorption at a relative pressure.

2.5. X-ray Diffraction

The polymorphism of mannitol was assessed by X-ray diffraction (XRD) using an X-ray diffractometer (Empyrean, Malvern Panalytical, Malvern, UK) working at 40 mV and 40 mA. The powders were pressed into an aluminium sample holder plate and analysed between 5° and 60° with a 2 θ  step size of 0.026°. The diffraction patterns were then analysed via the X’pert Highscore software (Malvern Panalytical, Malvern, UK). For each condition, the ratio among the peaks at 22.06° and 23.4° was evaluated as follows:
Peak   ratio   =   I 22.06 ° I 23.4 °
where  I 22.06 °  and  I 23.4 °  represent the intensity of the peak at 22.06° and 23.4°, respectively.

2.6. In Vitro Drug Deposition

The aerosolization properties and in vitro drug deposition of powders containing SAS were determined by means of a Next Generation Impactor (NGI) (Copley, Nottingham, UK) connected to a critical flow controller TPK (Copley, Nottingham, UK) and a rotary pump SCP5 (Copley, Nottingham, UK). For each sample, a hydroxypropyl methylcellulose capsule (Vcaps Plus, size 3, transparent cap and body, Capsugel®, Lonza Group, Basilea, Switzerland) was manually filled with the powder and inserted into a high-resistance RS01® DPI device (RPC Plastiape®, Osnago, Italy). Before each dispersion, the stages of the NGI were covered with 1% Tween® 20 to avoid particle bounce and 15 mL of water was poured into the pre-separator, as recommended by the British Pharmacopeia. Dispersions were performed in triplicate at 60 L/min for 3.8 s for each condition. After dispersion, the powders were recovered from the device (capsule, inhaler, and adapter), induction port (IP), pre-separator (PRE), NGI cups (S1–S7), and micro-orifice collector (MOC) by rinsing with 25, 50, 100, 10, and 10 mL of water, respectively. The solutions obtained from the MOC were filtered with a 0.45 µm PTFE filter. Then, each solution was assayed by high-pressure liquid chromatography (Acquity UPLC®, Waters, Milford, CT, USA) and data were analysed with the Copley Inhaler Testing Data Analysis software (CITDAS) (Copley, Nottingham, UK). The recovered dose (RD) was calculated as the sum of the SAS mass detected in the device and NGI apparatus. The recovered fraction (RF) was determined by dividing the RD by the mass of powder initially inserted into the capsule. The emitted fraction (EF) was defined as the fraction of particles collected in the NGI with respect to the RD. The fine particle dose (FPD) refers to the mass of powders with a  d ae  less than 5 µm, while the ratio between FPD and RD gave the fine particle fraction (FPF). The MMAD and the GSD were calculated by CITDAS from the particle size distributions.

2.7. Statistical Analysis

Data were plotted as means ± standard deviations. The two-way analysis of variance (ANOVA) tool of the SIGMA Plot software’s data analysis package was used to compare the  d g  and  d ae  obtained from the SEM images. p ≤ 0.05 and p ≤ 0.001 were considered significant.

3. Results and Discussion

3.1. Particle Size and Morphology

The morphology of MPs for different mannitol concentrations and feed flow rates was observed from the SEM images, reported in Figure 1.
In accordance with previous studies [35,36,39], SFD MPs appeared as highly porous spheres and this structure was maintained for all the investigated conditions. The high porosity is ascribable to the high freezing rate reached during the process, which induces the formation of small ice crystals and, hence, small pores, in great numbers [25]. Although most MPs occurred as individual spheres, some joint MPs were formed, probably as the result of the increasing flow rate. In fact, during SFD, sprayed droplets can collide, providing enough activation energy to induce instantaneous freezing [26]. At increasing flow rates, the probability of collision grows since the time required for atomisation is reduced and a larger number of particles stuck together can be observed. Although the operative conditions did not influence the shape of particles, particle structure was affected by the formulation. As evidenced in Figure 1, at low mannitol concentrations, MPs had a more open structure and a rougher surface compared to high solid content, leading to the breakage of the spheres. By contrast, higher solid content resulted in powders with higher particle density and, consequently, in more compact MPs, ones that were less prone to disruption. In such conditions, the surface looked closer and with few void spaces, pointing out the well-known influence of the solid concentration on the porosity of MPs produced by ultrasonic SFD [24,32,36]. Moreover, the borders of the spherical MPs appeared to be more defined as the mannitol concentration increased.
It is known that in ultrasonic SFD, the particle size distribution mainly depends on the frequency of the atomiser and the feed flow rate, while the concentration of solids in an SFD solution has a limited effect [18,24]. In this study, the influence of both the feed flow rate and the solid concentration on particle size was investigated and the statistical significance of its effects was assessed through a two-way ANOVA (Table S1). Figure 2 displays the results of the measured  d g   and calculated  d ae  in terms of mean ± standard deviation of the particle size distribution. Overall, both the feed flow rate and the solid concentration had a statistically significant effect on particle size (p < 0.001). However, the intensity of these effects varied depending on the type of diameter, i.e., geometric or aerodynamic.
The  d g  showed a statistically significant increase at a growing feed flow rate (Table S1). In fact, increasing the flow rate led to a mean particle size growing from 32 to 53 µm at 5% (w/w) mannitol, from 34 to 58 µm at 10% (w/w) mannitol, from 33 to 57 µm at 15% (w/w) mannitol, and from 36 to 68 µm at 20% (w/w) mannitol. The growing flow rate was responsible for the thickening of the liquid film that formed on the vibrating tip of the ultrasonic nozzle prior to atomisation, causing a larger  d g  [39]. The ANOVA highlighted statistically significant differences among the mean  d g  obtained at equal solid content, except for some values associated with the flow rates closest to each other, i.e., 10 and 7.5 or 2.5 and 1 mL/min. This clear dependence of the particle size on the feed flow rate was also detectable from the SEM images shown in Figure 1 and this was consistent with results from previous studies [39]. The same trend could be detected also for the  d ae  (Figure 2B), being directly proportional to the  d g  (Equation (1)). However, the differences between mean  d ae  were flattened by the mathematical calculation, resulting in less statistically significant differences at constant solid concentrations. Besides the feed flow rate, the concentration of solids in the SFD solution also played a role in both the geometric and aerodynamic size of MPs (p < 0.001). In both cases, an increase in the mean particle size was detected at growing solid concentrations. However, for the  d g , this phenomenon was less visible: p < 0.001 for 20% vs. 5%, 20% vs. 10%, 15% vs. 10%, and 10% vs. 5%; p = 0.013 for 20% vs. 15%; and the comparison between 15% and 10% had no statistically significant difference (p = 0.375). The slight increase in the  d g    with the solid content was probably due to the increasing viscosity of the solution [39]. Conversely, the increase of the  d ae  at growing solid concentrations was more pronounced than that of  d g  (p < 0.001 for all the comparisons) due to the dependence of the  d ae  on the particle’s mass density (Equation (1)). These results suggested that reducing the feed flow rate and concentration of the solution during ultrasonic SFD could be a successful approach to obtaining MPs with a small size and enhanced uniformity, which are essential requirements for inhalable powders in DPIs. However, this approach had some limitations since the MPs’ structures were prone to rupturing at very low flow rates and concentrations, e.g., 5% (w/w) and 1 mL/min. Figure 3 illustrates the particle size distributions and span values in reference to the  d g .
The powders produced at low flow rates (1–2.5 mL/min) displayed narrow particle size distributions and low span values, indicating a high uniformity of the powders’ size. Instead, an increase in the span value and progressively wider distributions could be observed when increasing the feed flow rate.
The previous results demonstrated the dependence of particles’ size and structure on the concentration and flow rate of the solution fed to the ultrasonic nozzle. Thus, some of the mannitol formulations were added with 1% (w/w) of SAS to evaluate the effect of the drug addition. In detail, three concentrations were chosen, i.e., 5, 10, and 15% (w/w), to assess the impact of the solid concentration. Furthermore, two boundary speeds (1 and 10 mL/min) were chosen at a 5% (w/w) concentration to investigate the contribution of the feed flow rate. The impacts of the addition of SAS to the formulation on morphology and particle size are reported in Figure 4, Figure 5 and Figure 6.
MPs containing SAS maintained the shape and porous structure typical of SFD (Figure 4). Furthermore, the observations made regarding the size increase as a function of the flow rate and the influence of the solid content on the surface porosity were respected. The particle size distributions associated with the  d g  of particles added with SAS showed the same shape observed without the drug (Figure 5). However, a more defined structure, higher surface closeness, and increased surface smoothness were found in the presence of the drug (Figure 4). Moreover, MPs embedding the drug displayed a significant increase in their mean sizes compared to bare mannitol. In fact, a statistically significant increase of  d g   (Figure 6A) and  d ae   (Figure 6B) was detected when comparing SAS-containing MPs and SAS-free MPs produced at different concentrations of mannitol (5, 10, and 15% w/w) and at 1 mL/min (Figure 5A). Conversely, no statistically significant difference was highlighted between the  d g    (Figure 6C) and  d ae    (Figure 6D) of MPs produced at 10 mL/min (Figure 6C).

3.2. Particle Surface Area and Porosity

Table 1 reports the surface area of MPs and their porosity estimated using the BET and BJH methods, respectively. The formulation composed of mannitol alone exhibited a BET surface area in a range between 5.52 ± 0.05 and 10.10 ± 0.11 m2 g−1 and BJH adsorption pore size between 9.8 and 14.5 nm. The change in the surface area could be attributed to the formation of different mannitol polymorphs during the freezing step [40].
The BET isotherm appeared to have a “Type IV” shape for all the investigated conditions, meaning that nitrogen adsorbed on the surface of the MPs, forming an initial monolayer, which then became a multilayer [41]. The adsorption process ended with the capillary condensation of nitrogen in pores as evidenced by the presence of a hysteresis in the isotherm plot. The shape of this hysteresis gave information about the pore shape [41], which appeared to be “ink-bottle”. Furthermore, the “Type IV” isotherm is typical for mesoporous particles, i.e., particles with a pore size in the range 2–50 nm [41], which is coherent with the pore size obtained in this study.
Table 1 shows that the addition of SAS dramatically increased the surface area of mannitol MPs up to values between 21.62 ± 0.10 and 23.86 ± 0.09 m2 g−1. This outcome was highly consistent with the previous findings of Niwa et al. [42]. Furthermore, the increase in the surface area was coherent with the pronounced surface closeness observed in SEM images (Figure 4) and could be associated with the formation of a different mannitol polymorph during freezing. Conversely, the pore size remained between 10.0 and 10.9 nm, suggesting that this parameter was probably independent of the presence of SAS. It is known that in SFD, the dimension of pores is settled by the freezing rate and these two parameters are linked by an inversely proportional relation [25]. Therefore, the constant freezing rate chosen for all experiments may have been the reason for the unvaried pore size.

3.3. Crystalline Properties of Particles

As previously discussed, the crystalline behaviour of mannitol might have been responsible for the variation in the BET surface area. At least four mannitol polymorphs, i.e., anhydrous α, β, and δ and hemihydrate, are found in nature and they can be distinguished according to the different shapes of their XRD spectra [43]. Moreover, each polymorph is associated with a specific surface area, e.g., 8.54 m2 g−1 for α-mannitol, 0.37 m2 g−1 for β-mannitol, and 1.01 m2 g−1 for δ-mannitol [40]. In this study, the crystallinity of mannitol was studied by XRD and the results are shown in Figure 7.
The shape of the spectra was not affected either by the formulation or the flow rate, and the presence of a significant peak at 9.7° (2 θ ) suggested that δ-mannitol was the prevalent polymorph for all the investigated conditions. This outcome was consistent with outcomes of previous studies, where a transition from stable β-mannitol to δ-mannitol was observed as a consequence of the high freezing rate involved in SFD [38]. As evidenced in Figure 7, spectra also displayed the presence of β-mannitol (14.6°, 23.4°) and traces of α-mannitol (13.6°), while no amorphous mannitol was formed during freezing. Despite the unvaried profile of XRD spectra, a variation in the intensity of peaks as a function of mannitol concentration could be detected at 2 θ  equal to 9.7° (δ), 22.06° (δ), and 23.4° (β). Indeed, it is widely accepted that the polymorphism of mannitol in SFD depends on the solute concentration as well as the freezing rate [38]. Since XRD is rather a qualitative analysis than a quantitative one, the quantity of a specific polymorph after SFD was not directly measured. However, the ratio between the δ-peak at 22.06° and the β-peak at 23.4° was used to depict the variation in the polymorph content. As presented in Table 1, this ratio increased for growing mannitol content, suggesting a larger prevalence of δ-mannitol over β-mannitol.
This dependence of the polymorphism on the solid content was confirmed by the presence of SAS, whose addition did not affect the shape of the spectra (Figure 7). Instead, the presence of SAS induced higher ratios between the δ-peak at 22.06° and the β-peak at 23.4° with respect to the spectra obtained by SAS-free powders (Table 1). This increase suggested that the formation of δ-mannitol was highly promoted by the addition of SAS to the initial formulation. Since δ-mannitol has a higher surface area than β-mannitol, this outcome was consistent with the relevant increase in the surface area observed in MPs containing SAS (Table 1).

3.4. In Vitro Aerodynamic Properties of Particles

The in vitro deposition and the aerosol performance were evaluated by NGI tests for powders containing 1% (w/w) of SAS. Table 2 lists the aerodynamic properties of MPs as a function of EF, FPF, MMAD, and GSD for four conditions, i.e., 5% (w/w) solid produced at 1 and 10 mL/min and 10% (w/w) solid and 15% (w/w) solid both produced at 1 mL/min. Similar values of EF were obtained for each powder, pointing out their equal propensity to be dispensed from the device. Instead, a considerable reduction of FPF from 26 ± 3% to 9.9 ± 1.3% was observed when switching from a 5% (w/w) to a 15% (w/w) solid concentration. According to Equation (1), the increasing solid content induced growing particle density, promoting higher  d ae  and, hence, lower FPF. When increasing the solid concentration, the MMAD went from 4.4 ± 0.2 µm to 6.0 ± 0.3 µm for the same reason, while the GSD remained around 1.7, indicating polydisperse aerosols. However, the powders produced at 10% (w/w) and 15% (w/w) showed similar FPF and MMAD. These results were coherent with the in vitro deposition profiles of MPs, reported in Figure 8.
These profiles were based on the mass of SAS recovered from the device, adapter, and capsule (DEV); IP; PRE; S1–S7; and MOC. In all samples, the major fraction of MPs was retained in DEV, IP, and PRE, suggesting the large presence of non-inhalable MPs in the powder. The percentage of MPs in the NGI cups was around 35.6%, 37.4%, 23.8%, and 23.7% at 5% (w/w) and 1 mL/min, 5% (w/w) and 10 mL/min, 10% (w/w) and 1 mL/min, and 15% (w/w) and 1 mL/min, respectively.
Among the four investigated conditions, the combination of a 5% (w/w) solid and 1 mL/min feed flow rate resulted in the highest quantity of powders recovered in the NGI cups, the highest FPF, and the lowest MMAD. This outcome provides a basis for the development of SAS-based MPs for inhalation therapies through ultrasonic SFD. Further improvement of these aerodynamic properties could be realised by increasing the atomisation frequency of the ultrasonic nozzle. Solid concentrations smaller than 5% (w/w) would lead to excessively fragile MPs and feed flow rates below 1 mL/min would require longer atomisation times, increasing the probability of nozzle clogging.

4. Conclusions

This paper proved the suitability of ultrasonic SFD to produce novel spherical porous MPs of mannitol and SAS. An increase in the MPs’  d g  occurred at a growing feed flow rate and, in smaller amounts, mannitol concentration. Instead, the increase in the  d ae  was highly related to the solid content, the  d ae  being dependent on particle density. Furthermore, a higher mannitol concentration generated a superior amount of δ mannitol with respect to the other polymorphs. The addition of 1% (w/w) of SAS to the formulation resulted in MPs with a larger size and surface area and higher δ mannitol content, as well as better shape definition. The in vitro simulation of SAS deposition highlighted decreasing MMAD and growing FPF at increasing solid contents and feed flow rates, up to 4.4 μm and 26%, respectively. Overall, reducing both the solid content and the feed flow rate could decrease the MPs’ size and density, improving their aerodynamics. However, further studies are required to align these aerodynamic properties to the pulmonary delivery requirements of SAS-based mannitol MPs.

Supplementary Materials

The following supporting information can be downloaded at https://www.mdpi.com/article/10.3390/pr11113096/s1: Table S1: Statistical analysis of the two graphs in Figure 2 using the two-way ANOVA test based on the geometric and aerodynamic diameters.

Author Contributions

Conceptualization, L.P., F.S., T.L., A.S., T.G. and R.P.; methodology, L.P., F.S., T.L., A.S. and R.P.; validation, L.P.; formal analysis, L.P., F.S. and T.L.; investigation, L.P., F.S. and R.C.; resources, A.S., T.G. and R.P.; data curation, L.P. and F.S.; writing—original draft preparation, L.P. and F.S.; writing—review and editing, L.P., F.S., T.L., A.S., T.G. and R.P.; visualization, L.P. and F.S.; supervision, A.S. and R.P.; project administration, T.G. and R.P.; funding acquisition, T.G. and R.P. All authors have read and agreed to the published version of the manuscript.

Funding

This publication is part of the project PNRR-NGEU, which has received funding from the MUR—DM352/2022. This research was funded by Chiesi Farmaceutici S.p.A.

Data Availability Statement

Data not available.

Acknowledgments

The authors are grateful to Giorgia Montalbano, Mattia Pagani, and Angelo Carini for training us in the use of SEM, BET, and NGI, respectively.

Conflicts of Interest

Lorena Pasero holds a Doctorate Studentship and collaborates with Chiesi Farmaceutici S.p.A as part of her PhD training. Adamo Sulpizi and Tomaso Guidi are employees of Chiesi Farmaceutici S.p.A. All authors declare no conflict of interest.

References

  1. Newman, S.P. Delivering drugs to the lungs: The history of repurposing in the treatment of respiratory diseases. Adv. Drug Deliv. Rev. 2018, 133, 5–18. [Google Scholar] [CrossRef]
  2. Newman, S.P. Drug delivery to the lungs: Challenges and opportunities. Ther. Deliv. 2017, 8, 647–661. [Google Scholar] [CrossRef]
  3. Labiris, N.R.; Dolovich, M.B. Pulmonary drug delivery. Part I: Physiological factors affecting therapeutic effectiveness of aerosolized medications. Br. J. Clin. Pharmacol. 2003, 56, 588–599. [Google Scholar] [CrossRef]
  4. Jain, H.; Bairagi, A.; Srivastava, S.; Singh, S.B.; Mehra, N.K. Recent advances in the development of microparticles for pulmonary administration. Drug Discov. Today 2020, 25, 1865–1872. [Google Scholar] [CrossRef]
  5. Sung, J.C.; Pulliam, B.L.; Edwards, D.A. Nanoparticles for drug delivery to the lungs. Trends Biotechnol. 2007, 25, 563–570. [Google Scholar] [CrossRef]
  6. de Boer, A.H.; Hagedoorn, P.; Hoppentocht, M.; Buttini, F.; Grasmeijer, F.; Frijlink, H.W. Dry powder inhalation: Past, present and future. Expert. Opin. Drug Deliv. 2017, 14, 499–512. [Google Scholar] [CrossRef]
  7. Murgia, X.; De Souza Carvalho, C.; Lehr, C.M. Overcoming the pulmonary barrier: New insights to improve the efficiency of inhaled therapeutics. Eur. J. Nanomed. 2014, 6, 157–169. [Google Scholar] [CrossRef]
  8. Muralidharan, P.; Malapit, M.; Mallory, E.; Hayes, D.; Mansour, H.M. Inhalable nanoparticulate powders for respiratory delivery. Nanomed. Nanotechnol. Biol. Med. 2015, 11, 1189–1199. [Google Scholar] [CrossRef]
  9. Hassan, M.S.; Lau, R.W.M. Effect of particle shape on dry particle inhalation: Study of flowability, aerosolization, and deposition properties. AAPS PharmSciTech 2009, 10, 1252–1262. [Google Scholar] [CrossRef] [PubMed]
  10. Praphawatvet, T.; Peters, J.I.; Williams, R.O. Inhaled nanoparticles—An updated review. Int. J. Pharm. 2020, 587, 119671. [Google Scholar] [CrossRef]
  11. Chaurasiya, B.; Zhao, Y.Y. Dry powder for pulmonary delivery: A comprehensive review. Pharmaceutics 2021, 13, 31. [Google Scholar] [CrossRef] [PubMed]
  12. Pramanik, S.; Mohanto, S.; Manne, R.; Rajendran, R.R.; Deepak, A.; Edapully, S.J.; Patil, T.; Katari, O. Nanoparticle-Based Drug Delivery System: The Magic Bullet for the Treatment of Chronic Pulmonary Diseases. Mol. Pharm. 2021, 18, 3671–3718. [Google Scholar] [CrossRef] [PubMed]
  13. Sharif, S.; Muneer, S.; Izake, E.L.; Islam, N. Impact of Leucine and Magnesium Stearate on the Physicochemical Properties and Aerosolization Behavior of Wet Milled Inhalable Ibuprofen Microparticles for Developing Dry Powder Inhaler Formulation. Pharmaceutics 2023, 15, 674. [Google Scholar] [CrossRef] [PubMed]
  14. Peng, T.; Zhang, X.; Huang, Y.; Zhao, Z.; Liao, Q.; Xu, J.; Huang, Z.; Zhang, J.; Wu, C.Y.; Pan, X.; et al. Nanoporous mannitol carrier prepared by non-organic solvent spray drying technique to enhance the aerosolization performance for dry powder inhalation. Sci. Rep. 2017, 7, 46517. [Google Scholar] [CrossRef]
  15. Ye, T.; Yu, J.; Luo, Q.; Wang, S.; Chan, H.-K. Inhalable clarithromycin liposomal dry powders using ultrasonic spray freeze drying. Powder Technol. 2017, 305, 63–70. [Google Scholar] [CrossRef]
  16. Jara, M.O.; Warnken, Z.N.; Sahakijpijarn, S.; Moon, C.; Maier, E.Y.; Christensen, D.J.; Koleng, J.J.; Peters, J.I.; Hackman Maier, S.D.; Williams Iii, R.O. Niclosamide inhalation powder made by thin-film freezing: Multi-dose tolerability and exposure in rats and pharmacokinetics in hamsters. Int. J. Pharm. 2021, 603, 120701. [Google Scholar] [CrossRef]
  17. Kim, Y.H.; Shing, K.S. Supercritical fluid-micronized ipratropium bromide for pulmonary drug delivery. Powder Technol. 2008, 182, 25–32. [Google Scholar] [CrossRef]
  18. Adali, M.B.; Barresi, A.A.; Boccardo, G.; Pisano, R. Spray freeze-drying as a solution to continuous manufacturing of pharmaceutical products in bulk. Processes 2020, 8, 709. [Google Scholar] [CrossRef]
  19. Duong, T.; López-Iglesias, C.; Szewczyk, P.K.; Stachewicz, U.; Barros, J.; Alvarez-Lorenzo, C.; Alnaief, M.; García-González, C.A. A Pathway From Porous Particle Technology Toward Tailoring Aerogels for Pulmonary Drug Administration. Front. Bioeng. Biotechnol. 2021, 9, 671381. [Google Scholar] [CrossRef]
  20. Vishali, D.A.; Monisha, J.; Sivakamasundari, S.K.; Moses, J.A.; Anandharamakrishnan, C. Spray freeze drying: Emerging applications in drug delivery. J. Control. Release 2019, 300, 93–101. [Google Scholar] [CrossRef]
  21. Yu, H.; Tran, T.-T.; Teo, J.; Hadinoto, K. Dry powder aerosols of curcumin-chitosan nanoparticle complex prepared by spray freeze drying and their antimicrobial efficacy against common respiratory bacterial pathogens. Colloids Surf. A Physicochem. Eng. Asp. 2016, 504, 34–42. [Google Scholar] [CrossRef]
  22. Isleroglu, H.; Turker, I. Evaluation of Process Conditions for Ultrasonic Spray-Freeze Drying of Transglutaminase. Food Technol. Biotechnol. 2020, 58, 38–48. [Google Scholar] [CrossRef] [PubMed]
  23. Liang, W.; Chan, A.Y.L.; Chow, M.Y.T.; Lo, F.F.K.; Qiu, Y.; Kwok, P.C.L.; Lam, J.K.W. Spray freeze drying of small nucleic acids as inhaled powder for pulmonary delivery. Asian J. Pharm. Sci. 2018, 13, 163–172. [Google Scholar] [CrossRef] [PubMed]
  24. D’Addio, S.M.; Chan, J.G.Y.; Kwok, P.C.L.; Prud’Homme, R.K.; Chan, H.K. Constant size, variable density aerosol particles by ultrasonic spray freeze drying. Int. J. Pharm. 2012, 427, 185–191. [Google Scholar] [CrossRef] [PubMed]
  25. Qian, L.; Zhang, H. Controlled freezing and freeze drying: A versatile route for porous and micro-/nano-structured materials. J. Chem. Technol. Biotechnol. 2011, 86, 172–184. [Google Scholar] [CrossRef]
  26. Wanning, S.; Süverkrüp, R.; Lamprecht, A. Pharmaceutical spray freeze drying. Int. J. Pharm. 2015, 488, 136–153. [Google Scholar] [CrossRef]
  27. Yu, H.; Teo, J.; Chew, J.W.; Hadinoto, K. Dry powder inhaler formulation of high-payload antibiotic nanoparticle complex intended for bronchiectasis therapy: Spray drying versus spray freeze drying preparation. Int. J. Pharm. 2016, 499, 38–46. [Google Scholar] [CrossRef] [PubMed]
  28. Cheow, W.S.; Ng, M.L.L.; Kho, K.; Hadinoto, K. Spray-freeze-drying production of thermally sensitive polymeric nanoparticle aggregates for inhaled drug delivery: Effect of freeze-drying adjuvants. Int. J. Pharm. 2011, 404, 289–300. [Google Scholar] [CrossRef]
  29. Keyhan Shokouh, M.; Faghihi, H.; Darabi, M.; Mirmoeini, M.; Vatanara, A. Formulation and evaluation of inhalable microparticles of Rizatriptan Benzoate processed by spray freeze-drying. J. Drug Deliv. Sci. Technol. 2021, 62, 102356. [Google Scholar] [CrossRef]
  30. Ogienko, A.G.; Bogdanova, E.G.; Trofimov, N.A.; Myz, S.A.; Ogienko, A.A.; Kolesov, B.A.; Yunoshev, A.S.; Zubikov, N.V.; Manakov, A.Y.; Boldyrev, V.V.; et al. Large porous particles for respiratory drug delivery. Glycine-based formulations. Eur. J. Pharm. Sci. 2017, 110, 148–156. [Google Scholar] [CrossRef]
  31. Wanning, S.; Süverkrüp, R.; Lamprecht, A. Impact of excipient choice on the aerodynamic performance of inhalable spray-freeze-dried powders. Int. J. Pharm. 2020, 586, 119564. [Google Scholar] [CrossRef]
  32. Leung, S.S.Y.; Wong, J.; Guerra, H.V.; Samnick, K.; Prud’homme, R.K.; Chan, H.-K. Porous mannitol carrier for pulmonary delivery of cyclosporine A nanoparticles. AAPS J. 2017, 19, 578–586. [Google Scholar] [CrossRef]
  33. Liao, Q.; Lam, I.C.H.; Lin, H.H.S.; Wan, L.T.L.; Lo, J.C.K.; Tai, W.; Kwok, P.C.L.; Lam, J.K.W. Effect of formulation and inhaler parameters on the dispersion of spray freeze dried voriconazole particles. Int. J. Pharm. 2020, 584, 119444. [Google Scholar] [CrossRef]
  34. Parsian, A.R.; Vatanara, A.; Rahmati, M.R.; Gilani, K.; Khosravi, K.M.; Najafabadi, A.R. Inhalable budesonide porous microparticles tailored by spray freeze drying technique. Powder Technol. 2014, 260, 36–41. [Google Scholar] [CrossRef]
  35. Emami, F.; Vatanara, A.; Vakhshiteh, F.; Kim, Y.; Kim, T.W.; Na, D.H. Amino acid-based stable adalimumab formulation in spray freeze-dried microparticles for pulmonary delivery. J. Drug Deliv. Sci. Technol. 2019, 54, 101249. [Google Scholar] [CrossRef]
  36. Liang, W.; Chow, M.Y.T.; Chow, S.F.; Chan, H.-K.; Kwok, P.C.L.; Lam, J.K.W. Using two-fluid nozzle for spray freeze drying to produce porous powder formulation of naked siRNA for inhalation. Int. J. Pharm. 2018, 552, 67–75. [Google Scholar] [CrossRef] [PubMed]
  37. Healy, A.M.; Amaro, M.I.; Paluch, K.J.; Tajber, L. Dry powders for oral inhalation free of lactose carrier particles. Adv. Drug Deliv. Rev. 2014, 75, 32–52. [Google Scholar] [CrossRef]
  38. Thakral, S.; Sonje, J.; Munjal, B.; Bhatnagar, B.; Suryanarayanan, R. Mannitol as an Excipient for Lyophilized Injectable Formulations. J. Pharm. Sci. 2023, 112, 19–35. [Google Scholar] [CrossRef]
  39. Adali, M.B.; Barresi, A.; Boccardo, G.; Montalbano, G.; Pisano, R. Ultrasonic spray freeze-drying of sucrose and mannitol-based formulations: Impact of the atomization conditions on the particle morphology and drying performance. Dry. Technol. 2023, 41, 251–261. [Google Scholar] [CrossRef]
  40. Oddone, I.; Barresi, A.A.; Pisano, R. Influence of controlled ice nucleation on the freeze-drying of pharmaceutical products: The secondary drying step. Int. J. Pharm. 2017, 524, 134–140. [Google Scholar] [CrossRef]
  41. Sing, K.S.W.; Everett, D.H.; Haul, R.A.W.; Moscou, L.; Pierotti, R.A.; Rouquérol, J.; Siemieniewska, T. Reporting physisorption data for gas/solid systems with with special reference to the determination of surface area and porosity. Pure Appl. Chem. 1985, 57, 503–619. [Google Scholar] [CrossRef]
  42. Niwa, T.; Mizutani, D.; Danjo, K. Spray Freeze-Dried Porous Microparticles of a Poorly Water-Soluble Drug for Respiratory Delivery. Chem. Pharm. Bull. 2012, 60, 870–876. [Google Scholar] [CrossRef] [PubMed]
  43. Mehta, M.; Bhardwaj, S.P.; Suryanarayanan, R. Controlling the physical form of mannitol in freeze-dried systems. Eur. J. Pharm. Biopharm. 2013, 85, 207–213. [Google Scholar] [CrossRef] [PubMed]
Figure 1. SEM images of MPs produced at 5, 10, 15, and 20% (w/w) mannitol at different flow rates (1, 2.5, 5, 7.5, and 10 mL/min). Scale bars: 100 µm black bars, 10 µm white bars.
Processes 11 03096 g001
Figure 2. (A) Geometric and (B) aerodynamic diameters in terms of mean value ± standard deviation produced at different mannitol concentrations (5, 10, 15, and 20% (w/w)) and feed flow rates (1, 2.5, 5, 7.5, and 10 mL/min). At each condition, the mean geometric diameter and the standard deviation were obtained from a population of 200 MPs.
Processes 11 03096 g002
Figure 3. Particle size distribution and span values related to the geometric diameter of powders not containing SAS. Particles were produced at different mannitol concentrations (5, 10, 15, and 20% (w/w)) and feed flow rates (1, 2.5, 5, 7.5, and 10 mL/min). Particle size distributions were obtained from a population of 200 MPs.
Processes 11 03096 g003
Figure 4. Comparison between SEM images of MPs with and without the addition of 1% (w/w) of SAS at different concentrations (5, 10, and 15%) and produced at different flow rates (1 and 10 mL/min). Scale bars: 100 µm black bars, 10 µm white bars.
Processes 11 03096 g004
Figure 5. Particle size distribution and span values related to the geometric diameter of powders containing SAS. Particles were produced at different mannitol concentrations (5, 10, and 15% (w/w)) and feed flow rates (1 and 10 mL/min). Particle size distributions were obtained from a population of 200 MPs.
Processes 11 03096 g005
Figure 6. (A) Geometric and (B) aerodynamic diameters produced at different mannitol concentrations with and without the addition of SAS at a feed flow rate of 1 mL/min. (C) Geometric and (D) aerodynamic diameters produced at 5% of mannitol with and without SAS at 1 and 10 mL/min of feed flow rates. Histograms were obtained from a population of 200 MPs and represented in terms of mean ± standard deviation. ** p < 0.001 and * p < 0.05.
Processes 11 03096 g006
Figure 7. XRD spectra of mannitol MPs devoid and containing SAS, produced at 1 mL/min. Peaks relative to a specific mannitol polymorph are marked with a different symbol: (■) α-mannitol, (▲) β-mannitol, and (●) δ-mannitol.
Processes 11 03096 g007
Figure 8. In vitro aerosol performance of powders containing 1% (w/w) SAS, evaluated by NGI tests. Data were presented as mean values ± standard deviations (n = 3). The deposition of MPs was evaluated according to the mass of SAS recovered from DEV, IP, PRE, S1–S7, and MOC.
Processes 11 03096 g008
Table 1. Results of BET surface area, pore size, and ratio between the δ-peak at 22.06° and the β-peak at 23.4° for all the investigated conditions.
Composition% (w/w)Feed Flow Rate (mL/min)BET Surface Area (m2 g−1)Pore Size (nm)Peak Ratio
BJH AdsorptionBJH Desorption
Mannitol518.14 ± 0.0911.110.41.9
2.58.03 ± 0.0811.010.12.2
55.78 ± 0.0514.512.51.7
7.59.19 ± 0.059.89.02.3
109.92 ± 0.1010.39.81.8
1017.60 ± 0.0310.39.33.0
2.57.14 ± 0.0510.09.23.8
58.10 ± 0.0410.19.33.5
7.59.81 ± 0.059.99.03.1
106.66 ± 0.0611.010.13.4
1515.97 ± 0.0611.610.84.2
2.55.92 ± 0.0611.910.66.0
55.52 ± 0.0512.010.95.0
7.58.30 ± 0.1011.711.24.9
108.68 ± 0.0810.29.45.5
2016.73 ± 0.0611.110.53.1
2.56.04 ± 0.0511.911.34.4
57.68 ± 0.0610.79.64.9
7.510.10 ± 0.1110.711.54.5
106.63 ± 0.0510.99.84.2
Mannitol
and SAS
5121.62 ± 0.1010.910.25.8
1021.66 ± 0.0910.09.33.1
10123.86 ± 0.0910.49.85.4
15122.90 ± 0.1110.39.67.2
Table 2. Aerodynamic properties of MPs as a function of EF, FPF, MMAD, and GSD for four conditions.
% (w/w)
Solid
Flow Rate
(mL min−1)
EF
(%)
FPF
(%)
MMAD
(µm)
GSD
(-)
5181.3 ± 1.126 ± 34.4 ± 0.21.72 ± 0.04
51087.1 ± 0.721.2 ± 0.55.0 ± 0.11.68 ± 0.06
10185 ± 19.5 ± 0.86.1 ± 0.21.75 ± 0.02
15186.6 ± 1.39.9 ± 1.36.0 ± 0.31.77 ± 0.01
Disclaimer/Publisher’s Note: The statements, opinions and data contained in all publications are solely those of the individual author(s) and contributor(s) and not of MDPI and/or the editor(s). MDPI and/or the editor(s) disclaim responsibility for any injury to people or property resulting from any ideas, methods, instructions or products referred to in the content.

