Article

Life Cycle Environmental and Economic Assessment of Different Biogas and Biogas Residue Operation Models

1
School of Metallurgy and Energy, North China University of Science and Technology, Tangshan 063210, China
2
Institute of Environmental Technology, Faculty III—Process Sciences, Technische Universität Berlin, 10623 Berlin, Germany
3
Ocean College, Tangshan Normal University, Tangshan 063210, China
*
Authors to whom correspondence should be addressed.
Processes 2023, 11(10), 3005; https://doi.org/10.3390/pr11103005
Submission received: 12 September 2023 / Revised: 6 October 2023 / Accepted: 9 October 2023 / Published: 19 October 2023

Abstract

:
The utilization of biogas and biogas residues is an important objective of animal manure resource management. Regarding the environmental friendliness and economic suitability of utilization modes, previous studies have evaluated and compared biogas or biogas residue individually, which may lead to incomplete environmental and economic assessments. In this study, the environmental and economic aspects of six integrated biogas and digestate operation modes, i.e., biogas utilization (direct combustion, cogeneration, and purification) and biogas residue utilization (field return and composting), were analyzed via life cycle assessment (LCA) and the net present value (NPV) method, with an animal manure biogas plant in Tangshan City as the study object. The results of LCA showed that biogas cogeneration + biogas residue composting disposal was superior to other models in most environmental indicators. NPV analysis showed that direct biogas combustion + biogas residue composting was the best, breaking even in the 3rd year with a cumulative profit of 250 million CNY. With increased environmental costs and benefits, the biogas cogeneration + biogas residue composting model had the best performance in terms of efficiency ratio at 2.58; the NPV of both operating models of biogas cogeneration increased, while the NPV of the other operating models decreased about 20%.

1. Introduction

According to pertinent statistics provided by the Ministry of Agriculture, as of 2020, the total amount of animal manure in China will reach 1.868 billion metric tons, with 211 million tons of manure dedicated to biogas production [1]. Solid waste in rural areas, predominantly represented by animal manure, is often improperly discarded or utilized, resulting in soil contamination due to harmful substances in manure and the significant accumulation of greenhouse gases [2]. Therefore, the judicious management of animal manure has become an urgent task. Currently, the utilization of manure resources in China includes fertilizer and feed. Among them, anaerobic fermentation and aerobic composting are more prevalent and established methods of animal and poultry manure resource utilization in China [3]. Anaerobic fermentation stands out as a highly effective method for mitigating the environmental impact of manure [4]. Compared with aerobic composting, anaerobic fermentation not only produces more energy and economical products (biogas, biogas residue, and biogas slurry) but also has obvious advantages from an environmental point of view [5]. Biogas, in particular, is a prospective alternative to traditional energy sources [6]. Therefore, the rational use of biogas and its residual byproducts becomes a crucial metric for assessing animal and poultry manure resource utilization.
Currently, the utilization of biogas is typically categorized into direct use, cogeneration, and gas purification to enhance its heating value [7,8,9]. Minciuc et al. conducted computations to assess the efficiency of energy utilization for biogas derived from poultry manure in cogeneration [10]. Conversely, Sun et al. assessed the collection radius of biogas plants based on their energy value and found that the environmental and operational performance of the biomass recovery radius exhibited superior performance compared to the economic recovery radius [11].
Life cycle assessment (LCA) is a thorough examination of the inputs, outputs, and potential environmental impacts throughout the entire life cycle of a product system [12]. Blengini et al. conducted an analysis and comparison of the environmental impacts of a biogas plant, employing various crop mixtures with cow dung as a fermentation feedstock, utilizing the LCA approach [13]. Chen et al. investigated the environmental advantages of integrating a biogas plant with persimmon cultivation and processing, demonstrating positive environmental impacts at each stage of the process due to biogas utilization [14]. Lorenzo et al. evaluated the energy intensity of a biogas cogeneration system by analyzing life-cycle energy flows and employing the economics of life-cycle cost evaluation. This assessment aimed to determine the correlation between carbon monoxide content and energy during anaerobic digestion [15]. Krexner et al. compared the production of kraft paper from wood chips with kraft paper produced from manure-derived biogas-coupled cellulose digestion using LCA. The findings indicate that manure-produced biogas-coupled cellulose presents a sustainable alternative to wood chip paper [16]. Alengebawy et al. evaluated three biogas utilization options: biogas combined heat and power (CHP), boiler incineration, and biogas upgrading. The findings suggest that biogas upgrading offers the most favorable environmental benefits [17]. Zhang et al. developed a comprehensive evaluative framework covering societal, resource, economic, and environmental dimensions for the Chinese rural biogas power generation sector and revealed the heightened suitability of Eastern regions for adopting biogas power generation, emphasizing the alignment of regional policies with local developmental trajectories [18]. Purwanta et al. conducted a comparative analysis of two anaerobic reactors and three biogas utilization schemes from a techno-economic perspective. The study confirmed the superiority of the fixed-bed reactor and emphasized the heightened economic value when biogas displaces conventional energy sources in co-incineration [19]. Kusmiyati et al. conducted an environmental, economic, and energy analysis in the Indonesian region, comparing biogas power generation from bovine excrement with conventional electricity production based on coal [20]. However, these studies have not integrated environmental and economic aspects to comprehensively assess the pros and cons of various biogas utilization methods. Additionally, the life cycle assessment of the final disposal of fermentation byproducts, namely, biogas residue and biogas slurry, is seldom explored and lacks a certain level of comprehensiveness.
In this study, taking a biogas plant in Tangshan City that utilizes waste heat from a steel mill to warm and insulate the fermentation system as the object of study, three different biogas utilization scenarios and two different biogas residue and biogas slurry disposal scenarios were subjected to environmental and economic analyses using the life cycle assessment (LCA) and net present value (NPV) methodologies. The objective is to identify the biogas and biogas residue utilization scenarios that provide the most favorable environmental benefits and the highest economic returns. Finally, the environmental impacts are monetized and coupled with economic factors to find the biogas and biogas residue utilization scenarios with the best overall evaluation.

2. Methodology and Data

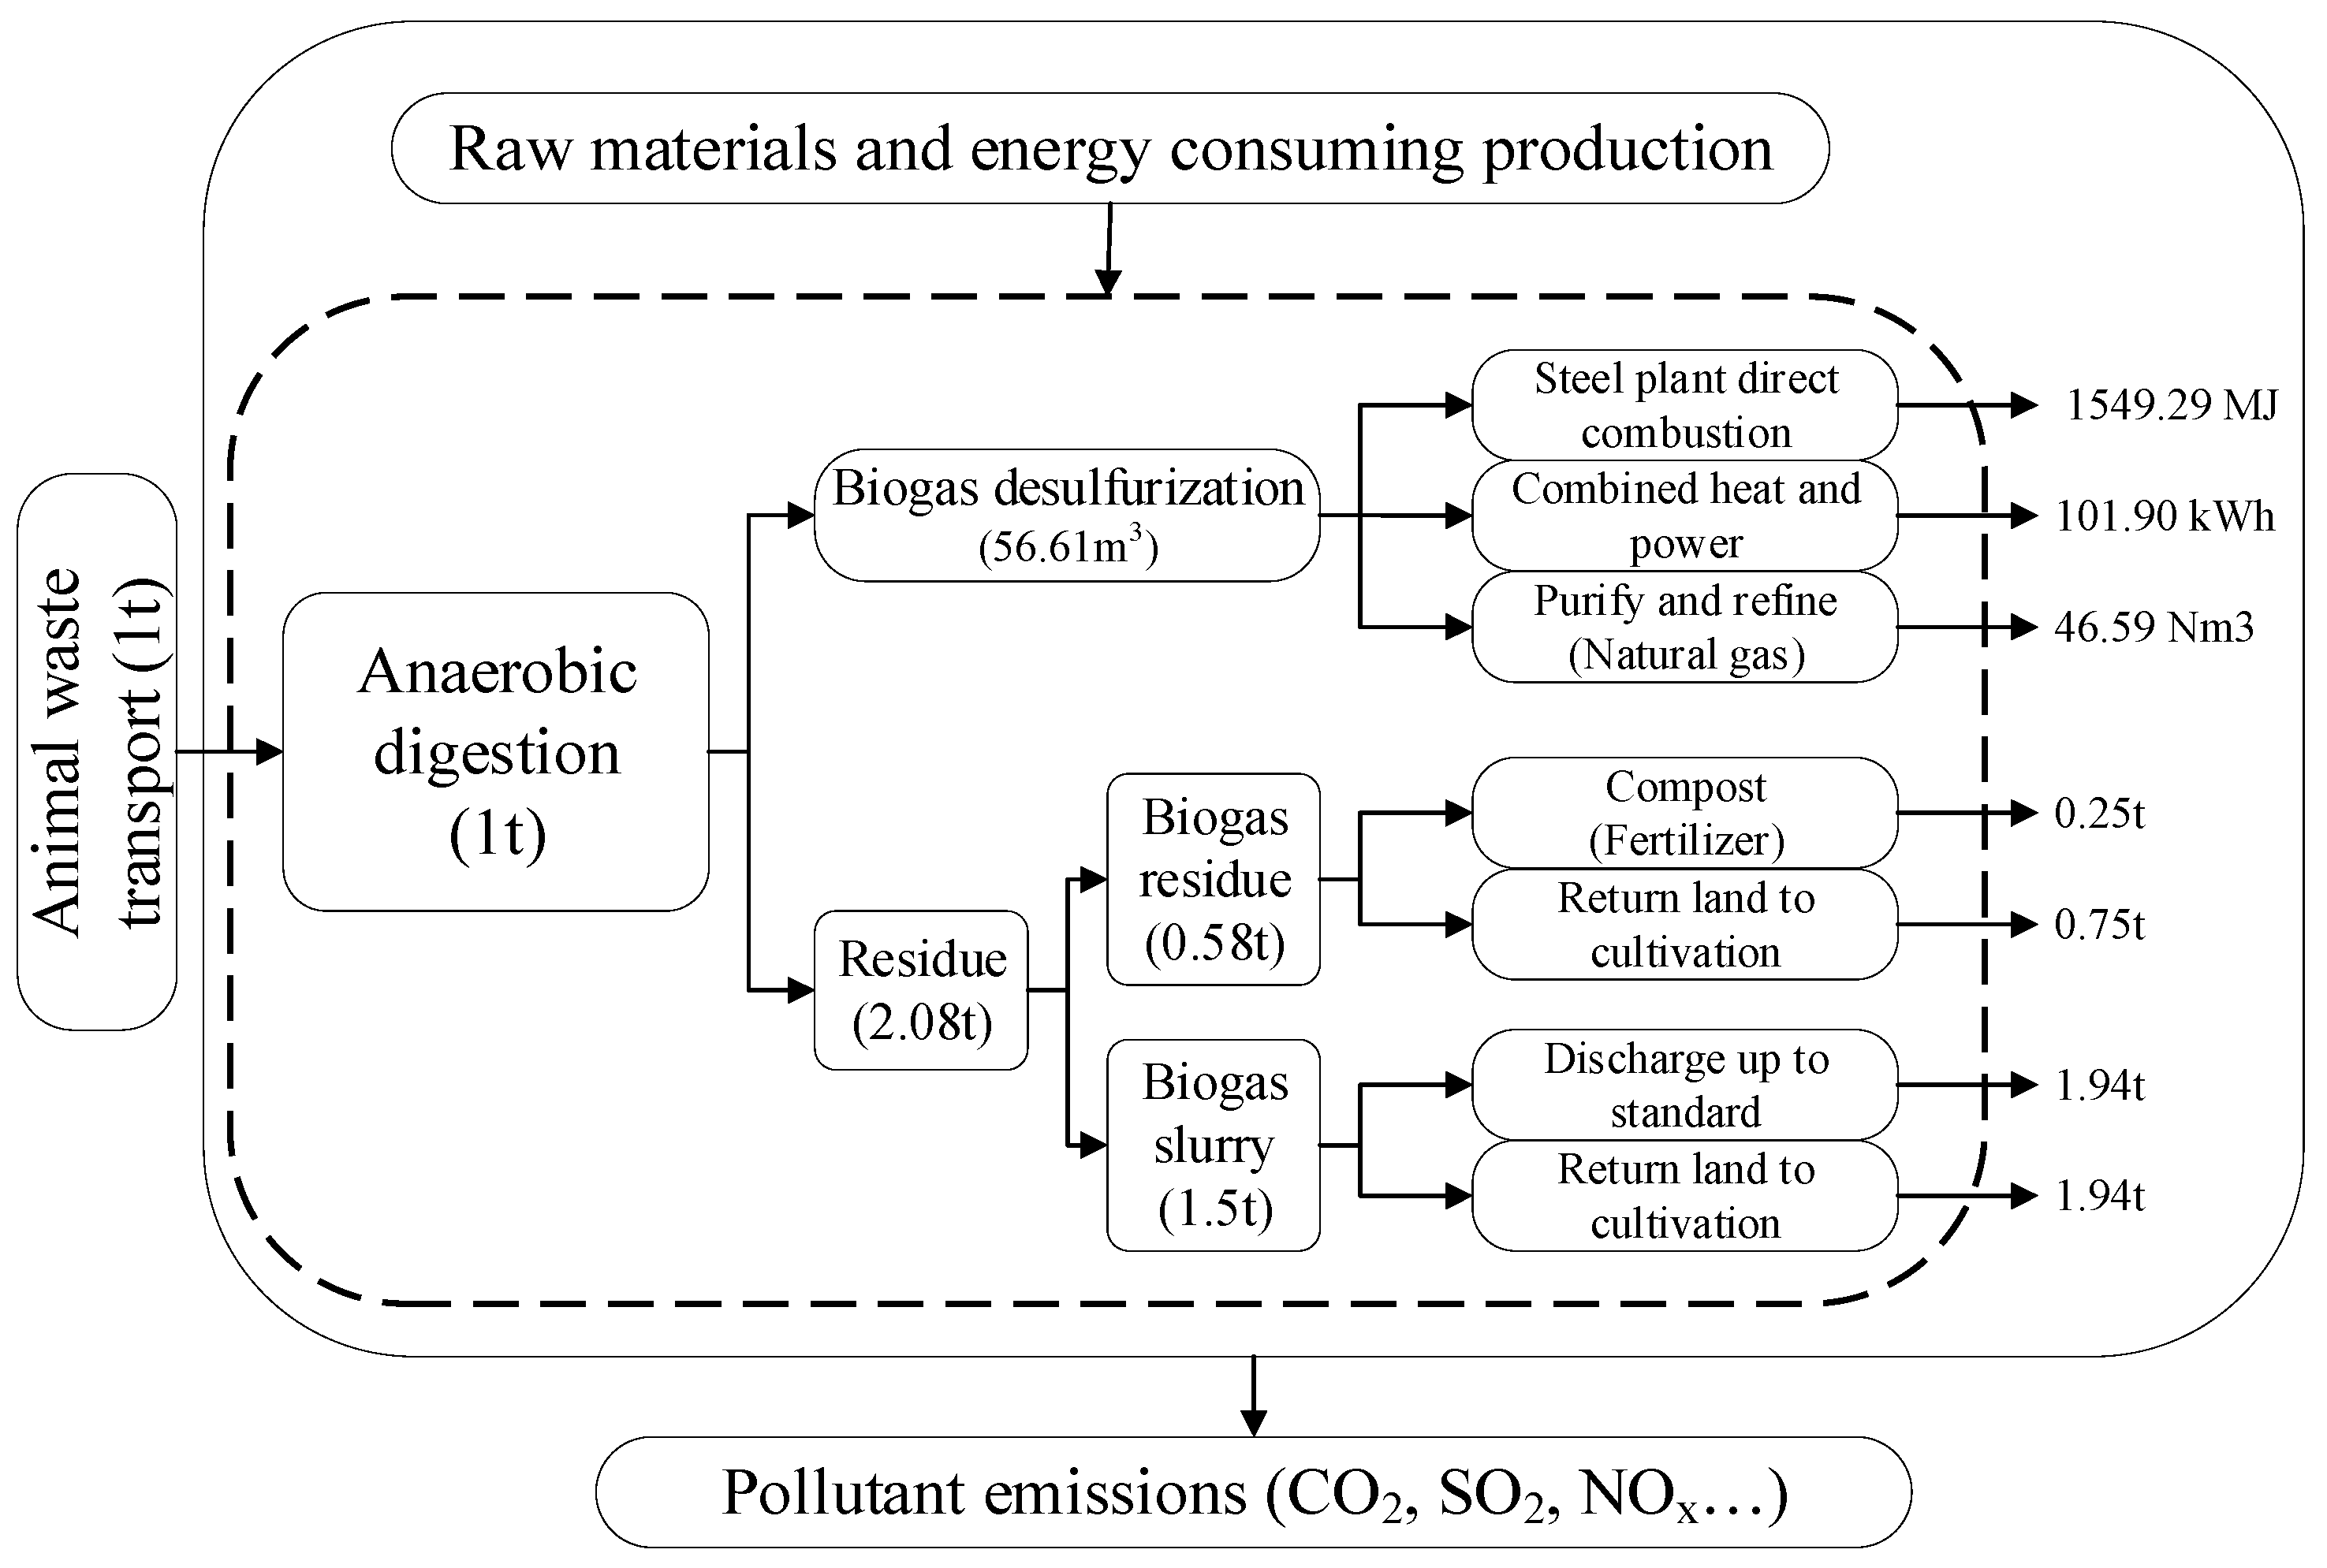
2.1. Goal and Scope Definition

In this study, taking the current anaerobic fermentation + biogas cogeneration + field return of a biogas plant in Tangshan City as a case study, six scenarios of animal manure treatment were set up according to different operation modes of the biogas project:
Scenario 1 (S1): anaerobic fermentation + direct combustion of biogas + return of biogas residue to the field;
Scenario 2 (S2): anaerobic fermentation + direct biogas combustion + separation of biogas residue for composting;
Scenario 3 (S3): anaerobic fermentation + biogas cogeneration + return of biogas residue to field;
Scenario 4 (S4): anaerobic fermentation + biogas cogeneration + separation of biogas residue for composting.
Scenario 5 (S5): anaerobic fermentation + biogas purification + return of biogas residue to the field.
Scenario 6 (S6): anaerobic fermentation + biogas purification + separation of biogas residue for composting.
The four scenarios, S1, S2, S5, and S6, are based on anaerobic digesters fed by waste heat from the steel mill, while scenarios S3 and S4 utilize part of the recovered heat from cogeneration. All other necessary raw materials and mechanical equipment remain consistent with the current mode of operation of the biogas project.
Figure 1 shows the system boundary diagram for six different biogas and biogas residue utilization models. In this study, the functional unit for the life cycle assessment is the treatment of 1 ton of animal manure. All input and output material flows, energy consumption (e.g., electricity and diesel), product outputs (electricity and fertilizer), and pollutant emissions from each process were based on the corresponding values of treating 1 ton of livestock manure. Under the assumption of “zero burden”, all upstream environmental burdens associated with animal manure are excluded [21].

2.2. Data Source and Life Cycle Inventory (LCI)

The foundational data utilized in this study exclusively originates from statistical records gathered during the routine operation of the biogas project. To mitigate potential data incompleteness arising from plant maintenance and shutdowns, all inventory data are standardized on an annual basis. Diesel fuel is accounted for as the primary raw material consumed in the collection and transportation of raw materials. Other fundamental data are derived from on-site research conducted at the enterprises. Furthermore, emission factors for fecal pollutants were sourced from the available literature. Background data on diesel, electricity production, fertilizer production, and steam were extracted from the CLCD database within the eFootprint Beta software [22,23]. Finally, adhering to the ‘cut-off’ principle, raw material weights less than 1% of the weight of animal manure are considered negligible [24]. Table 1 illustrates the life cycle inventory of six distinct models for biogas and biogas residue utilization. Methane concentrations in the biogas produced by the plant underwent rigorous and continuous monitoring throughout the study duration. Impressively stable, the concentration consistently maintained within a narrow range of 58–62%. As a result, we chose to standardize the biogas methane concentration at 60%.
In this study, the preconstruction investment costs were derived from actual research and consultation with the company. The pricing of all raw materials is based on site surveys and market consultation, while the labor cost is calculated based on the average wage in Hebei Province in 2021, with the addition of 8% withholding for employee benefits [25]. In calculating the depreciation of equipment, this study uses the number of years comprehensive depreciation method, which uniformly depreciates the value of the equipment on an average basis over the length of operation [26]. Maintenance costs for equipment and facilities were derived from 1.5% of the total cost of machinery and equipment, including acquisition and installation costs.

2.3. Environmental Assessment

Environmental impact assessment (EIA) is a process of classifying and assessing the results of inventory analysis, which consists of four main steps: classification of potential environmental impacts, characterization, standardization, and weighted assessment.
This study selected nine characterization indicators to represent potential environmental impacts: global warming potential (GWP, kg CO2 eq), acidification potential (AP, kg SO2 eq), eutrophication potential (EP, kg PO43− eq), primary energy demand (PED, MJ), water use (WU, kg), abiotic depletion potential (ADP, kg Sb eq), respirable inorganic particles (RI, kg PM2.5 eq), photochemical ozone formation potential (POFP, kg NMVOC eq), and ozone depletion potential (ODP, kg CFC-11 eq) [27,28]. These indicators are derived from the embedded environmental impact assessment methods of the eFootprint Beta software. GWP indicators are evaluated based on the IPCC 2021 methodology, while the assessment methods for ADP, AP, and EP are grounded in the CML 2002 approach, utilizing antimony, SO2, and PO43− as reference substances for characterization. The assessment approach for RI is drawn from IMPACT 2002+, ODP assessment follows the CML 2001 methodology, and the evaluation of POFP is characterized using the ReCiPe Midpoint (H) method.
Traditional weighted evaluations rely on subjective expert judgment of scenarios and lack quantitative evaluation. Therefore, there is a need for an integrated assessment methodology that yields a single composite index to draw definitive conclusions. The study examines a quantitative methodology that is consistent with the national ECER policy objectives. According to China’s 13th Five-Year Plan, the ECER evaluation covers six key indicators: primary energy depletion (PED), carbon dioxide (CO2), chemical oxygen demand (COD), ammonia nitrogen (NH3-N), sulfur dioxide (SO2), and nitrogen oxides (NOx). The formula for calculating the composite index of ECER is as follows [29,30]:
S = i = 1 6 A i T i × N i
where S is the value of the ECER indicator; Ai is the indicator for disposal technologies; Ti is the ECER policy target for each corresponding indicator; and Ni is the national total for each indicator in 2015.

2.4. Economical Assessment

Throughout this study, three indicators, namely economic feasibility, environmental costs, and environmental benefits, were used to assess the economic viability of a coupled steel mill waste heat–anaerobic fermentation cogeneration system. The economic feasibility evaluation index is based on the net present value (NPV) and dynamic payback period (P′t), while the evaluation criteria for combined environmental and economic costs and benefits are calculated using the benefit–cost ratio (BCR). The dynamic payback period (P′t) indicates the time required to recover the upfront economic investment of the project. The benefit–cost ratio (BCR) represents the ratio of all output benefits to input costs, considering environmental, economic, and social dimensions. The formula is as follows, as indicated by the provided references [31,32]:
N P V = t = 0 n ( C I t C O t ) ( 1 + r ) t
P t = t 1 + E F
B C R = P B + E B + S B C + E V C
where NPV is the net present value of the cumulative economic benefits of the system; n is the service life of the system; CIt represents the economic benefits produced by the system in the tth year of operation; COt is the economic costs invested in the system in the tth year of operation; and r represents the discount rate, %. t is the number of years corresponding to the positive cumulative net cash flow; E is the absolute value of the cumulative cash flow of the previous year when the cumulative net cash flow is positive; and F is the net cash flow corresponding to the positive cumulative net cash flow. PB is economic benefits; EB represents environmental benefits; SB is social benefits; C is economic costs; and EVC is environmental costs. Based on the actual research on site, the project of the plant is expected to have a useful life of 30 years, and the recommended discount factor is 10% [33].
Where NPV > 0, it indicates that the project is economically feasible; where NPV = 0, it indicates that the project is not profitable. Where NPV < 0, it indicates that the project is economically unfeasible. When BCR > 1, it indicates that the system is feasible considering the costs and benefits of environmental, economic, and social aspects; on the contrary, BCR ≤ 1 indicates that the system is not feasible.

2.5. Environmental Impact Monetization Methodology

Environmental costs and benefits require the monetization of environmental impacts, where monetization of environmental impacts is the process of quantifying environmental impact potentials into monetary form using monetization parameters [34]. The calculation formula is shown as follows [35]:
E V C = i n ( E M i L i ) 10 4
where EVC is the environmental monetization value; EMi is the environmental impact potential of the environmental impact category of category i; and Li is the monetization parameter of the environmental impact category of category i. In this study, the monetization parameters of various environmental impacts of the coupled cogeneration system are based on the EU environmental pricing framework, with an exchange rate reference of CNY: EUR of 7.03:1. In calculating the environmental costs, global warming (GWP), acidification potential (AP), eutrophication potential (EP), and respirable inorganic pollutants (RI) are mainly considered. Because GWP, PED, ADP, ODP, and POFP are all reflective of energy consumption throughout the life cycle of the system, it is sufficient to consider only one of the environmental impact categories. Table 2 shows the monetization parameters for each environmental impact.

3. Result and Discussion

3.1. Characterization Analysis

Figure 2 shows the potentials of nine environmental impact categories in S1 to S6, encompassing factors such as global warming potential (GWP) and primary energy consumption potential (PED). As depicted, Scenario S4 exhibits the lowest values across most environmental impact categories, whereas Scenario S6 ranks highest in several environmental impact indicators.
According to Figure 2, regarding the GWP indicator, Scenario S6 exhibits the highest environmental impact potential at 276 kg CO2 eq. The order of decreasing impact values is S5, S2, S1, S4, and S3. Notably, the GWP indicator of S3 is only about 7% of that in S6. Consistent with the findings of Chen et al. [36], the study corroborates that the GWP indicator for biogas cogeneration is lower than that for biogas purification and upgrading. This transition reduces the emissions of greenhouse gases such as CO2, CO, and N2O associated with coal combustion. The high-pressure water flushing method employed in the preparation of natural gas from biogas consumes more electricity, thereby leading to higher GWP values for the entire process. In terms of the PED indicator, the results of the comparison across the six scenarios mirror those of GWP, with all six scenarios exhibiting negative PED values. This suggests that all six scenarios can recuperate a portion of the energy from livestock manure. Specifically, the energy recovered by the coupled system in all operating scenarios surpasses the total energy consumed by the entire life cycle system. In the biogas-coupled cogeneration model, the ADP indicator exhibits a modest abatement effect compared to the other two models, accounting for only 3% to 5% of their values. Regarding the AP indicator, the ranking is as follows: S6 > S5 > S2 > S1 > S3 > S4, with only S3 and S4 demonstrating abatement potential. Within the EP, RI, and POFP indicators, S3 and S4 exhibit notable reduction potential for environmental impacts. In the ODP indicator, biogas residue composting disposal demonstrates evident reduction potential. Compared to S1, S3, and S5, S2, S4, and S6 all experience significant reductions in the ODP indicator, accounting for 65% to 70% of their counterparts of the same type. Considering biogas utilization, biogas cogeneration presents the most environmental advantages across various indicators, ranging from approximately −1200% to 88% compared to other utilization methods. In terms of biogas residue utilization, the environmental benefits of biogas residue composting surpass those of field return disposal. Most environmental impact indicators are lower for biogas residue composting, ranging from 0.2% to 49% less than field return disposal. In a study conducted by Alengebawy et al. [17], it is affirmed that the environmental efficacy of biogas refinement and purification is of paramount significance. This distinction primarily arises from the identified fact that the electrical power demand associated with the biogas purification apparatus in this study increases to 19 kWh/t, exceeding their counterparts by two to threefold, consequently resulting in an augmented environmental impact.
Regarding biogas generated through anaerobic digestion, emphasis should be placed on biomass power generation, which may not be the most optimal choice for energy utilization. However, from an environmental perspective, biogas cogeneration emerges as the most favorable solution. In the future, the utilization of biogas residue should prioritize composting and fertilizing, with field return considered as an auxiliary measure to maximize the resource utilization of biogas residue.
Based on the nine environmental impact indicators, Figure 3 shows the distribution of environmental impacts among different raw materials and energy consumption in the six scenarios. As seen in Figure 3, direct emissions significantly contribute to the environmental impacts in S1. This contribution exceeds 50% in the GWP, EP, and POFP indicators and surpasses 90% in the GWP indicator. In S2, direct emissions remain the primary factor contributing to environmental impacts. In comparison to S1, direct emissions account for more than 50% of AP indicators, while the percentage of POFD indicators is accordingly reduced to less than 50%. Biogas generation in S1 and S2 demonstrates a substantial positive impact on energy savings and emission reduction in both PED and ADP indicators. The contribution of this impact exceeds 90%. In S3 and S4, direct emissions contribute more than 50% to the GWP indicator, while diesel fuel contributes 80% to the ODP indicator. Biogas cogeneration results in a significant reduction in most environmental indicators, particularly in the PED, AP, EP, RI, and POFP indicators, where the reduction percentage exceeds 80%. The environmental impacts of direct emissions in S5 and S6 are primarily in the GWP and EP indicators, contributing 60% to 80%. Electricity consumption significantly contributes to most environmental indicators, particularly in the AP, RI, and POFP indicators, with a contribution ranging from 60% to 90%. Diesel remains the primary contributor to the ODP indicator. The production of natural gas affects the PED and ADP indicators. Energy recovery effectively reduces the consumption of primary energy and nonbiological resources by more than 95%.

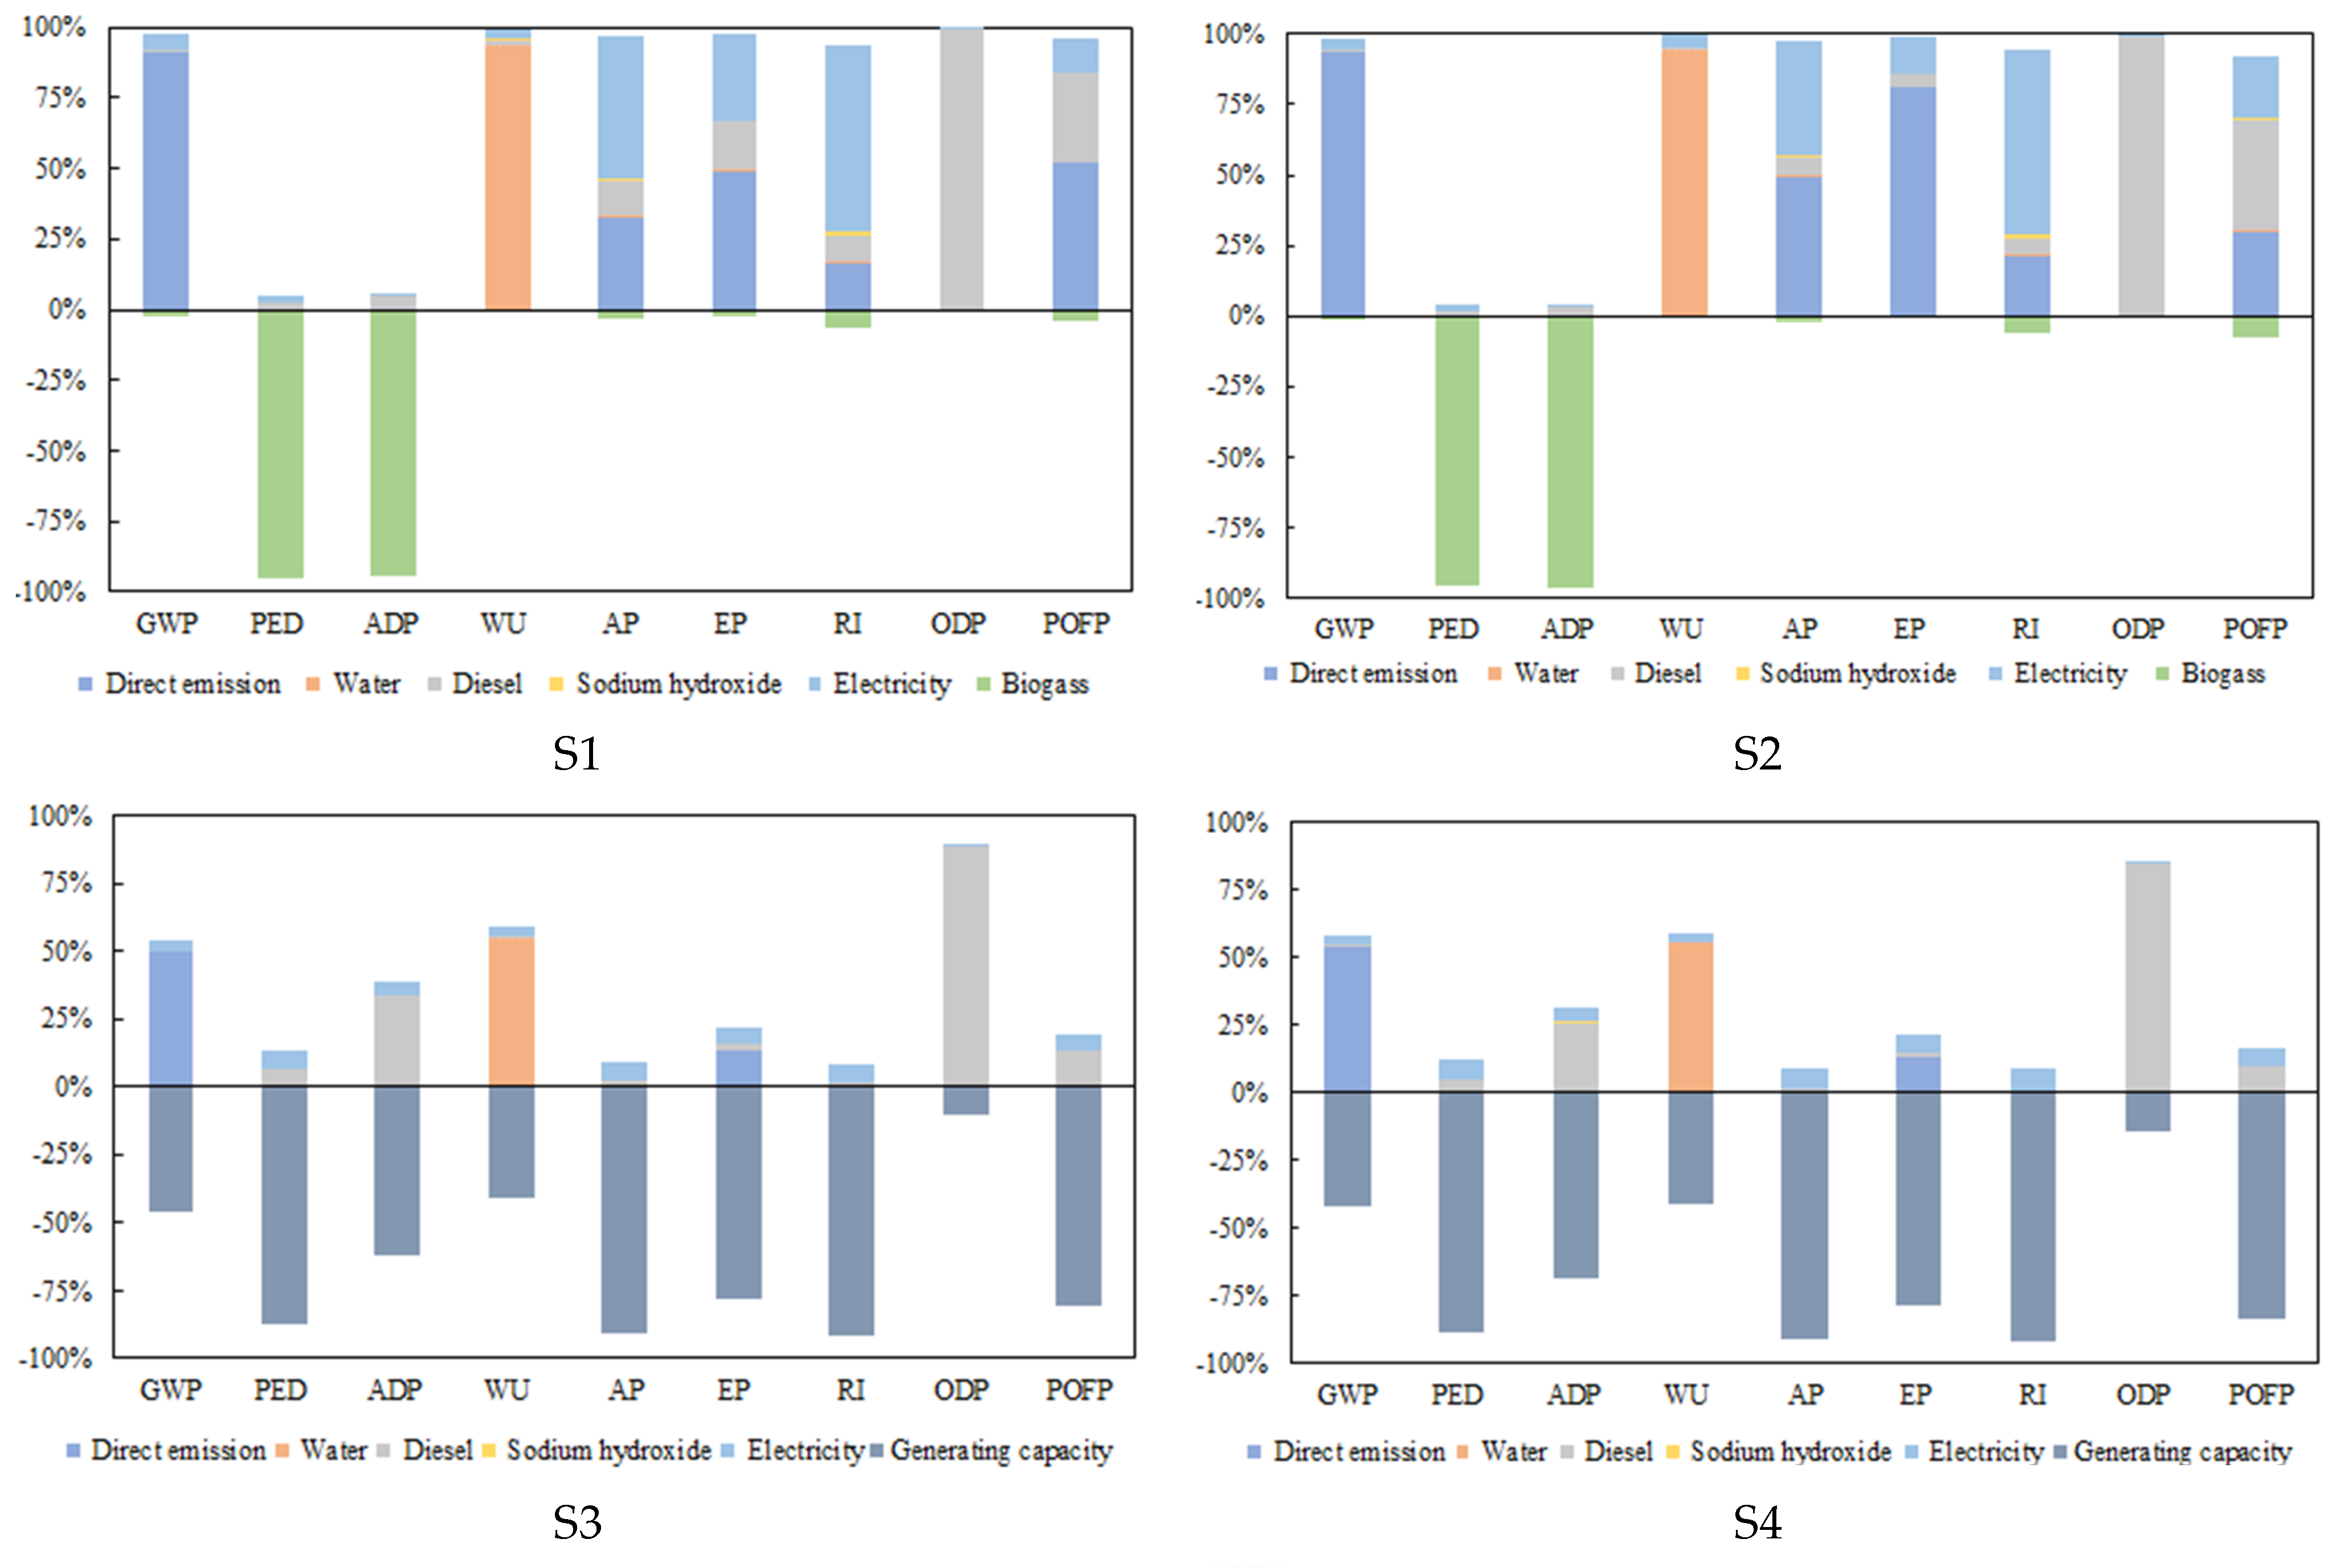
3.2. Normalized Analysis

Based on the formulas in Section 2.3, Figure 4 shows the normalized and ECER results for the six different operating modes of biogas.
Concerning the normalized indicators, the NH3-H indicator remains consistently low across all biogas utilization scenarios. The PED indicator is negative in all six scenarios as a result of energy product generation. Nevertheless, the indicators for S3 and S4 are lower compared to other scenarios. This is primarily attributed to the utilization of part of the calorific value of S3 and S4 as steam, which is returned to the biogas plant to maintain the fermenter’s temperature, consequently reducing energy utilization. The environmental impacts of S1 and S2 are primarily evident in the indicators of CO2 and COD. Notably, in the case of S2, the COD indicator is the highest, exceeding that of S1 by five times. Moreover, the CO2 indicator of S1 surpasses all other indicators in this scenario. In S3 and S4, both the SO2 and NOx indicators show abatement potential, yet the COD indicator remains the highest among all indicators in these scenarios. Conversely, in S5 and S6, both the CO2 and COD indicators peak, being 6–13 times higher than those in the other scenarios. Among the six scenarios, S2 and S6 exhibit the highest COD indicators, with S3 ranking third. This is attributed to the elevated content of pollutant COD in the wastewater discharged directly from both scenarios. Regarding the CO2 indicator, S5 and S6 consistently exhibit the highest values. This is primarily a result of the separation and release of CO2 from the biogas into the atmosphere during the biogas purification process, thereby increasing CO2 emissions. Among the ECER indicators, S6 possesses the highest ECER value of 5.22 × 10⁻¹¹, owing to the elevated values of both CO2 and COD indicators. Conversely, S1 exhibits the smallest ECER value of −9.97 × 10⁻¹¹. Regarding biogas utilization, direct biogas combustion yields the highest overall environmental benefit, whereas biogas purification exhibits the lowest environmental benefit due to the simplicity of the direct combustion process, leading to a reduction in environmental impact caused by the disposal process. Considering the utilization of biogas residue, returning it to the field is environmentally more favorable than composting. This is primarily because the process is simpler, leading to lower pollutant emissions during disposal.
Comprehensively, S6 appears to have the largest combined environmental impact, while S1 is the smallest. In the future, the main pollutant emission issues addressed by the six scenarios are CO2 and COD, and all scenarios have a high share of these two metrics. For S3 and S4, the focus should be on addressing energy utilization by reducing the energy density of the steam return and increasing power generation.

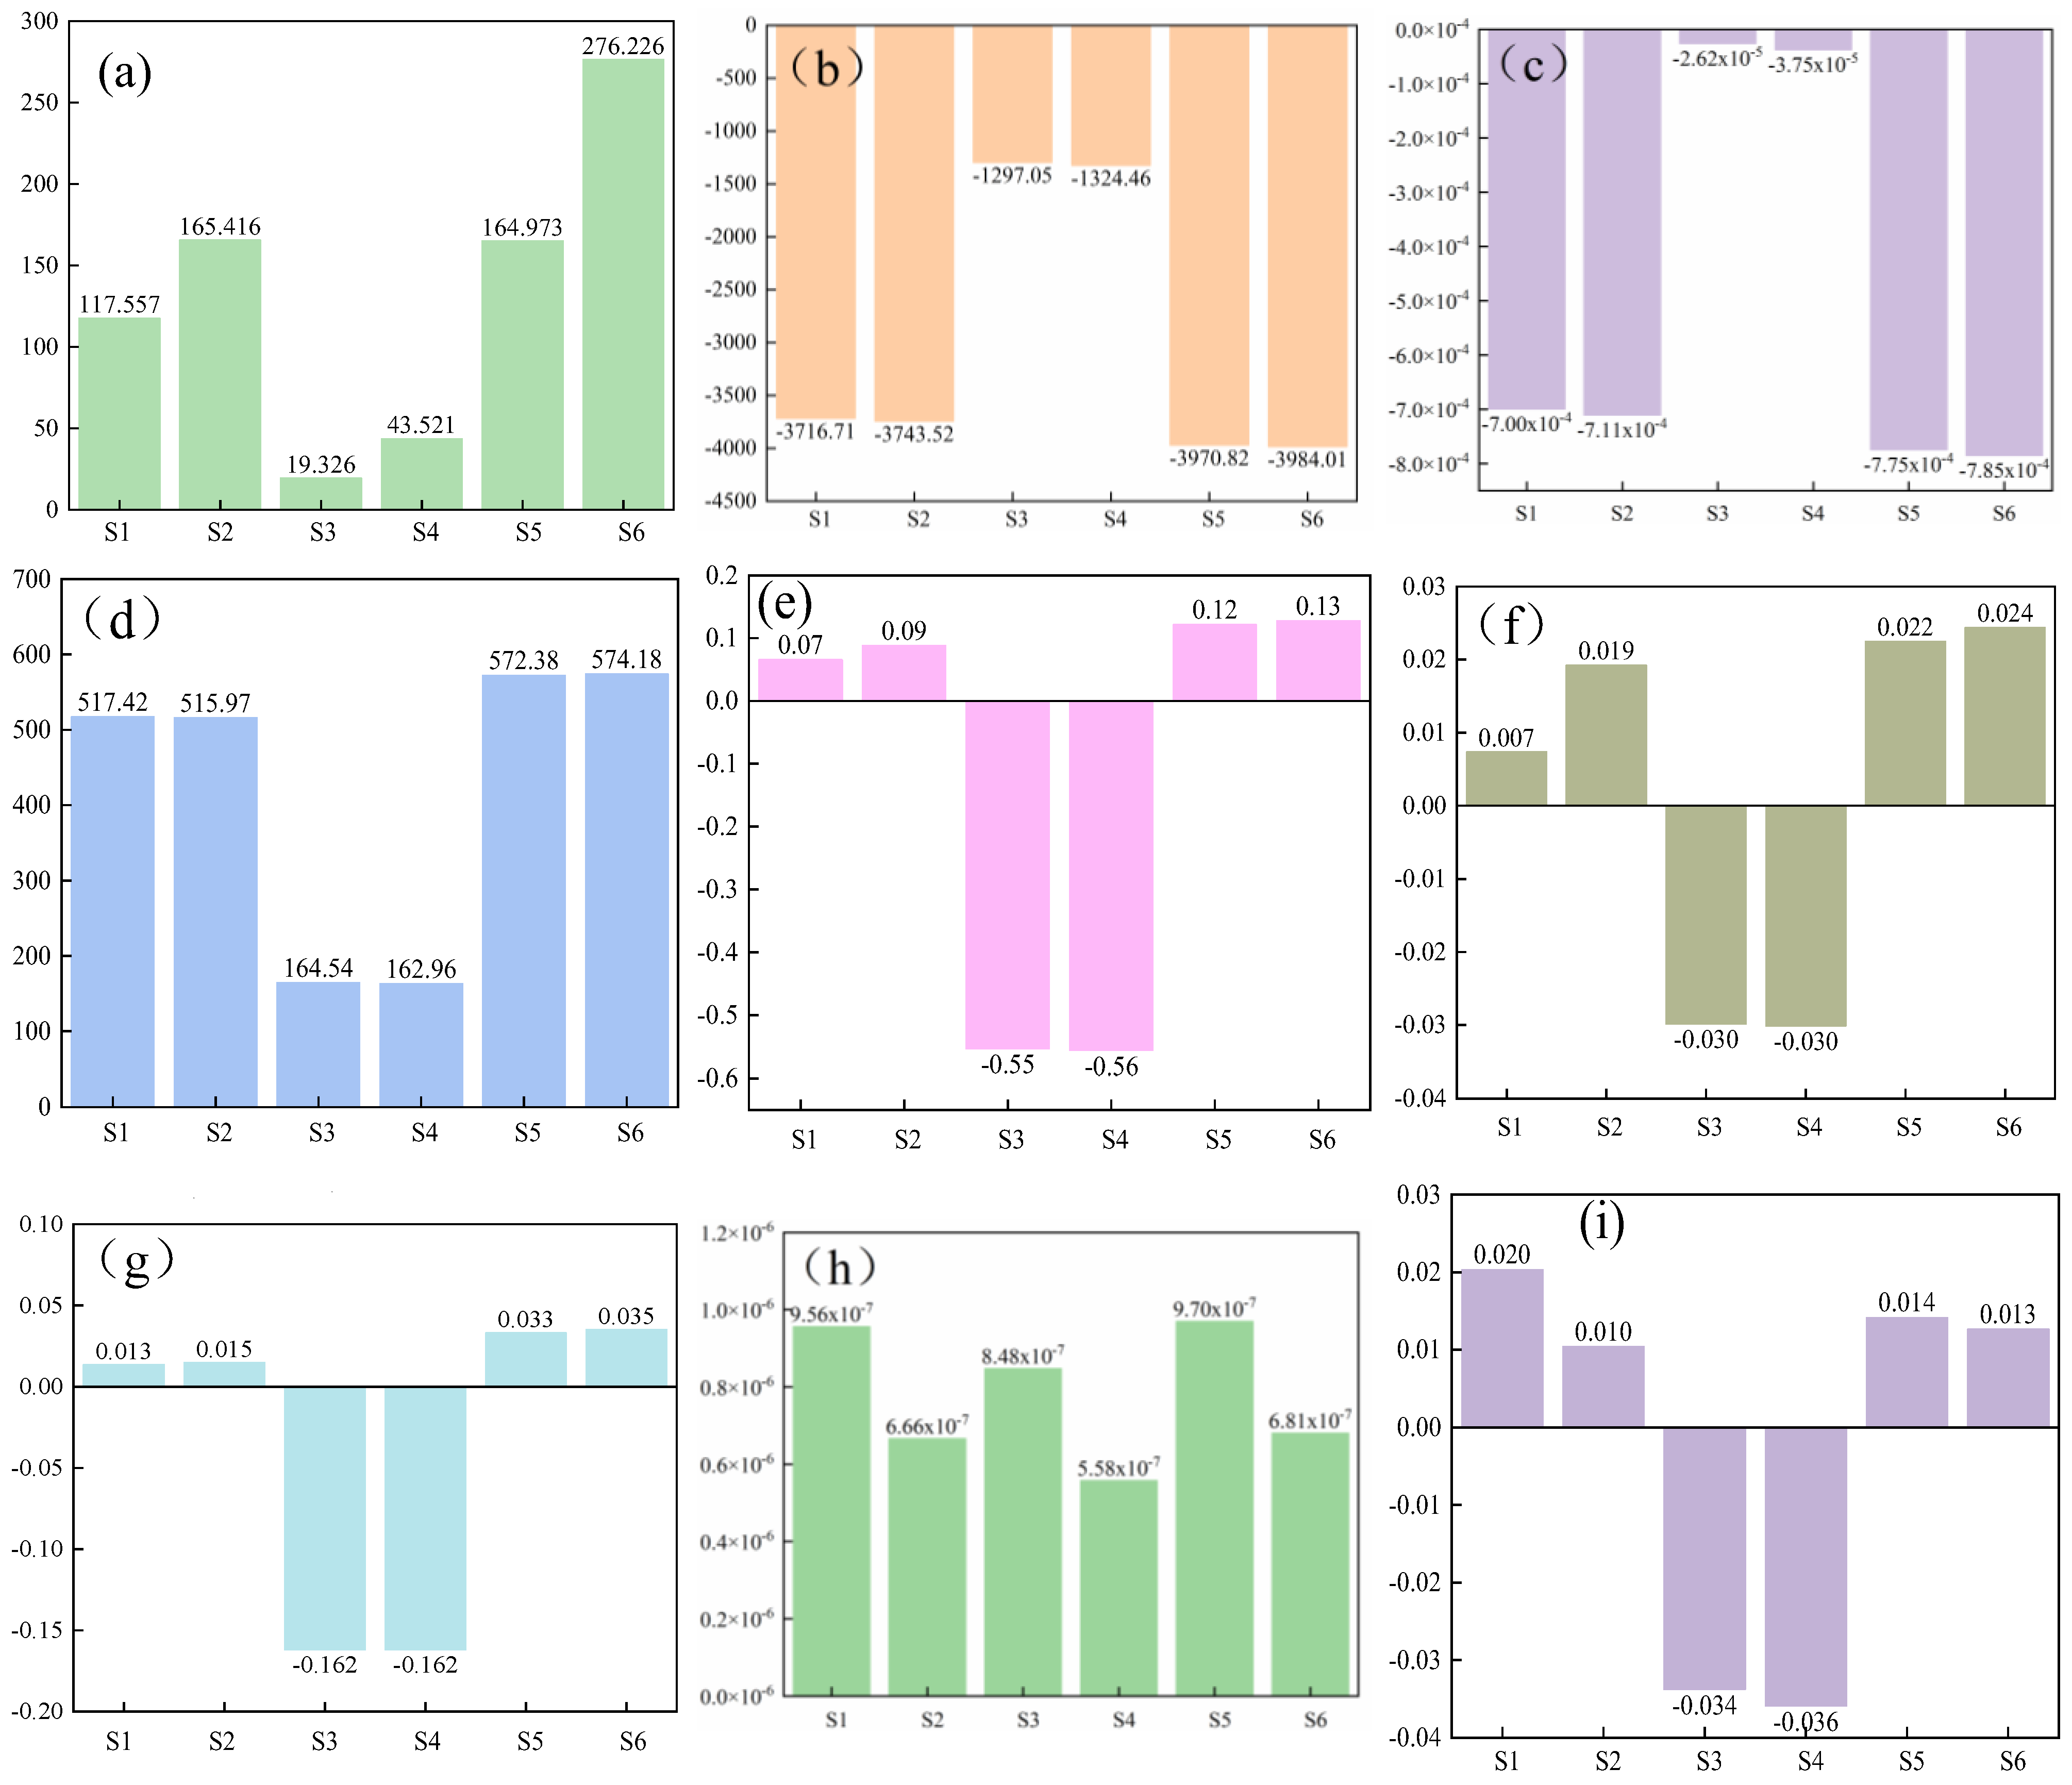
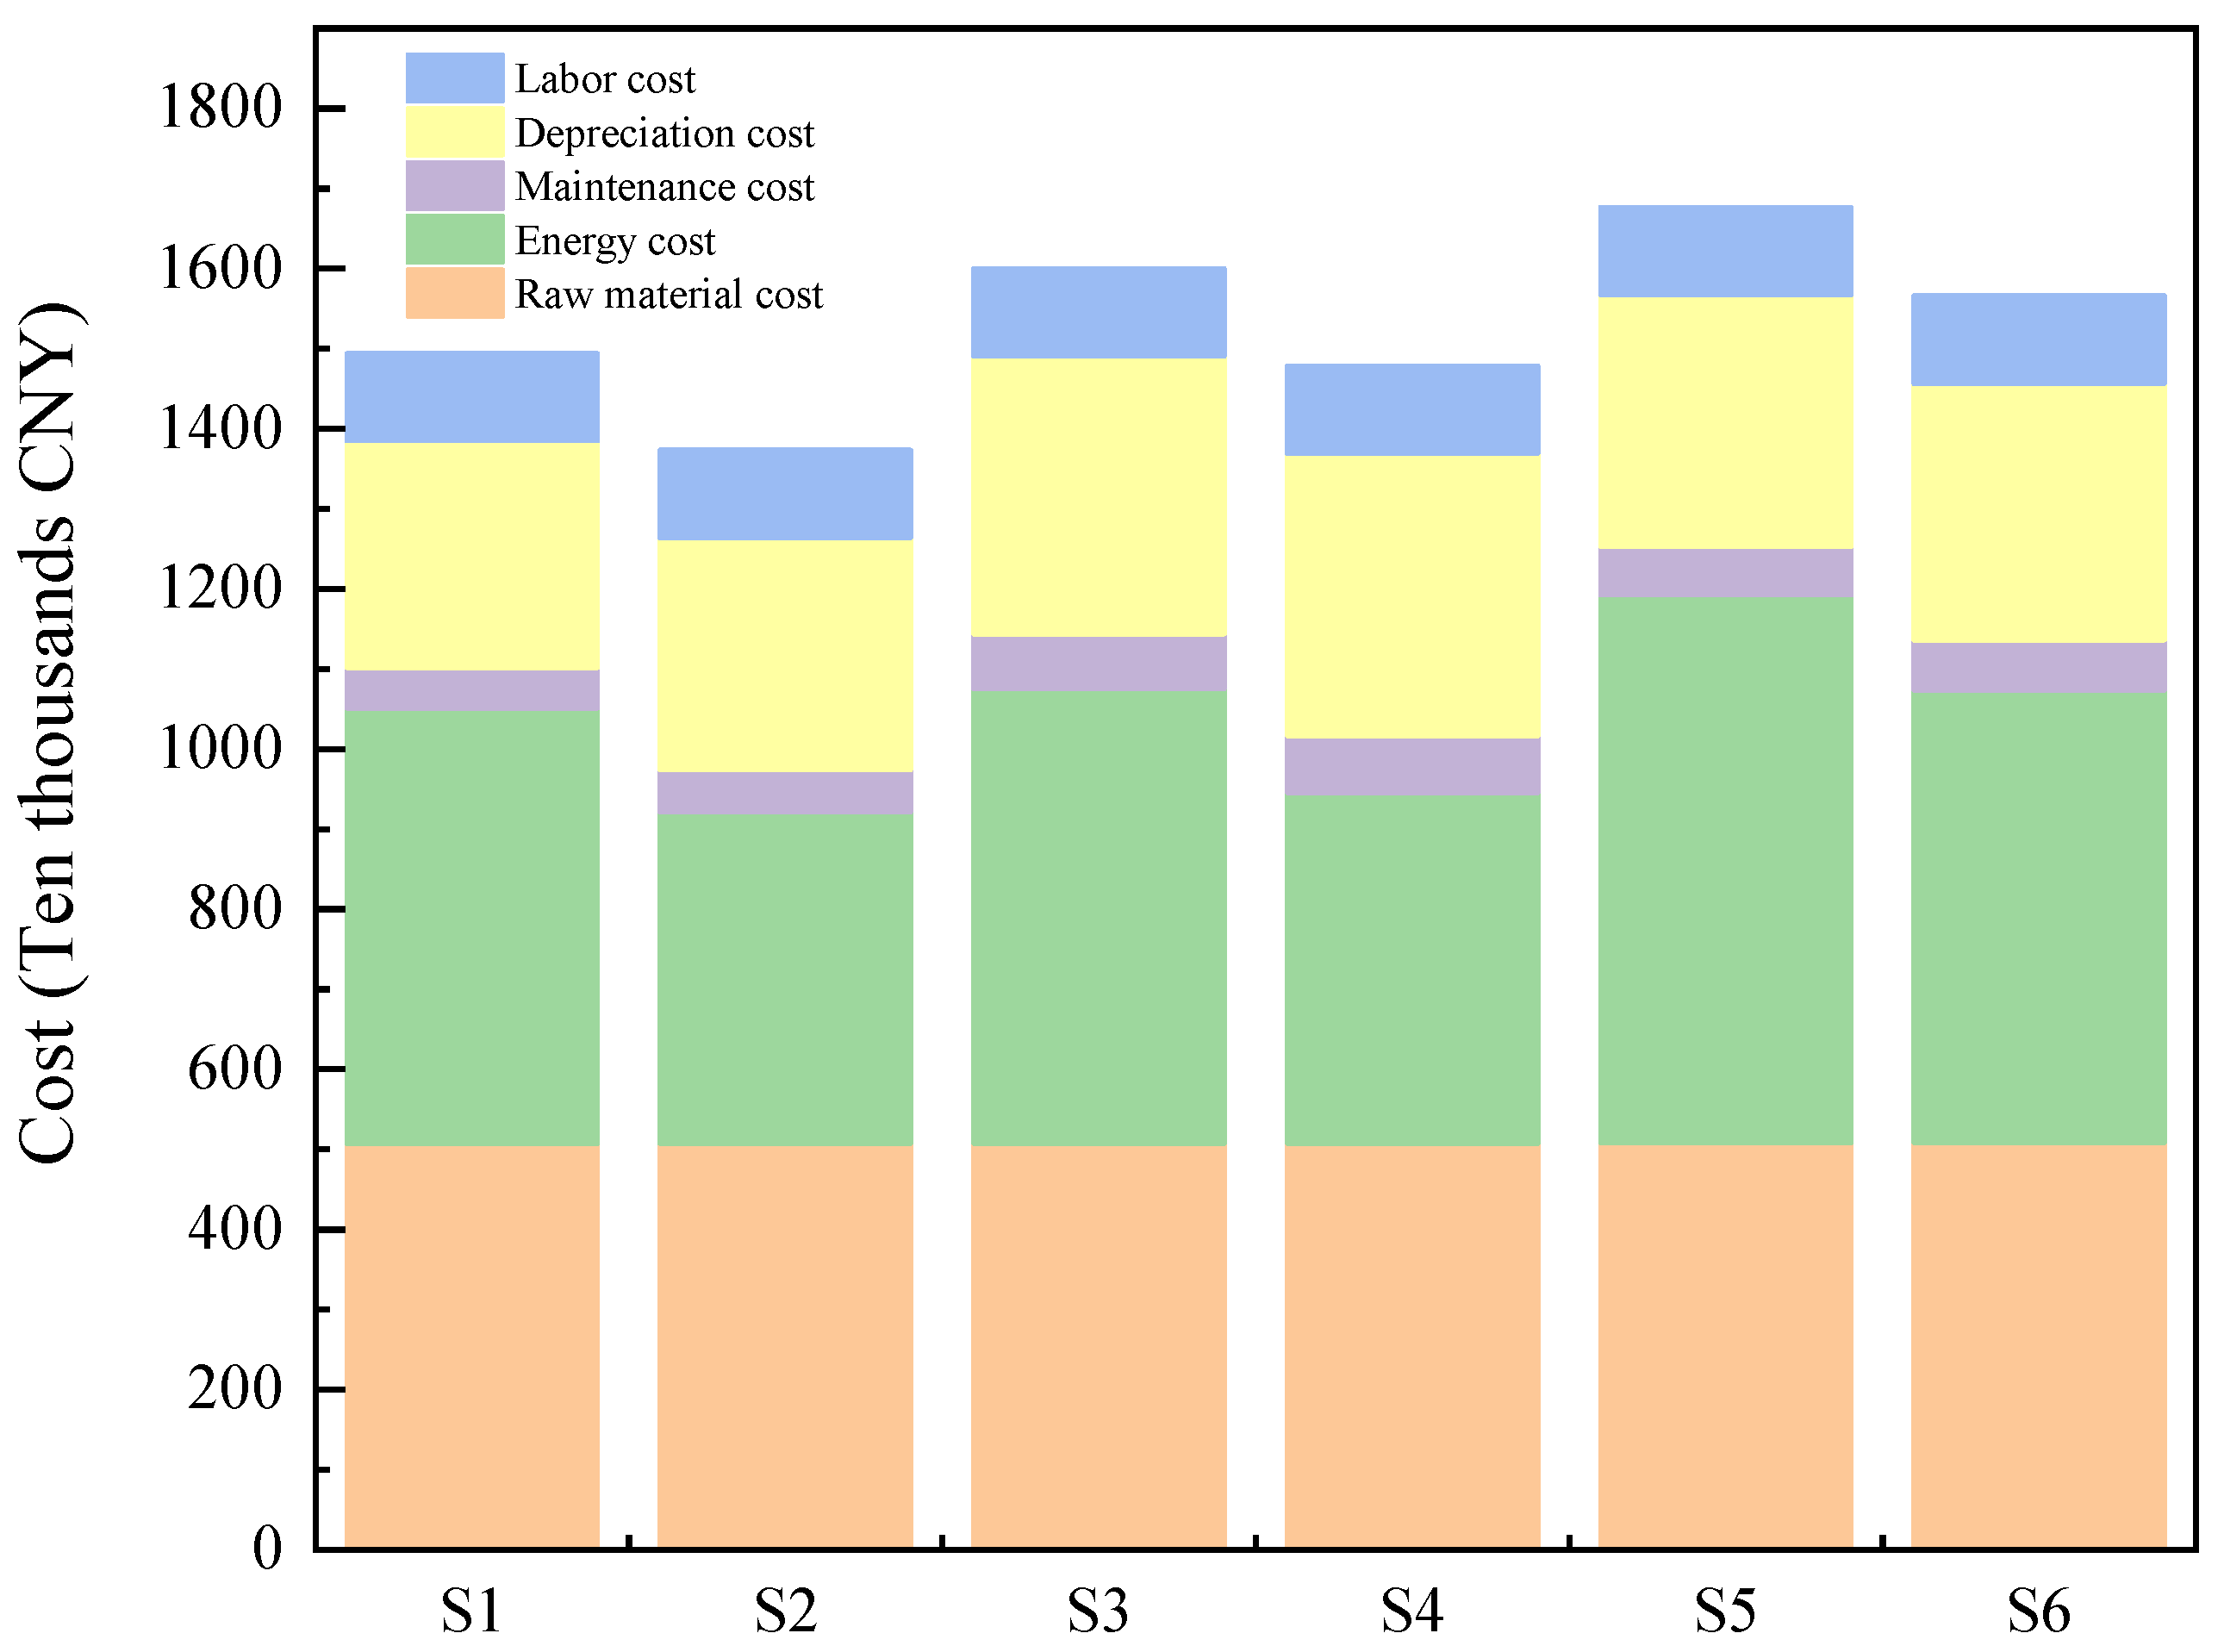
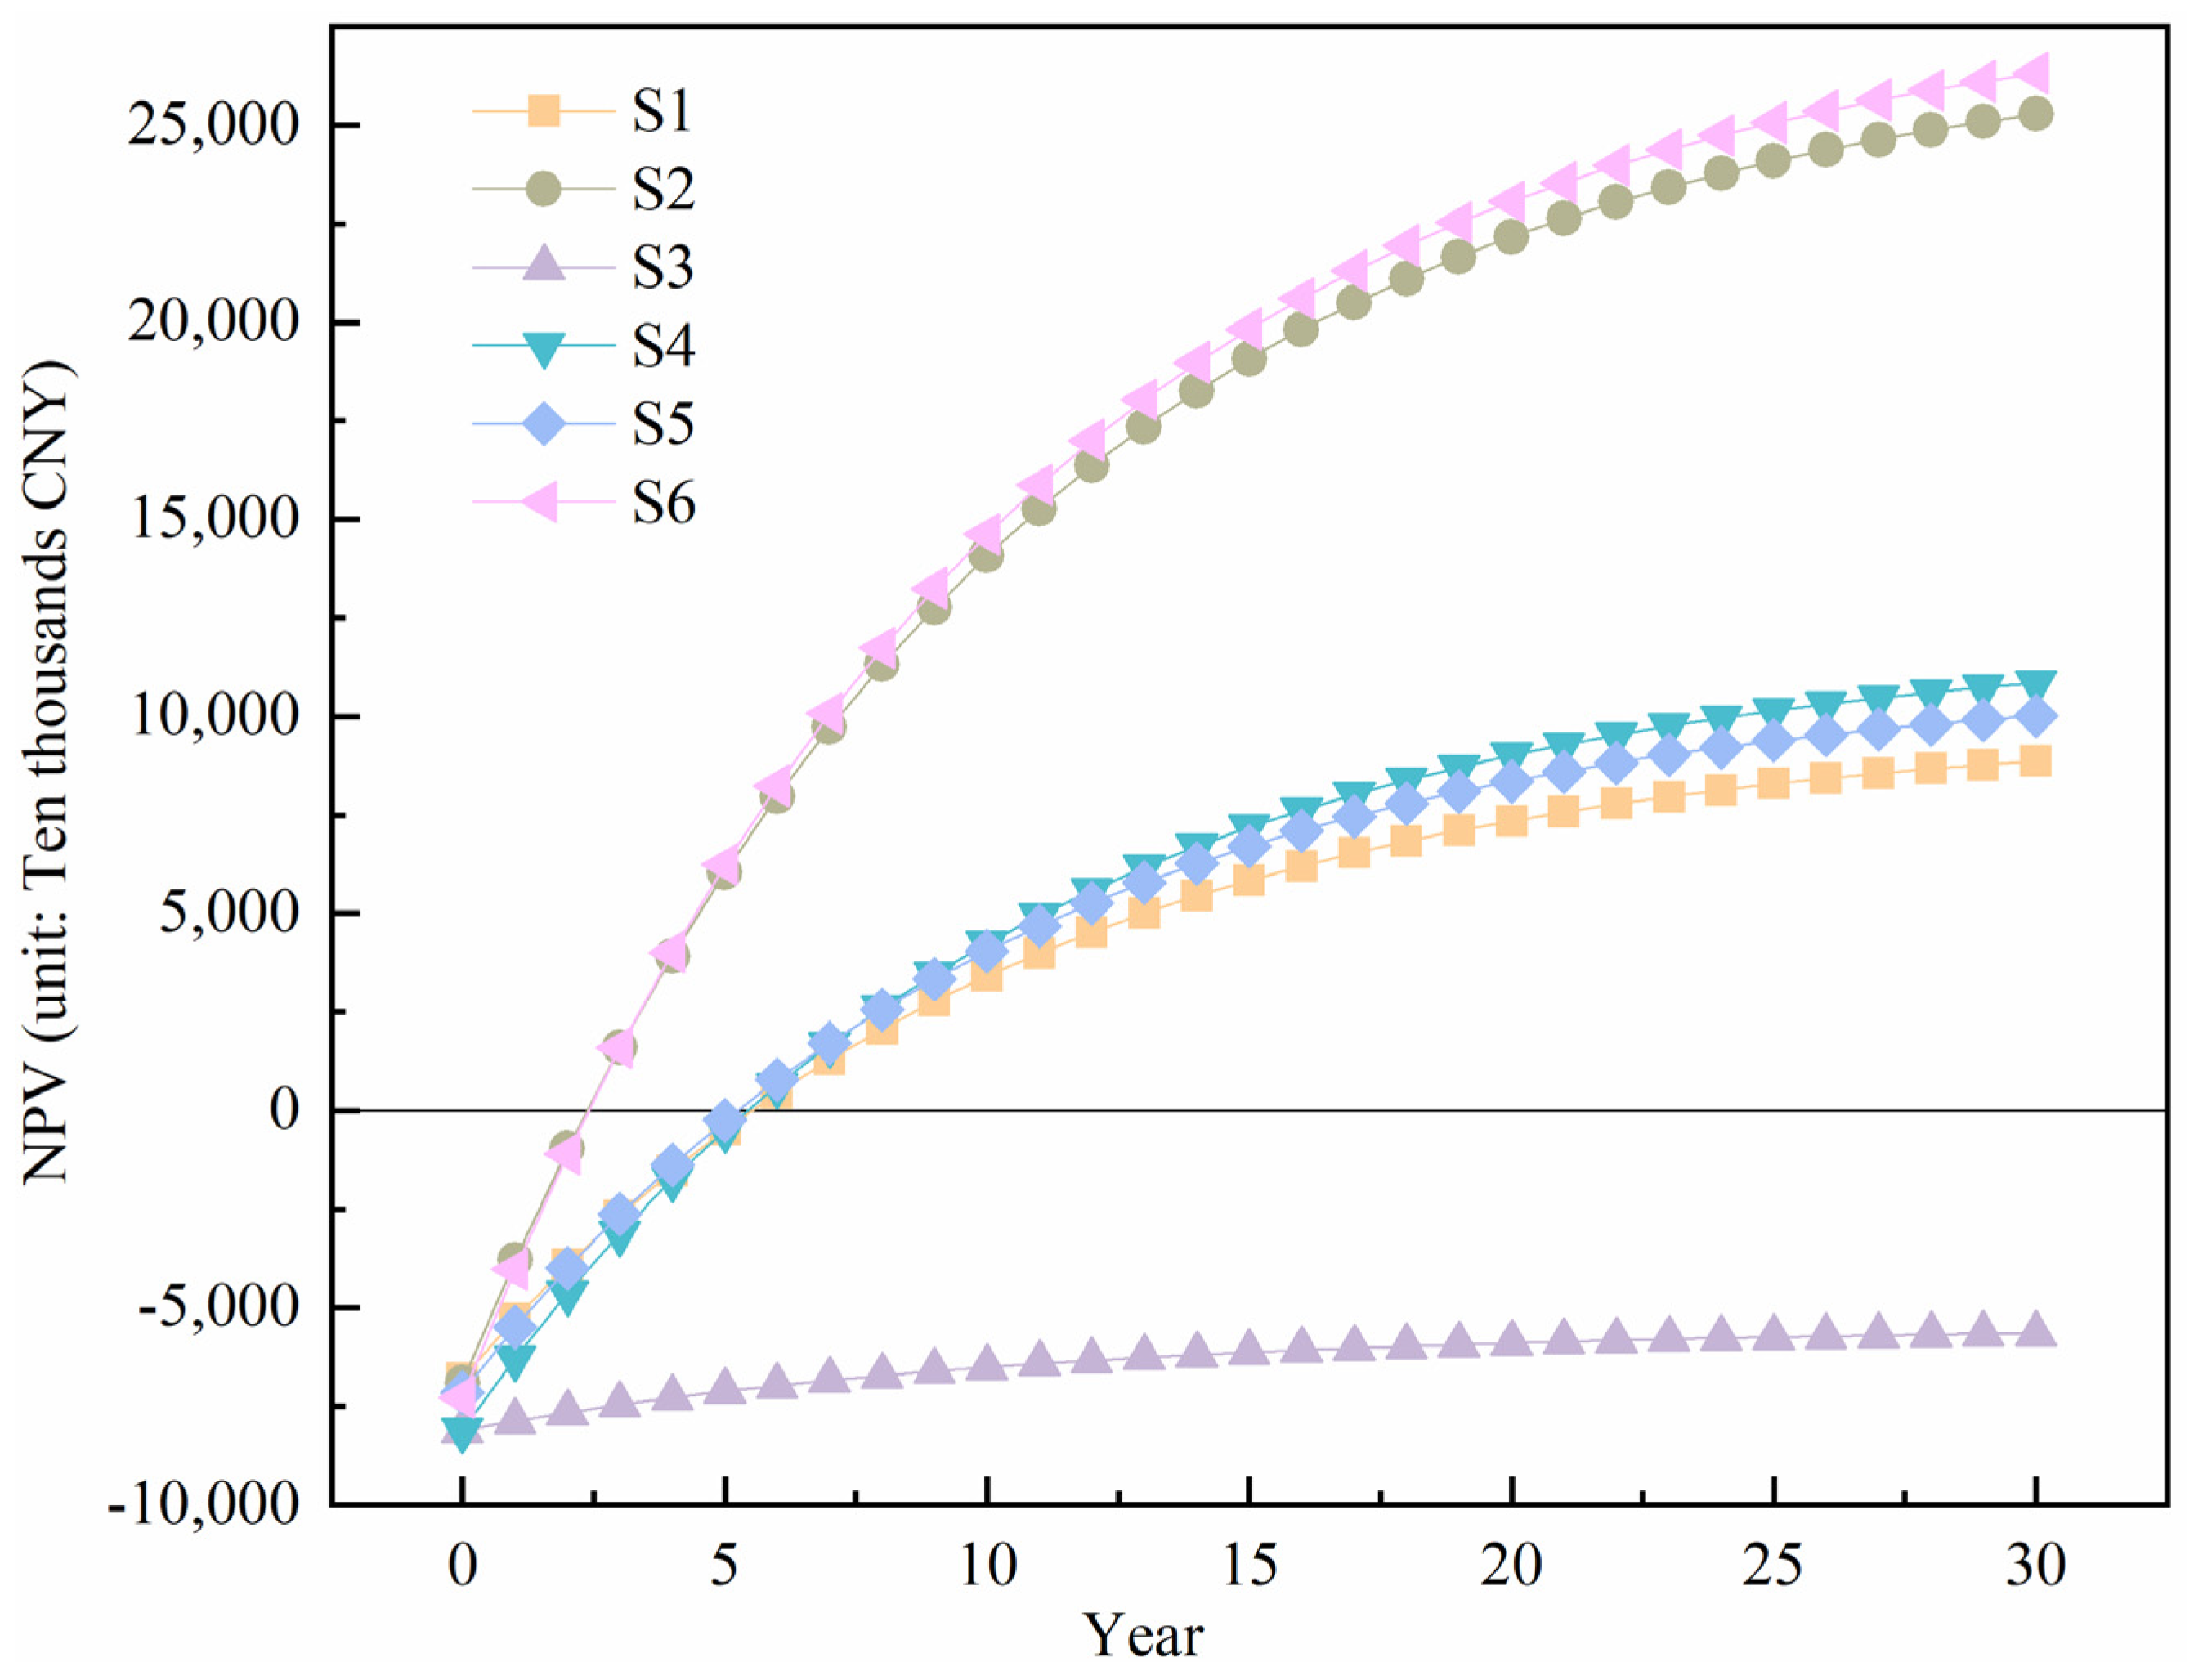
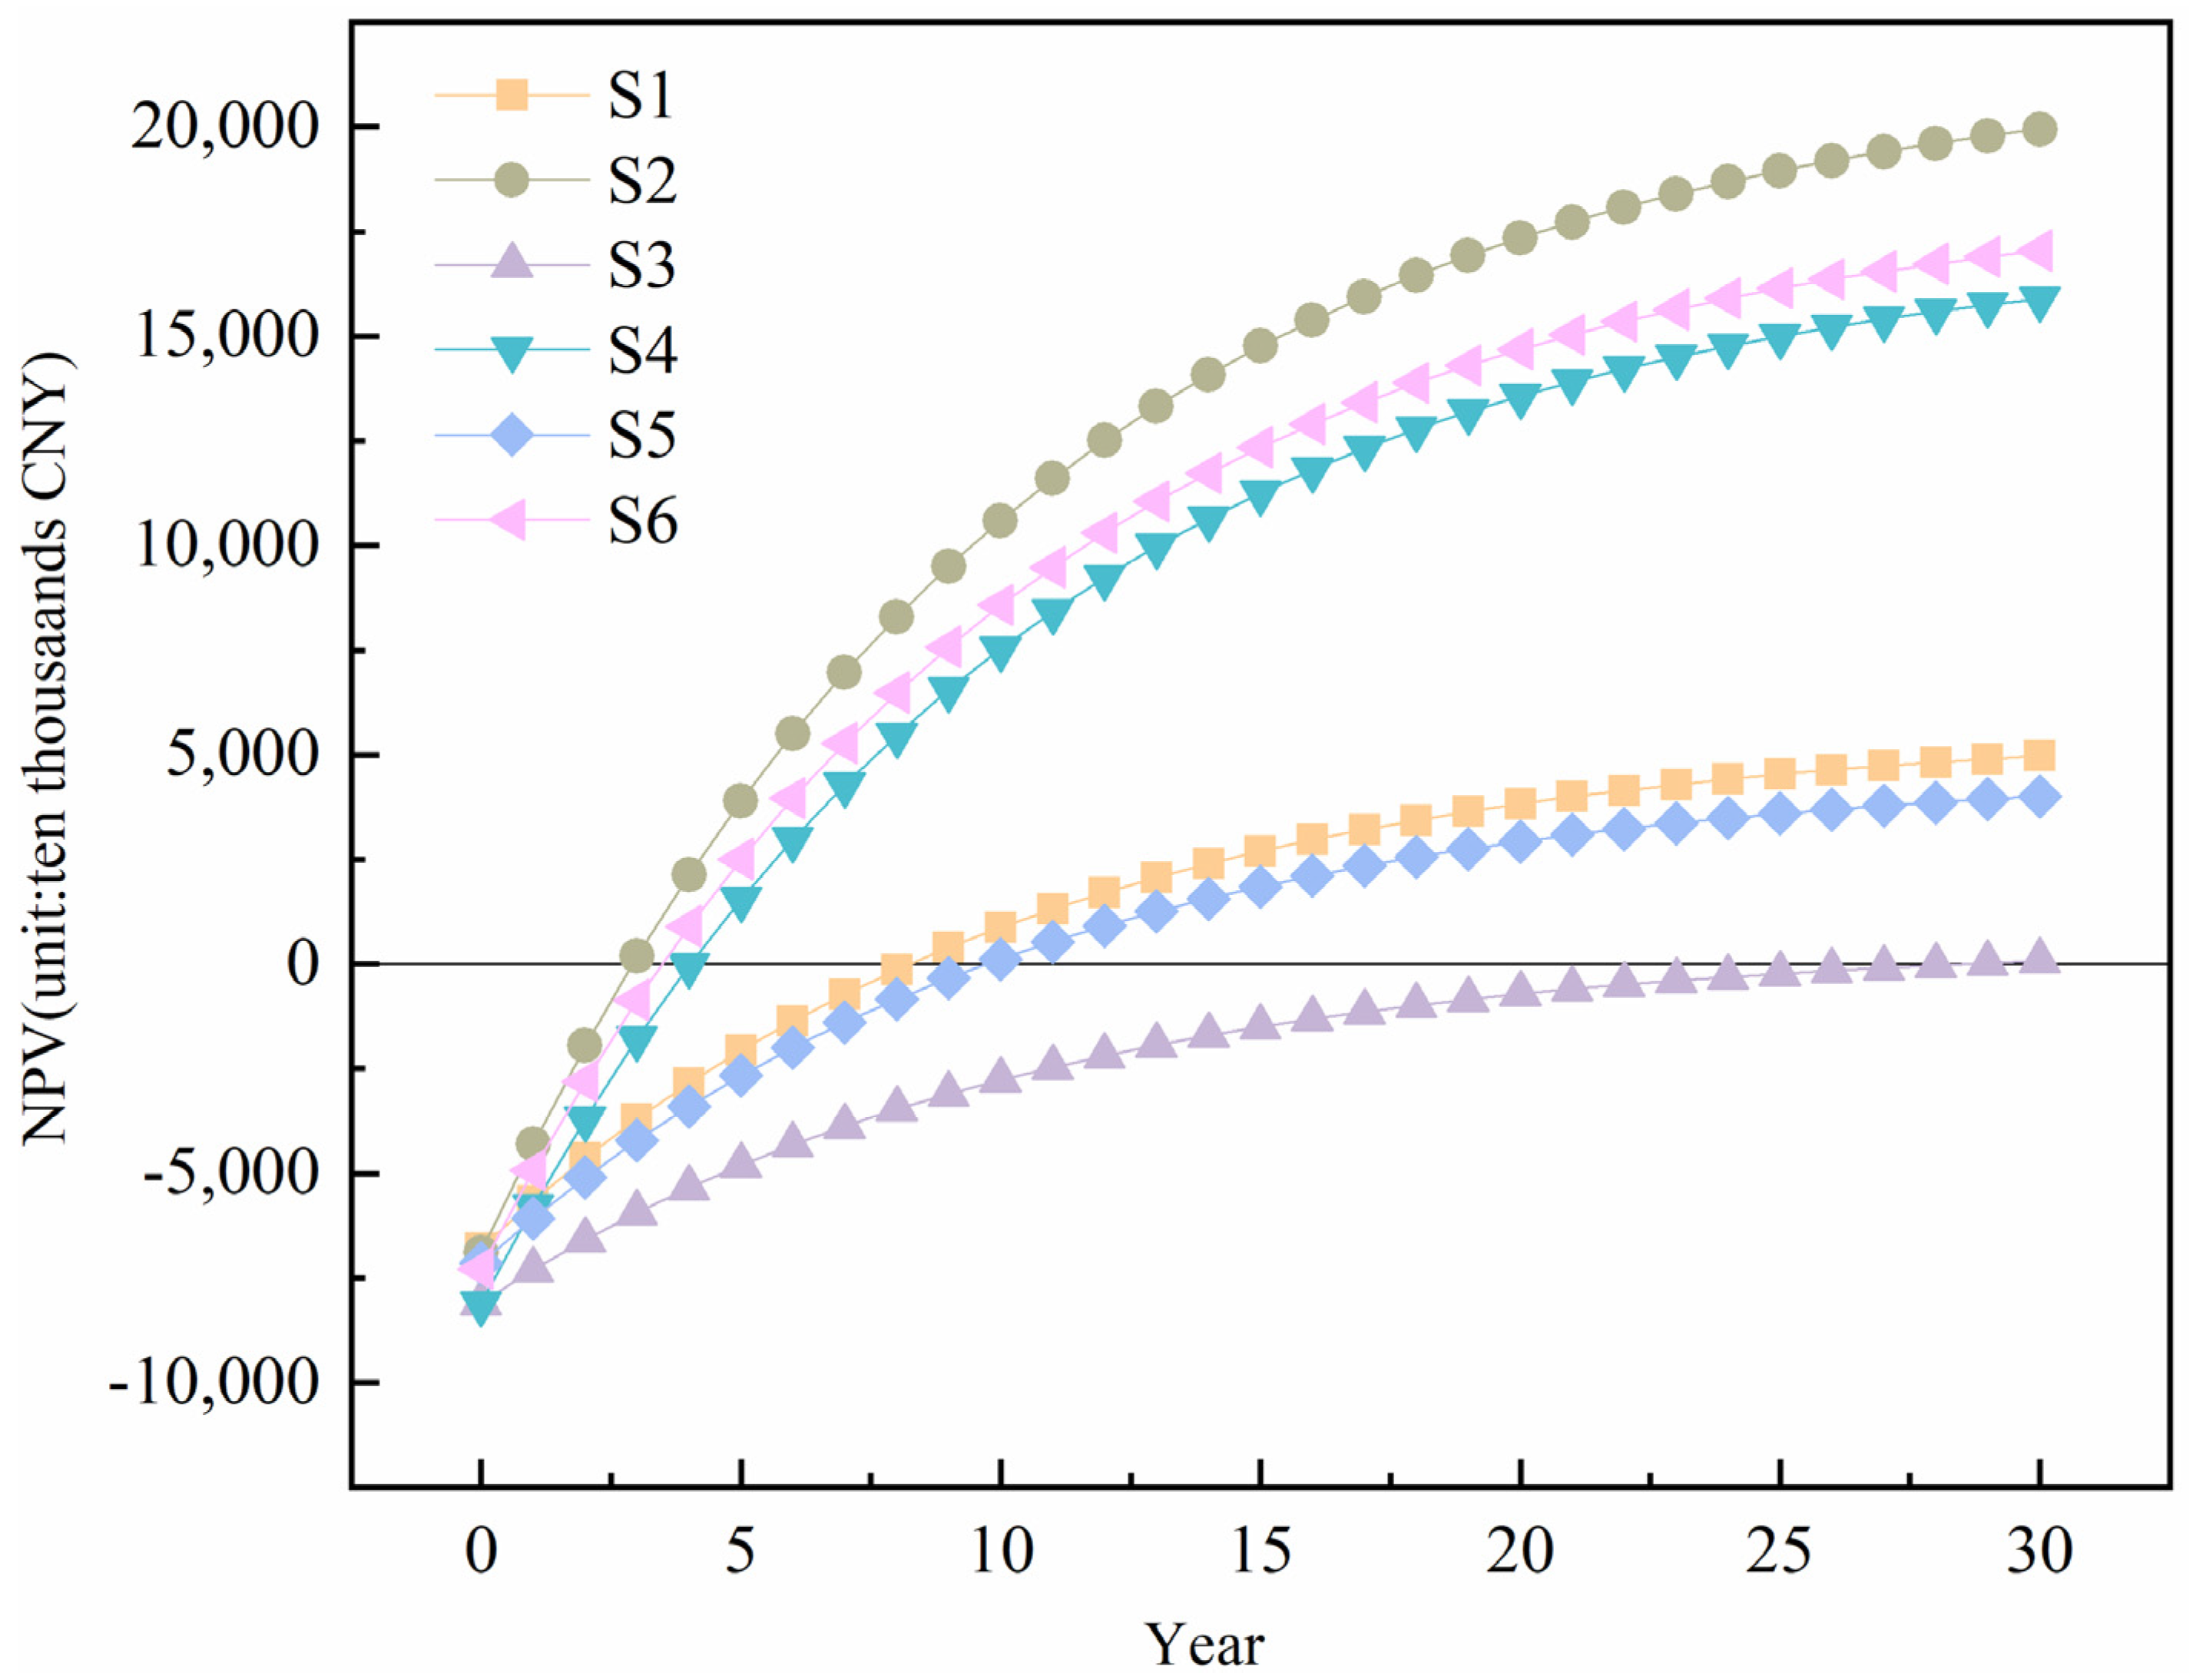
3.3. Economic Analysis

Figure 5 shows the categories of annual operating costs for the six scenarios. S5 incurs the highest overall operating cost at 16.8 million CNY per year, while S2 has the lowest at 13.7 million CNY per year, translating to an operating cost of 68–84 CNY per ton of manure for biogas utilization. Raw material costs constitute a significant portion of the total cost for all six scenarios, ranging from 32% to 37%, and are consistently set at 5 million CNY per year. In the case of S1, S3, and S5, energy consumption costs are comparably high, exceeding 35%, with S5 reaching over 40%, totaling 6.8 million CNY per year. Except for depreciation costs, all other expenses contribute less than 8% to the total costs. Hence, from a cost perspective, the six scenarios could investigate avenues to mitigate energy consumption costs. This could involve optimizing the use of off-peak electricity hours, extending the operational duration of the biogas plant during these hours, and exploring the substitution of diesel with cleaner energy sources to curtail overall energy expenses.
Figure 6 shows the NPV values for the six scenarios over time. Within Figure 6, only S3 exhibits a consistently negative NPV, suggesting the challenge of recovering the initial investment cost for the biogas-to-power and digestate-to-farm projects during the operating period. Profitability initiates for S2 and S6 at 2.4 years with NPV > 0, whereas S1, S4, and S5 recover the initial investment cost only at around 5.5, 5.4, and 5.2 years, respectively. S3 records an annual profit of 18.6 million CNY, averaging 93 CNY per ton of excrement. In contrast, annual revenues for S1, S4, and S5 hover around 30 million CNY, surpassing S3 by 66%. However, coupled with the reapplication of digested slurry to the fields, the realization of resourceful utilization remains elusive. By the conclusion of the 30-year operating period, NPV values for both S2 and S6 range between 250 and 260 million CNY, with these models generating cumulative revenues of 250–260 million CNY for the plant upon the conclusion of the operating life. In contrast, S1, S4, and S5 exhibit NPV values at the end of the operating life of 88, 108, and 100 million CNY, respectively. These three scenarios can ultimately generate nearly 100 million CNY in cumulative revenue for the biogas plant. Research [37] clarifies that the investment payback period for biogas power generation is approximately 12 years, with a net present value (NPV) of 11 million CNY. The primary impetus behind this disparity lies in the divergent early-stage investments and income streams. Regional distinctions accentuate conspicuous disparities in investment costs and revenue pricing, resulting in an almost twofold differential. From the NPV perspective, S3 is economically unfeasible and cannot recover the upfront investment cost during the operating period. Conversely, the other scenarios can recover the investment costs more rapidly and yield higher cumulative returns.
Finally, the study categorizes the six scenarios (low-carbon, economical, environmentally friendly, and low-energy scenarios) based on the outcomes of both environmental and economic analyses. The designated scenario categories utilize GWP, ECER, NPV, and PED indicators as comparative metrics. The study employs the ‘relative difference’ methodology for standardized comparisons, as expressed by the following formula:
Δ = V a l u e A v e r a g e A v e r a g e
Smaller values for GWP, ECER, and PED indicators signify proximity to the corresponding scenario classification. Thus, negative values are assigned for the analysis of these three indicators.
Figure 7 shows a categorical analysis of the six scenarios. In terms of low-carbon considerations, S3 and S4 demonstrate superior performance, exceeding the average level by 60–80%, while S6 exhibits the least favorable performance, falling behind the average level by approximately 100%. S1, S2, S5, and S6 all exhibit commendable energy efficiency, conserving around 20–30% of energy compared to the average. In contrast, S3 and S4 manifest higher-than-average energy consumption levels, exceeding the average by approximately 50%, categorizing them as high-energy-consumption scenarios. S1, S3, and S4 excel in environmental friendliness, showcasing environmental superiority that surpasses the average by 110–140%, categorizing them as eco-friendly scenarios. In contrast, S6 exhibits the poorest environmental performance, falling approximately 220% below the average. From a comprehensive standpoint, S4 emerges as the overall top performer among scenarios, while S5 is identified as the least optimal scenario. S5 demonstrates favorable performance only in the realm of low energy consumption, with subpar performance in other dimensions.

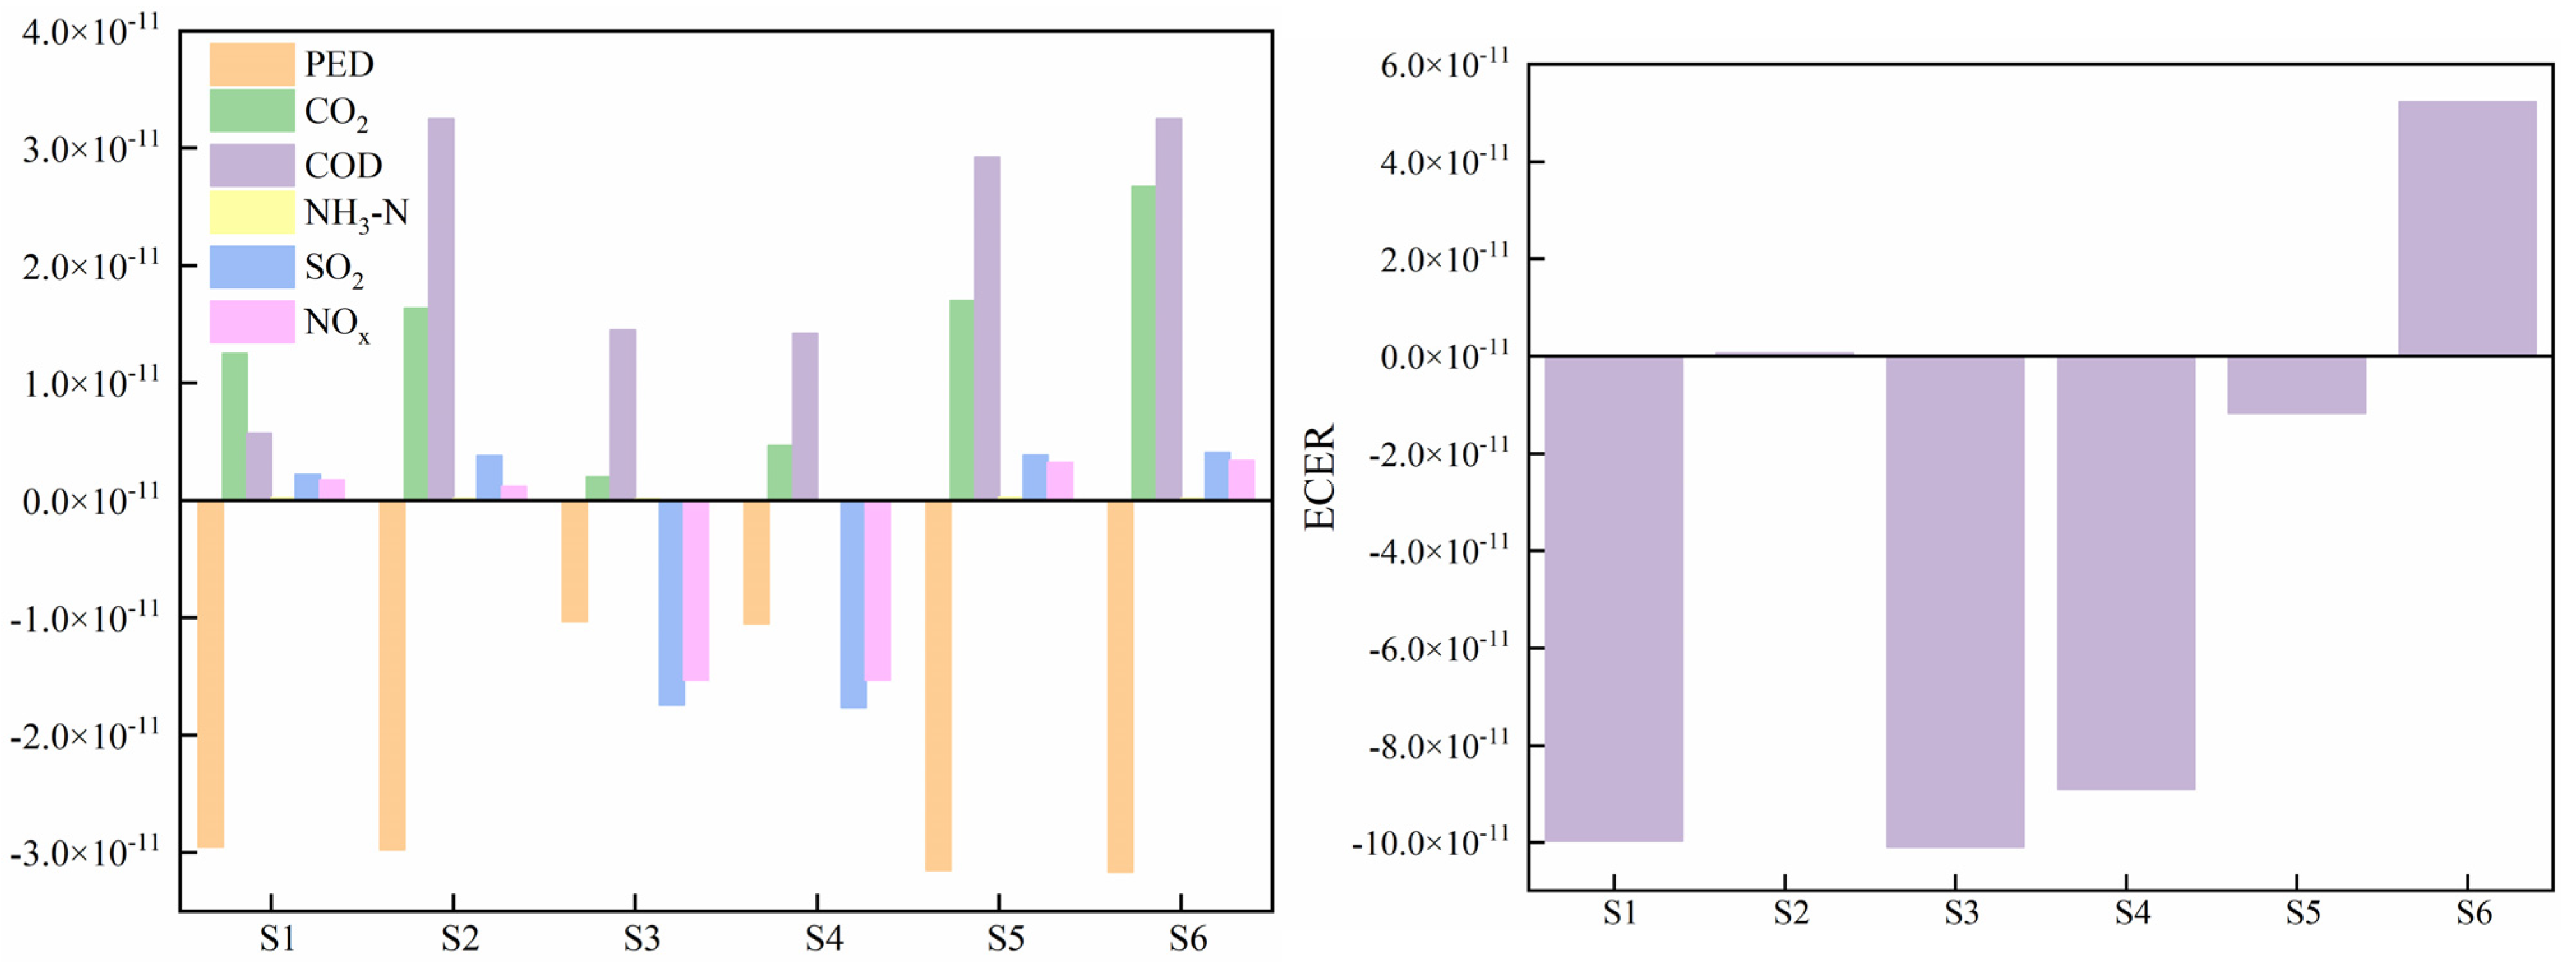
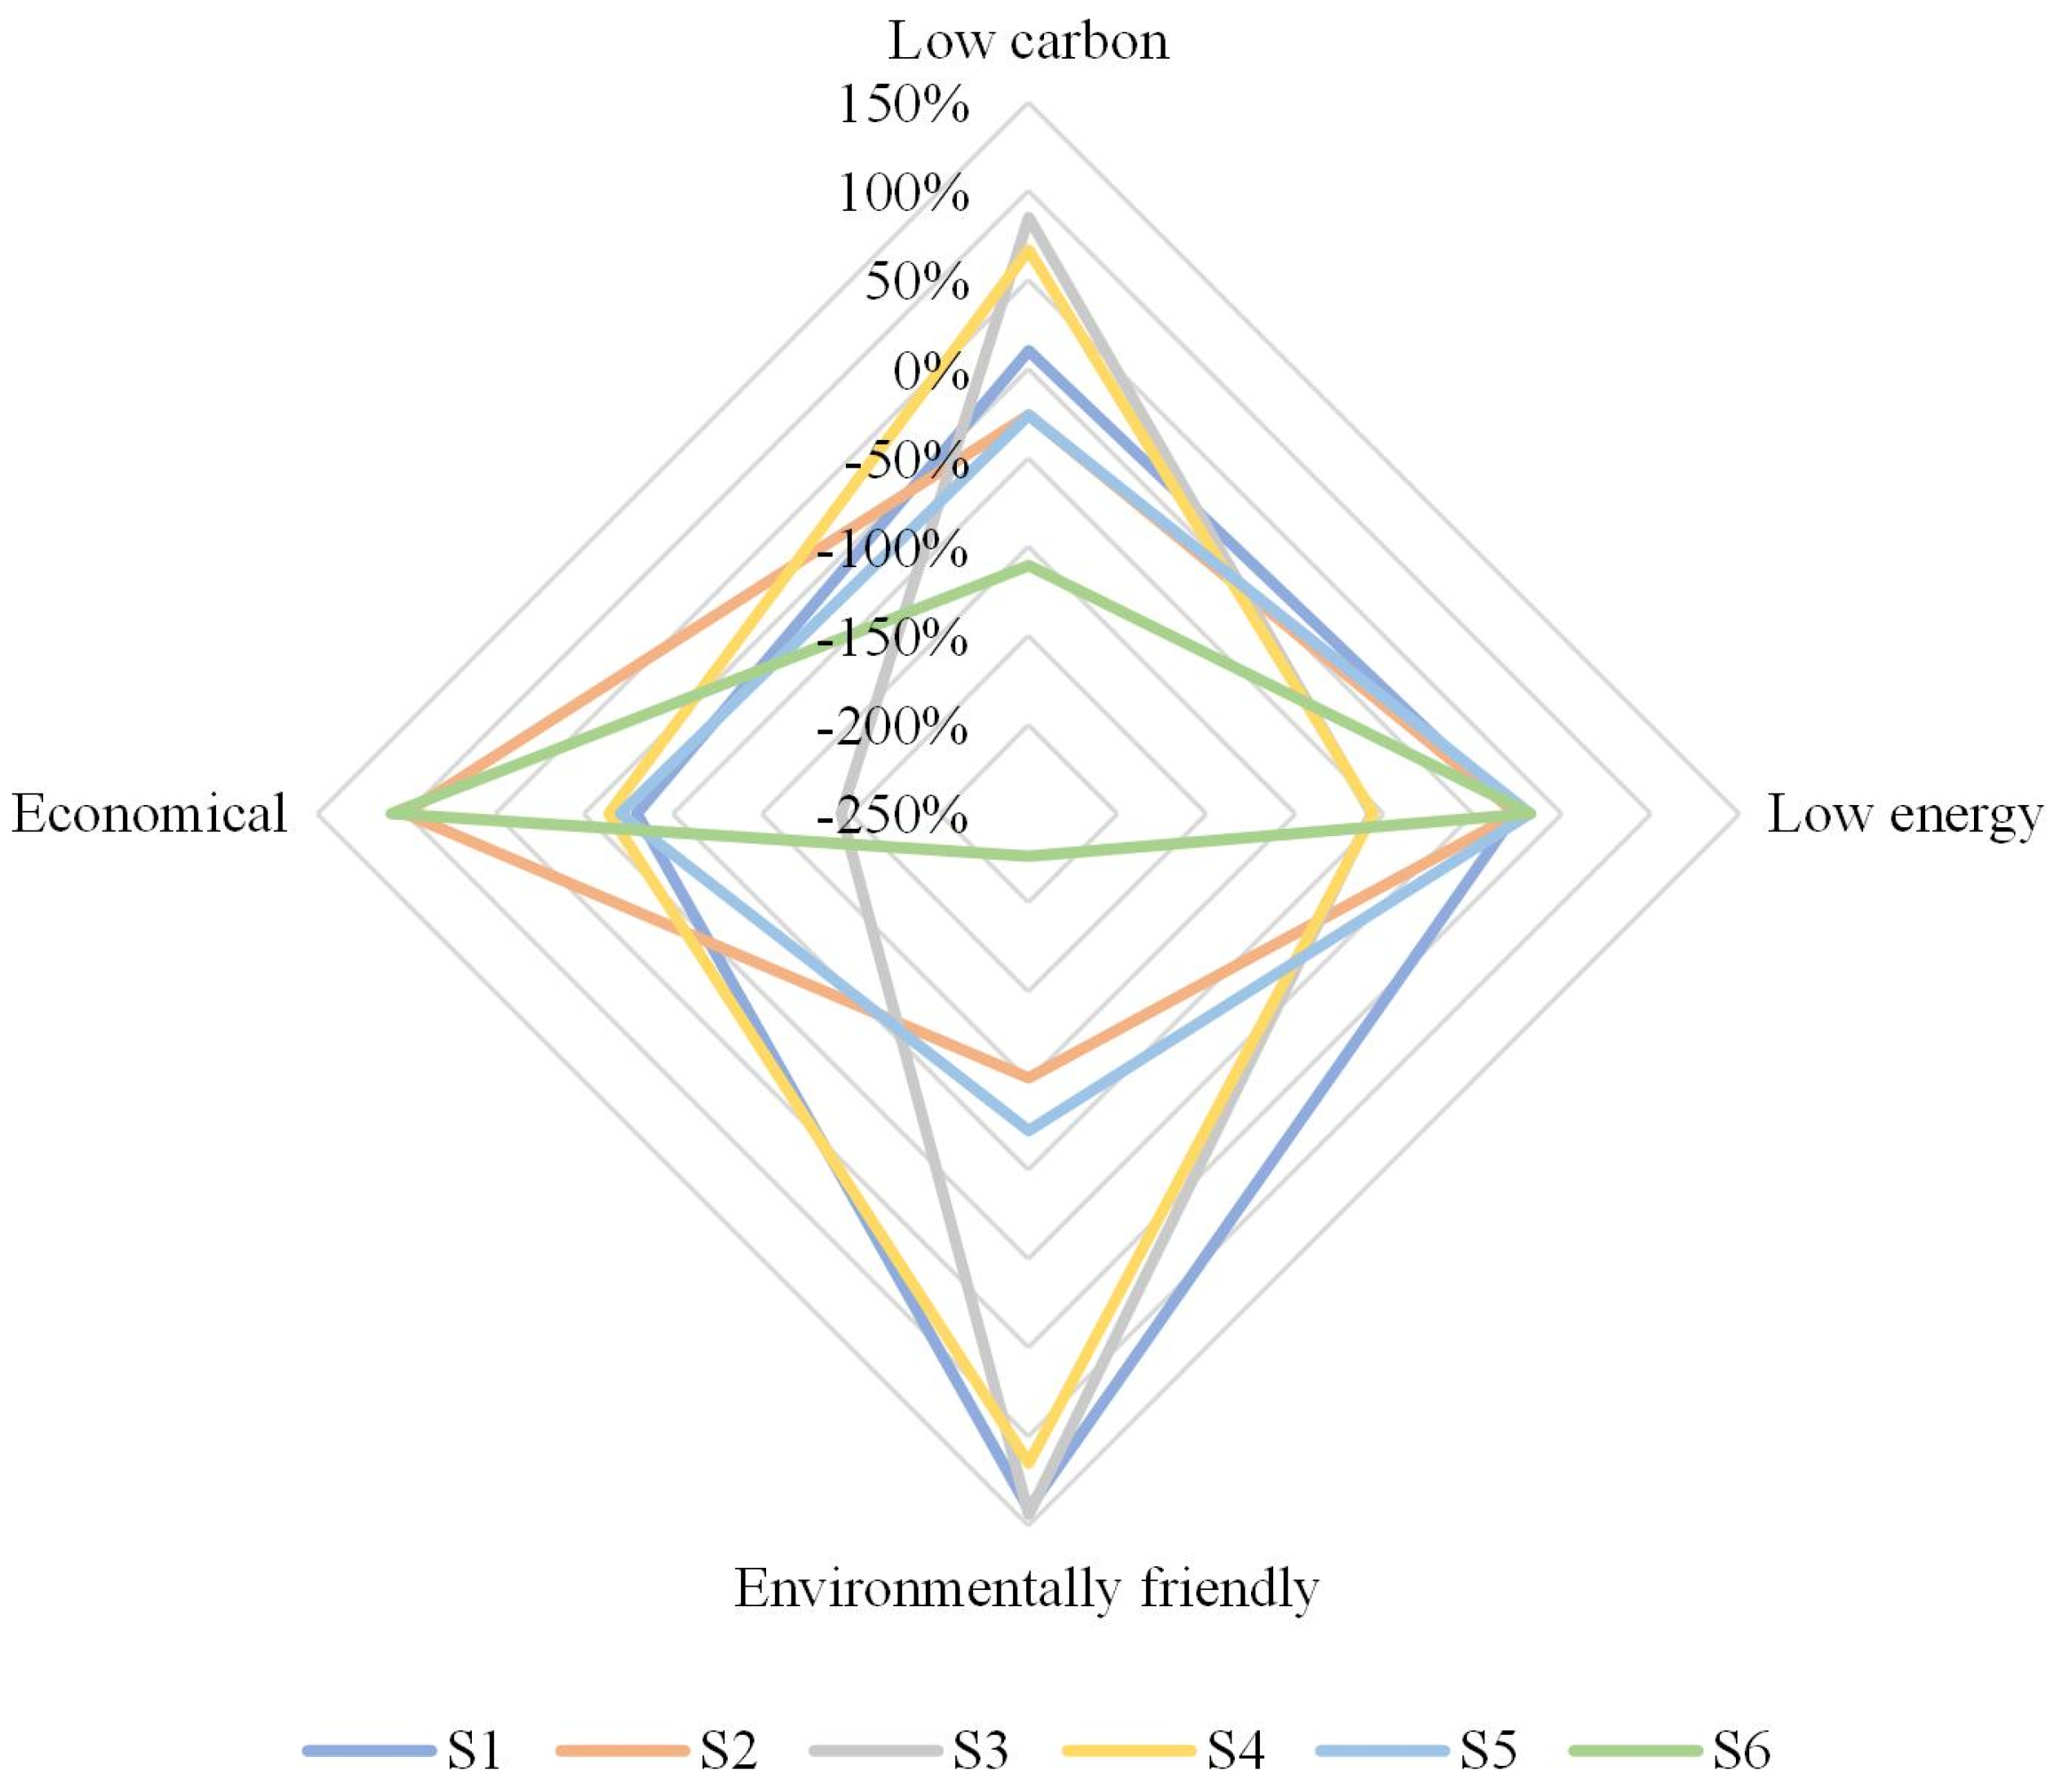
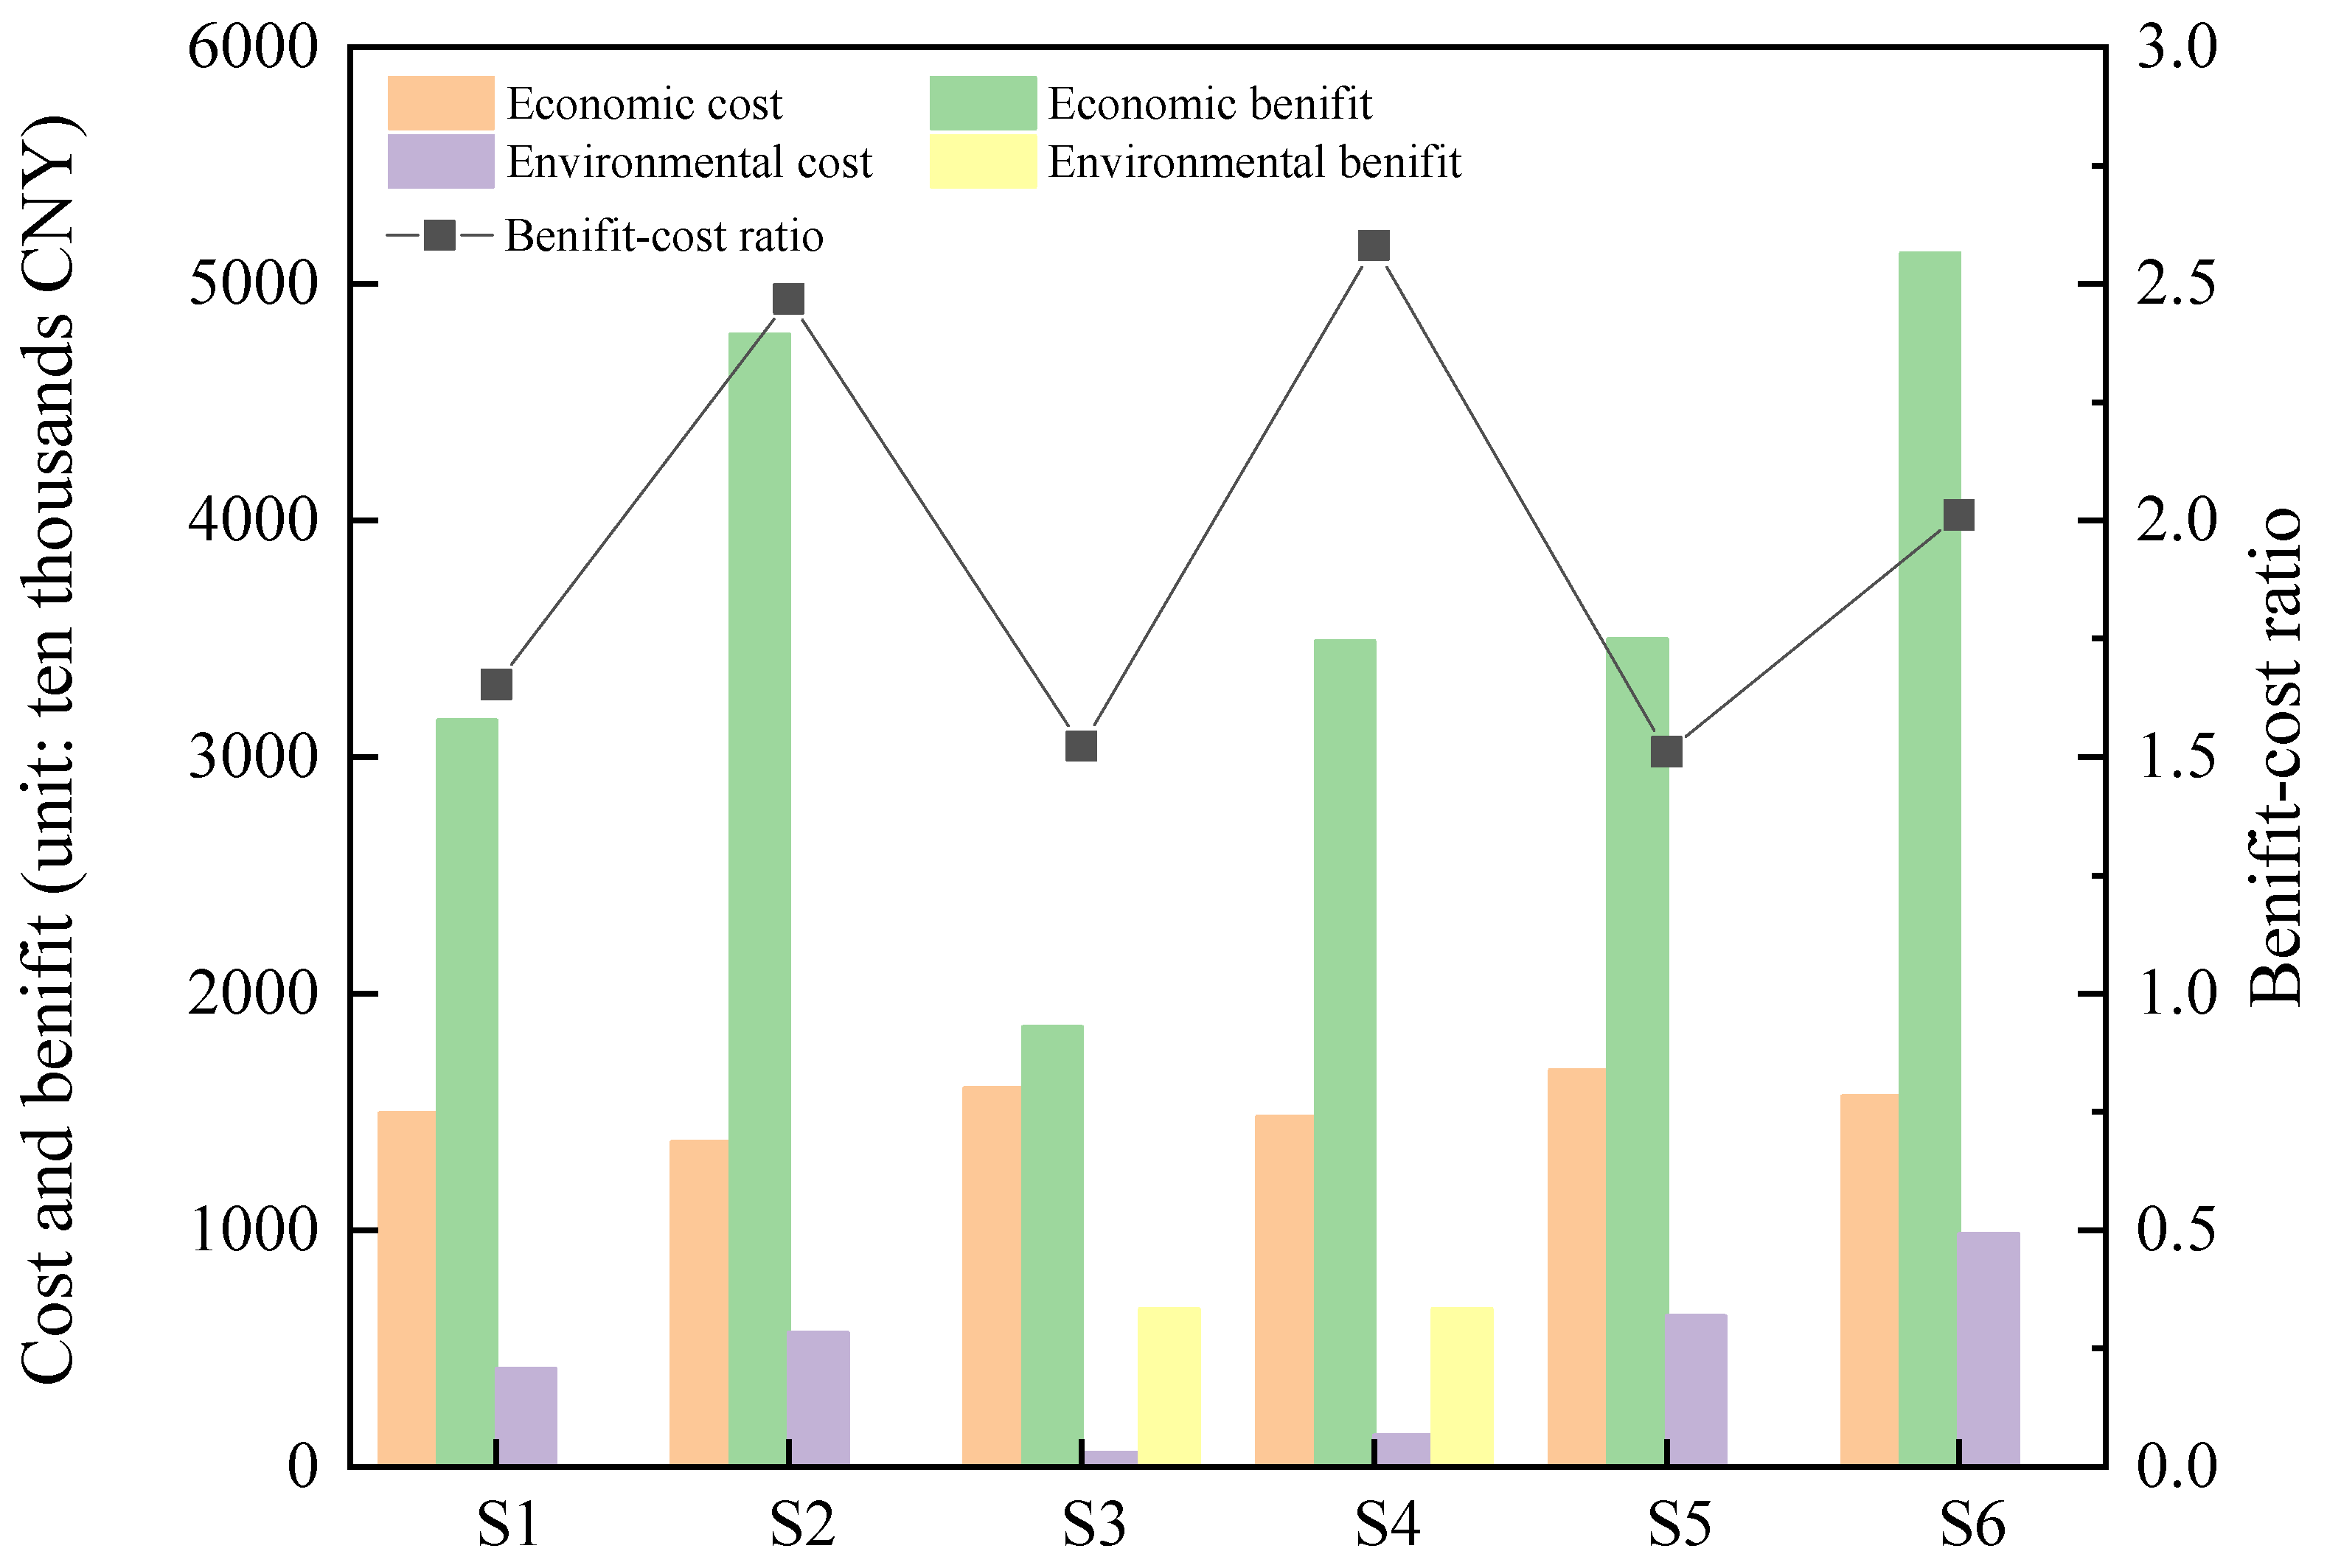
3.4. Coupled Environmental–Economic Analysis

Utilizing the formulas outlined in Section 2.4 and Section 2.5, we derived the environmental costs, benefits, and benefit–cost ratios for the six scenarios. Figure 8 shows the economic and environmental costs, as well as the benefit–cost ratios for the six scenarios. As depicted in Figure 8, the economic benefits of all scenarios, except for S3, substantially surpass the corresponding economic costs, ranging from two to three times higher. This disparity arises from the comprehensive resource utilization of biogas and biogas residue in the five scenarios, maximizing resources to create products with higher economic value. In contrast, S3 exhibits inefficiency in biogas power generation, and the biogas residue lacks resource maximization, leading to diminished economic benefits. However, when considering the environmental valuation, only S3 and S4 exhibit environmental–economic benefits, yielding annual environmental benefits surpassing 6.6 million CNY, while the remaining scenarios incur environmental costs. Furthermore, in terms of environmental costs, S3 and S4 demonstrate significantly lower costs compared to the other four scenarios, constituting only 6% to 32% of the environmental costs of the remaining scenarios. Regarding both annual economic benefits and environmental costs, S6 records the highest figures, exceeding 50 million and 9.8 million CNY, respectively. Conversely, S3 exhibits the lowest annual environmental cost, amounting to only 0.58 million CNY, marking a nearly 20-fold difference between the two extremes. Considering the benefit–cost ratio, S4 emerges as the top performer with a ratio of 2.58, while S5 has the lowest benefit–cost ratio at only 1.51. This difference of nearly one time is primarily attributable to the high environmental cost associated with returning biogas residue to the field. Additionally, the inadequate utilization rate of biogas residue as a resource hinders the creation of products with higher economic value. Nevertheless, all six scenarios boast a benefit–cost ratio greater than one, signifying their feasibility from both environmental and economic perspectives. Among the scenarios, S4 stands out as the most favorable, while S5 receives the least favorable overall evaluation.
Upon incorporating environmental costs and benefits, the NPV values for all six scenarios undergo modification. Figure 9 shows the economic and environmental costs, as well as the benefit–cost ratios for the six scenarios. An intriguing observation is that S3 begins to generate actual profit in the 29th year. In comparison with Figure 6, the payback period for S4 was reduced by 1.4 years, indicating an advancement of one and a half years. Conversely, the payback periods for the other four scenarios were extended, ranging from 0.5 to 4.5 years. Particularly, S5 experienced the most significant increase, stretching from 5.2 years to 9.7 years. Regarding NPV, the values for all scenarios decreased except for S3 and S4. As an illustration, the NPV value for S5 declined from 10 million to 4 million CNY in year 30, representing a decrease of over 50%. Likewise, the other scenarios experienced a decrease ranging from 21% to 44%. Observing Figure 9, S3 and S4 exhibit the most substantial changes in NPV values, and the NPV value of S4 approximates that of S2 and S6. Despite the decrease in NPV values for S2 and S6, both scenarios still possess the highest NPV values. It is noteworthy that the NPV value of S1 exceeds that of S5 by approximately 20% after the incorporation of environmental costs and benefits. Hence, environmental impacts adversely affect the economic viability of scenarios S1, S2, S5, and S6, while exerting a positive influence on S3 and S4. Furthermore, the study by Zhang et al. [37] similarly posits that the economic benefits of biogas power generation are enhanced after the monetization of environmental advantages.
Considering both environmental and economic factors, S4 outperforms other scenarios. Despite not having the highest NPV after incorporating environmental costs and benefits, S4 experiences the most substantial change, with the highest efficiency ratio. Conversely, S5 exhibits relatively poor performance, marked by a decline in NPV and the lowest efficiency ratio among the six scenarios. In future developments, S1, S2, S5, and S6 should prioritize enhancing the environmental impacts of their models, whereas S3 and S4 should concentrate on improving energy efficiency and optimizing biomass biogas generation. Nevertheless, from an environmental perspective, the operational paradigm of S1 has a relatively minor impact on the environment. This is attributed to S1 having lower environmental costs than alternative operational models, with a discrepancy ranging from 20% to 40%. Nevertheless, a significant disparity arises when comparing the economic benefits and costs of S1 with the other three operational models. S2 and S6 both exhibit outstanding economic performance, with economic returns surpassing costs by a factor of three to four. Regarding economic gains, S2 and S6 outperform other technologies by 40% to 100%. Therefore, the operational model of S1 falls under the category of eco-friendliness, while the operational paradigms of S2 and S6 align with economic viability.

4. Conclusions

This study focuses on a biogas plant in Tangshan City that utilizes waste heat from an iron and steel plant for warming and insulation treatment. The research analyzes six distinct models for the utilization of biogas, sludge, and biogas residue, conducting an environmental assessment from a life cycle perspective. The analysis results indicate that, across all scenarios, electricity consumption and direct emissions predominantly contribute to the rise in most environmental impact indicators, while energy products play a crucial role in reducing these indicators. S4 exhibits a significant advantage in the majority of environmental impact indicators, ranging from approximately −1200% to 33%. Among the ECER indicators, S6 demonstrates the highest combined environmental impact, nearly three times greater than the other scenarios, reaching 5.22 × 10⁻¹¹.
Using the NPV method, the economics and payback periods of the six scenarios are analyzed, and the study shows that the cost of raw materials is the main contributor to the operating costs of the six scenarios. S2 has the shortest payback period, recovering the initial investment in only 2.4 years, with a final cumulative profit of 250 million CNY, whereas S3 has difficulty recovering the upfront investment in a 30-year operating period. In the ultimate analysis, considering a holistic perspective, it is ascertained that S4 stands out as the most optimal scenario, demonstrating superior performance across a multitude of key indicators.
Finally, an integration of environmental and economic factors was conducted to assess the combined impacts of the six scenarios. Results indicate that S4 boasts the highest benefit–cost ratio of 2.58. S5, considering environmental costs and benefits, achieves the recovery of upfront investment in the 29th year. Except for S3 and S4, the NPV values for all scenarios experienced a decrease of approximately 20%. Taking into account both environmental and economic factors, S4 emerges as the top performer, while S5 is comparatively less favorable among the six scenarios.
Amid the global energy crisis, the utilization of biogas and digestate emerges as a promising avenue for sustainable development. This study thoroughly examines the environmental impacts and economic benefits arising from different operational paradigms of biogas and digestate. It provides policymakers with a comprehensive dataset, facilitating the informed selection of operational modes for biogas and digestate. Therefore, in future research, considering the integration of mathematical–statistical methodologies like factor analysis may help identify optimal operational models. Moreover, exploring diverse modes of biogas utilization and incorporating them into the research scope could enhance the comprehensiveness of the studies.

Author Contributions

Conceptualization, J.G.; Methodology, J.G. and A.J.; Software, J.G.; Validation, J.G.; Formal analysis, J.G., A.J. and Y.X.; Investigation, J.G., Y.L., S.W. and A.J.; Resources, Y.L.; Data curation, J.G.; Writing—original draft, J.G.; Writing—review & editing, N.L., S.W., A.J. and Y.X.; Visualization, X.Y.; Supervision, N.L.; Project administration, X.Y.; Funding acquisition, H.L. All authors have read and agreed to the published version of the manuscript.

Funding

This research was supported by the Soft Science Research Special Project under project number 22554005D and the Natural Science Foundation of Hebei Province under project number E2022209138.

Data Availability Statement

All the data generated or analyzed in this study are included in this published article.

Conflicts of Interest

The authors declare no conflict of interest.

References

  1. National Bureau of Statistics. Available online: http://www.stats.gov.cn (accessed on 5 August 2023).
  2. Battini, F.; Agostini, A.; Boulamanti, A.; Giuntoli, J.; Amaducci, S. Mitigating the environmental impacts of milk production via anaerobic digestion of manure: Case study of a dairy farm in the Po Valley. Sci. Total Environ. 2014, 481, 196–208. [Google Scholar] [CrossRef] [PubMed]
  3. Qi, J.; Yang, H.; Wang, X.; Zhu, H.; Wang, Z.; Zhao, C.; Li, B.; Liu, Z. State-of-the-art on animal manure pollution control and resource utilization. J. Environ. Chem. Eng. 2023, 11, 110462. [Google Scholar] [CrossRef]
  4. Gutiérrez, A.S.; Eras, J.J.C.; Billen, P.; Vandecasteele, C. Environmental assessment of pig production in Cienfuegos, Cuba: Alternatives for manure management. J. Clean. Prod. 2016, 112, 2518–2528. [Google Scholar] [CrossRef]
  5. Martínez-Valdez, F.; Komilis, D.; Saucedo-Castañeda, G.; Barrena, R.; Sanchez, A. The Effect of a Short Term Aerobic Pretreatment Step on the Anaerobic Co-digestion of the Organic Fraction of Municipal Solid Wastes: Liquid Extract Addition Versus Solid Phase Addition. Waste Biomass Valorization 2017, 8, 1793–1801. [Google Scholar] [CrossRef]
  6. Morero, B.; Groppelli, E.; Campanella, E.A. Life cycle assessment of biomethane use in Argentina. Bioresour. Technol. 2015, 182, 208–216. [Google Scholar] [CrossRef] [PubMed]
  7. Mertins, A.; Wawer, T. How to use biogas? A systematic review of biogas utilization pathways and business models. Bioresour. Bioprocess. 2022, 9, 59. [Google Scholar] [CrossRef]
  8. Li, J.; Gan, C.; Zhou, J.; Novakovic, V. Performance analysis of biomass direct combustion heating and centralized biogas supply system for rural districts in China. Energy Convers. Manag. 2023, 278, 116730. [Google Scholar] [CrossRef]
  9. Alonso-Vicario, A.; Ochoa-Gómez, J.R.; Gil-Río, S.; Gómez-Jiménez-Aberasturi, O.; Ramírez-López, C.; Torrecilla-Soria, J.; Domínguez, A. Purification and upgrading of biogas by pressure swing adsorption on synthetic and natural zeolites. Microporous Mesoporous Mater. 2010, 134, 100–107. [Google Scholar] [CrossRef]
  10. Minciuc, E.; Bitir-Istrate, I.; Patrascu, R.; Rada, E.C. Efficiency of Biogas Utilization for Cogeneration. Sci. Bull.-"Politeh." Univ. Buchar. Ser. C Electr. Eng. Comput. Sci. 2016, 78, 259–266. [Google Scholar]
  11. Sun, Y.; Yang, B.; Wang, Y.; Zheng, Z.; Wang, J.; Yue, Y.; Mu, W.; Xu, G.; Ying, J. Emergy evaluation of biogas production system in China from perspective of collection radius. Energy 2023, 265, 126377. [Google Scholar] [CrossRef]
  12. Arshad, F.; Lin, J.; Manurkar, N.; Fan, E.; Ahmad, A.; Tariq, M.-U.; Wu, F.; Chen, R.; Li, L. Life Cycle Assessment of Lithium-ion Batteries: A Critical Review. Resour. Conserv. Recycl. 2022, 180, 106164. [Google Scholar] [CrossRef]
  13. Blengini, G.; Brizio, E.; Cibrario, M.; Genon, G. LCA of bioenergy chains in Piedmont (Italy): A case study to support public decision makers towards sustainability. Resour. Conserv. Recycl. 2011, 57, 36–47. [Google Scholar] [CrossRef]
  14. Chen, B.; Chen, S. Life cycle assessment of coupling household biogas production to agricultural industry: A case study of biogas-linked persimmon cultivation and processing system. Energy Policy 2013, 62, 707–716. [Google Scholar] [CrossRef]
  15. Lijó, L.; Lorenzo-Toja, Y.; González-García, S.; Bacenetti, J.; Negri, M.; Moreira, M.T. Eco-efficiency assessment of farm-scaled biogas plants. Bioresour. Technol. 2017, 237, 146–155. [Google Scholar] [CrossRef] [PubMed]
  16. Krexner, T.; Bauer, A.; Zollitsch, W.; Weiland, K.; Bismarck, A.; Mautner, A.; Medel-Jiménez, F.; Gronauer, A.; Kral, I. Environmental life cycle assessment of nano-cellulose and biogas production from manure. J. Environ. Manag. 2022, 314, 115093. [Google Scholar] [CrossRef]
  17. Alengebawy, A.; Mohamed, B.; Ghimire, N.; Jin, K.; Liu, T.; Samer, M.; Ai, P. Understanding the environmental impacts of biogas utilization for energy production through life cycle assessment: An action towards reducing emissions. Environ. Res. 2022, 213, 113632. [Google Scholar] [CrossRef]
  18. Zhang, L.; Wang, J.; Li, S. Regional suitability analysis of the rural biogas power generation industry: A case of China. Renew. Energy 2022, 194, 293–306. [Google Scholar] [CrossRef]
  19. Purwanta; Bayu, A.I.; Mellyanawaty, M.; Budiman, A.; Budhijanto, W. Techno-economic analysis of reactor types and biogas utilization schemes in thermophilic anaerobic digestion of sugarcane vinasse. Renew. Energy 2022, 201, 864–875. [Google Scholar] [CrossRef]
  20. Kusmiyati, K.; Wijaya, D.K.; Hartono, B.R.; Shidik, G.F.; Fudholi, A. Harnessing the power of cow dung: Exploring the environmental, energy, and economic potential of biogas production in Indonesia. Results Eng. 2023, 20, 101431. [Google Scholar] [CrossRef]
  21. Zhao, H.; Liu, H.; Wei, G.; Wang, H.; Zhu, Y.; Zhang, R.; Yang, Y. Comparative life cycle assessment of emergency disposal scenarios for medical waste during the COVID-19 pandemic in China. Waste Manag. 2021, 126, 388–399. [Google Scholar] [CrossRef]
  22. Ding, J.; Hu, X.; Feng, Z.; Dong, L. Environmental life cycle assessment of monosodium glutamate production in China: Based on the progress of cleaner production in recent ten years. Sci. Total Environ. 2022, 818, 151706. [Google Scholar] [CrossRef] [PubMed]
  23. Lyu, Y.; Raugei, M.; Zhang, X.; Mellino, S.; Ulgiati, S. Environmental cost and impacts of chemicals used in agriculture: An integration of emergy and Life Cycle Assessment. Renew. Sustain. Energy Rev. 2021, 151, 111604. [Google Scholar] [CrossRef]
  24. Zhao, H.-L.; Liu, F.; Liu, H.-Q.; Wang, L.; Zhang, R.; Hao, Y. Comparative life cycle assessment of two ceramsite production technologies for reusing municipal solid waste incinerator fly ash in China. Waste Manag. 2020, 113, 447–455. [Google Scholar] [CrossRef] [PubMed]
  25. National Bureau of Statistics. China Statistical Yearbook. 2022. Available online: http://www.stats.gov.cn/sj/ndsj/2022/indexch.htm (accessed on 13 July 2004).
  26. Schloter, L. Empirical analysis of the depreciation of electric vehicles compared to gasoline vehicles. Transp. Policy 2022, 126, 268–279. [Google Scholar] [CrossRef]
  27. Guo, S.; Li, X.; Zhao, R.; Gong, Y. Comparison of life cycle assessment between lyocell fiber and viscose fiber in China. Int. J. Life Cycle Assess. 2021, 26, 1545–1555. [Google Scholar] [CrossRef]
  28. Liu, F.; Liu, H.; Yang, N.; Wang, L. Comparative study of municipal solid waste incinerator fly ash reutilization in China: Environmental and economic performances. Resour. Conserv. Recycl. 2021, 169, 105541. [Google Scholar] [CrossRef]
  29. Liu, H.; Qiao, H.; Liu, S.; Wei, G.; Zhao, H.; Li, K.; Weng, F. Energy, environment and economy assessment of sewage sludge incineration technologies in China. Energy 2023, 264, 126294. [Google Scholar] [CrossRef]
  30. Zhao, H.-L.; Wang, L.; Liu, F.; Liu, H.-Q.; Zhang, N.; Zhu, Y.-W. Energy, environment and economy assessment of medical waste disposal technologies in China. Sci. Total Environ. 2021, 796, 148964. [Google Scholar] [CrossRef]
  31. Abdelhady, S. Performance and cost evaluation of solar dish power plant: Sensitivity analysis of levelized cost of electricity (LCOE) and net present value (NPV). Renew. Energ. 2021, 168, 332–342. [Google Scholar] [CrossRef]
  32. Zheng, W.; Shi, H.; Chen, S.; Zhu, M. Benefit and cost analysis of mariculture based on ecosystem services. Ecol. Econ. 2009, 68, 1626–1632. [Google Scholar] [CrossRef]
  33. Huysegoms, L.; Rousseau, S.; Cappuyns, V. Friends or foes? Monetized Life Cycle Assessment and Cost-Benefit Analysis of the site remediation of a former gas plant. Sci. Total Environ. 2018, 619–620, 258–271. [Google Scholar] [CrossRef] [PubMed]
  34. Da Silva, C.; Barbosa-Póvoa, A.P.; Carvalho, A. Sustainable Supply Chain: Monetization of Environmental Impacts. Comput. Aided Chem. Eng. 2018, 43, 773–778. [Google Scholar]
  35. Huang, B.; Wang, Y.; Huang, Y.; Xu, X.; Chen, X.; Duan, L.; Yu, G.; Li, Z.; Liu, H.; Kua, H.W.; et al. Life cycle cost analysis of solar energy via environmental externality monetization. Sci. Total Environ. 2023, 856, 158910. [Google Scholar] [CrossRef]
  36. Chen, S.; Chen, B.; Song, D. Life-cycle energy production and emissions mitigation by comprehensive biogas–digestate utilization. Bioresour. Technol. 2012, 114, 357–364. [Google Scholar] [CrossRef] [PubMed]
  37. Zhang, C.; Xu, Y. Economic analysis of large-scale farm biogas power generation system considering environmental benefits based on LCA: A case study in China. J. Clean. Prod. 2020, 258, 120985. [Google Scholar] [CrossRef]
Figure 1. System boundary diagram for six biogas operation modes.
Processes 11 03005 g001
Figure 2. Comparison of scenarios in different environmental impact indicators: (a) GWP, (b) PED, (c) ADP, (d) WU, (e) AP, (f) EP, (g) RI, (h) ODP, and (i) POFP.
Processes 11 03005 g002
Figure 3. Contribution of different raw materials and energy consumption to environmental indicators.
Processes 11 03005 g003aProcesses 11 03005 g003b
Figure 4. Normalized and ECER indicators for the six scenarios.
Processes 11 03005 g004
Figure 5. Running costs of scenarios.
Processes 11 03005 g005
Figure 6. NPV and payback period for each scenario.
Processes 11 03005 g006
Figure 7. The typological distinction of the six scenarios.
Processes 11 03005 g007
Figure 8. Combined costs and benefits of scenarios and benefit–cost ratios.
Processes 11 03005 g008
Figure 9. Environmental–economic NPV and payback years.
Processes 11 03005 g009
Table 1. Major life cycle inventories of biogas and digestate utilization models.
ItemRaw MaterialUnitS1S2S3S4S5S6
InputAnimal wastekg100010001000100010001000
ElectricitykWh5.846.228.028.3618.3319.62
Dieselkg2.261.572.261.572.261.57
Waterkg479.51479.51481.11481.11489.9489.9
Stainless steelg----0.020.02
Lubeg--0.390.391.931.93
Sodium hydroxideg140.02140.02140.02140.02123.25123.25
Iron oxideg----105.01105.01
Activated carbong----2.632.63
OutputElectricitykWh--101.90101.90--
BiogasMJ1549.291549.29----
Natural gasNm3----46.5946.59
EmissionCO2kg108.09142.85119.21143.55135.51223.47
CH4kg0.110.570.310.310.311.11
NOxg10.4427.947.9739.9271.8971.17
N2Og0.151.331.770.971.451.61
SO2g14.9945.433.081.451.502.36
VOCg9.3312.0611.4411.9359.47139.62
COg15.52114.0316.9924.1840.5848.17
CO2kg108.09142.8515.6831.66143.55223.47
CODkg0.110.570.310.310.630.71
Table 2. Environmental impact monetization parameters.
Environmental ImpactUnitReference Value
GWPCNY/kg CO2 eq0.152
APCNY/kg SO2 eq3.67
EPCNY/kg PO43− eq1.75
RICNY/kg PM 2.5 eq193
Disclaimer/Publisher’s Note: The statements, opinions and data contained in all publications are solely those of the individual author(s) and contributor(s) and not of MDPI and/or the editor(s). MDPI and/or the editor(s) disclaim responsibility for any injury to people or property resulting from any ideas, methods, instructions or products referred to in the content.

